Embed Size (px)
Citation preview
LOUISIANA DEPARTMENT OF
WILDLIFE & FISHERIES
OFFICE OF FISHERIES
INLAND FISHERIES DIVISION
PART VI -B
WATERBODY MANAGEMENT PLAN SERIES
Larto-Saline Complex
WATERBODY EVALUATION &
RECOMMENDATIONS

2
CHRONOLOGY
March 18, 2010 - Prepared by
Richard D Moses, Biologist Manager, District 3
Richard McGuffee, Biologist Supervisor, District 3
December 1, 2014 – Updated by
Richard Moses, Biologist Manager, District 3
Shelby Richard, Biologist II, District 3
March 2018 – Revised by
Richard McGuffee, Biologist Manager, District 3
Shelby Richard, Biologist Supervisor, District 3
The remainder of the page intentionally left blank.
3
TABLE OF CONTENTS
WATERBODY EVALUATION ................................................................................................................................. 4
STRATEGY STATEMENT ................................................................................................................................... 4 Recreational........................................................................................................................................................... 4 Commercial ........................................................................................................................................................... 4 Species of Special Concern .................................................................................................................................... 4
EXISTING HARVEST REGULATIONS ............................................................................................................. 4 Recreational........................................................................................................................................................... 4 Commercial ........................................................................................................................................................... 4
SPECIES EVALUATION ....................................................................................................................................... 4 Recreational........................................................................................................................................................... 4 Commercial ......................................................................................................................................................... 16 Creel Survey ........................................................................................................................................................ 17
HABITAT EVALUATION ................................................................................................................................... 20 Substrate .............................................................................................................................................................. 21 Artificial Structure ............................................................................................................................................... 21
CONDITION IMBALANCE / PROBLEM ......................................................................................................... 21 CORRECTIVE ACTION NEEDED .................................................................................................................... 21
RECOMMENDATIONS .......................................................................................................................................... 22
APPENDIX I .............................................................................................................................................................. 23
APPENDIX II ............................................................................................................................................................ 24
4
WATERBODY EVALUATION
STRATEGY STATEMENT
Recreational
Sportfish species, primarily largemouth bass (LMB) and crappie, are managed to provide a
sustainable population while providing anglers the opportunity to catch or harvest adequate
numbers of fish to maintain angler interest and efforts.
Commercial
Commercial fishing is minimal in the Larto-Saline Complex. Water control measures over the
past 40 years have altered water flow patterns and fisheries habitat in such a manner that the
Larto-Saline Complex does not support high numbers of commercial species. A strategy
directed specifically to the commercial fishery is not applied.
Species of Special Concern
No threatened or endangered fish species are known to inhabit this waterbody.
EXISTING HARVEST REGULATIONS
Recreational
This water body is managed under statewide regulations for all fish species. The Louisiana
Department of Wildlife and Fisheries recreational fishing regulations may be viewed at the
link below:
http://www.wlf.louisiana.gov/regulations
Commercial
The LDWF commercial fishing regulations may be viewed at the link below:
http://www.wlf.louisiana.gov/regulations
SPECIES EVALUATION
Recreational
Largemouth Bass
Largemouth bass populations are targeted for assessment because they are a species indicative
of the overall health of the fish population due to their high position in the food chain.
Electrofishing is the most efficient sampling method for collecting largemouth bass to evaluate
abundance and size distribution.
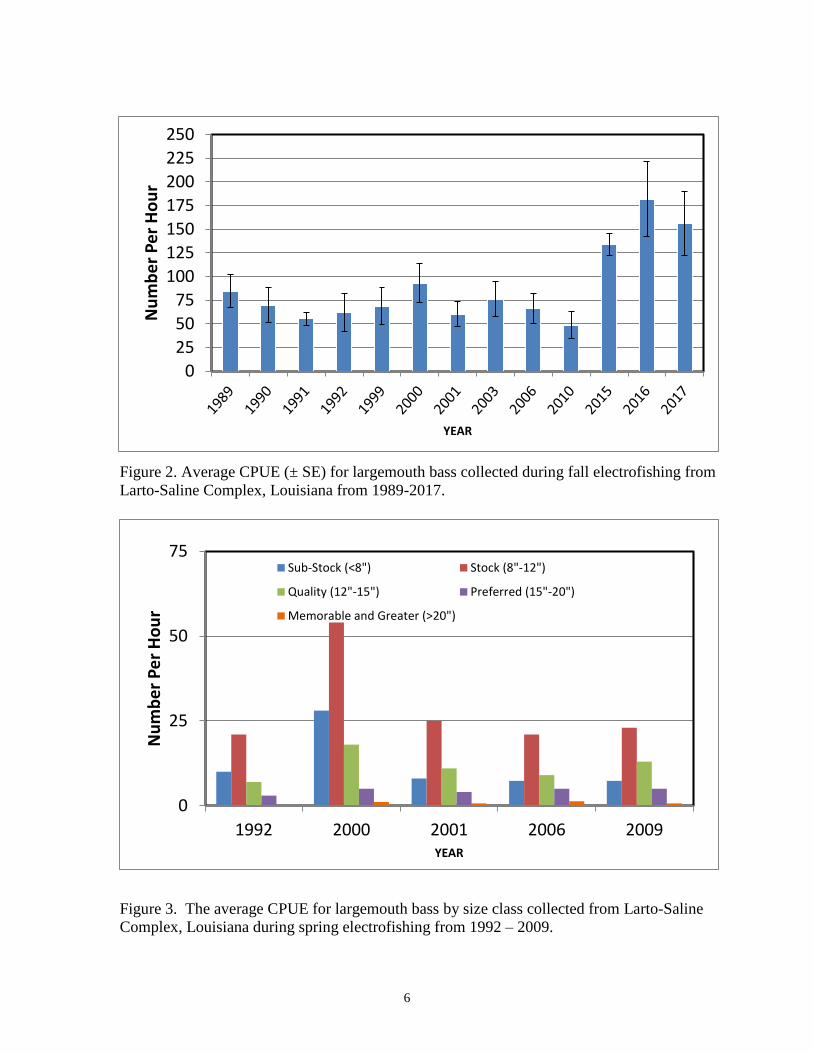
Relative abundance and size structure indices
Electrofishing has been used to collect largemouth bass population data in the Larto-Saline
Complex since the fall of 1989. Catch-per-unit-effort (CPUE) from spring and fall
5
0
25
50
75
100
125
1992 2000 2001 2006 2009
Nu
mb
er
Pe
r H
ou
r
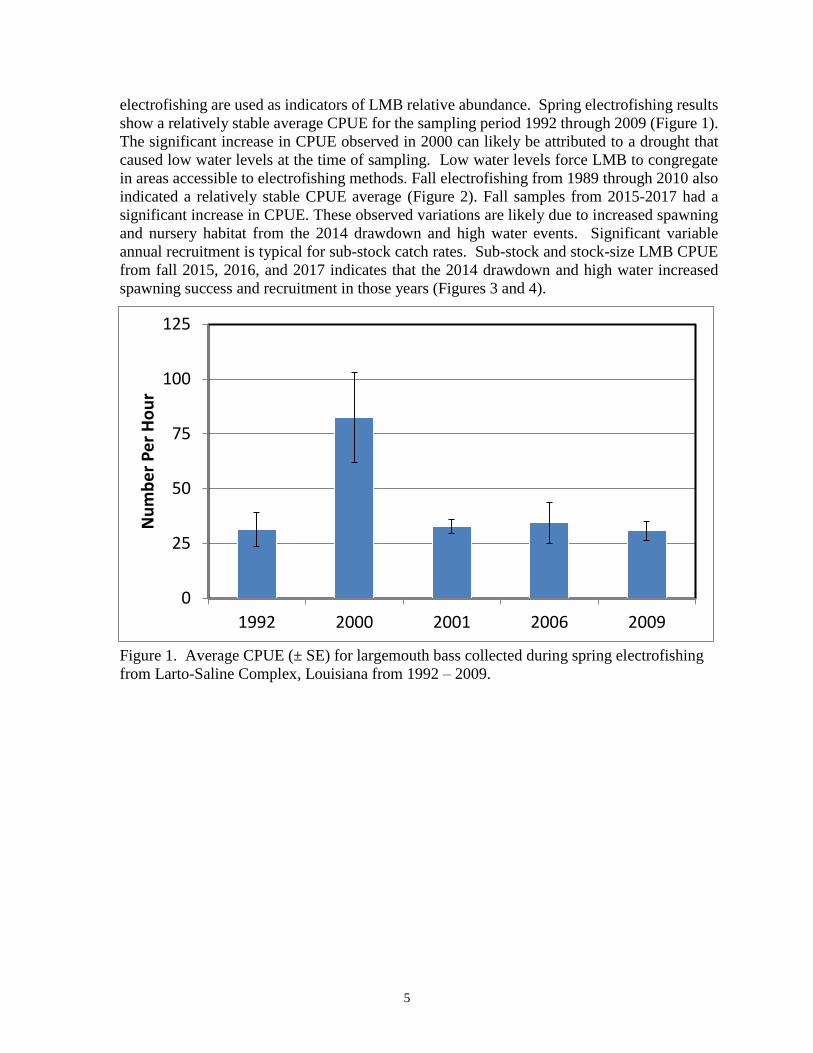
electrofishing are used as indicators of LMB relative abundance. Spring electrofishing results
show a relatively stable average CPUE for the sampling period 1992 through 2009 (Figure 1).
The significant increase in CPUE observed in 2000 can likely be attributed to a drought that
caused low water levels at the time of sampling. Low water levels force LMB to congregate
in areas accessible to electrofishing methods. Fall electrofishing from 1989 through 2010 also
indicated a relatively stable CPUE average (Figure 2). Fall samples from 2015-2017 had a
significant increase in CPUE. These observed variations are likely due to increased spawning
and nursery habitat from the 2014 drawdown and high water events. Significant variable
annual recruitment is typical for sub-stock catch rates. Sub-stock and stock-size LMB CPUE
from fall 2015, 2016, and 2017 indicates that the 2014 drawdown and high water increased
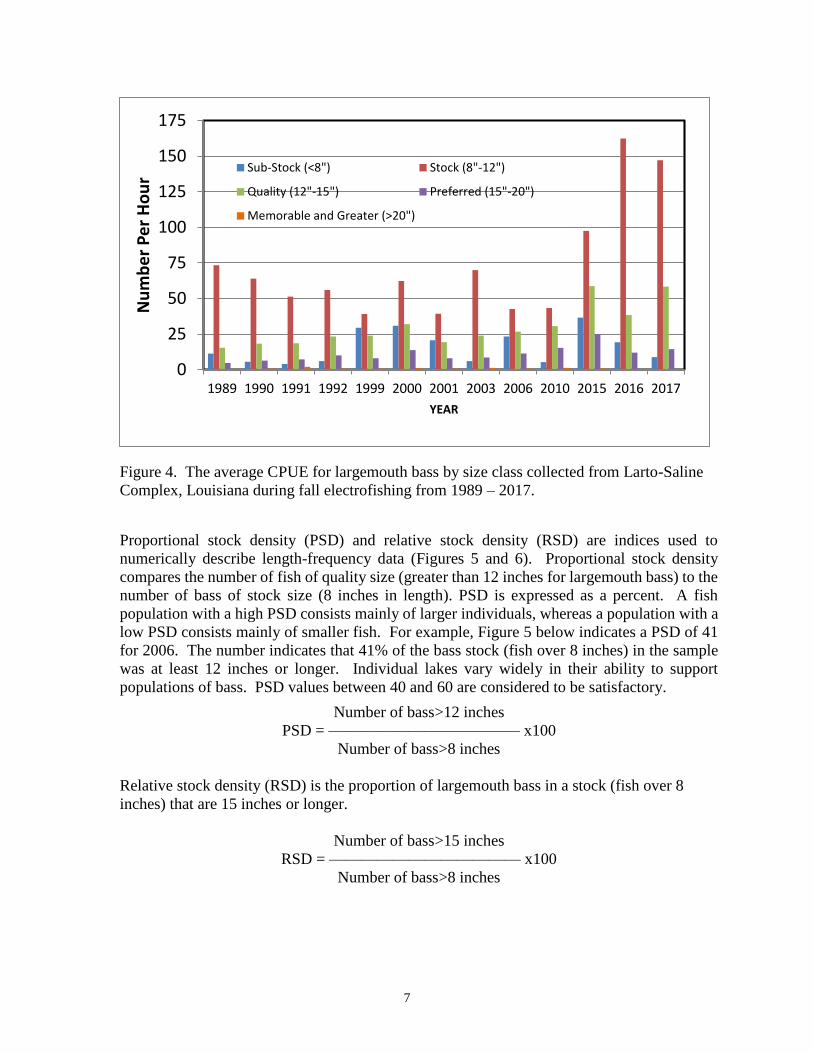
spawning success and recruitment in those years (Figures 3 and 4).
Figure 1. Average CPUE (± SE) for largemouth bass collected during spring electrofishing
from Larto-Saline Complex, Louisiana from 1992 – 2009.
6
0
25
50
75
100
125
150
175
200
225
250N
um
be
r P
er
Ho
ur
YEAR
Figure 2. Average CPUE (± SE) for largemouth bass collected during fall electrofishing from
Larto-Saline Complex, Louisiana from 1989-2017.
Figure 3. The average CPUE for largemouth bass by size class collected from Larto-Saline
Complex, Louisiana during spring electrofishing from 1992 – 2009.
0
25
50
75
1992 2000 2001 2006 2009
Nu
mb
er
Pe
r H
ou
r
YEAR
Sub-Stock (<8") Stock (8"-12")
Quality (12"-15") Preferred (15"-20")
Memorable and Greater (>20")
7
Figure 4. The average CPUE for largemouth bass by size class collected from Larto-Saline
Complex, Louisiana during fall electrofishing from 1989 – 2017.
Proportional stock density (PSD) and relative stock density (RSD) are indices used to
numerically describe length-frequency data (Figures 5 and 6). Proportional stock density
compares the number of fish of quality size (greater than 12 inches for largemouth bass) to the
number of bass of stock size (8 inches in length). PSD is expressed as a percent. A fish
population with a high PSD consists mainly of larger individuals, whereas a population with a
low PSD consists mainly of smaller fish. For example, Figure 5 below indicates a PSD of 41
for 2006. The number indicates that 41% of the bass stock (fish over 8 inches) in the sample
was at least 12 inches or longer. Individual lakes vary widely in their ability to support
populations of bass. PSD values between 40 and 60 are considered to be satisfactory.
Number of bass>12 inches
PSD = ———————————— x100
Number of bass>8 inches
Relative stock density (RSD) is the proportion of largemouth bass in a stock (fish over 8
inches) that are 15 inches or longer.
Number of bass>15 inches
RSD = ———————————— x100
Number of bass>8 inches
0
25
50
75
100
125
150
175
1989 1990 1991 1992 1999 2000 2001 2003 2006 2010 2015 2016 2017
Nu
mb
er
Pe
r H
ou
r
YEAR
Sub-Stock (<8") Stock (8"-12")
Quality (12"-15") Preferred (15"-20")
Memorable and Greater (>20")
8
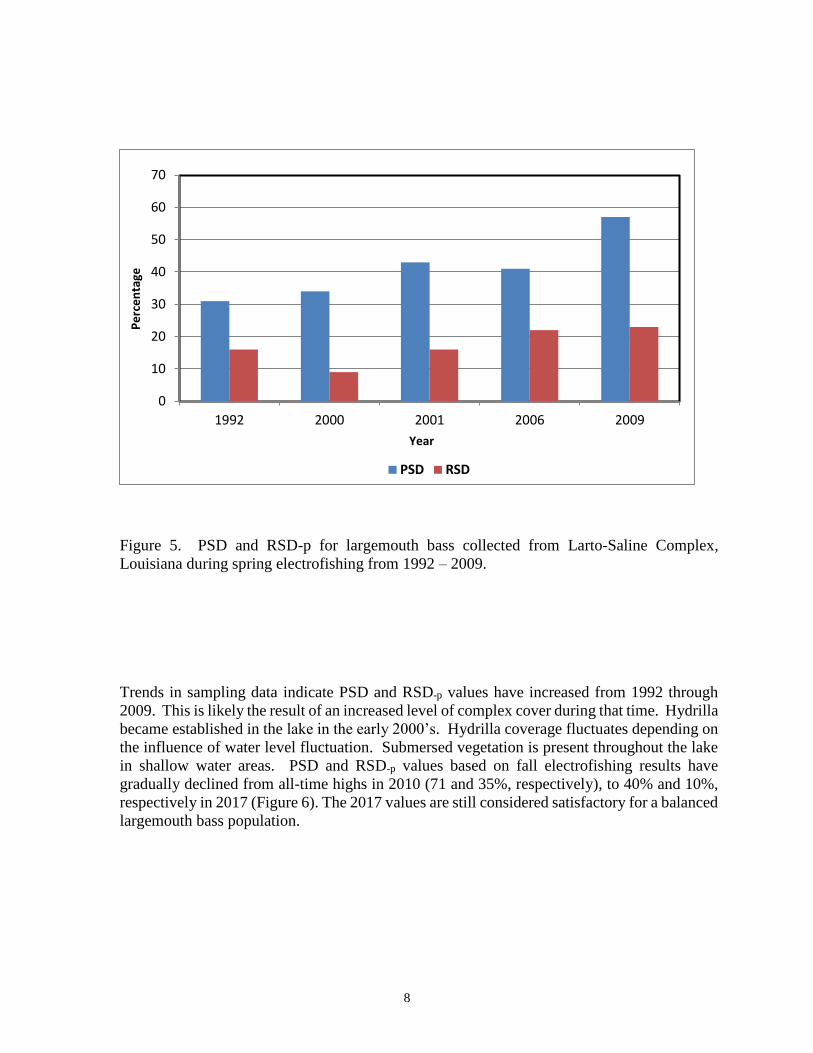
Figure 5. PSD and RSD-p for largemouth bass collected from Larto-Saline Complex,
Louisiana during spring electrofishing from 1992 – 2009.
Trends in sampling data indicate PSD and RSD-p values have increased from 1992 through
2009. This is likely the result of an increased level of complex cover during that time. Hydrilla
became established in the lake in the early 2000’s. Hydrilla coverage fluctuates depending on
the influence of water level fluctuation. Submersed vegetation is present throughout the lake
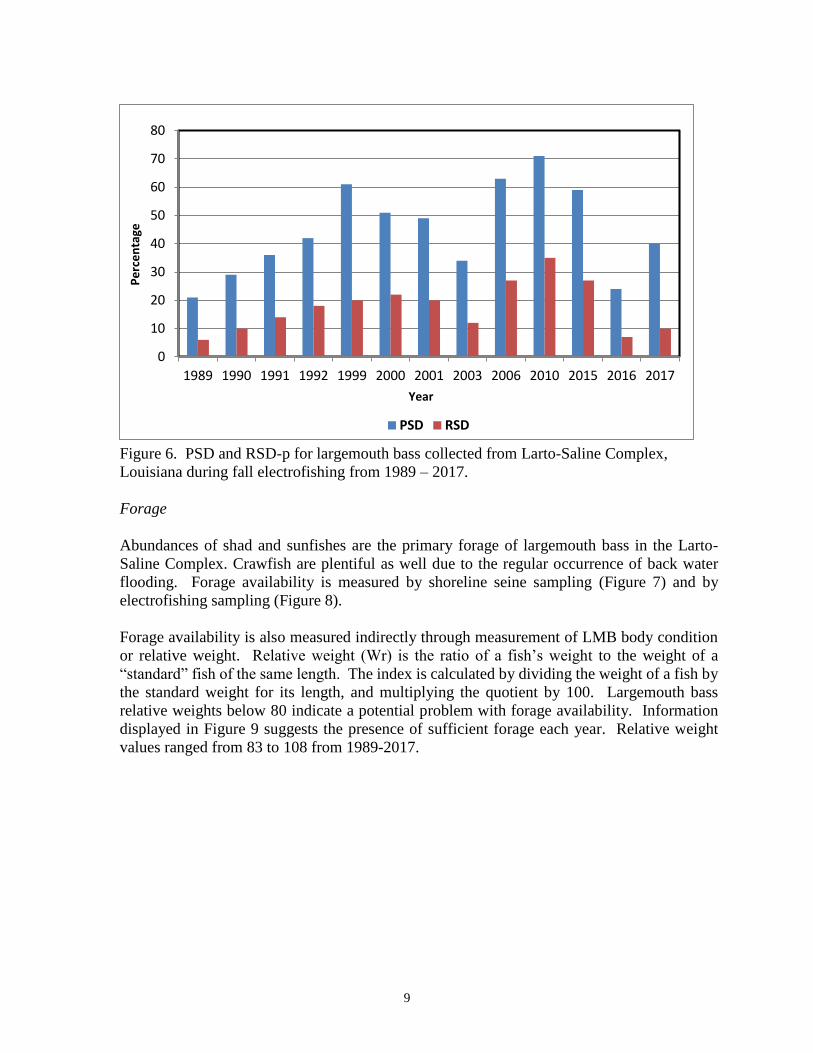
in shallow water areas. PSD and RSD-p values based on fall electrofishing results have
gradually declined from all-time highs in 2010 (71 and 35%, respectively), to 40% and 10%,
respectively in 2017 (Figure 6). The 2017 values are still considered satisfactory for a balanced
largemouth bass population.
0
10
20
30
40
50
60
70
1992 2000 2001 2006 2009
Pe
rce
nta
ge
Year
PSD RSD
9
Figure 6. PSD and RSD-p for largemouth bass collected from Larto-Saline Complex,
Louisiana during fall electrofishing from 1989 – 2017.
Forage
Abundances of shad and sunfishes are the primary forage of largemouth bass in the Larto-
Saline Complex. Crawfish are plentiful as well due to the regular occurrence of back water
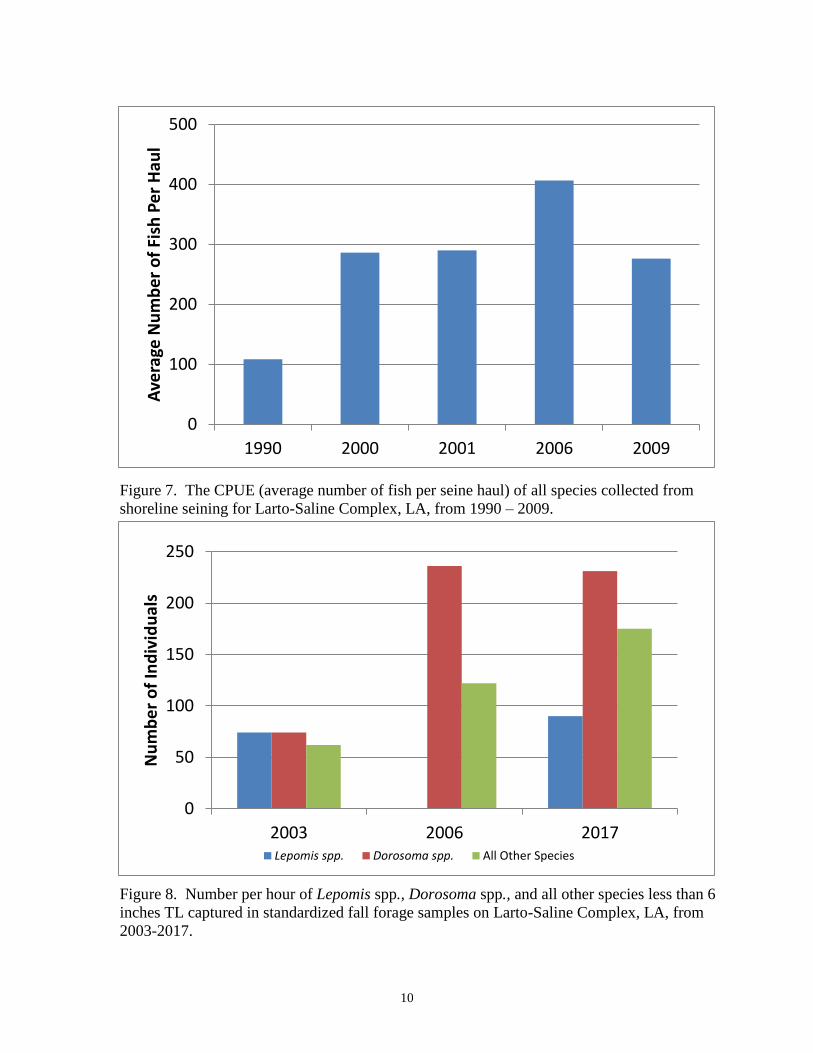
flooding. Forage availability is measured by shoreline seine sampling (Figure 7) and by
electrofishing sampling (Figure 8).
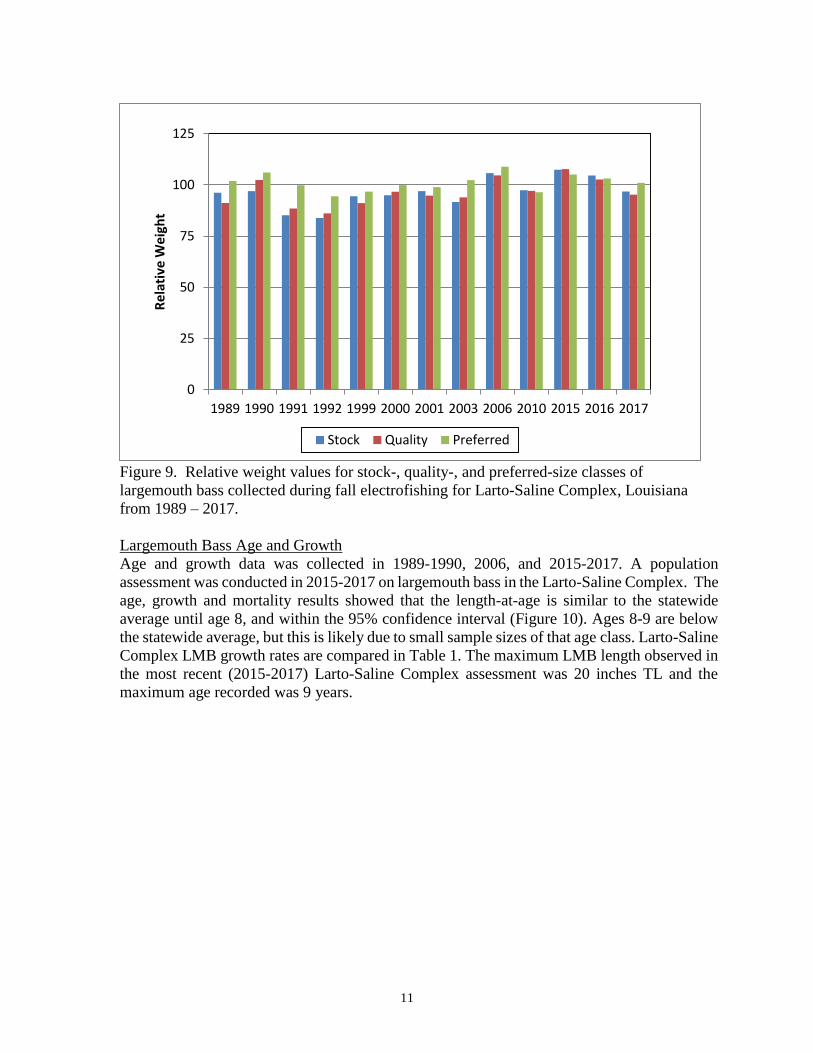
Forage availability is also measured indirectly through measurement of LMB body condition
or relative weight. Relative weight (Wr) is the ratio of a fish’s weight to the weight of a
“standard” fish of the same length. The index is calculated by dividing the weight of a fish by
the standard weight for its length, and multiplying the quotient by 100. Largemouth bass
relative weights below 80 indicate a potential problem with forage availability. Information
displayed in Figure 9 suggests the presence of sufficient forage each year. Relative weight
values ranged from 83 to 108 from 1989-2017.
0
10
20
30
40
50
60
70
80
1989 1990 1991 1992 1999 2000 2001 2003 2006 2010 2015 2016 2017
Pe
rce
nta
ge
Year
PSD RSD
10
Figure 7. The CPUE (average number of fish per seine haul) of all species collected from
shoreline seining for Larto-Saline Complex, LA, from 1990 – 2009.
Figure 8. Number per hour of Lepomis spp., Dorosoma spp., and all other species less than 6
inches TL captured in standardized fall forage samples on Larto-Saline Complex, LA, from
2003-2017.
0
100
200
300
400
500
1990 2000 2001 2006 2009
Ave
rage
Nu
mb
er
of
Fish
Pe
r H
aul
0
50
100
150
200
250
2003 2006 2017
Nu
mb
er
of
Ind
ivid
ual
s
Lepomis spp. Dorosoma spp. All Other Species
11
Figure 9. Relative weight values for stock-, quality-, and preferred-size classes of
largemouth bass collected during fall electrofishing for Larto-Saline Complex, Louisiana
from 1989 – 2017.
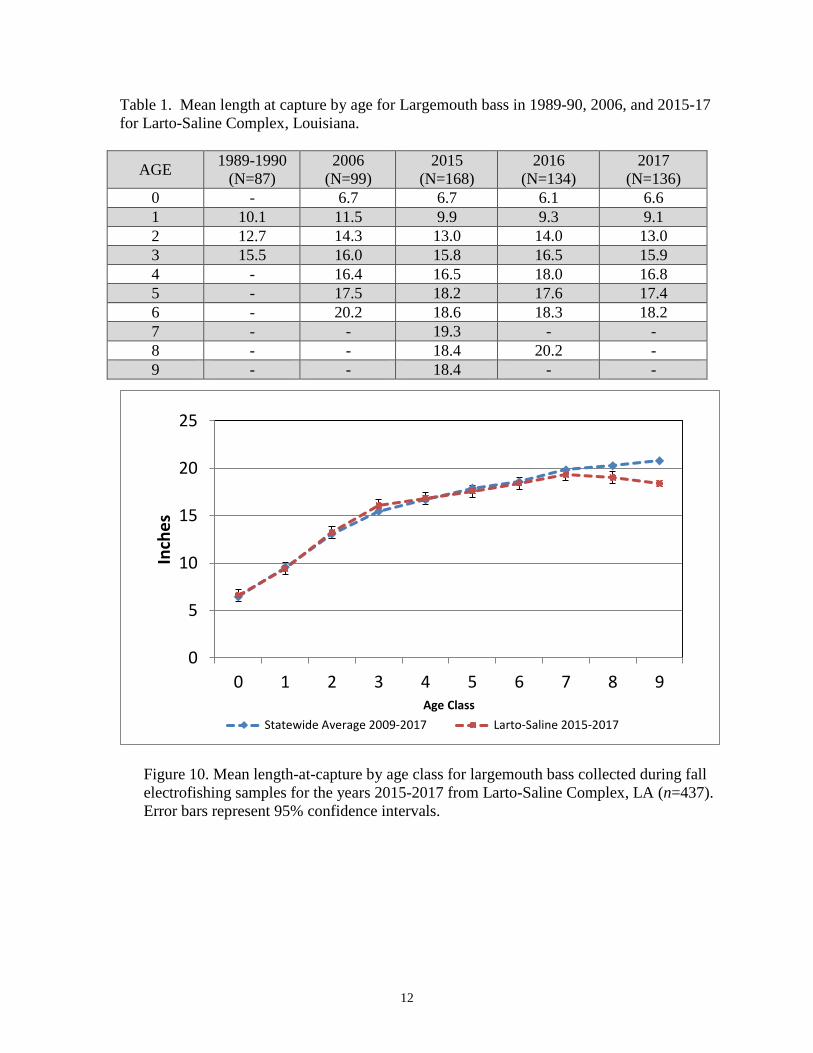
Largemouth Bass Age and Growth
Age and growth data was collected in 1989-1990, 2006, and 2015-2017. A population
assessment was conducted in 2015-2017 on largemouth bass in the Larto-Saline Complex. The
age, growth and mortality results showed that the length-at-age is similar to the statewide
average until age 8, and within the 95% confidence interval (Figure 10). Ages 8-9 are below
the statewide average, but this is likely due to small sample sizes of that age class. Larto-Saline
Complex LMB growth rates are compared in Table 1. The maximum LMB length observed in
the most recent (2015-2017) Larto-Saline Complex assessment was 20 inches TL and the
maximum age recorded was 9 years.
0
25
50
75
100
125
1989 1990 1991 1992 1999 2000 2001 2003 2006 2010 2015 2016 2017
Re
lati
ve W
eigh
t
Stock Quality Preferred
12
Table 1. Mean length at capture by age for Largemouth bass in 1989-90, 2006, and 2015-17
for Larto-Saline Complex, Louisiana.
AGE 1989-1990
(N=87)
2006
(N=99)
2015
(N=168)
2016
(N=134)
2017
(N=136)
0 - 6.7 6.7 6.1 6.6
1 10.1 11.5 9.9 9.3 9.1
2 12.7 14.3 13.0 14.0 13.0
3 15.5 16.0 15.8 16.5 15.9
4 - 16.4 16.5 18.0 16.8
5 - 17.5 18.2 17.6 17.4
6 - 20.2 18.6 18.3 18.2
7 - - 19.3 - -
8 - - 18.4 20.2 -
9 - - 18.4 - -
Figure 10. Mean length-at-capture by age class for largemouth bass collected during fall
electrofishing samples for the years 2015-2017 from Larto-Saline Complex, LA (n=437).
Error bars represent 95% confidence intervals.
0
5
10
15
20
25
0 1 2 3 4 5 6 7 8 9
Inch
es
Age Class
Statewide Average 2009-2017 Larto-Saline 2015-2017
13
Largemouth bass genetics
Electrophoretic (Isozyme) analysis of liver tissue was used to determine the percent of the
Florida largemouth bass (FLMB) genome present in the Larto-Saline complex. Florida
largemouth bass were not introduced into the Larto-Saline Complex by LDWF until 2015.
Prior to stocking, analysis showed that the Larto-Saline Complex LMB population did contain
a 12.1% Florida X northern hybrids in 2006. The introduction of FLMB likely occurred during
a high water event, since FLMB have been stocked into the Red River and other Louisiana
waterbodies. LDWF stocked approximately 250,339 FLMB into the complex from 2015-2017.
See Table 2 for a complete summary of genetic testing.
Table 2. Largemouth bass genetic testing results from Larto-Saline Complex, Louisiana.
Year % Northern % Florida % Hybrid % Florida Influence
2006 87.9 (n=87) 0 12.1 (n=12) 12.1
2015 100 (n=170) 0 0 0
2016 99.3 (n=143) 0.7 (n=1) 0 0.7
2017 91.1 (n=124) 1.5 (n=2) 7.4 (n=10) 8.9
Crappie
Crappie fishing in the Larto-Saline Complex is considered to be outstanding. Both black
crappie (Pomoxis nigromaculatus) and white crappie (P. annularis) occur in the complex. The
dynamic nature of crappie populations includes considerable variance over time. Levels of
angler satisfaction are typically proportional to crappie population trends and therefore, also
tend to be cyclic.
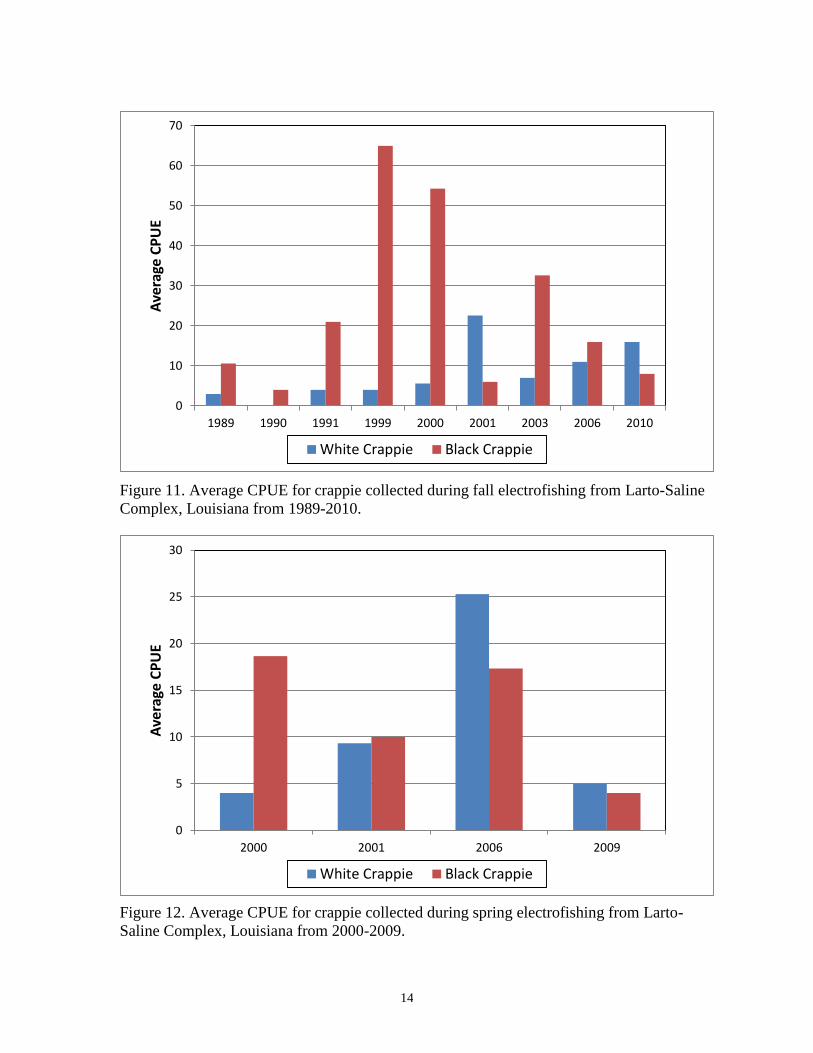
Crappie were sampled with electrofishing gear from 1999-2010. The sample catch rate was
variable, ranging between 0 and 65 fish per hour average (Figure 11 and 12). The technique
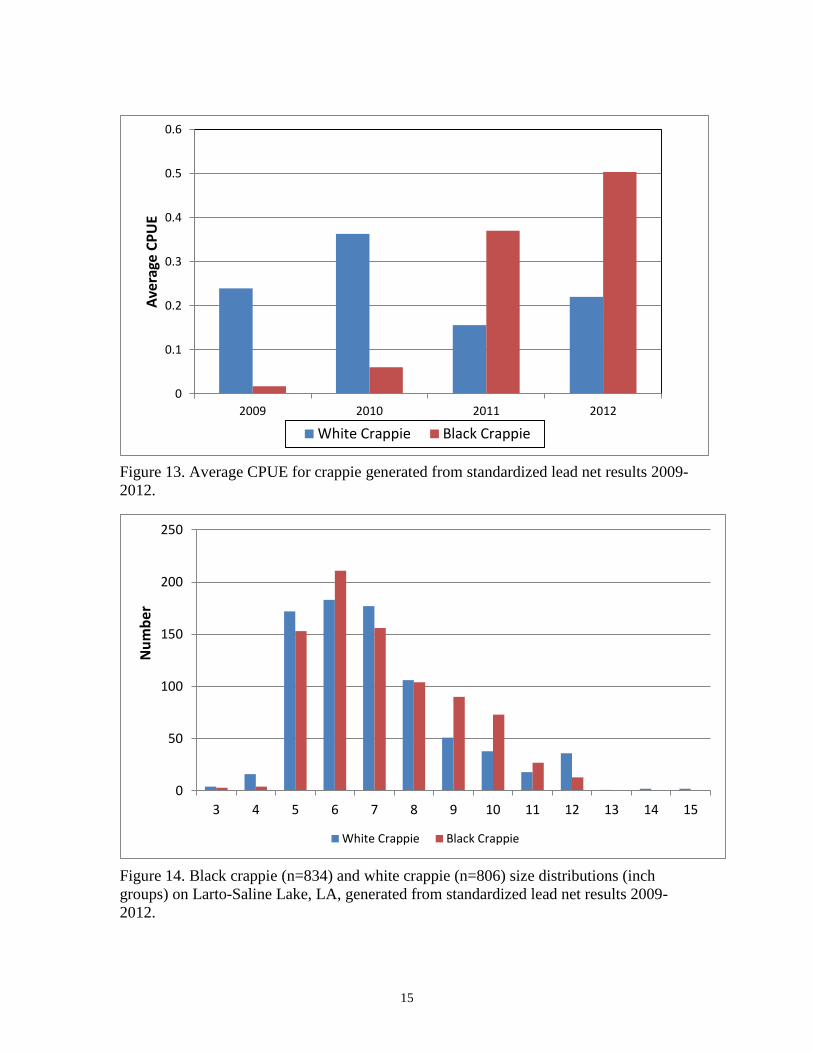
of sampling crappie with lead nets has become a standardized sampling method for LDWF.
Lead nets were effectively used to sample the crappie population from 2009 – 2012 (Figure
13). These results show an equal abundance and size distribution in population between both
species of crappie (Table 3 and Figure 14).
A crappie population assessment study was conducted from 2010 – 2012. Analysis indicates
that crappie in the Larto-Saline Complex had the second lowest growth rate when compared
to eight other lakes that were sampled during this same time period, and reached a preferred-
size class (10-inch TL) in 2.95 years on average (Appendix PROJECT, Table 3). Because the
majority of the fish sampled for age and growth were captured by lead nets, age 0+ crappies
are represented minimally due to this gear’s size selectivity. Crappie growth rate results can be
found in Table 4.
14
Figure 11. Average CPUE for crappie collected during fall electrofishing from Larto-Saline
Complex, Louisiana from 1989-2010.
Figure 12. Average CPUE for crappie collected during spring electrofishing from Larto-
Saline Complex, Louisiana from 2000-2009.
0
10
20
30
40
50
60
70
1989 1990 1991 1999 2000 2001 2003 2006 2010
Ave
rage
CP
UE
White Crappie Black Crappie
0
5
10
15
20
25
30
2000 2001 2006 2009
Ave
rage
CP
UE
White Crappie Black Crappie
15
Figure 13. Average CPUE for crappie generated from standardized lead net results 2009-
2012.
Figure 14. Black crappie (n=834) and white crappie (n=806) size distributions (inch
groups) on Larto-Saline Lake, LA, generated from standardized lead net results 2009-
2012.
0
50
100
150
200
250
3 4 5 6 7 8 9 10 11 12 13 14 15
Nu
mb
er
White Crappie Black Crappie
0
0.1
0.2
0.3
0.4
0.5
0.6
2009 2010 2011 2012
Ave
rage
CP
UE
White Crappie Black Crappie
16
Table 3. The contribution of black and white crappies to total crappie catch by year for
Larto-Saline Complex, LA, fall lead net surveys 2009-2012.
Year Black Crappie White Crappie Total
2009 5 (7%) 69 (93%) 74
2010 61 (14%) 366 (86%) 427
2011 320 (70%) 135 (30%) 455
2012 448 (65%) 236 (35%) 684
Total 834 (51%) 806 (49%) 1640
Table 4. Length at capture by age by species of crappie captured in 2011-2012 for Larto-
Saline Complex, Louisiana.
Age
2011
Black
Crappie
(N=48)
2012
Black
Crappie
(N=104)
2011
White
Crappie
(N=57)
2012 White
Crappie
(N=107)
0 - - - -
1 8.7 6.9 6.7 7.1
2 8.0 8.9 10.4 10.7
3 9.5 10.2 11.4 12.3
4 10.4 11.4 - 12.8
5 - - 13.0 -
6 - - 12.8 -
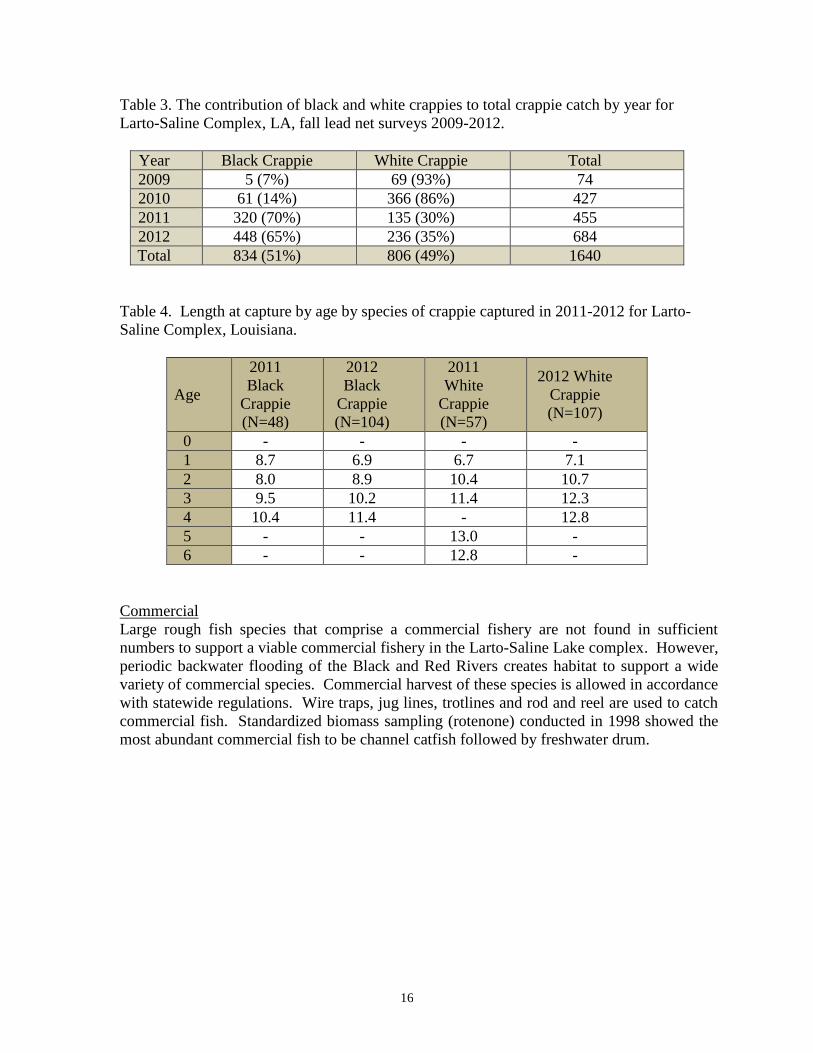
Commercial
Large rough fish species that comprise a commercial fishery are not found in sufficient
numbers to support a viable commercial fishery in the Larto-Saline Lake complex. However,
periodic backwater flooding of the Black and Red Rivers creates habitat to support a wide
variety of commercial species. Commercial harvest of these species is allowed in accordance
with statewide regulations. Wire traps, jug lines, trotlines and rod and reel are used to catch
commercial fish. Standardized biomass sampling (rotenone) conducted in 1998 showed the
most abundant commercial fish to be channel catfish followed by freshwater drum.
17
Figure 15. Biomass sampling results for commercial species for Larto-Saline Complex,
Louisiana in 1998.
Creel Survey
Angler creel surveys were conducted on Larto-Saline Complex in 2000, 2001, and 2015 to
gather data on recreational fishing efforts and harvest.
Largemouth bass anglers
Creel results show that 505 LMB anglers were interviewed. Catch rates improved from 1.66
(2000) LMB caught per angler trip to 3.45 (2015) LMB caught per angler trip. The retention
rates were between 48.87% and 68.1% (Table 5). Harvested sub-stock-sized LMB decreased
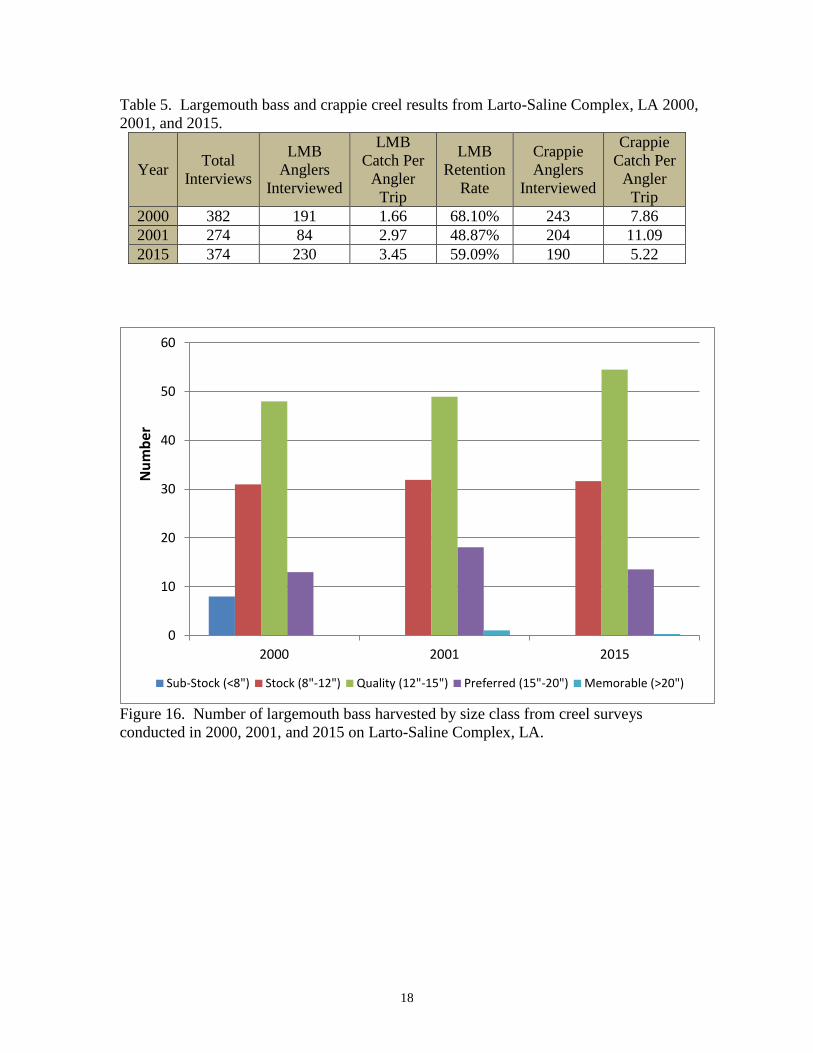
from 2000 to 2015, while quality-sized LMB increased in 2015 (Figure 16). The most
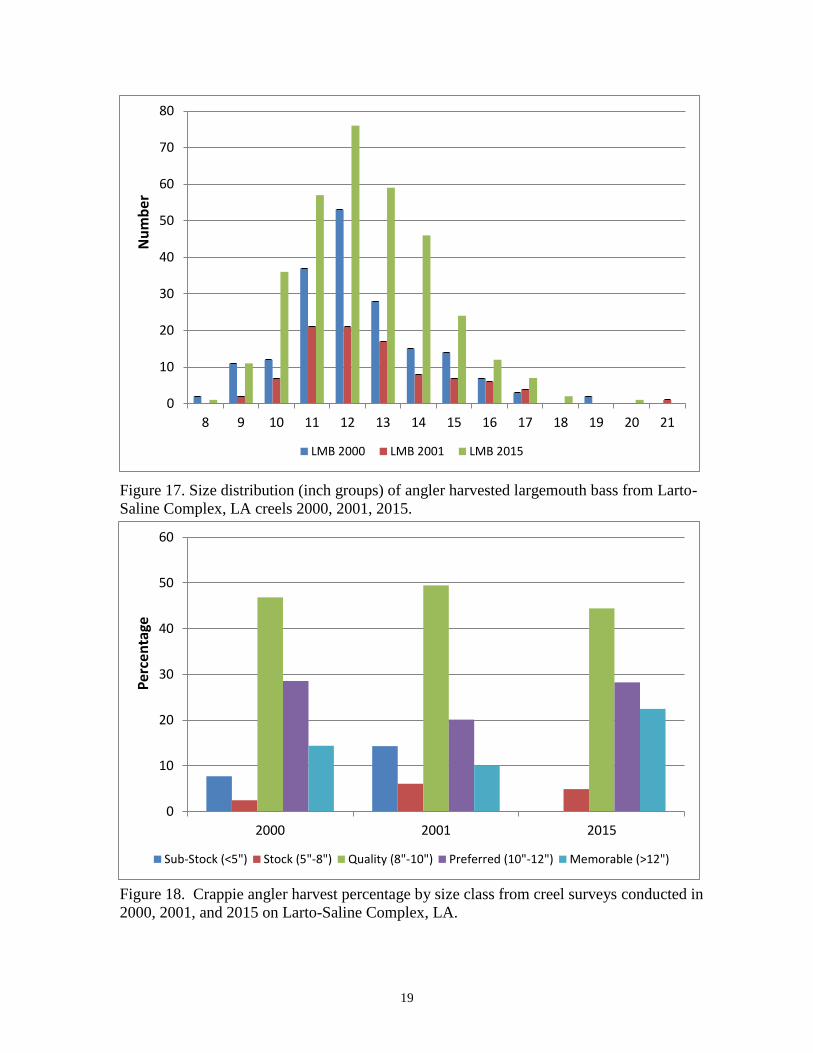
frequently harvested size groups were 11-13 inches TL (Figure 17).
Crappie anglers
Crappie creel results show that 637 crappie anglers were interviewed. Crappie catch per angler
trip decreased in 2015 (Table 5). This decreased catch per angler can be attributed to high water
events that allowed crappie to move into heavily woody and vegetated areas that anglers could
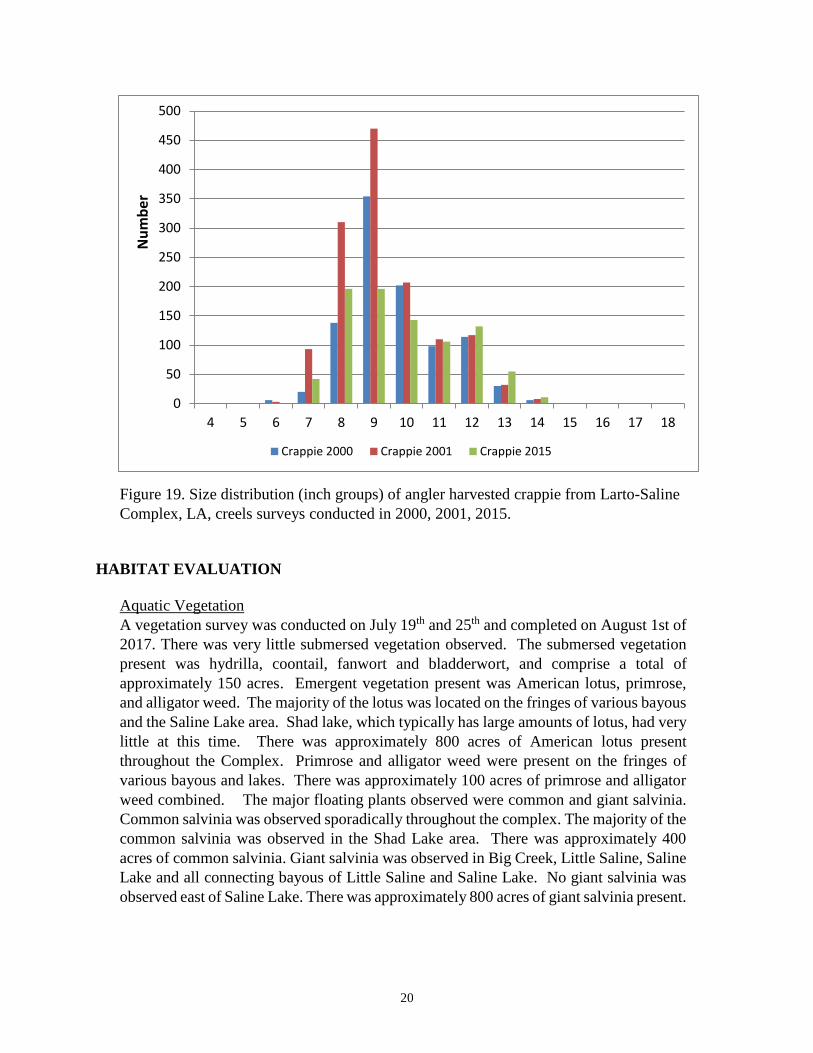
not reach. Harvested crappie size class results indicate a normal distribution with an increase
in harvested memorable size crappie in 2015 (Figure 18). Angler harvested inch groups ranged
from 8-10 inches TL (Figure 19).
0
20
40
60
80
100
120
1998
Po
un
ds
per
Acr
eFresh water drum
Big mouth Buffalo
Small mouth Buffalo
Flathead Catfish
Channel Catfish
Blue Catfish
18
Table 5. Largemouth bass and crappie creel results from Larto-Saline Complex, LA 2000,
2001, and 2015.
Year Total
Interviews
LMB
Anglers
Interviewed
LMB
Catch Per
Angler
Trip
LMB
Retention
Rate
Crappie
Anglers
Interviewed
Crappie
Catch Per
Angler
Trip
2000 382 191 1.66 68.10% 243 7.86
2001 274 84 2.97 48.87% 204 11.09
2015 374 230 3.45 59.09% 190 5.22
Figure 16. Number of largemouth bass harvested by size class from creel surveys
conducted in 2000, 2001, and 2015 on Larto-Saline Complex, LA.
0
10
20
30
40
50
60
2000 2001 2015
Nu
mb
er
Sub-Stock (<8") Stock (8"-12") Quality (12"-15") Preferred (15"-20") Memorable (>20")
19
Figure 17. Size distribution (inch groups) of angler harvested largemouth bass from Larto-
Saline Complex, LA creels 2000, 2001, 2015.
Figure 18. Crappie angler harvest percentage by size class from creel surveys conducted in
2000, 2001, and 2015 on Larto-Saline Complex, LA.
0
10
20
30
40
50
60
70
80
8 9 10 11 12 13 14 15 16 17 18 19 20 21
Nu
mb
er
LMB 2000 LMB 2001 LMB 2015
0
10
20
30
40
50
60
2000 2001 2015
Per
cen
tage
Sub-Stock (<5") Stock (5"-8") Quality (8"-10") Preferred (10"-12") Memorable (>12")
20
Figure 19. Size distribution (inch groups) of angler harvested crappie from Larto-Saline
Complex, LA, creels surveys conducted in 2000, 2001, 2015.
HABITAT EVALUATION
Aquatic Vegetation
A vegetation survey was conducted on July 19th and 25th and completed on August 1st of
2017. There was very little submersed vegetation observed. The submersed vegetation
present was hydrilla, coontail, fanwort and bladderwort, and comprise a total of
approximately 150 acres. Emergent vegetation present was American lotus, primrose,
and alligator weed. The majority of the lotus was located on the fringes of various bayous
and the Saline Lake area. Shad lake, which typically has large amounts of lotus, had very
little at this time. There was approximately 800 acres of American lotus present
throughout the Complex. Primrose and alligator weed were present on the fringes of
various bayous and lakes. There was approximately 100 acres of primrose and alligator
weed combined. The major floating plants observed were common and giant salvinia.
Common salvinia was observed sporadically throughout the complex. The majority of the
common salvinia was observed in the Shad Lake area. There was approximately 400
acres of common salvinia. Giant salvinia was observed in Big Creek, Little Saline, Saline
Lake and all connecting bayous of Little Saline and Saline Lake. No giant salvinia was
observed east of Saline Lake. There was approximately 800 acres of giant salvinia present.
0
50
100
150
200
250
300
350
400
450
500
4 5 6 7 8 9 10 11 12 13 14 15 16 17 18
Nu
mb
er
Crappie 2000 Crappie 2001 Crappie 2015
21
The 2018 estimates of aquatic vegetation are expected to remain similar to 2017, with the
exception of giant salvinia. If the lake receives a high water event, giant salvinia will
most likely spread throughout the complex. Even without a high water event, giant
salvinia will continue to expand into the adjacent bayous and lakes due to current, wind,
and boat traffic.
Substrate
The frequent water level fluctuation that occurs in the Larto-Saline Complex promotes
increased decomposition of organic substrate composition. The process improves the
suitability of the substrate for nesting sport fish species. The majority of the shoreline area is
wooded. This creates good buffer zones and helps reduce sedimentation. Areas in close
proximity to Red River backwater inflow have an accumulation of silt.
Artificial Structure
The physical characteristics of the Larto-Saline Complex include an abundance of complex
cover including aquatic vegetation, standing trees, stumps, logs, and button bush. No
additional complex cover is necessary.
CONDITION IMBALANCE / PROBLEM
Since construction of the Catahoula Lake Diversion Canal in 1972, there have been numerous
failures of the spoil bank. Related consequences have included an uncontrolled hydrological
connection between the Larto-Saline Complex and the diversion canal. Despite the recent
replacement of the problematic Cross Bayou Weir, the potential for spoil bank failures at other
locations will remain.
CORRECTIVE ACTION NEEDED
Due to the introduction and establishment of giant salvinia into the complex, it will likely be
necessary to conduct more foliar spray activities, weevil stocking, and lake drawdowns in the
future.
There were several days of freezing temperatures and ice formation on the lake in the winter
of 2017-2018. The effectiveness of these events on reducing the amount of salvinia present
will need to be observed before deciding whether a drawdown needs to be conducted in 2018.
22
RECOMMENDATIONS
1. Continue LDWF standardized sampling to assess fisheries populations.
2. LDWF spray crews will continue treating emergent and floating vegetation as needed with
either glyphosate (0.75 gal/acre) or diquat (0.75 gal/acre) and an approved surfactant (0.25
gal/acre) in accordance with LDWF Aquatic Herbicide Application Procedures. A mixture
of diquat (0.25 gal/acre) and glyphosate (0.75 gal/acre) with Turbulence (or approved
equivalent, 0.25 gal/acre) surfactant may be applied to common and giant salvinia from
April 1 – October 31. Alligator weed will be controlled with imazapyr (0.5 gal/acre) in
undeveloped areas and with imazamox (0.5 gal/acre) near houses and developed shorelines.
Turbulence surfactant (0.25 gal/acre) will be used in conjunction with both of these
herbicides.
3. Continue aquatic vegetation surveys each summer to determine species composition and
area coverage.
4. Conduct 3’ drawdown if deemed necessary. If the decision is made that a drawdown is
necessary, it will be conducted under the following guidelines. The drawdown should be
initiated on the week of June 18, 2018. The target level for the 2018 drawdown will be 3’
below normal pool elevation. The timing and depth of the drawdown was selected to create
the longest drying period and still allow access to the lake for foliar spraying. The
drawdown gates will be closed no later than November 1, 2018. The LDWF staff will work
with DOTD personnel to operate the control gate to fluctuate the water level in an effort to
maintain the 3’ below pool drawdown level.
23
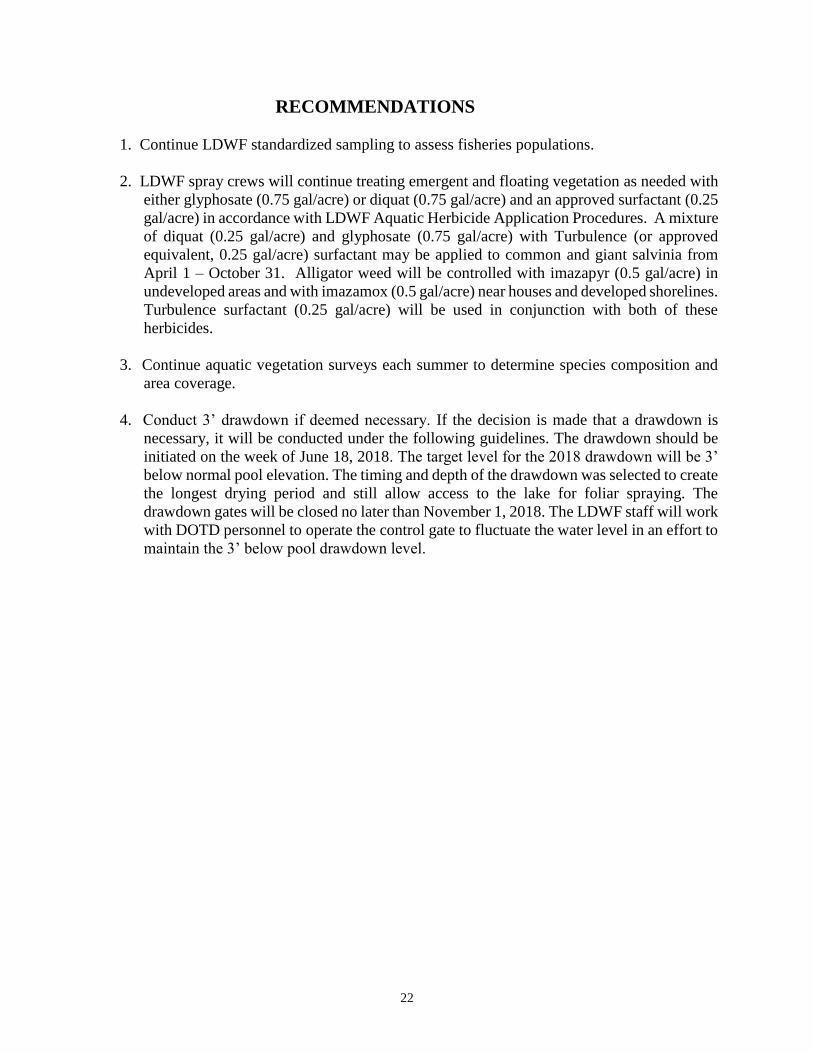
APPENDIX I Typemap Larto-Saline Lake vegetation survey conducted on July 24th and 25th of 2013.
24
APPENDIX II
LOUISIANA DEPARTMENT OF WILDLIFE & FISHERIES
OFFICE OF FISHERIES
INLAND FISHERIES AND
RESEARCH AND ASSESSMENT SECTIONS
Larto-Saline Lake Crappie:
Population Characteristics
Freshwater Report Series
Baton Rouge, Louisiana
2014
25
LOUISIANA CRAPPIE PROJECT
Larto-Saline Lake
Every fish population is the product of a unique set of influences, both natural and man-induced.
A thorough understanding of those influences and the corresponding population response is
essential to good fisheries management. As part of a statewide effort, the Louisiana Department
of Wildlife and Fisheries (LDWF) recently completed a study to describe the Larto-Saline Lake
black crappie and white crappie (crappie) populations. The project included data collection over
a four-year period from 2009 – 2012. Population dynamics including relative abundance,
spawning success, growth, body condition, mortality, and longevity were measured.
Leadnet fishing gear was used to collect crappie from Larto-Saline Lake each fall. Length and
weight measurements were recorded for each fish and ear bones (called otoliths) were removed
from approximately 28% of the sampled fish for age and growth analyses. Annual growth rings
on the otoliths provide an accurate measurement of fish age. Since both species of crappie are
managed under the same harvest regulations, size and age for all of the sample fish were
combined to generate estimates of average growth rate and longevity.
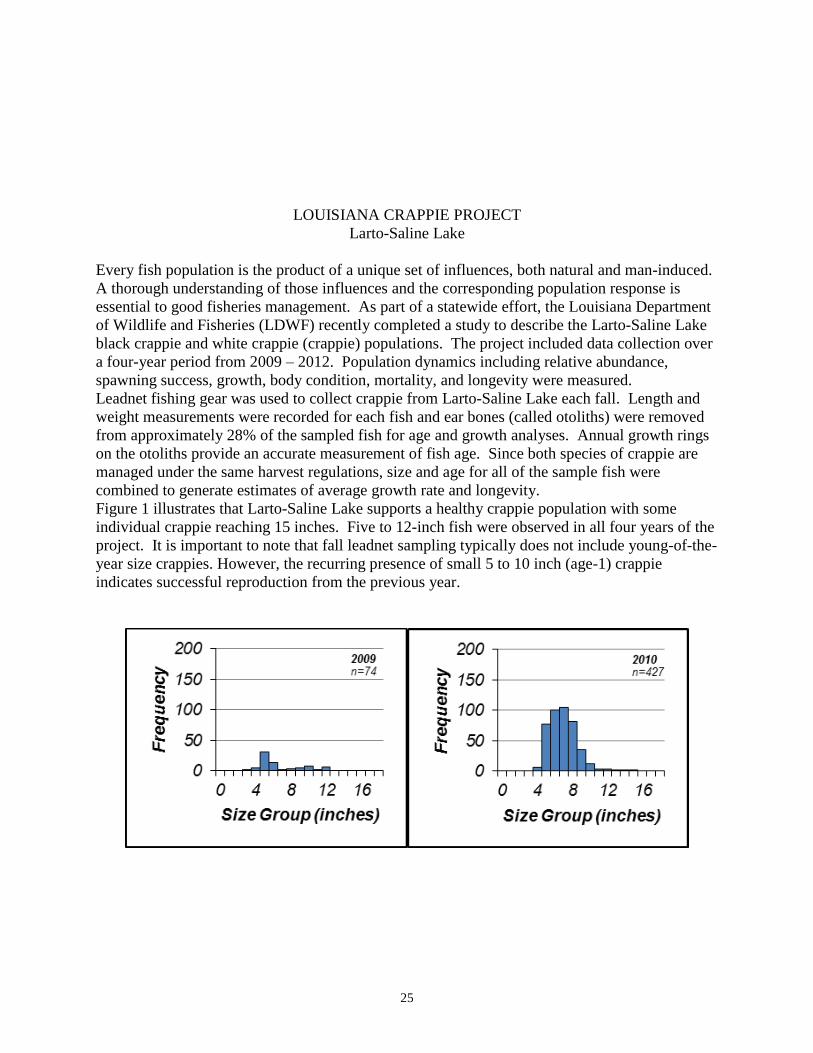
Figure 1 illustrates that Larto-Saline Lake supports a healthy crappie population with some
individual crappie reaching 15 inches. Five to 12-inch fish were observed in all four years of the
project. It is important to note that fall leadnet sampling typically does not include young-of-the-
year size crappies. However, the recurring presence of small 5 to 10 inch (age-1) crappie
indicates successful reproduction from the previous year.
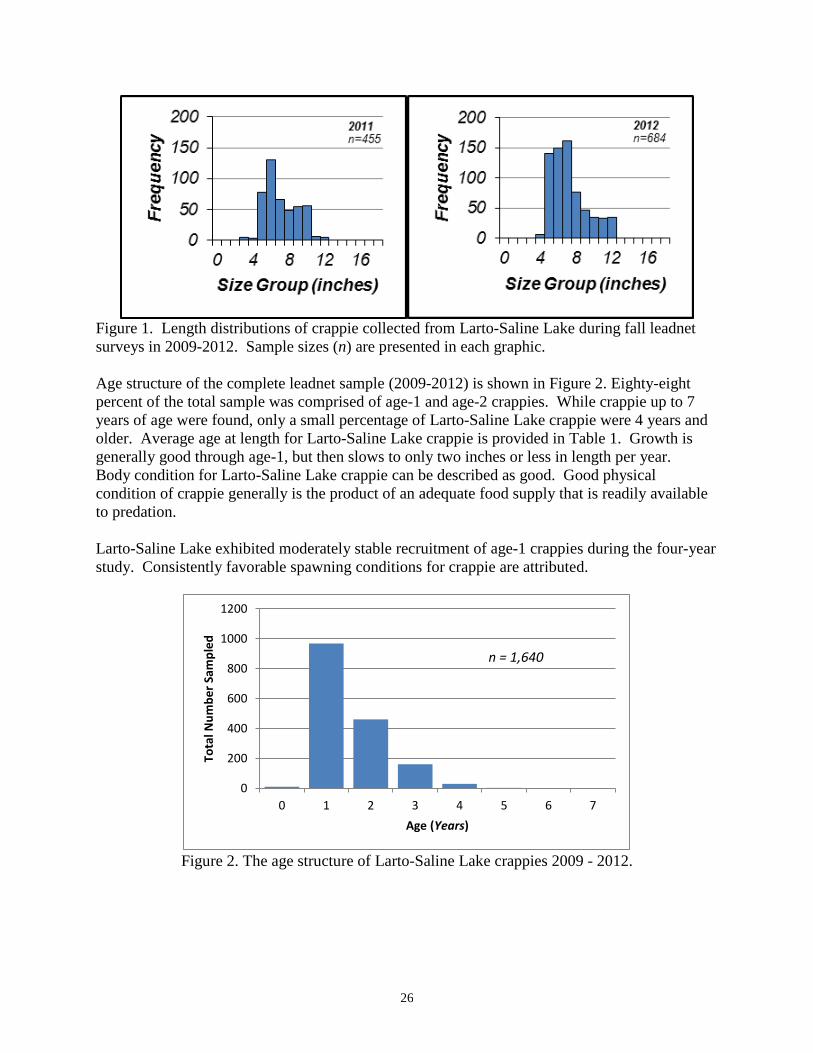
26
Figure 1. Length distributions of crappie collected from Larto-Saline Lake during fall leadnet
surveys in 2009-2012. Sample sizes (n) are presented in each graphic.
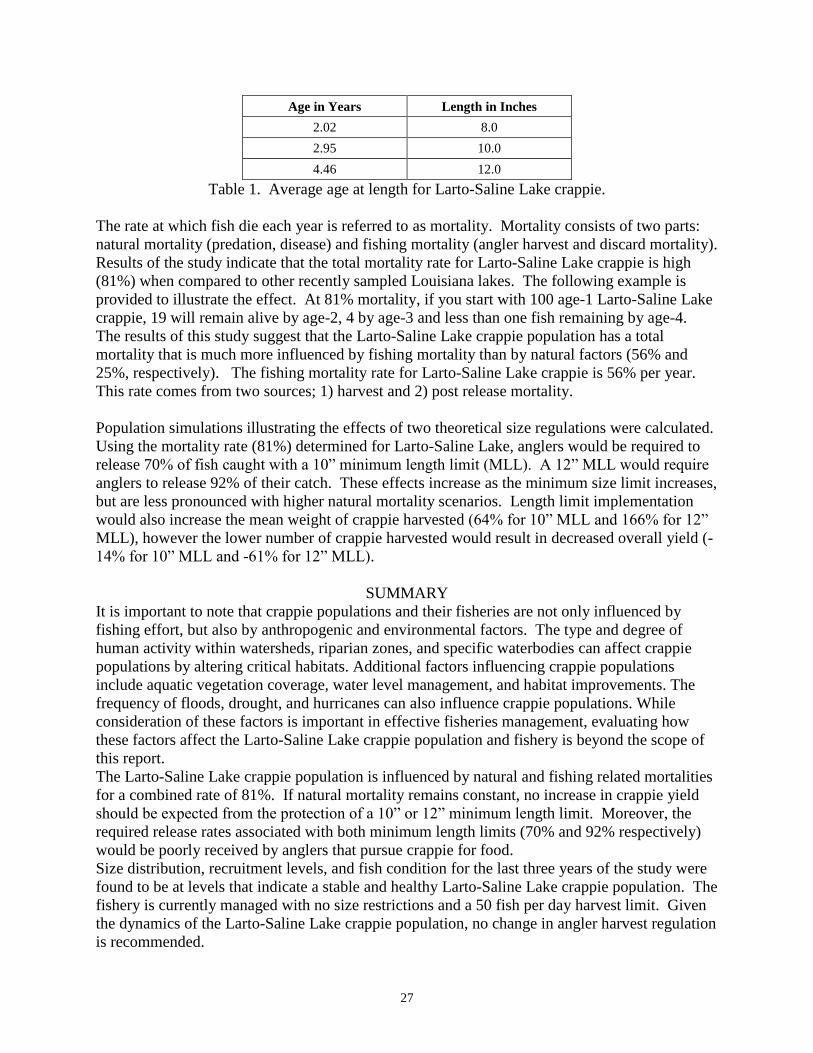
Age structure of the complete leadnet sample (2009-2012) is shown in Figure 2. Eighty-eight
percent of the total sample was comprised of age-1 and age-2 crappies. While crappie up to 7
years of age were found, only a small percentage of Larto-Saline Lake crappie were 4 years and
older. Average age at length for Larto-Saline Lake crappie is provided in Table 1. Growth is
generally good through age-1, but then slows to only two inches or less in length per year.
Body condition for Larto-Saline Lake crappie can be described as good. Good physical
condition of crappie generally is the product of an adequate food supply that is readily available
to predation.
Larto-Saline Lake exhibited moderately stable recruitment of age-1 crappies during the four-year
study. Consistently favorable spawning conditions for crappie are attributed.
Figure 2. The age structure of Larto-Saline Lake crappies 2009 - 2012.
0
200
400
600
800
1000
1200
0 1 2 3 4 5 6 7
Tota
l Nu
mb
er
Sam
ple
d
Age (Years)
n = 1,640
27
Age in Years Length in Inches
2.02 8.0
2.95 10.0
4.46 12.0
Table 1. Average age at length for Larto-Saline Lake crappie.
The rate at which fish die each year is referred to as mortality. Mortality consists of two parts:
natural mortality (predation, disease) and fishing mortality (angler harvest and discard mortality).
Results of the study indicate that the total mortality rate for Larto-Saline Lake crappie is high
(81%) when compared to other recently sampled Louisiana lakes. The following example is
provided to illustrate the effect. At 81% mortality, if you start with 100 age-1 Larto-Saline Lake
crappie, 19 will remain alive by age-2, 4 by age-3 and less than one fish remaining by age-4.
The results of this study suggest that the Larto-Saline Lake crappie population has a total
mortality that is much more influenced by fishing mortality than by natural factors (56% and
25%, respectively). The fishing mortality rate for Larto-Saline Lake crappie is 56% per year.
This rate comes from two sources; 1) harvest and 2) post release mortality.
Population simulations illustrating the effects of two theoretical size regulations were calculated.
Using the mortality rate (81%) determined for Larto-Saline Lake, anglers would be required to
release 70% of fish caught with a 10” minimum length limit (MLL). A 12” MLL would require
anglers to release 92% of their catch. These effects increase as the minimum size limit increases,
but are less pronounced with higher natural mortality scenarios. Length limit implementation
would also increase the mean weight of crappie harvested (64% for 10” MLL and 166% for 12”
MLL), however the lower number of crappie harvested would result in decreased overall yield (-
14% for 10” MLL and -61% for 12” MLL).
SUMMARY
It is important to note that crappie populations and their fisheries are not only influenced by
fishing effort, but also by anthropogenic and environmental factors. The type and degree of
human activity within watersheds, riparian zones, and specific waterbodies can affect crappie
populations by altering critical habitats. Additional factors influencing crappie populations
include aquatic vegetation coverage, water level management, and habitat improvements. The
frequency of floods, drought, and hurricanes can also influence crappie populations. While
consideration of these factors is important in effective fisheries management, evaluating how
these factors affect the Larto-Saline Lake crappie population and fishery is beyond the scope of
this report.
The Larto-Saline Lake crappie population is influenced by natural and fishing related mortalities
for a combined rate of 81%. If natural mortality remains constant, no increase in crappie yield
should be expected from the protection of a 10” or 12” minimum length limit. Moreover, the
required release rates associated with both minimum length limits (70% and 92% respectively)
would be poorly received by anglers that pursue crappie for food.
Size distribution, recruitment levels, and fish condition for the last three years of the study were
found to be at levels that indicate a stable and healthy Larto-Saline Lake crappie population. The
fishery is currently managed with no size restrictions and a 50 fish per day harvest limit. Given
the dynamics of the Larto-Saline Lake crappie population, no change in angler harvest regulation
is recommended.


![[XLS] · Web view2001 2 2003 4 2004 1 2006 1 1995 1 1990 1993 1998 1999 1999 1999 1999 2000 2000 2000 2000 2000 2001 2001 2001 2001 2001 2001 2001 2001 2001 2001 2001 2001 2001 2002](https://img.pdfslide.us/doc/110x75/5bdc2d6f09d3f2bc1c8d6ace/xls-web-view2001-2-2003-4-2004-1-2006-1-1995-1-1990-1993-1998-1999-1999-1999.jpg)