Embed Size (px)
Citation preview
Loughborough UniversityInstitutional Repository
A neurophysiologicalexamination of voluntaryisometric contractions:
modulations in sensorimotoroscillatory dynamics withcontraction force andphysical fatigue, and
peripheral contributions tomaximal force production
This item was submitted to Loughborough University's Institutional Repositoryby the/an author.
Additional Information:
• A Doctoral Thesis. Submitted in partial fulfilment of the requirementsfor the award of Doctor of Philosophy of Loughborough University.
Metadata Record: https://dspace.lboro.ac.uk/2134/20392
Publisher: c© Adam Fry
Rights: This work is made available according to the conditions of the Cre-ative Commons Attribution-NonCommercial-NoDerivatives 4.0 International(CC BY-NC-ND 4.0) licence. Full details of this licence are available at:https://creativecommons.org/licenses/by-nc-nd/4.0/
Please cite the published version.
A neurophysiological examination of voluntary isometric contractions: Modulations in sensorimotor oscillatory dynamics with
contraction force and physical fatigue, and peripheral contributions to maximal force
production
By
Adam Fry
A Doctoral Thesis
Submitted in partial fulfilment of the requirements for the award of Doctor of
Philosophy of Loughborough University
© Adam Fry (2015)

iii
Abstract
Human motor control is a complex process involving both central and peripheral
components of the nervous system. Type Ia afferent input contributes to both
motor unit recruitment and firing frequency, however, whether maximal force
production is dependent on this input is unclear. Therefore, chapter 2 examined
maximal and explosive force production of the knee extensors following
prolonged infrapatellar tendon vibration; designed to attenuate the efficacy of the
homonymous Ia afferent-α-motoneuron pathway. Despite a marked decrease in
H-reflex amplitude, indicating an attenuated efficacy of the Ia afferent-α-
motoneuron pathway, both maximal and explosive force production were
unaffected after vibration. This suggested that maximal and explosive isometric
quadriceps force production was not dependent upon Ia afferent input to the
homonymous motor unit pool.
Voluntary movements are linked with various modulations in ongoing neural
oscillations within the supraspinal sensorimotor system. Despite considerable
interest in the oscillatory responses to movements per se, the influence of the
motor parameters that define these movements is poorly understood.
Subsequently, chapters 3 and 4 investigated how the motor parameters of
voluntary contractions modulated the oscillatory amplitude. Chapter 3 recorded
electroencephalography from the leg area of the primary sensorimotor cortex in
order to investigate the oscillatory responses to isometric unilateral contractions
of the knee-extensors at four torque levels (15, 30, 45 and 60% max.). An
increase in movement-related gamma (30-50 Hz) activity was observed with
increments in knee-extension torque, whereas oscillatory power within the delta
(0.5-3 Hz), theta (3-7 Hz), alpha (7-13 Hz) and beta (13-30 Hz) bands were
unaffected.
Chapter 4 examined the link between the motor parameters of voluntary
contraction and modulations in beta (15-30 Hz) oscillations; specifically,
movement-related beta decrease (MRBD) and post-movement beta rebound
(PMBR). Magnetoencephalography (MEG) was recorded during isometric ramp
iv
and constant-force wrist-flexor contractions at distinct rates of force development
(10.4, 28.9 and 86.7% max./s) and force output (5, 15, 35 and 60%max.),
respectively. MRBD was unaffected by RFD or force output, whereas systematic
modulation of PMBR by both contraction force and RFD was identified for the first
time. Specifically, increments in isometric contraction force increased PMBR
amplitude, and increments in RFD increased PMBR amplitude but decreased
PMBR duration.
Physical fatigue arises not only from peripheral processes within the active
skeletal muscles but also from supraspinal mechanisms within the brain.
However, exactly how cortical activity is modulated during fatigue has received a
paucity of attention. Chapter 5 investigated whether oscillatory activity within the
primary sensorimotor cortex was modulated when contractions were performed in
a state of physical fatigue. MEG was recorded during submaximal isometric
contractions of the wrist-flexors performed both before and after a fatiguing series
of isometric wrist-flexions or a time matched control intervention. Physical fatigue
offset the attenuation in MRBD observed during the control trial, whereas PMBR
was increased when submaximal contractions were performed in a fatigued state.
Keywords: isometric muscle contraction; force; Ia afferent;
electroencephalography; magnetoencephalography; movement-related beta
decrease; post-movement beta rebound; fatigue

v
Acknowledgements
Many students declare their thesis a collaborative effort, but this may be
particularly true in my case. Particular appreciation must go to the following:
Firstly, I would like to thank Dr Jonathan Folland for his continued support and
seemingly unbreakable resolve. Dr Folland has contributed to every aspect of this
work. His input is by no means bound within the covers of the thesis.
I also thank Dr Tobias Vogt for his persistence and dedication in our collaboration
despite the many obstacles thrown in our path. Dr Vogt made considerable
contributions to all aspects of chapter 3. I am grateful also to Ms Nicola
Rawlinson and Mr Adam Williams for their dedicated assistance during the data
collection of chapter 3.
Particular thanks are reserved for Dr Matthew Brookes for his considerable
patience and support during my time spent at the University of Nottingham. His
contributions to all aspects of the work presented in chapters 4 and 5 should not
be understated. Any qualities to be found in these chapters are no doubt coated
with his fingerprints. I am also indebted to Mr George O’Neill for the many
rescues he performed when I found myself out of my depth in the MEG lab, and
to Dr Karen Mullinger for the priceless input to our fathoming of our MEG results.
Thank you also to all of the volunteers that participated in my research. Without
their sacrifice and commitment this work would not have been possible and I am
extremely grateful for their help.
Finally, special thanks to the many friends I have made during my time here at
Loughborough. If this journey had been a solo voyage, I never would have made
it to the end.
vi
Publications
The findings of the studies reported in this thesis have been published as follows:
Publications:
Chapter 2:
Fry, A. & Folland, J.P. 2014. Prolonged infrapatellar tendon vibration does not
influence quadriceps maximal or explosive isometric force production in man.
European Journal of Applied Physiology, 114(8), pp.1757-1766.
Chapter 3:
Fry, A., Vogt, T. & Folland, J.P. 2014. Does sensorimotor cortex activity change
with quadriceps femoris torque output? A human electroencephalography study.
Neuroscience, 275, pp.540-548.
Submissions:
Chapter 4:
Title: Modulation of post-movement beta rebound by contraction force and rate
of force development.
Authors: Fry, A., Mullinger, K.J., O’Neill, G.C., Barratt, E., Morris, P.G., Bauer, M.,
Folland, J.P. & Brookes, M.J.
Submitted to: Human Brain Mapping (17th September 2015)
Status: In review
vii
Table of Contents
Chapter 1: General Introduction ........................................................................... 1
1.1 – Peripheral contributions to maximal force generation ............................ 2
1.1.1 – Background ................................................................................... 2
1.1.2 – γ-loop contributions to motor unit recruitment ............................... 3
1.1.3 – The effect of prolonged muscle/tendon vibration on maximal
force production ........................................................................................ 5
1.1.4 – Techniques employed in evaluations of Ia afferent-α-
motoneuron efficacy and force production capacity ................................. 7
1.2 – Sensorimotor cortex activity and force production ............................... 11
1.2.1 – Background ................................................................................. 11
1.2.2 – Sensorimotor cortex activity and force production: single-cell
recordings from non-human primates ..................................................... 12
1.2.3 – Sensorimotor cortex activity and force production:
Functional neuroimaging using PET and fMRI ....................................... 14
1.2.4 – Why EEG/MEG? ......................................................................... 16
1.2.5 – Oscillatory activity in the sensorimotor cortex ............................. 17
1.2.6 – Sensorimotor activity and force production: Functional
neuroimaging using EEG ........................................................................ 20
1.3 – The effect of physical fatigue on sensorimotor cortex activity .............. 22
1.3.1 – Background ................................................................................. 22
1.3.2 – Evidence for a supraspinal contribution to physical fatigue ........ 22
1.3.3 – The effect of physical fatigue on sensorimotor activity:
Investigations using fMRI ........................................................................ 23
viii
1.3.4 – The effect of physical fatigue on sensorimotor activity:
Investigations using MEG ....................................................................... 25
1.4 – Summary and Aims .............................................................................. 26
Chapter 2: Prolonged infrapatellar tendon vibration does not influence
quadriceps maximal or explosive isometric force production in man .................. 29
2.1 – Abstract .......................................................................................... 30
2.2 – Introduction .................................................................................... 31
2.3 – Methods ......................................................................................... 33
2.4 – Results ........................................................................................... 43
2.5 – Discussion ..................................................................................... 50
Chapter 3: Does sensorimotor cortex activity change with quadriceps
femoris torque output? A human electroencephalography study ........................ 54
3.1 – Abstract .......................................................................................... 55
3.2 – Introduction .................................................................................... 56
3.3 – Methods ......................................................................................... 57
3.4 – Results ........................................................................................... 64
3.5 – Discussion ..................................................................................... 69
Chapter 4: Modulation of post-movement beta rebound by contraction force
and rate of force development ............................................................................. 74
4.1 – Abstract .......................................................................................... 75
4.2 – Introduction .................................................................................... 76
4.3 – Methods ......................................................................................... 78
4.4 – Results ........................................................................................... 88
4.5 – Discussion ..................................................................................... 96
ix
Chapter 5: The effect of physical fatigue on oscillatory dynamics of the
sensorimotor cortex ........................................................................................... 103
5.1 – Abstract ........................................................................................ 104
5.2 – Introduction .................................................................................. 105
5.3 – Methods ....................................................................................... 107
5.4 – Results ......................................................................................... 115
5.1 – Discussion ................................................................................... 122
Chapter 6: General Discussion ......................................................................... 126
6.1 – Introduction .................................................................................. 127
6.2 – Is maximal voluntary force development dependent upon Ia
afferent input to the motor unit pool? .................................................... 128
6.3 – Contraction-driven changes in sensorimotor oscillations: Any
modulation with the motor parameters of voluntary contractions? ....... 131
6.4 – The effect of physical fatigue on oscillatory dynamics ................. 137
6.5 – Modulations of PMBR .................................................................. 140
6.6 – MRBD and PMBR: independent phenomena? ............................ 142
6.7 – Summary of the Key Findings ............................................................ 145
6.8 – Future research .................................................................................. 147
References ........................................................................................................ 149
x
List of Tables
Table 2.1 Order and timing of the volitional and evoked contractions ................. 35
Table 3.1 Intraindividual coefficients of variation for absolute cortical activity .... 69
Table 4.1 Average MNI coordinates and associated most likely cortical
locations of the MRBD and PMBR ................................................................ 96
Table 5.1 Wrist flexion force during the 40%MVFb contractions ....................... 115
Table 5.2 Average MNI coordinates and the most likely cortical locations of
the MRMD, MRBD and PMBR .................................................................... 121
Table 5.3 MRMD, MRBD and PMBR expressed relative to resting amplitude .. 122
xi
List of Figures
Figure 1.1 The monosynaptic Ia afferent-α-motoneuron pathway and
example H-reflex and M-wave recordings ...................................................... 9
Figure 2.1 The isometric knee extension strength testing chair .......................... 37
Figure 2.2 Explosive force production and agonist EMG amplitude during
the first 150 ms of the explosive voluntary contractions ................................ 44
Figure 2.3 Force production during the first 75 ms of the evoked octet
contractions. .................................................................................................. 45
Figure 2.4 Maximal voluntary force and agonist EMG amplitude at MVF ........... 46
Figure 2.5 The force-EMG amplitude relationship during the ramp
contractions ................................................................................................... 47
Figure 2.6 Example H-reflex recordings from the vastus medialis of one
participant and Hmax/Mmax at all four measurement time-points .................... 49
Figure 3.1 An example recording of knee-extensor torque during the series
of submaximal isometric contractions and a schematic illustration of one
of the five sets of twelve 5-s contractions ..................................................... 59
Figure 3.2 The EMG-torque relationship of the knee extensors .......................... 65
Figure 3.3 Cortical activity within the sensorimotor cortex for the whole 0.5-
50 Hz frequency band ................................................................................... 66
Figure 3.4 Cortical activity within each of the constituent frequency bands
as a proportion of cortical current density ..................................................... 66
Figure 3.5 Cortical activity within each of the constituent frequency bands
as a fold change from resting values ............................................................ 68
Figure 4.1 A photograph of the isometric wrist-flexion dynamometer, each
target force profile with contraction force overlaid, and schematic
diagrams of the constant-force and ramp contractions experiments ............ 81
Figure 4.2 Schematic diagram showing the MEG data analysis pipeline ............ 83
xii
Figure 4.3 Results of the constant-force experiment ........................................... 90
Figure 4.4 Results of the ramp experiment ......................................................... 91
Figure 4.5 PMBR amplitude and duration during the constant-force
experiment .................................................................................................... 93
Figure 4.6 PMBR amplitude and duration during the ramp experiment .............. 94
Figure 4.7 Peak locations of the MRBD and PMBR in the constant-force
and ramp experiments .................................................................................. 95
Figure 5.1 The MEG scanner set-up, wrist-flexion dynamometer set-up, an
example target force profile with contraction force overlaid, and a
schemtaic diagram of the experimental protocol ........................................ 109
Figure 5.2 Force output during each of the four MVCs in the control and
fatigue trials ................................................................................................. 116
Figure 5.3 Locations of peak MRMD during the 40%MVFb contractions,
time-frequency spectrograms extracted from locations of peak MRMD,
average mu amplitude at rest, and average MRMD amplitude in both
the control and fatigue trials ........................................................................ 118
Figure 5.4 Locations of peak MRBD during the 40%MVFb contractions,
time-frequency spectrograms extracted from locations of peak MRBD,
average beta amplitude at rest, and average MRBD amplitude in both
the control and fatigue trials ........................................................................ 119
Figure 5.5 Locations of peak PMBR following the 40%MVFb contractions,
time-frequency spectrograms extracted from locations of peak PMBR,
average beta amplitude at rest, and average PMBR amplitude in both
the control and fatigue trials ........................................................................ 120

xiii
List of Appendices
Appendix 3.1: The areas of the cortex comprising each of the 27 voxels at
which the LORETA analyses were performed. ........................................... 148

xiv
List of Abbreviations
Abbreviations are defined in the text in the first instance.
ANOVA Analysis of variance
BOLD Blood oxygen level dependent
CCD Cortical current density
CV Coefficient of Variation
ECoG Electrocorticography
EEG Electroencephalography
EMG Electromyography
EVC Explosive voluntary contraction
F25, 50, 75, 100, 150 Force at 25, 50, 75, 100 or 150 ms following onset
FDR False discovery rate
fMRI Functional magnetic resonance imaging
GABA Gamma aminobutyric acid
HAM Hamstrings
LOI Location of interest
LORETA Low-resolution brain electromagnetic tomography
MEG Magnetoencephalography
MNI Montreal Neurological Institute
MRBD Movement-related beta decrease
MRMD Movement-related mu decrease
MVC Maximal voluntary contraction
MVF Maximal voluntary force
MVFb Baseline maximal voluntary force
MVT Maximal voluntary torque
xv
PET Positron emission tomography
PMBR Post-movement beta rebound
QUAD Quadriceps
rCBF Regional cerebral blood flow
RFD Rate of force development
RMS Root mean square
SAM Synthetic aperture magnetometry
TFS Time-frequency spectrum
TMS Transcranial magnetic stimulation
VMd Distal vastus medialis electromyography recording site

Chapter 1
General Introduction
Chapter 1
2
The work of this thesis is divided in to three sections. The first addresses the
importance of Ia afferent contributions to maximal force development, and
includes the study presented in chapter 2. The second examines whether
movement-related changes in oscillatory activity within the sensorimotor cortex
may be modulated by the motor parameters of the performed contractions
(specifically the contraction force and RFD), and includes the studies presented
in chapters 3 and 4. Finally, the third section investigates whether oscillatory
activity within the sensorimotor cortex may be modulated when contractions are
performed in a state of physical fatigue, and includes the study presented in
chapter 5. These sections are introduced individually as follows:
1.1 – Peripheral contributions to maximal force generation
1.1.1 – Background
The gradation of skeletal muscle contraction force in humans is governed by the
number of motor units recruited and the rate at which the activated motor units
fire. In turn, both of these recruitment characteristics are principally determined
by the net effect of the excitatory and inhibitory inputs to the α-motoneurons
within the motor unit pool (Pierrot-Deseilligny & Burke 2005). As net excitatory
input rises, larger motor units of increasing thresholds are activated in
accordance with the size principle (Henneman et al. 1965), and the firing
frequency of the previously recruited α-motoneurons will increase proportionally
to the magnitude of depolarisation beyond motor threshold (Heckman & Binder
1991). Three types of neurons make excitatory projections to (lower) α-
motoneurons of the motor unit pool: upper α-motoneurons, which are supra-
spinal in origin, (excitatory) interneurons, which mediate the action of other
Chapter 1
3
neurons, and type Ia afferent neurons, which emanate from muscle spindle
primary endings and form part of the γ-loop. The potential for Ia afferent-α-
motoneuron connections to facilitate muscle contractions has therefore come
under investigation. However, while reflex activity within the γ-loop is widely
accepted to offer effective contributions in locomotion (Zehr & Stein 1999), their
role in maximal force production is less well understood.
1.1.2 – γ-loop contributions to motor unit recruitment
Hagbarth et al. (1986) completed a series of experiments following an
anaesthetic-induced block of the right peroneal nerve that resulted in complete or
partial paralysis of the pretibial muscles. During the progressive
induction/recovery of the anaesthesia, decrements in maximal voluntary isometric
dorsiflexion force following the peroneal nerve block were accompanied by
reductions in both the number of active motor units and the firing rates of the
remaining units in the tibialis anterior muscle (the magnitude of these decrements
being dependent on the period of recovery following anaesthetic administration).
The cause of this impaired motor unit recruitment was explored using electrical
stimulation of the peroneal nerve at a location proximal to the anaesthetic
administration (Hagbarth et al. 1986). After a period of partial recovery, the
paretic muscle could be driven maximally by electrical stimulation of the peroneal
nerve; demonstrating that the low firing rates could not be solely dependent on
deficient impulse transmission in α-motor units. M-wave amplitude was also well
preserved despite significant decrements in surface EMG activity during maximal
voluntary contraction (MVC) attempts. Preferential impairment of impulse
transmission in the γ-motoneurons resulting in a diminished input to the α-
motoneuron pool via the γ-loop was therefore proposed to contribute to the
reductions in motor unit firing rates.
To test this hypothesis, vibration of the tibialis anterior tendon or passive
plantarflexions were imposed during the attempted maximal contractions in the
paresis recovery in order to provide an external stimulation of the primary spindle
endings (Hagbarth et al. 1986). Motor unit firing rates increased from 10 to 25 Hz
Chapter 1
4
and dorsiflexion force was augmented in response to both stimuli. These results
led the authors to conclude that γ-loop contributions to the α-motoneuron pool
may provide a “substantial tonic power supply” during maximal force production
tasks. However, the “most striking” facilitation of motor unit firing rates occurred
when contraction force had recovered to 25-75% of pre-anaesthetisation values,
and in agreement with Humphries et al. (2004), no effect of tendon vibration or
passive plantarflexion was observed prior to anaesthesia (i.e. at 100% MVC).
Therefore, whilst the results provide strong evidence for a role of the γ-loop in
facilitating α-motoneuron firing frequencies and contraction force at sub-maximal
intensities, the efficacy of this pathway during MVCs with the fusimotor system
intact was less clear.
In paradox to the facilitatory effects of a brief vibration stimulus, a continued
period of vibration applied to the muscle or tendon can have inhibitory effects on
the efficacy of the homonymous Ia afferent-α-motoneuron pathway (Desmedt &
Godaux 1978; see also Chapter 1.1.4); a peripheral component of the γ-loop.
Bongiovanni et al. (1990) applied a continuous 2-min vibration stimulus to the
dorsiflexor tendons during a series of sixteen 3-4-s maximal isometric
contractions (vibration commencing after the fifth and ceasing after the eleventh
contraction). Both contraction force and muscle activation progressively declined
across the contractions accompanied by the tendon vibration, but immediately
returned to pre-vibration levels once vibration had ceased. Single motor unit
recordings from the tibialis anterior demonstrated that firing frequency was
attenuated, and that this was markedly greater in high threshold (initial
recruitment at contraction forces >50% maximal voluntary force (MVF)) versus
low threshold (initial recruitment at contraction forces <5% MVF) motor units.
Approximate discharge frequencies decreased from 35 Hz to 5 Hz and 30 Hz in
the high and low threshold units, respectively. In the same report, sustained one-
minute maximal contractions were also performed with and without a
superimposed vibration stimulus (Bongiovanni et al. 1990). The decline in both
force and EMG were significantly greater during the vibration trial versus the
control trial, and this was again characterised by a marked decrease in the firing
frequencies of high threshold motor units. These findings, together with those of
Hagbarth et al. (1986), demonstrate that peripheral input to α-motoneurons from
Chapter 1
5
homonymous Ia afferents may contribute to both the recruitment of high threshold
motor units and to achieving maximal firing rates of recruited motor units,
however, whether maximal force development is dependent on this input is not
clear.
1.1.3 – The effect of prolonged muscle/tendon vibration on maximal force production
More extended periods of muscle or tendon vibration, typically 20 to 30 minutes
in duration, have been demonstrated to provoke a lasting reduction in the efficacy
of the homonymous Ia afferent-α-motoneuron transmission of up to 20 minutes
(Shinohara et al. 2005). Accordingly, a number of studies have utilised this
technique in order to record maximum force performance in a presumed state of
reduced Ia afferent-α-motoneuron efficacy.
Kouzaki et al. (2000) recorded the force and quadriceps electromyography (EMG)
during isometric unilateral knee-extension MVCs performed both before and after
either a 30-min tonic vibration stimulus (30 Hz) applied to the rectus femoris
muscle or a 30-min period of quiescent sitting (control intervention). These
authors found a ~10% decrease in maximal force and ~14% decrease in rectus
femoris activity following vibration, whereas no differences were observed in the
control trial. No differences in vastus medialis or vastus lateralis EMG were
observed in either trial. These results were suggested to indicate that MVF
capacity is impaired in a state of attenuated Ia afferent-α-motoneuron
transmission. However, the muscle vibration evoked a tonic response, with action
potentials recorded from the rectus femoris during the application of vibration.
This low level contraction might therefore have led to a fatiguing of the muscle,
which could have contributed to the reduction in MVF. Yet, despite this possibility,
no attempt was made to assess the excitability of the extrafusal fibres before and
after vibration; for example, by using M-wave recordings. Moreover, the efficacy
of the Ia afferent-α-motoneuron pathway before and after vibration was not
assessed; for example, by using H-reflex recordings. This study also recorded
the peak rate of force development (RFD) during the generation of the MVCs. A
~24% decrease was reported following vibration; more than twice the relative
Chapter 1
6
decrease in maximal force. However, the authors conceded that “no instruction
had been given as to the speed of force development at the onset of voluntary
contraction”, and as such this result should be interpreted with further caution.
In a similar study, Jackson & Turner (2003) found 6.9% and 4.2% decreases in
isometric unilateral knee-extension MVF following 30 minutes of mechanical
vibration applied to the rectus femoris at 30 Hz and 120 Hz, respectively. Rectus
femoris EMG during the MVCs was also significantly decreased following 30 Hz
vibration, but not 120 Hz vibration, whereas vastus lateralis EMG was unchanged
following vibration at either frequency. No changes in either MVF or the
accompanying EMG were observed following 30 minutes of quiescent sitting
without vibration (control trial). In this study, participants were instructed to
achieve maximal force “as rapidly as possible”. Peak RFD was recorded during
this phase of the contraction, and was shown to decrease by 20.9% and 33.3%
following the 30 Hz and 120 Hz vibration periods, respectively; almost five times
the observed decrement in maximal force. However, the control (pre-intervention)
assessments of peak RFD were highly variable between trials. Additionally,
Sahaly et al. (2001) suggested that measuring RFD during the performance of
maximal force contractions may not provide valid measurements of peak RFD
(Sahaly et al. 2001). Moreover, no attempt to assess the efficacy of the Ia
afferent-α-motoneuron pathway or the excitability of the muscle fibres was made
following the 30-min vibration.
One further study by Konishi et al. (2009) investigated the effect of a 20-min
vibration stimulus (50 Hz) applied to the infrapatellar tendon on maximal
concentric and eccentric knee-extensor torque. Although Ia afferent firing is
usually higher during eccentric than concentric contractions, due to the muscle
spindles lengthening during the contraction (Burke 1978), similar decreases in
both concentric (16%) and eccentric (17%) maximal voluntary torque were
identified following vibration. Similar decrements in EMG were also described for
both the vastus lateralis and vastus medialis, although no significant change in
muscle activation of the rectus femoris was identified. These authors proposed
that a reduced efficacy of Ia afferent-α-motoneuron transmission has a similar
impact on different contraction types. However, the effect of the tendon vibration
Chapter 1
7
on the Ia afferent-α-motoneuron pathway was not assessed, and no control trial
was included.
Ushiyama et al. (2005) and Ekblom & Thorstensson (2011) both investigated the
effects of a 30-min Achilles tendon vibration (100 Hz) on maximal plantar flexor
strength. These investigations also included H-reflex and M-wave measurements
to monitor modulations in the efficacy of the Ia afferent-α-motoneuron pathway
and the excitability of the extrafusal fibres, respectively. Both of these studies
reported a substantial decrease in maximum H-reflex:M-wave ratio following
tendon vibration (34-39%, Ushiyama et al. 2005; 33%, Ekblom & Thorstensson
2011), indicating that their vibration stimuli were effective in attenuating the
efficacy of the homonymous Ia afferent-α-motoneuron pathway. Ushiyama et al.
(2005) also demonstrated significant decreases in muscle activity of both the
lateral (13%) and medial (11%) heads of the gastrocnemius, but not the soleus,
which resulted in a 17% decrease in isometric plantar flexor torque. Conversely,
Ekblom & Thorstensson (2011) found no effect of the 30-min Achilles tendon
vibration on either the maximal concentric and eccentric plantar flexion torque, or
triceps surae activation during these movements. Ekblom & Thorstensson (2011)
suggested that the measurement of dynamic rather than isometric contractions
may have contributed to the disparity between their findings and those Ushiyama
et al. (2005); however this is of course in conflict with the results of Konishi et al.
(2009) (presented above). These suggestions therefore require further
investigation. Overall these differing findings demonstrate that the role of Ia
afferent input the motor units during maximal contractions is yet to be fully
elucidated.
1.1.4 – Techniques employed in evaluations of Ia afferent-α-motoneuron efficacy and force production capacity
H-reflex
First described by Paul Hoffmann around a century ago (Hoffmann 1918), the
Hoffmann (H) reflex is considered the electrical analogue of the mechanically
induced stretch reflex, but bypasses the influence of the muscle spindle and
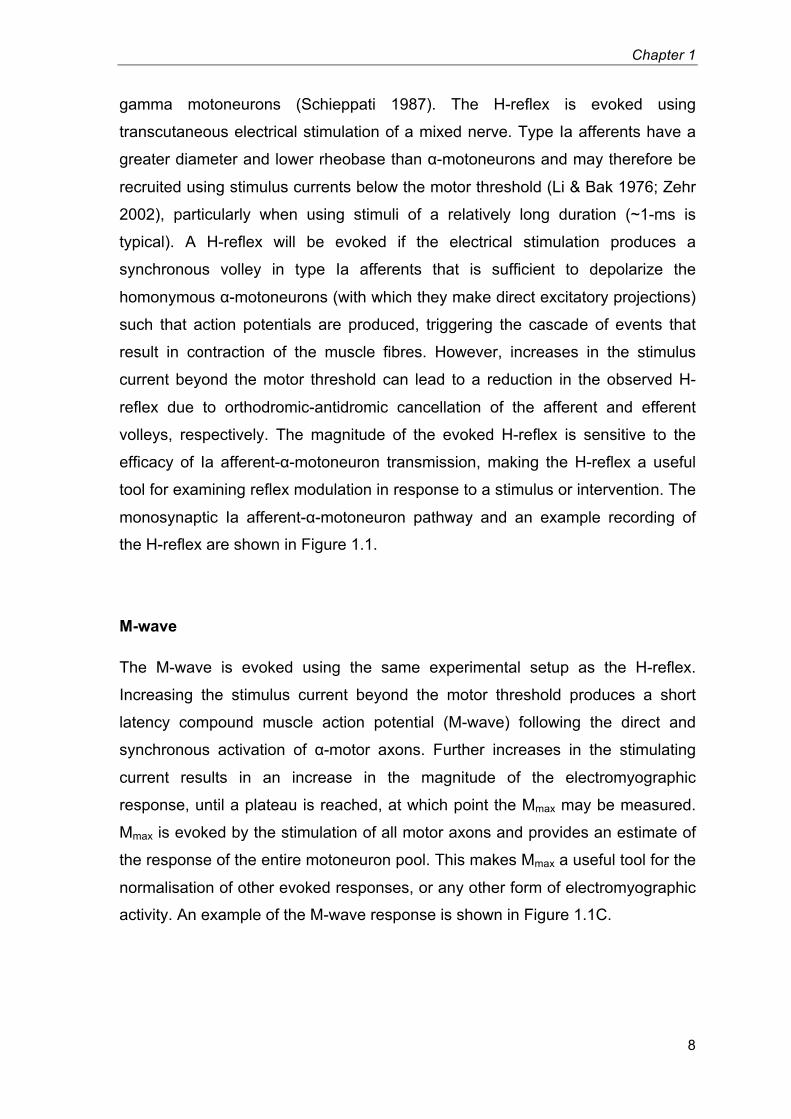
Chapter 1
8
gamma motoneurons (Schieppati 1987). The H-reflex is evoked using
transcutaneous electrical stimulation of a mixed nerve. Type Ia afferents have a
greater diameter and lower rheobase than α-motoneurons and may therefore be
recruited using stimulus currents below the motor threshold (Li & Bak 1976; Zehr
2002), particularly when using stimuli of a relatively long duration (~1-ms is
typical). A H-reflex will be evoked if the electrical stimulation produces a
synchronous volley in type Ia afferents that is sufficient to depolarize the
homonymous α-motoneurons (with which they make direct excitatory projections)
such that action potentials are produced, triggering the cascade of events that
result in contraction of the muscle fibres. However, increases in the stimulus
current beyond the motor threshold can lead to a reduction in the observed H-
reflex due to orthodromic-antidromic cancellation of the afferent and efferent
volleys, respectively. The magnitude of the evoked H-reflex is sensitive to the
efficacy of Ia afferent-α-motoneuron transmission, making the H-reflex a useful
tool for examining reflex modulation in response to a stimulus or intervention. The
monosynaptic Ia afferent-α-motoneuron pathway and an example recording of
the H-reflex are shown in Figure 1.1.
M-wave
The M-wave is evoked using the same experimental setup as the H-reflex.
Increasing the stimulus current beyond the motor threshold produces a short
latency compound muscle action potential (M-wave) following the direct and
synchronous activation of α-motor axons. Further increases in the stimulating
current results in an increase in the magnitude of the electromyographic
response, until a plateau is reached, at which point the Mmax may be measured.
Mmax is evoked by the stimulation of all motor axons and provides an estimate of
the response of the entire motoneuron pool. This makes Mmax a useful tool for the
normalisation of other evoked responses, or any other form of electromyographic
activity. An example of the M-wave response is shown in Figure 1.1C.
Chapter 1
9
Figure 1.1 (A) The monosynaptic Ia afferent-α-motoneuron pathway (adapted
from Pierrot-Deseilligny and Burke 2005, pp. 2). Ia afferents (dashed line)
emanating from muscle spindle primary endings make direct excitatory
projections to homonymous α-motoneurons within the spinal cord.
Transcutaneous electrical stimulation of the mixed nerve can evoke the H-reflex
and M-wave responses (bypassing the influence of the muscle spindle and γ-
motoneurons). (B) Electromyography traces of a H-reflex and (C) M-wave are
also shown. The H-reflex is evoked using a lower stimulus current than the M-
wave, and arises following a greater latency as the electrophysiological pathway
is longer (exact latencies and amplitudes of these responses will depend on the
muscle under investigation).
γα
electricalstimulation
type Ia
A
B
C
electricalstimulation
H
M
Chapter 1
10
The octet
Transcutaneous electrical stimulation of the mixed nerve will also produce a
mechanical response from the innervated muscle. This is typically measured with
the limb under investigation held in a fixed position such that the mechanical
response is that of an isometric contraction. Single pulses of electrical stimulation,
as per the H-reflex and M-wave, produce a twitch response, whereas entrained
stimulation can be used to evoke tetanic muscle contractions. High frequency
nerve stimulation can elicit contractions up to the maximal rate of force
development (De Ruiter et al. 1999; Deutekom et al. 2000). For example, eight
pulses at 300 Hz using a supramaximal stimulus current is sufficient to drive the
muscle at its maximal RFD (de Ruiter et al. 2004). This stimulation paradigm is
known as the octet, and is useful in demonstrating the maximal capacity of the
muscle-tendon unit for RFD, against which voluntary efforts can be normalised.
Muscle-tendon unit vibration
Mechanical vibration applied to the muscle or tendon unit causes small changes
in length in the muscle spindle that promotes type I afferent activation. While
initially providing an increase in excitatory input to α-motoneurons, prolonged
vibration of more than 10-20 s can attenuate the efficacy of the homonymous Ia
afferent-α-motoneuron pathway (Shinohara et al. 2005); a phenomenon known
as the vibration paradox (Desmedt & Godaux 1978). This depression in Ia
afferent-α-motoneuron transmission may arise via one or more of a number of
processes. Vibration of the muscle-tendon unit produces interneuron-mediated
presynaptic inhibition of la terminals (Hultborn et al. 1987; Lapole et al. 2012).
Additionally, with prolonged vibration over several minutes, transmitter depletion
can occur at Ia synapses causing a decrease in Ia synaptic efficacy (Curtis &
Eccles 1960; Hultborn et al. 1996), and the discharge threshold of Ia afferents
may be increased (Hayward et al. 1986; Lin et al. 2002). Note that each of these
mechanisms is presynaptic in origin, with the post-synaptic excitability of the
homonymous α-motoneurons seemingly unaffected by muscle-tendon unit
Chapter 1
11
vibration (Abbruzzese et al. 1997). This ability to modulate the efficacy of Ia
afferent-α-motoneuron transmission makes muscle-tendon unit vibration a useful
tool for studying reflex involvement in a variety of motor tasks.
1.2 – Sensorimotor cortex activity and force production
1.2.1 – Background
The primary cortical regions directly associated with motor action and
somatosensory processing has long been established. For example, the
somatotopic organisation of the primate primary motor cortex was first mapped
over a century ago (Grünbaum & Sherrington 1901), along with the division of the
primary motor and sensory cortices via the central fissure (Cushing 1909).
Following these discoveries, the electrophysiological behaviour of these
structures, and how this relates to their function, became a topic of considerable
interest among neurophysiologists, and remains so today. One early
advancement in this area followed the advent of the electroencephalogram
(Berger 1929), which involves measuring differences in electric potential across
the scalp. Berger described a ‘beta-type’ (16-22 Hz) rhythmic potential arising in
the precentral gyrus of resting human subjects (Berger 1929), and a “blocking” of
this sensorimotor rhythm during voluntary movements was later detailed by
Jasper & Penfield (1949). Further advances in measurement techniques,
technologies and computational capabilities have continued to elucidate the
relationships between ‘cortical activity’ within the sensorimotor cortex and motor
behaviours. More recent avenues of investigation have included microelectrode
recordings from cells in the sensorimotor cortex of non-human primates,
functional magnetic resonance imaging during motor actions, and
magnetoencephalographic recordings of sensorimotor oscillations (each of which
are described in more detail in the following discussions). Even so, the
relationships between numerous indices of sensorimotor activity and movement
Chapter 1
12
kinetics are still poorly understood. In particular, whether the motor parameters of
a voluntary movement might modulate the oscillatory dynamics within the
sensorimotor cortex is far from clear.
1.2.2 – Sensorimotor cortex activity and force production: single-cell recordings from non-human primates
Pioneering work by (Evarts 1968) revealed a relationship between discharge
frequencies of pyramidal tract neurons in the precentral gyrus and the force
characteristics of wrist flexor/extensor contractions. In this study, three adult
monkeys were trained to perform alternate wrist flexion and extension
movements; moving a vertical rod through a 30° range of motion in each direction
within 400-700 ms. An external load of 0, 100, 200 or 400 g was applied to the
rod so that it either opposed flexion or extension. In this way wrist movements
involved activation of either the wrist flexors or extensors irrespective of whether
the joint was moving through flexion or extension. Thus force production was
dissociated from the direction of movement during task performance. Unit
recordings were collected from >100 pyramidal tract neurons by inserting
microelectrodes through the dura mater into the brain. Of the 31 neurons that
were associated with task performance, 26 demonstrated a discharge frequency
pattern that was primarily related to either the force or RFD of the contractions (or
both).
This positive relationship between volitional force output and the activity of
pyramidal tract neurons in the precentral gyrus was reaffirmed in a follow up
study by Evarts (1969) in which two monkeys were trained to use the same
apparatus (Evarts 1968) to perform isometric contractions of both the wrist flexors
and extensors. The use of isometric contractions demonstrated that activity of the
motor cortex pyramidal tract neurons was directly related to the active muscle
force (or RFD) as opposed to the resultant joint displacement. This hypothesis
was further corroborated by a separate research group (Cheney & Fetz 1980),
who found that corticomotoneuronal cells within the precentral cortex
demonstrated tonic firing rates that were linearly related to isometric wrist
flexion/extension torque.
Chapter 1
13
Although several other studies have confirmed that some precentral neurons
increase their discharge frequency with active force (e.g. Thach 1978; Evarts et
al. 1983; Hepp-Reymond et al. 1999); all these investigations have also found
numerous cells in which an increase in activity (firing) was coincident with
movement/contraction, but the level of activity was unrelated to force. In fact, only
a small minority of cells within the motor cortex may moderate their activity in
relation to muscular force production (Ashe 1997). For example; Taira et al.
(1996) recorded impulse activity in a total of 188 cells in the arm area of the
primary motor cortex in two monkeys, who were trained to accurately apply
steady isometric contraction forces against a manipulandum (rigid vertical rod) in
response to a visual cue (cursor and cursor target on a visual display). Each cell
demonstrated a change in activity with proximal movements of the contralateral
arm, but not movements of the hand/fingers (inclusion criteria). The relationship
between the discharge frequency of these cells and both the magnitude and
direction (in three dimensions) of the applied force was assessed using a
stepwise multiple linear regression. The regression model was significant in 154
(81.9%) of the 188 cells, of which; 121 (78.6%) were related to the direction, but
not the magnitude of force, 11 (7.1%) were related to the magnitude, but not the
direction of force, and 22 (14.3%) were related to both the direction and
magnitude of the applied force.
One further study of interest comes from Wannier et al. (1991), in which single-
cell activity was recorded from both the precentral motor and postcentral sensory
cortices of three adult monkeys, who were trained to finely control an isometric
force (~0.1-0.9 N) applied to a transducer held between the thumb and index
finger. Electrical stimulation via the inserted microelectrodes evoked a motor
response at 87% of the precentral sites, but also 25% of the postcentral sites;
indicating a potential role for the primary sensory cortex in force production.
However, an altered firing pattern was observed prior to force onset in 56% of the
task-related precentral neurons, whereas this was true in only 14% of postcentral
neurons. Subsequently, these authors suggested that the primary sensory cortex
might significantly contribute to the regulation of finely graded force production,
but have little input to contraction initiation. Overall, these results indicate that
Chapter 1
14
force production should perhaps be considered a sensorimotor (rather than
simply a motor) process.
An important advantage of microelectrode recordings is that that they offer a
direct measurement of neuronal activity. (In healthy human subjects, cortical
behaviour must usually be inferred from indirect measurements of neuronal
activity). However, single-cell studies also encounter a number of inherent
limitations. For example; it is difficult for single-cell recordings to determine
whether the number of participating cells changes with contraction parameters, or
to monitor multiple cortical regions simultaneously. The aforementioned
investigations on monkeys have also only managed to study contraction force up
to relatively low amplitudes; presumably to avoid physical fatigue. Therefore, non-
invasive recordings from human subjects remain useful in building a more
complete understanding of how the cortical activity may modulate with of the
motor parameters of voluntary contractions.
1.2.3 – Sensorimotor cortex activity and force production: Functional neuroimaging using PET and fMRI
In humans, both positron emission tomography (PET) and functional magnetic
resonance imaging (fMRI) have been used to investigate the relationship
between cortical activation and voluntary force production; and a number of
studies have demonstrated a positive relationship between these two variables.
Dettmers et al. (1995) recorded relative regional cerebral blood flow (rCBF) using
PET in six healthy adult males performing 1 Hz near-isometric contractions of the
right index finger (pressing a Morse-key); producing a sinusoidal-like force output
with peak forces of either 5, 10, 20, 40 or 60%MVF. An increased rCBF was
recorded in a number of brain locations during task performance, including the
dorsal bank of the cingulate sulcus, the ventral portion of the supplementary
motor area, and the ipsilateral cerebellar vermis. However, it was the
contralateral sensorimotor cortex that demonstrated both the greatest relative
increase in rCBF and the strongest correlation (logarithmic relationship) between
rCBF and peak force during the key presses.
Chapter 1
15
Thickbroom et al. (1998) examined the blood-oxygen-level dependent (BOLD)
fMRI response to isometric flexion of digits 2-5. Contractions were performed at
four force levels; 5, 10, 25 and 50%MVF, and were facilitated by visual feedback
of a pressure gauge. This was completed within the MRI scanner, and required
each force level to be maintained throughout four separate 18-s scans. The
results demonstrated that greater contraction forces were accompanied by
substantial increases in the number of significantly activated voxels within the
central sulcus (i.e. the area of the cortex that is active during the task), in addition
to small increases in the magnitude of BOLD signal change per voxel. Similarly,
Cramer et al. (2002) observed activation foci to span both the precentral and
postcentral gyri during repetitive hand-grip contractions at 1 Hz. Contractions
were exerted against a hand-grip dynamometer at three individually defined force
levels: light, medium and hard. These authors found both the activation volume
and the magnitude of the BOLD signal change to increase monotonically with
contraction force.
Four further investigations recorded the BOLD response during well controlled
isometric contractions of the hand/fingers. Three of these studies involved ~5-s
isometric hand-grip contractions performed at 20, 35, 50, 65 and 80%MVF (Dai et
al. 2001), 20-s isometric index finger abductions at 5, 15, 30, 50, and 70%MVF
(van Duinen et al. 2008), or during repeated (0.33 and 0.67 Hz) isometric hand-
grip contractions at 10, 20, 40 and 60%MVF (Ward & Frackowiak 2003). Each of
these three investigations found the magnitude of the BOLD signal to increase
linearly with contraction force at a number of locations in the brain, including the
contralateral sensorimotor cortex and ipsilateral cerebellum in each study.
Alternatively, Keisker et al. (2009) examined the BOLD response to repeated
isometric thumb and forefinger pinching (‘power grip’) at 10, 20 and 30%MVF and
a rate of 0.5 Hz. A task-related increase in BOLD signal was also identified at
several cortical locations, however, only the contralateral primary motor cortex
and ipsilateral cerebellum demonstrated a significant linear relationship with
contraction force.
The rate of motor task execution (specifically, the frequency of finger tapping) has
also been shown to demonstrate a positive linear relationship with
haemodynamic correlates of neuronal activation using both PET (Blinkenberg et
Chapter 1
16
al. 1996) and fMRI (Rao et al. 1996). However, changes in movement rate
inherently involve variations in numerous other motor parameters; including RFD,
acceleration forces, eccentric deceleration forces, and velocity of displacement.
Further investigations are therefore required to extract the relative influence of
these individual parameters. For example, using isometric contractions of distinct
RFDs could isolate the effect of RFD from the parameters related to
displacement.
1.2.4 – Why EEG/MEG?
Without question, BOLD fMRI responses provide an invaluable measure of ‘brain
activity’, with a spatial resolution at the sub-millimetre scale. However, the BOLD
fMRI response reflects the metabolic demands of neuronal activity, with the
haemodynamic responses underpinning the fMRI signal arising as an indirect
consequence of electrical function in brain cells, and it is this electrical function
that is of greater interest as this is the method of communication within the brain.
Cognitive functions are mediated by electrophysiological interactions between
distributed populations of neurons, and in turn these interactions produce local
oscillations in neuronal activity (Donner & Siegel 2011). Electroencephalography
(EEG) and magnetoencephalography (MEG) measure the electric and magnetic
fields that are produced as a direct consequence of this oscillatory activity.
Specifically, these fields arise from synchronous post-synaptic (dendritic) current
flows in concentrated populations of neurons (Proudfoot et al. 2014). Thus, the
recorded EEG/MEG is temporally synched to the underlying electrophysiological
behaviour, and the temporal resolution of EEG/MEG is limited only by the
maximum sampling frequency of the recording hardware; not the physiology of
the response being recorded, as per the haemodynamically derived fMRI (E. Hall
et al. 2014). This means that EEG and MEG are able to record the ongoing
neuro-oscillatory activity within the cortex, as well as any task-driven modulations
in these oscillations.
EEG and MEG (as well as fMRI) are both non-invasive techniques, which is of
obvious benefit to the study of human brain function. However, this also means
that the electrophysiological parameter under estimation (dendritic current flows)
Chapter 1
17
must be inferred from the resultant electric (EEG) and magnetic (MEG) fields as
they appear at the extracranial sites of recording. This projection (forward
modelling) places an inherent limitation on the spatial resolution of EEG/MEG
measurements (Proudfoot et al. 2014). In this regard, MEG offers a significant
advantage compared to EEG as unlike the electric field, the magnetic field is not
distorted by the biological tissues between the cortex and the recording sensors.
Moreover, MEG typically offers a higher signal-to-noise ratio and a greater
number of scalp-based sensors than EEG. Collectively, these factors give MEG
an improved spatial resolution and sensitivity compared to EEG (E. Hall et al.
2014).
EEG does however have its own advantages. EEG sensors may be secured
directly to the scalp of the participant and are therefore less susceptible to noise
arising from head movement than MEG sensor arrays, which are typically housed
in a helmet-shaped dewar. This is of particular advantage when investigating
continuous exercise or motor-related paradigms involving forceful contractions in
large muscle groups, as avoiding head movements can become challenging.
There are also substantial financial benefits to EEG when compared to MEG
systems, both in terms of initial outlay and maintenance costs.
1.2.5 – Oscillatory activity in the sensorimotor cortex
Electrophysiological rhythms were first recorded from the human cortex in the
1920’s by Hans Berger (Berger 1929), who measured differences in electric
potential across the scalp and noted the existence of a 8-13 Hz ‘alpha’ rhythm.
Rhythmic (or oscillatory) activity arises from synchronous neuronal activity and is
typically divided in to frequency bands; based upon early identification of a
particular topographical or biological significance. Commonly identified rhythms
include the delta (~1-4 Hz), theta (~4-8 Hz), alpha (~8-13 Hz), beta (~13-30 Hz)
and gamma (~30-200 Hz) bands. Once considered ‘brain noise’ due to their
presence in states of rest, these oscillations are now regarded as being
functionally significant to brain function, with subtle and focal spatiotemporal
modulations in oscillatory amplitude accompanying stimulus presentation
Chapter 1
18
(Stevenson et al. 2011), attentional shifts (Bauer et al. 2014) and task
performance (Puts et al. 2011).
Within the sensorimotor cortices, two prominent rhythms have received particular
attention; namely the mu (~7-15 Hz) and beta (~15-30 Hz) oscillations, both of
which are consistently observable at rest, and demonstrate time-locked
modulations in response to movement-related behaviours. Jasper & Penfield
(1949) first demonstrated the decrease in amplitude of the Rolandic beta rhythm
during the preparation and performance of hand and finger movements using
intracortical recordings from the pre-central gyrus. A concurrent blocking of the
mu rhythm was also identified in the following decade, along with a transient
increase in the beta oscillations following movement termination (Chatrian et al.
1959). These phenomena have since become part of a coherent description of
voluntary contraction-driven modulations in ongoing oscillatory activity. During the
preparation and execution phases of unilateral movements, a decrease in mu
and beta amplitude is observed, with the largest effect occurring local to
contralateral primary sensorimotor cortex (Salmelin & Hari 1994; Leocani et al.
1997). Following movement cessation beta oscillations then exhibit a period of
elevated amplitude (Pfurtscheller et al. 1996; Jurkiewicz et al. 2006).
These movement-related changes in sensorimotor oscillations are extremely
robust across individuals. In addition, beta band amplitude changes are observed
even in the absence of active muscle contraction (e.g. during passive movements
(Cassim et al. 2001)), or the absence of movement altogether (e.g. during motor
imagery (Schnitzler et al. 1997; Pfurtscheller et al. 2005)). This robustness has
been to the advantage of neuroscientific applications; for example, brain
computer interfaces involving real-time measures of movement-related changes
in oscillatory amplitude (Pfurtscheller & Solis-Escalante 2009).
Recent work also suggests that task-related modulations in oscillatory rhythms,
both during and after stimulation, have great potential to be used as a biomarker
for pathology. For example, the beta rebound response following contraction
offset is greater in healthy controls than patients with schizophrenia, and the
magnitude of beta rebound in patients correlates with persistent symptoms of
disease (Robson et al. In Press). Additionally, the extent of interhemispheric
Chapter 1
19
disparity in sensorimotor beta oscillations correlates with symptom severity during
early stage Parkinson’s disease (S. Hall et al. 2014). Understanding sensorimotor
oscillations and their modulation with motor-action might therefore be of
significant value to a range of fields within human function and health. Despite
this, mu and beta band changes remain relatively poorly understood. In particular,
how these oscillatory phenomena might be modulated with the parameters of a
motor task (e.g. contraction force) has received only a modicum of attention.
A note on Terminology:
Mu oscillations are a sensorimotor rhythm, similar in frequency to alpha
oscillations reported elsewhere in the cortex. Consequently, the term ‘alpha’ has
often been used in place of ‘mu’, particularly in studies utilising EEG, in which the
limited spatial resolution may not have allowed for accurate distinction of mu
oscillations. (In fact, where spatial resolution/precision is limited, ‘alpha’ might
arguably be a more appropriate term as recordings may encompass both the mu
rhythm and the more pervasive alpha rhythms of the cortex, which tend to be of
greater amplitude (Kozelka & Pedley 1990)). However, it is important to note that
these terms are not interchangeable but instead relate to separate phenomena.
The mu rhythm is spatially distinct from the most prominent alpha rhythms e.g.
the occipital alpha rhythm, arising locally in the pre- and post-central areas of the
sensorimotor cortex (Jasper & Andrews 1938; Chatrian et al. 1959). Moreover,
several mu rhythms may be observed that are topographically mapped to specific
regions of the motor/sensory homunculus (Pineda 2005). The mu rhythm also
differs from alpha rhythms in its reactivity to various tasks, most notably; a
decrease in mu amplitude accompanies motor activity/somatosensory processing,
and mu amplitude is unaffected by closing the eyes (as opposed to an increased
amplitude of the occipital alpha rhythm) (Kozelka & Pedley 1990). More
importantly, this spatial separation and differing reactivity indicates a functional
specificity of the mu rhythm. Decreases in synchronous rhythms are widely
believed to reflect an increase in local information processing. Thus, a decreases
in mu amplitude is likely to relate to an increase in motor/somatosensory
processing. Specifically, it has been suggested that changes in mu amplitude
Chapter 1
20
may be involved in the translation of perception to action, possibly arising locally
as a down-stream effect of mirror neuron input (see Pineda 2005). Finally, the mu
rhythm is often difficult to observe in the time domain, due in part to the spatially
overlapping Rolandic beta rhythm that is commonly of greater amplitude, but the
mu rhythm can be distinguished by its unique profile; that of a recurring mu (µ).
In the following discussions, the terminology used by the specific study under
reference is adopted in each circumstance.
1.2.6 – Sensorimotor activity and force production: Functional neuroimaging using EEG
A handful of previous studies have investigated the relationship between
sensorimotor oscillatory activity and voluntary contraction force. Some indications
that contraction-driven changes in oscillatory amplitude might be modulated by
the force output of the performed contractions have been reported. Mima et al.
(1999) recorded surface EEG from the hand area of the contralateral
sensorimotor cortex (FC3 and C3 electrodes, International 10-20 System) during
isometric ‘pinching’ of a force transducer using the right thumb and little finger.
The magnitude of the reductions in alpha (8-12.9 Hz) power during the constant-
force contractions was linearly related to force during isometric contractions of
between 10 and 60%MVF (i.e. greater reductions in alpha power during
contractions of higher forces). In contrast, no significant change in either lower
beta (13-20.9 Hz) or upper beta (21-30.9 Hz) power was observed between
contraction forces. In a separate study, Dal Maso et al. (2012) recorded surface
EEG from the vertex (Cz electrode) during both isometric knee extension and
flexion. Contractions were performed at 20, 40, 60 and 80% of the “relative
maximum voluntary torque” (the maximal achievable torque level without holding
breath or contracting muscles not associated with knee flexion/extension). In
contrast to Mima et al. (1999), these authors found the magnitude of the
contraction-driven reductions in upper beta (21–31 Hz) power were linearly
related to isometric knee flexion torque in their strength trained participant group.
However, no torque-related modulations in beta power loss were identified during
knee flexion performed by endurance trained participants, or during knee
Chapter 1
21
extensions performed by either strength or endurance trained participants. In
other words, the majority of their findings would indicate no change in beta power
loss with contraction force. Overall, findings within the literature are inconsistent,
and reports indicating that contraction-driven power loss in both the mu and beta
bands are independent of contraction force are equally as prevalent within the
literature.
Stančák et al. (1997) recorded surface EEG (electrode C3 or a separate
electrode positioned 2.5 cm medial to C3) throughout a series of brisk (0.13 to
0.21 s duration) index finger extensions against an external load of 0, 30, 80, or
130 g. Contraction-driven reductions in both mu (8-13 Hz) and beta (14-30 Hz)
power were observed, peaking during the performance of the brief movements,
however the magnitude of these peaks were not modulated by the load opposing
the contractions. Similarly, Cremoux et al. (2013) recorded surface EEG
(electrode C3) during isometric elbow flexion contractions at 25, 50 and 75% of
relative maximum torque, and found no effect of contraction torque on beta (13–
31 Hz) power loss.
These latter two studies also recorded the PMBR following contraction offset,
however findings were once again inconsistent. Stančák et al. (1997) observed a
two-phase PMBR with peaks observed in the first and third second of the post-
movement period. The magnitude of this second peak was greater following the
brief finger extensions performed against the heaviest external load (130 g)
compared to the unloaded extensions. Conversely, Cremoux et al. (2013) found
no effect of contraction force on the amplitude of the PMBR following the
isometric elbow flexor contractions at 25, 50 and 75% of relative maximum torque.
The cause of these dichotomous results is not clear; however, motor parameters
other than force output during the anisometric contractions (e.g. the RFD) may
have contributed to the modulation of PMBR in the study of Stančák et al. (1997).
Further investigations are therefore required to elucidate whether these
movement-related changes in oscillatory amplitude might be modulated by the
motor parameters of the performed contractions. In particular, using isometric
contractions would enable the force and RFD of contractions to be isolated as
independent variables.
Chapter 1
22
1.3 – The effect of physical fatigue on sensorimotor cortex activity
1.3.1 – Background
Physical fatigue can be defined as a reversible decline in the force generating
capacity of the neuromuscular system. During physical activity, fatigue arises not
only from peripheral processes within the working muscle but also from
supraspinal mechanisms within the brain (Gandevia 2001). Overall, fatigue has
clear implications to physical performance, and may be experienced as a chronic
activity-limiting symptom that adversely affects the quality of life in numerous
patient groups. However, exactly how cortical activity is modulated during fatigue
is not well understood. This is in large part due to the difficulties in accurately
recording brain activity in humans, particularly during strenuous muscle
contractions.
1.3.2 – Evidence for a supraspinal contribution to physical fatigue
Voluntary activation is a measure of how well a subject can drive a muscle (or
muscle group) to produce maximal force (Taylor et al. 2006), and is described
relative to the capacity for force production of that muscle. It is most commonly
estimated using twitch interpolation (Merton 1954), which involves recording the
evoked twitch response following stimulation of the motor pathway to the
contracting muscle. Commonly this involves transcutaneous electrical stimulation
of the motor nerve (Belanger & McComas 1981; Allen et al. 1998) or transcranial
magnetic stimulation (TMS) of the motor cortex (Gandevia et al. 1996; Todd et al.
2004) during the performance of an MVC. If a superimposed twitch response is
evoked by the stimulus, voluntary activation is less than 100%. (Even when
unfatigued, subjects are rarely able to achieve 100% activation (Todd et al.
Chapter 1
23
2003)). This means that no part of the motor pathway downstream of the point of
stimulation can be operating at its capacity. Or put another way, a failure to drive
the muscle maximally has occurred, and can be attributed to processes occurring
upstream of the site of stimulation. When a submaximal voluntary activation is
determined using TMS applied to the motor cortex; this failure to drive the muscle
maximally has originated within or upstream of the motor cortex (Gandevia et al.
1996). During fatiguing exercise voluntary activation has been shown to decrease
despite the efforts of the subjects to perform a maximal contraction. Again, in the
example of TMS applied to the motor cortex; this decrease in voluntary activation
demonstrates a progressive sub-optimal output of the motor cortex. This process
is termed supraspinal fatigue (Taylor et al. 2006).
Supraspinal fatigue (as evidenced by a progressive decline in voluntary activation
calculated using TMS applied to the motor cortex) has been demonstrated to
occur in a variety of motor paradigms; including sustained isometric contractions
at both high and low force outputs (Taylor & Gandevia 2008), intermittent MVCs
(Taylor et al. 2000) and following locomotor exercise (ergometer cycling) (Sidhu
et al. 2009; Goodall et al. 2012). During a sustained isometric maximal
contraction, supraspinal fatigue accounts for approximately 22-30% of the decline
in force occurring in the first two minutes (Taylor et al. 2006). Alternatively,
supraspinal fatigue may account for 40% of the physical fatigue developed during
a 43-min isometric contraction of the right elbow flexors at 15%MVF (Søgaard et
al. 2006), or as much as 66% during a 70-min 5%MVF contraction of the same
muscle group (Smith et al. 2007). Overall, these studies demonstrate that during
physical fatigue in a variety of tasks, some of the changes that lead to a decline
in force output of the muscles take place at a supraspinal level, i.e. within the
brain.
1.3.3 – The effect of physical fatigue on sensorimotor activity: Investigations using fMRI
Several studies have used fMRI to observe the patterns of ‘cortical activation’
accompanying the performance of a fatiguing motor task. A number of these
studies found increases in the fMRI signal as fatigue developed during the
Chapter 1
24
prolonged performance of (at least initially) submaximal voluntary contractions.
Liu et al. (2003) recorded the fMRI response (number of activated voxels) during
the performance of two separate fatiguing motor tasks: a continuous 225-s
unilateral handgrip contraction at 30% maximal force and a series of 320 2-s
handgrips of the same intensity (67% duty cycle). An initial increase, followed by
a plateau or marginal decrease in the number of activated voxels within the
contralateral primary motor and sensory cortices was observed in both paradigms.
In contrast, Benwell et al. (2007) found an increase in the magnitude of the BOLD
response but not the number of activated voxels within the contralateral
sensorimotor cortex during a comparable motor task; ~9 min of intermittent 3-s
handgrip contractions at 30% maximal force (60% duty cycle).
In a similar study, van Duinen et al. (2007) recorded the BOLD fMRI response
during a series of fifteen 50-s isometric abductions of the right index finger at 30%
maximal force (91% duty cycle). Increases in both the intensity and area of
activation were observed in a number of cortical areas including the contralateral
sensorimotor cortex during the development of fatigue. However, in a separate
experiment involving constant-force contractions at distinct force levels performed
in an unfatigued state, increases in both the intensity and area of the BOLD
response were again identified, this time with increments in contraction force (van
Duinen et al. 2007). Subsequently, these authors suggested that the increases in
the fMRI response within the sensorimotor cortex during the development of
fatigue may represent a correlate of muscle activity, as additional motor units are
recruited in order to maintain the prescribed force output.
However, augmentations in the fMRI signal have also been demonstrated to
accompany fatigue onset during maximal contractions. For example, Liu et al.
(2002) found a number of cortical regions, including the contralateral primary
motor and sensory cortices, to demonstrate a marked increase in activated voxel
volume throughout the first minute of a 2-min handgrip MVC, after which the
number of activated voxels decreased back towards initial levels. This fMRI
response profile was in no way a correlate of either contraction force or EMG
activity, both of which decreased continuously throughout the maximal effort.
Similarly, Steens et al. (2012) found the magnitude of the BOLD response within
both the left precentral and postcentral gyri to increase throughout a 124-s
Chapter 1
25
maximal right index finger abduction in a cohort of twenty healthy adults (a
separate group of Multiple Sclerosis patients demonstrated some alternate
responses). Again, this increase in cortical activation accompanied a progressive
decrease in both force and EMG amplitude. Therefore, these increases in the
fMRI signal cannot represent a simple correlate of increased corticospinal output
to the motor unit pool.
One further study by Post et al. (2009) demonstrated a gradual increase in both
the volume of activated sensorimotor cortex and the mean BOLD signal per
volume during a 126-s maximal abduction of the right index finger. These authors
also found an increase in EMG activity in the wrist-flexor muscles over the course
of the contraction, and suggested that the increase in the volume of activated
cortex may represent the activation of non-target muscles as participants
endeavour to maintain a maximal torque. Conversely, the increase in the
magnitude of the BOLD response during fatigue was suggested to reflect local
increases in motor/sensory processing of both inhibitory and excitatory neuronal
inputs. Indeed supraspinal fatigue is a complex process involving numerous
inhibitory and excitatory networks, which interact to regulate corticospinal output
(Tanaka & Watanabe 2012). Consequently, a comprehensive analysis of
neuronal activity during physical fatigue cannot be achieved using fMRI alone.
1.3.4 – The effect of physical fatigue on sensorimotor activity: Investigations using MEG
To date, few attempts have been made to determine whether movement-related
oscillatory dynamics (e.g. beta amplitude decrease) within the sensorimotor
cortex are modified during physical fatigue. Tecchio et al. (2006) recorded MEG
during submaximal voluntary contractions of the extensor communis digitorum,
performed before and after a maximal contraction of the same muscle held until
volitional exhaustion. These authors reported that the contraction-driven
reductions in beta amplitude were no longer observed within the contralateral
sensorimotor cortex following the fatiguing MVC; potentially suggesting a
substantial effect of fatigue on the typical patterns of motor-related oscillatory
behaviour. However, a number of methodological concerns should perhaps be
Chapter 1
26
considered before any firm conclusions can be drawn from these results. Firstly,
no control trial was performed, and attenuation in beta amplitude loss may occur
as a consequence of task habituation during the early phases of task repetition
(Kranczioch et al. 2008; Studer et al. 2010; Pollok et al. 2014). Additionally, no
attempt to actually measure physical fatigue was made following the maximal
contraction. And finally, the submaximal contractions appeared to be poorly
controlled, with the force of contractions described as “about 20-35% MVC”. As
such, further investigation appears warranted before the observed abolition of the
contraction-driven beta amplitude loss can be wholly attributed to the assumed
state of physical fatigue following the prolonged contraction. Yet, to the author’s
knowledge, no investigations have made any attempt to corroborate these
findings. One further study by Tanaka et al. (2011) did find a reduction in beta
amplitude loss within the contralateral sensorimotor cortex during mental imagery
of handgrip MVCs following a fatiguing intermittent handgrip exercise performed
until task failure. However, imagined movements do not involve the same motor
or sensory processing as performed movements (Schnitzler et al. 1997), and may
be affected differently by physical fatigue.
1.4 – Summary and Aims
1. The recruitment of skeletal muscle involves both supraspinal and
peripheral inputs to the motor unit pool. Excitatory input from Ia afferents
have been demonstrated to assist in the recruitment of high threshold
motor units (Bongiovanni et al. 1990), and the achievement of maximal
motor unit firing rates (Hagbarth et al. 1986; Macefield et al. 1993).
However, whether maximal force development is dependent on these
inputs is not clear. Prolonged tendon vibration can moderate the efficacy
of the homonymous Ia afferent-α-motoneuron pathway (Desmedt &
Godaux 1978). Consequently, this technique has been used to assess
maximal force production in conditions of impaired Ia afferent-α-
Chapter 1
27
motoneuron transmission; with contrasting results being reported
(Ushiyama et al. 2005; Ekblom & Thorstensson 2011). Therefore, the aim
of chapter 2 was to further investigate the effect of prolonged tendon
vibration on maximal and explosive force production in the knee extensors.
2. A linear relationship between voluntary contraction force and the BOLD
fMRI response within the contralateral sensorimotor cortex has been
demonstrated by a number of studies (Dai et al. 2001; van Duinen et al.
2008; Keisker et al. 2009). However, the BOLD fMRI response reflects the
metabolic demands of neuronal activity, with the haemodynamic
responses underpinning the fMRI signal arising as an indirect
consequence of the electrophysiological interactions underpinning
cognitive function. EEG and MEG measure the electric and magnetic fields
that are produced as a direct consequence of this electrophysiological
activity. Consequently, these techniques have been instrumental in
constructing a coherent description of neuro-oscillatory responses to
voluntary muscle contractions. This includes contralaterally preponderant
decreases in sensorimotor mu and beta amplitude during contractions,
followed by a post-movement rebound in beta amplitude (Pfurtscheller &
Lopes da Silva 1999; Jurkiewicz et al. 2006). However, whether these
phenomena are modulated with the various motor parameters of the
performed contraction is still unclear. Force-related modulations in the
contraction-driven mu amplitude loss (Mima et al. 1999), beta amplitude
loss (Dal Maso et al. 2012), and the PMBR (Stančák et al. 1997) have all
been suggested, however results are inconsistent in each case.
Subsequently, chapters 3 and 4 aimed to investigate the influence of
voluntary contraction force and RFD (chapter 4 only) on sensorimotor
oscillatory dynamics using EEG and MEG, respectively.
3. During physical activity, fatigue arises not only from peripheral processes
within the working muscle but also from supraspinal mechanisms within
the brain. However, exactly how sensorimotor cortex activity is modulated
Chapter 1
28
during physical fatigue is poorly understood. Increases in the BOLD fMRI
signal within the sensorimotor cortex have been demonstrated during
fatiguing contractions; reflecting local increases in sensorimotor
processing, despite concurrent decreases in corticospinal output.
Additionally, one previous study (Tecchio et al. 2006) reported that a
contraction-driven beta amplitude loss was no longer observed during
submaximal contractions of the extensor communis digitorum following a
fatiguing maximal contraction of the same muscle. This investigation might
demonstrate a potential effect of fatigue on the typical movement-related
oscillatory dynamics described above; however, few investigations have
attempted to corroborate these results. The aim of chapter 5 was therefore
to investigate how ongoing oscillatory activity within the sensorimotor
cortex might be influenced by physical fatigue.
Chapter 2:
Prolonged infrapatellar tendon vibration
does not influence quadriceps maximal
or explosive isometric force production
in man
Chapter 2
30
2.1 – Abstract
The influence of muscle/tendon vibration on maximal muscle performance is
unclear. Therefore, this study examined the effect of a prolonged tendon vibration
stimulus on maximum voluntary contraction (MVC) and explosive voluntary
contraction (EVC) performance. Eighteen young healthy males (nine strength
trained and nine untrained) completed a series of isometric unilateral knee-
extensions (EVCs, electrically evoked octet responses, MVCs, ramp contractions)
pre and post two separate 30-min intervention trials; infrapatellar tendon vibration
(80 Hz), and quiet sitting (control). Hmax and Mmax was measured at the start and
end of each series of contractions, both pre and post intervention (i.e. at four time
points). Knee extensor force and both quadriceps and hamstrings EMG were
measured throughout each series of contractions. The results show vibration had
no effect on either maximum force (ANOVA, trial × time interaction P=0.92),
explosive force (P≥0.36), or the associated agonist EMG amplitude during these
tasks (P≥0.23). Octet responses (8 supramaximal pulses at 300 Hz) were also
unaffected by vibration (P≥0.39). Conversely, post-intervention Hmax/Mmax was 60%
lower in the vibration trial vs. control, and remained 38% lower at the end of the
post-intervention measurements (t-test, both P<0.01). Individual Hmax/Mmax
depression did not correlate to changes in either maximum or explosive force
(Spearman’s Rank, P≥0.54), and training status had no influence on the effect of
vibration. In conclusion, prolonged infrapatellar tendon vibration depressed H-
reflex amplitude but did not affect either maximal or explosive isometric force
production of the quadriceps.
Chapter 2
31
2.2 – Introduction
During voluntary contractions of the skeletal muscles, the monosynaptic Ia
afferent-α-motoneuron reflex pathway has been suggested to contribute to the
recruitment of high threshold motor units (Bongiovanni et al. 1990), and to the
achievement of high motor unit firing rates (Hagbarth et al. 1986; Macefield et al.
1993). Prolonged mechanical vibration applied the muscle-tendon unit can
attenuate the efficacy of Ia afferent-α-motoneuron transmission; which may occur
via a number of mechanisms including increased presynaptic inhibition at the Ia
terminals (Hultborn et al. 1987; Lapole et al. 2012), or a neurotransmitter
depletion at the Ia synapses (Curtis & Eccles 1960; Hultborn et al. 1996).
Accordingly, a compromised capability for maximal force production has been
reported following prolonged vibration stimulus applied to either the muscle
(Kouzaki et al. 2000; Jackson & Turner 2003) or tendon (Ushiyama et al. 2005;
Konishi et al. 2009). However, only two previous investigations (Ushiyama et al.
2005; Ekblom & Thorstensson 2011) have made any attempt to assess the
efficacy of the Ia afferent-α-motoneuron pathway (using H-reflex measurements;
see Methods) alongside strength measurements following a prolonged vibration
stimulus to the muscle tendon unit. Both of these studies demonstrated a
decrease in triceps surae H-reflex of 31%, following 30-min of Achilles tendon
vibration, but while Ushiyama et al. (2005) observed a 17% decrease in peak
plantar-flexor torque, Ekblom and Thorstensson (2011) found no difference in
plantar-flexor strength.
Explosive force production can be defined as the capability to increase contractile
force from a low or resting level (Folland et al. 2013). It is considered integral to
the performance of tasks where the time available to develop force is limited,
including explosive athletic events such as jumping and sprinting (Pääsuke et al.
2001; Tillin, Pain, et al. 2013), or stabilizing the musculo-skeletal system in
response to mechanical perturbation. The influence of a prolonged localised
vibration on explosive force production has only been examined by two studies,
both of which found marked decreases in knee extensor peak rate of force
development (RFD; ~24% (Kouzaki et al. 2000); 33% (Jackson & Turner 2003)).
The greater changes in explosive than maximal force production (2-5 fold greater)
in these studies could indicate a greater effect of vibration on explosive
Chapter 2
32
contractions compared to maximal force tasks, and potentially a greater afferent
contribution to explosive actions. However, these studies did not assess the H-
reflex response to vibration or the possible mechanisms for the purported
reduction in explosive force (i.e. alterations in neuromuscular activation or
contractile properties of the muscle). The maximum contractile capacity of the
muscle-tendon unit for explosive force production can be assessed by measuring
the force response to evoked octet contractions (a train of 8 supramaximal
electrical impulses applied at 300 Hz over the mixed nerve innervating the
muscle under investigation; de Ruiter et al. 1999; Deutekom et al. 2000). It is also
interesting to note that whole-body vibration has been shown not to influence
explosive force production (de Ruiter et al. 2003; Erskine et al. 2007; Hannah et
al. 2013) despite minor attenuations in maximum force production in some
reports (de Ruiter et al. 2003; Erskine et al. 2007).
Chronic neural adaptations have been widely documented following strength
training and may include more effective use of afferent feedback during strength
tasks (Folland & Williams 2007). Earles et al. (2002) found power trained athletes
had lower presynaptic inhibition, and suggested these individuals may benefit
from a greater utilisation of the fusimotor pathway, particularly during explosive
force production. Furthermore, improvements in peak RFD after resistance
training have been found to correlate with increases in H-reflex amplitude
(Holtermann et al. 2007), and this could indicate that alterations in the efficacy of
the Ia afferent-α-motoneuron pathway influences explosive force production. The
relative importance of the Ia afferent-α-motoneuron pathway to maximal motor
performance might therefore be further explored by comparing the effect of a
prolonged tendon vibration stimulus on explosive force production between
strength trained and untrained individuals.
The primary aim of this study was to investigate the influence of a prolonged
infrapatellar tendon vibration intervention, on maximal and explosive knee
extensor force production. Secondary aims were to examine whether any post-
vibration changes in volitional force production resulted from neural or contractile
mechanisms, determine if individual changes in H-reflex following vibration were
related to the alterations in maximal or explosive force production, and whether
the effects of vibration differed between strength trained and untrained
Chapter 2
33
participants. A decrease in maximal and explosive force production,
neuromuscular activation and H-reflex amplitude after prolonged tendon vibration
were hypothesised.
2.3 – Methods
Participants
Participants were eighteen healthy, injury-free males, with no known history of
neuromuscular or skeletal disorders. The cohort comprised nine strength trained
and nine recreationally active, but not systematically trained participants. The
strength trained individuals (age 20 ± 2 years, stature 1.83 ± 0.08 m, body mass
85.2 ± 13.5 kg, (mean ± SD)) included five track and field athletes and four
intermittent sports athletes who were accustomed to performing regular strength
training and explosive power activities (4 to 10 strength/power sessions per week
for at least 3 years) in their habitual training. The untrained individuals were
recreationally active but not involved in competitive sports, or strength/power
training (age 22 ± 2 years, stature 1.81 ± 0.08 m, body mass 76.7 ± 10.0 kg). The
experimental procedures were approved by the Loughborough University Ethical
Advisory Committee, and each participant provided written informed consent prior
to their involvement.
Experimental design
Participants visited the laboratory on four occasions, ~7 days apart, and at a
consistent time in the afternoon. The first two visits served as familiarisation with
participants performing all of the experimental measurements during both
sessions. Participants did not experience tendon vibration during familiarisation.
The third and fourth visits comprised a randomised cross-over design, with a
series of voluntary and electrically evoked unilateral isometric contractions of the
knee extensors of the dominant leg performed pre and post either; a 30-min
period of vibration to the ipsilateral infrapatellar tendon (vibration trial), or 30 min
Chapter 2
34
of quiescent sitting (control trial). The knee extension contractions were designed
to assess volitional function as well as neural (via EMG) and contractile (via
evoked responses) mechanisms for any change in function and included;
explosive voluntary contractions (EVC), evoked octet contractions (to determine
the muscle’s maximum capacity for explosive force production), maximal
voluntary contractions (MVC), and ramp contractions to evaluate the EMG-force
relationship. To assess the influence of the measured contractions, as well as the
interventions, on the amplitude of the maximal H-reflex, all H-reflex and M-wave
responses were recorded at both the start and end of each volitional and evoked
contractions series, with the whole procedure repeated pre- and post-intervention.
The timing of experimental measurements was strictly controlled as detailed in
Table 2.1. Participants were advised to abstain from strenuous or atypical
exercise for 36 h prior to the experimental trials, and to avoid the intake of
nutritional stimulants (e.g. caffeine) on the day of the trial. Participants were also
blinded from the hypothesised effects of the tendon vibration until after the final
trial was completed.
The knee-extensors were investigated as this is an important locomotory muscle
group with a mixed muscle fibre composition that provides an effective model for
measurements of explosive force production. Furthermore previous studies of
explosive force production following vibration have used this muscle group
(Jackson & Turner 2003; Kouzaki et al. 2000); and H-reflex recordings from the
VM demonstrate good within-session reliability (Hmax/Mmax ICC, 0.92; Folland et al.
(2008)).
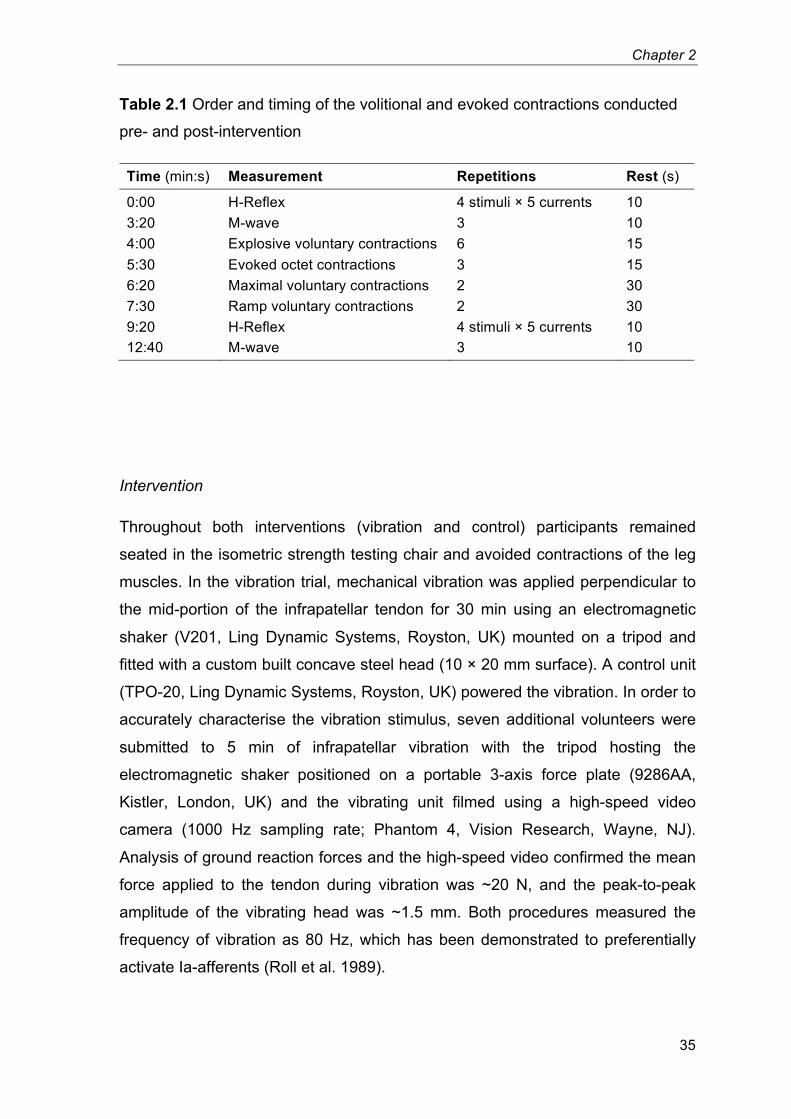
Chapter 2
35
Table 2.1 Order and timing of the volitional and evoked contractions conducted
pre- and post-intervention
Time (min:s) Measurement Repetitions Rest (s)
0:00 H-Reflex 4 stimuli × 5 currents 10
3:20 M-wave 3 10
4:00 Explosive voluntary contractions 6 15
5:30 Evoked octet contractions 3 15
6:20 Maximal voluntary contractions 2 30
7:30 Ramp voluntary contractions 2 30
9:20 H-Reflex 4 stimuli × 5 currents 10
12:40 M-wave 3 10
Intervention
Throughout both interventions (vibration and control) participants remained
seated in the isometric strength testing chair and avoided contractions of the leg
muscles. In the vibration trial, mechanical vibration was applied perpendicular to
the mid-portion of the infrapatellar tendon for 30 min using an electromagnetic
shaker (V201, Ling Dynamic Systems, Royston, UK) mounted on a tripod and
fitted with a custom built concave steel head (10 × 20 mm surface). A control unit
(TPO-20, Ling Dynamic Systems, Royston, UK) powered the vibration. In order to
accurately characterise the vibration stimulus, seven additional volunteers were
submitted to 5 min of infrapatellar vibration with the tripod hosting the
electromagnetic shaker positioned on a portable 3-axis force plate (9286AA,
Kistler, London, UK) and the vibrating unit filmed using a high-speed video
camera (1000 Hz sampling rate; Phantom 4, Vision Research, Wayne, NJ).
Analysis of ground reaction forces and the high-speed video confirmed the mean
force applied to the tendon during vibration was ~20 N, and the peak-to-peak
amplitude of the vibrating head was ~1.5 mm. Both procedures measured the
frequency of vibration as 80 Hz, which has been demonstrated to preferentially
activate Ia-afferents (Roll et al. 1989).
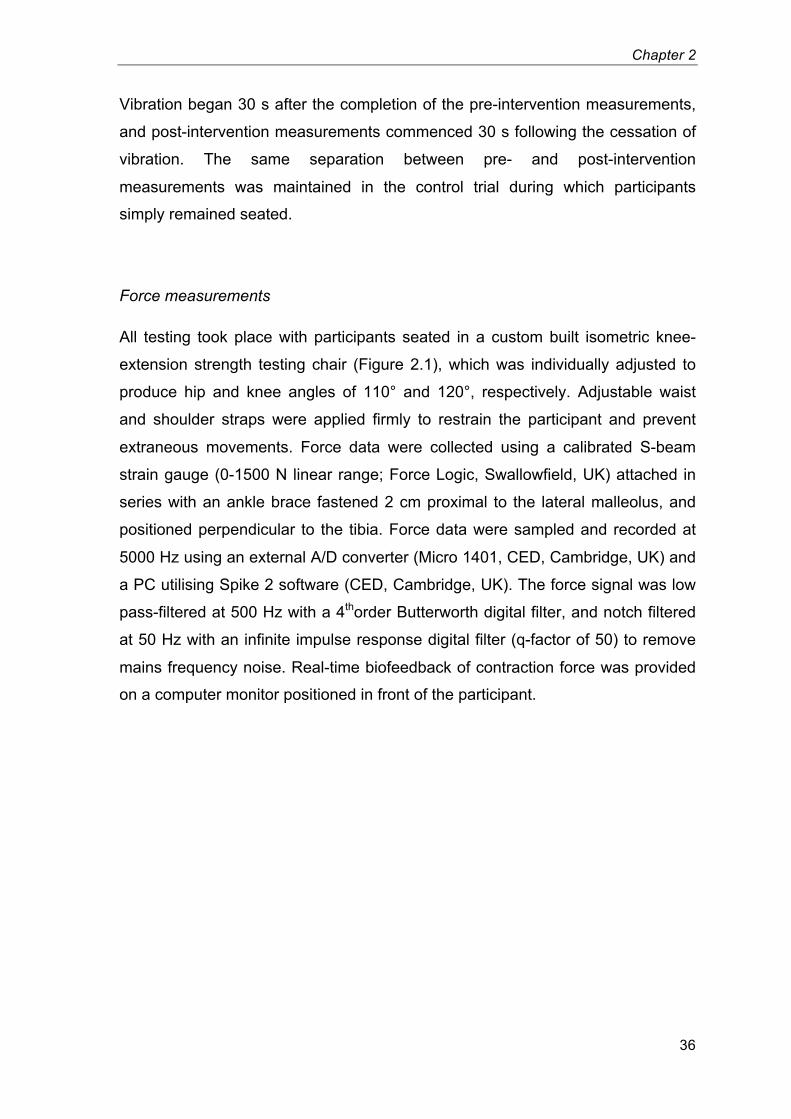
Chapter 2
36
Vibration began 30 s after the completion of the pre-intervention measurements,
and post-intervention measurements commenced 30 s following the cessation of
vibration. The same separation between pre- and post-intervention
measurements was maintained in the control trial during which participants
simply remained seated.
Force measurements
All testing took place with participants seated in a custom built isometric knee-
extension strength testing chair (Figure 2.1), which was individually adjusted to
produce hip and knee angles of 110° and 120°, respectively. Adjustable waist
and shoulder straps were applied firmly to restrain the participant and prevent
extraneous movements. Force data were collected using a calibrated S-beam
strain gauge (0-1500 N linear range; Force Logic, Swallowfield, UK) attached in
series with an ankle brace fastened 2 cm proximal to the lateral malleolus, and
positioned perpendicular to the tibia. Force data were sampled and recorded at
5000 Hz using an external A/D converter (Micro 1401, CED, Cambridge, UK) and
a PC utilising Spike 2 software (CED, Cambridge, UK). The force signal was low
pass-filtered at 500 Hz with a 4thorder Butterworth digital filter, and notch filtered
at 50 Hz with an infinite impulse response digital filter (q-factor of 50) to remove
mains frequency noise. Real-time biofeedback of contraction force was provided
on a computer monitor positioned in front of the participant.
Chapter 2
37
Figure 2.1 The isometric knee extension strength testing chair used for all
measurements and both interventions (main), and the position of the vibrator on
the infrapatellar tendon (inset).
Electromyography measurements
Surface EMG was recorded using two Delsys Bagnoli-4 acquisition systems
(Delsys, Boston, MA). Following shaving, gentle abrasion and cleansing with
ethanol, two double differential bar electrodes (10 mm inter-electrode distance;
Bagnoli DE-2.1, Delsys, Boston, MA) were positioned over each of the superficial
muscles of the quadriceps at specific percentages of thigh length (greater
trochanter to lateral knee joint centre distance) from the superior border of the
patella as follows: vastus medialis, 35% and 25%; vastus lateralis, 55% and 45%;
and rectus femoris, 65% and 55%. The proximal and distal electrodes on each
muscle were offset laterally and medially, respectively, from the longitudinal mid-
Chapter 2
38
line of the muscle belly by ~10 mm, and aligned parallel to the presumed
orientation of the muscle fibres. One electrode was placed over the midline of the
muscle belly of both the semitendinosis and biceps femoris long head of the
hamstrings (HAM), 45% of thigh length from the popliteal fossa. A reference
electrode was situated over the patella of the same leg.
The EMG signals were amplified (×1000; differential amplifier, 20–450 Hz),
sampled at 5000 Hz and synchronised with the force data using the same data
acquisition equipment. EMG signals were later band-pass filtered at 6-500 Hz
with a 4th order Butterworth digital filter, and a 100 Hz infinite impulse response
digital notch filter was applied to selected recordings where appropriate, prior to
further analyses. Note: this notch filter was required due to noise generated by
the steel frame of the knee extension rig as opposed to a poor impedance
matching of differential electrodes. It was later found that grounding the frame of
the rig was effective in removing (or greatly reducing) the presence of the 100 Hz
noise.
The distal vastus medialis (VMd, 25% of thigh length from the patella) EMG was
used to assess H-reflex and these responses were normalised to Mmax (see
Electrical stimulation) from the same recording site. Volitional EMG from each of
the 6 agonist muscle recording sites were normalised to Mmax (of the same site)
recorded at the start of the contractions series, before an average was calculated
for the six sites (QUAD).
Electrical stimulation
Transcutaneous electrical stimulation was applied to the femoral nerve in the
femoral triangle. The anode (70 × 100 mm carbon rubber electrode; Electro-
Medical Supplies, Greenham, UK) was coated in electrode gel and positioned
over the greater trochanter. A custom adapted cathode (10 mm diameter,
protruding 20 mm from a 35 × 55 mm plastic base; Electro-Medical Supplies,
Greenham, UK) was positioned according to the optimal twitch-response from a
small stimulus current and secured in place using tape. Electrical stimuli were 1-
ms square wave pulses, delivered by a constant current variable voltage
Chapter 2
39
stimulator (DS7AH, Digitimer Ltd, Welwyn Garden City, UK), triggered via Spike2.
Stimuli were separated by 10 s to minimise post activation depression (Crone &
Nielsen 1989). Participants were also instructed to fix their gaze directly ahead,
and avoid movements of the body, head and jaw so as to minimise Jendrassik
facilitation (Kameyama et al. 1989). All stimulation was applied with the leg
muscles relaxed.
H-reflex
The H-reflex is considered the electrical analogue of the mechanically induced
stretch reflex, although it bypasses the influence of the muscle spindle and
gamma motoneurons (Schiepatti et al. 1987). H-reflex measurements therefore
provide an assessment of the efficacy of the monosynaptic Ia afferent-α-
motoneuron pathway, which the vibration intervention was designed to perturb.
The H-reflex is a well established technique with studies reporting high intra-
session and inter-session reliability in a number of muscles including the vastus
medialis (Hopkins & Wagie 2003).
Once seated in the strength rig, with EMG and stimulating electrodes in place, a
stimulus-response calibration curve was conducted to establish the stimulus
currents for eliciting H-reflex and Mmax responses in the proceeding trial. Current
increments varied widely depending on individual responses; ranging from 0.3 to
2.0 mA during H-reflex responses (~15 currents, 3 stimuli per current), before
increasing in larger increments once M-wave amplitude had superseded that of
the H-reflex response. Stimulus current increased until a plateau in both M-wave
and twitch force responses were observed. Five separate currents for eliciting H-
reflex responses were selected; ranging from the shoulder of the ascending limb
on the response-curve (judged by visual inspection) to the emergence of an M-
wave, with three intermediate stimulus currents evenly spaced in between. Mmax
were evoked using supramaximal stimuli, 25% above that required to achieve a
plateau in M-wave responses.
The duration of reflex depression following vibration could be influenced by the
volitional activity involved in performing maximal strength tasks. Therefore, H-
Chapter 2
40
reflex measurements were repeated following functional performance measures
in order to establish whether reflex depression persisted throughout these tasks.
Measurements of H-reflex amplitude are often made at a current intensity that
generates a specific motor response (e.g. 10-20% Mmax) to ensure stability of
the input stimulus. However, a disproportionate change in the excitability of the
afferent axons (relative to efferent axons) following repetitive spindle activation
during vibration could invalidate this method. H-reflex responses were therefore
elicited at five current intensities to safeguard against possible lateral shifts in the
response curve, and to capture Hmax. H-reflex responses were also measured at
rest. The primary objective of the present investigation was to determine the
effects of vibration on maximal volitional performance (i.e. MVC & EVC) and
therefore sustained volitional contractions for extended periods during H-reflex
recordings were avoided in order to prevent fatigue that might compromise the
primary functional measurements. The current authors presume that similar
considerations led to previous studies in this field (Ushiyama et al. 2005; Ekblom
& Thorstensson 2011) also electing to measure Hmax/Mmax at rest.
Experimental protocol
Following the calibration curve, a 5-min rest was enforced before experimental
measurements commenced (time 0:00, Table 2.1). Four H-reflex (per stimulus
current) and three M-wave responses were elicited in ascending order of stimulus
current. The peak-to-peak amplitude of the H-reflex responses were averaged for
each stimulus current, and the current eliciting the highest H-reflex, defined as
Hmax, was normalised to Mmax (mean peak-to-peak amplitude of the maximal M-
wave responses).
The EVC were performed in response to a verbal cue. Participants were
instructed to contract the knee-extensors as “fast and hard” as possible. Of the
six attempts only those efforts exceeding 70% of maximal voluntary force, and
with a stable baseline force (i.e. countermovement or pre-tension of <0.5 N
deviation from baseline) were considered for further analysis. Of these, the two
EVC displaying the highest peak RFD (numerical differential [5 ms epoch] of the
force-time plot) were selected for further analysis, and the results averaged
Chapter 2
41
across these two contractions. Force was measured at 50, 100 and 150 ms
following force onset (F50, F100 and F150, respectively), and the amplitude of the
EMG signal was assessed as the root mean square (EMGRMS) from 0-50, 50-100
and 100-150 ms following EMG onset (earliest onset from any of the agonist
muscle recordings). Force and EMG onsets for all contractions were manually
identified by the same trained investigator using a systematic standard method
(Tillin et al. 2010). Briefly, onset was defined as the last peak or trough before
force/EMG exceeded the limits of the noise during the preceding 500 ms.
Systematic manual identification by a trained observer is considered to provide
highly accurate event detection (Tillin, Folland, et al. 2013; Allison 2003; Soda et
al. 2010; Staude 2001; Kuriki et al. 2011). The reliability of this methodology has
also been confirmed previously (between-trial, within-subject coefficients of
variations for explosive force; ≤14.6% (Tillin, Pain, et al. 2013); ≤16.6%
(Buckthorpe et al. 2012)).
Three octet contractions (eight pulses at 300 Hz) were evoked at 15 s intervals
using the same current as for Mmax. The evoked force response was assessed at
25, 50 and 75 ms following force onset and averaged across the three
contractions. The force response to the octet provides an assessment of the
maximal capacity of the muscle-tendon unit for explosive force production (de
Ruiter et al. 2004).
Participants then performed two knee extension MVCs, exerting maximum effort
for 3-5 s. The maximum voluntary force (MVF) was the highest force over a 500
ms epoch during the two repetitions, and EMGRMS was calculated for the
corresponding time window. Verbal encouragement was given during
contractions and a horizontal line denoting maximal force achieved in the
familiarisation sessions was presented on the screen.
Finally, in order to provide a more complete description of neuromuscular
activation throughout a range of sub-maximum forces, participants performed
ramp contractions by linearly increasing knee-extension force from rest to
maximum force in 4 s. A line showing the target rate of force development was
displayed on screen to facilitate an appropriate time-course. The amplitude and
median frequency of the QUAD EMG were recorded for 250 ms epochs (±125 ms)
Chapter 2
42
at specific relative forces; 20, 40, 60 and 80% MVF, and averaged across the two
contractions. The time taken to reach 80% of MVF was also recorded.
Participant dropout
The vastus medialis is a challenging location from which to record the H-reflex,
not least because the quadriceps femoris is a proximal muscle and thus lies
closer to the spinal cord than distal muscles such as the soleus, from which the
H-reflex is more commonly investigated. The effect of this proximal location is
that the difference in latencies between the M-wave and H-reflex is lower (such
that the M-wave and H-reflex responses were often found to overlap) making
accurate quantification of H-reflex magnitude difficult. As a result, potential
participants in which the the stimulus threshold for evoking a H-reflex was close
to the motor threshold were excluded from the study due to difficulties in
obtaining a range of stimulus frequencies over which an H-reflex was both clearly
distinguishable and free from interference with the direct motor response. The
prevalence of drop out for this reason alone was almost one third.
Further dropout was encountered due to discomfort experienced from the octet
procedure. The electrical stimulus was generally well tolerated, however, within
the highly trained participant group in which high forces were rapidly generated in
responses to the electrical stimulus, the mechanical action of the quadriceps
forcing the posterior surface of the knee against the leg support of the rig
produced discomfort. Two highly trained participants withdrew their participation
for this reason, prior to a subtle redesign of the profile of the leg support, which
seemed to attenuate this problem. One further participant was asked to withdraw
following a mild psychosomatic response to the general electrical stimulation
procedure.
Statistical analyses
Repeated measures general linear models were used to determine the effects of
trial (vibration vs. control) and time (either pre- vs. post-intervention (two time
Chapter 2
43
points); or at the start and end of the contractions series conducted pre- and
post-intervention (four time points)). Post-hoc comparisons involved paired
samples t-tests to evaluate differences between the two trials at specific time
points. To examine the influence of training status on the effects of vibration,
these general linear models were repeated with group (trained/untrained
participants) added as an independent variable.
Following normalisation to their respective pre-intervention values, the
differences between post-vibration and post-control Hmax/Mmax, EVC force and
MVF were calculated as a percentage of their post-control values (Hmax/Mmax from
the start of the contractions series were used). These individual changes in
Hmax/Mmax following vibration were not normally distributed (Shapiro-Wilk; P=0.02)
and so Spearman’s rank correlations were used to examine how post-vibration
changes in Hmax/Mmax related to changes in the functional performance measures
(EVC force and MVF). Data are expressed as mean ± standard deviation, and
are presented for all 18 participants together (except where between groups
comparisons were specifically sought). A P-value below 0.05 was considered
statistically significant.
2.4 – Results
Volitional & evoked explosive contractions
EVC force production remained consistent throughout both trials (ANOVA, trial ×
time interaction for F50, F100 & F150, all P≥0.35; main effect of time, all P≥0.44;
Figure 2.2A&C), as did both QUAD EMGRMS/Mmax (ANOVA, trial × time interaction
for 0-50, 50-100 & 100-150 ms, all P≥0.10; Figure 2.2B&D) and HAM EMGRMS (0-
50, 50-100 & 100-150, all P≥0.55). The intrinsic contractile capacity of the
muscle-tendon unit for explosive force production, in response to an evoked octet,
was also unaffected by the vibration stimulus (ANOVA, trial × time interaction for
F25, F50 & F75, all P≥0.36; main effect of time, all P≥0.10; Figure 2.3).
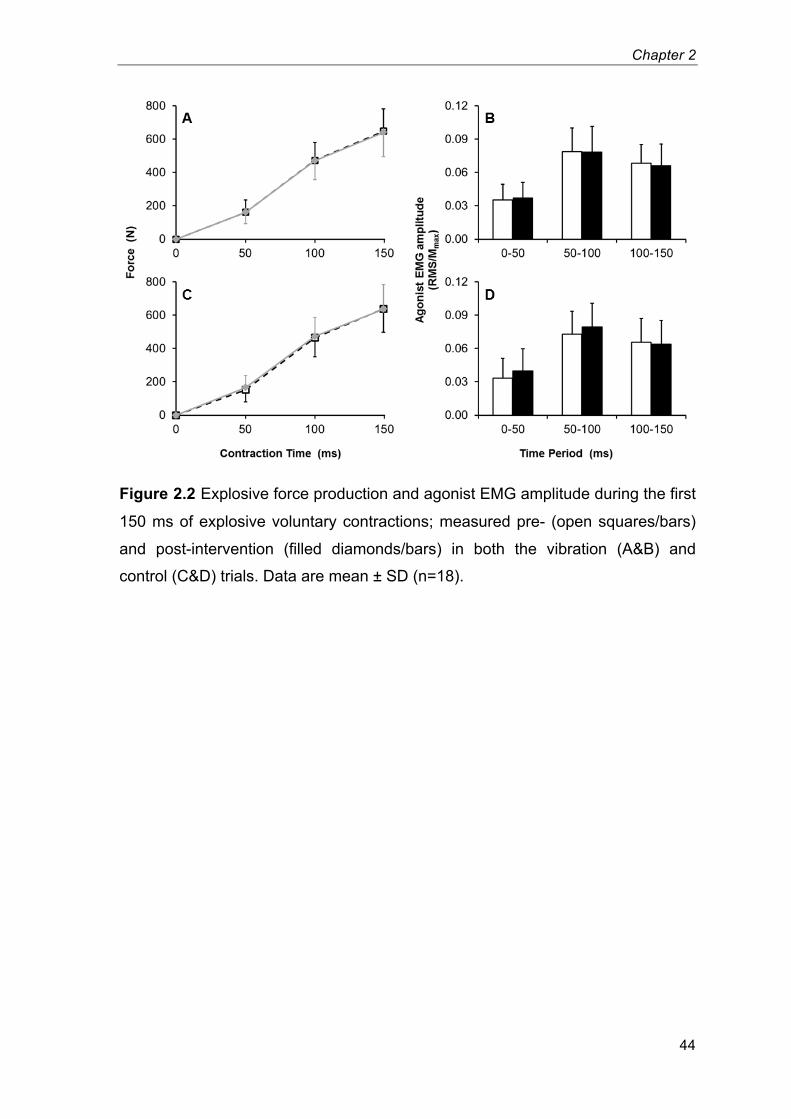
Chapter 2
44
Figure 2.2 Explosive force production and agonist EMG amplitude during the first
150 ms of explosive voluntary contractions; measured pre- (open squares/bars)
and post-intervention (filled diamonds/bars) in both the vibration (A&B) and
control (C&D) trials. Data are mean ± SD (n=18).
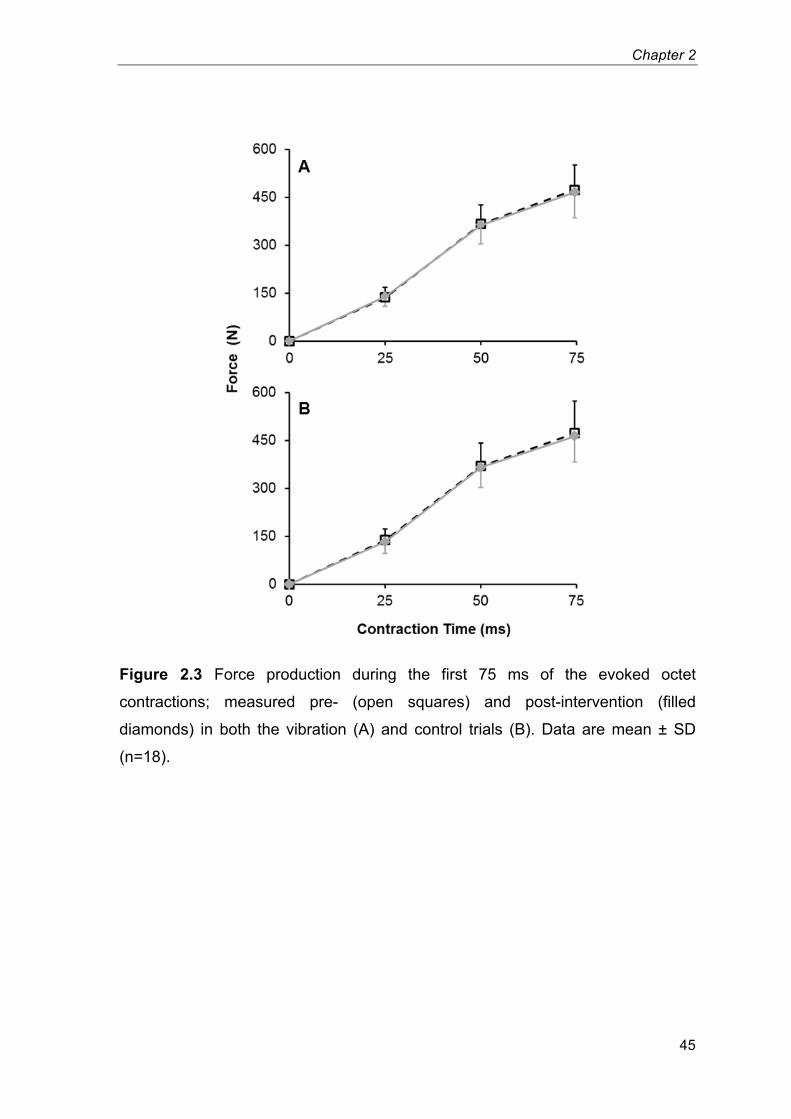
Chapter 2
45
Figure 2.3 Force production during the first 75 ms of the evoked octet
contractions; measured pre- (open squares) and post-intervention (filled
diamonds) in both the vibration (A) and control trials (B). Data are mean ± SD
(n=18).
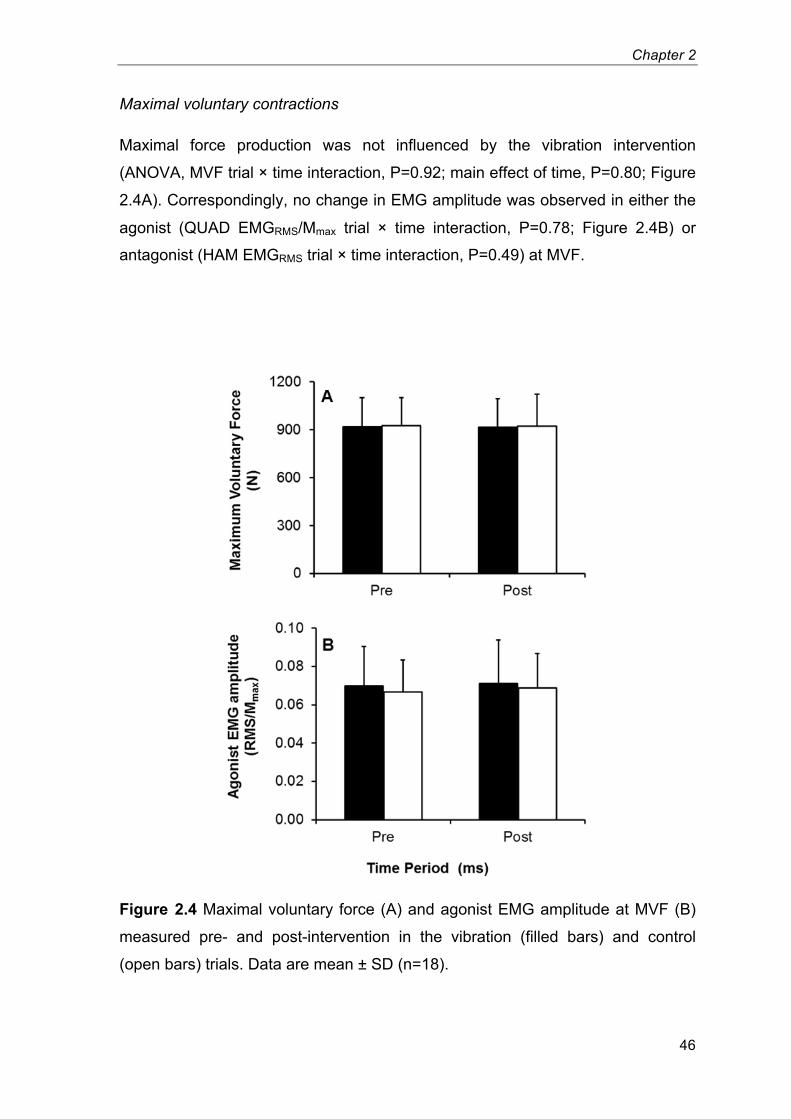
Chapter 2
46
Maximal voluntary contractions
Maximal force production was not influenced by the vibration intervention
(ANOVA, MVF trial × time interaction, P=0.92; main effect of time, P=0.80; Figure
2.4A). Correspondingly, no change in EMG amplitude was observed in either the
agonist (QUAD EMGRMS/Mmax trial × time interaction, P=0.78; Figure 2.4B) or
antagonist (HAM EMGRMS trial × time interaction, P=0.49) at MVF.
Figure 2.4 Maximal voluntary force (A) and agonist EMG amplitude at MVF (B)
measured pre- and post-intervention in the vibration (filled bars) and control
(open bars) trials. Data are mean ± SD (n=18).
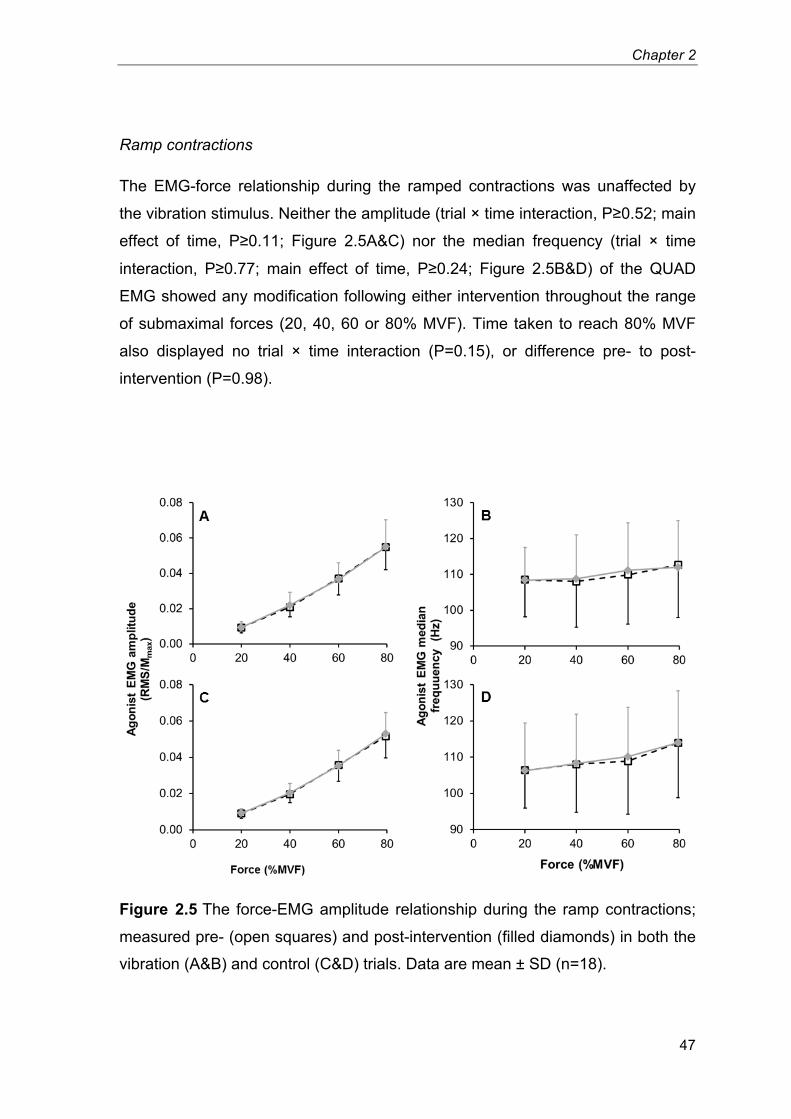
Chapter 2
47
Ramp contractions
The EMG-force relationship during the ramped contractions was unaffected by
the vibration stimulus. Neither the amplitude (trial × time interaction, P≥0.52; main
effect of time, P≥0.11; Figure 2.5A&C) nor the median frequency (trial × time
interaction, P≥0.77; main effect of time, P≥0.24; Figure 2.5B&D) of the QUAD
EMG showed any modification following either intervention throughout the range
of submaximal forces (20, 40, 60 or 80% MVF). Time taken to reach 80% MVF
also displayed no trial × time interaction (P=0.15), or difference pre- to post-
intervention (P=0.98).
Figure 2.5 The force-EMG amplitude relationship during the ramp contractions;
measured pre- (open squares) and post-intervention (filled diamonds) in both the
vibration (A&B) and control (C&D) trials. Data are mean ± SD (n=18).
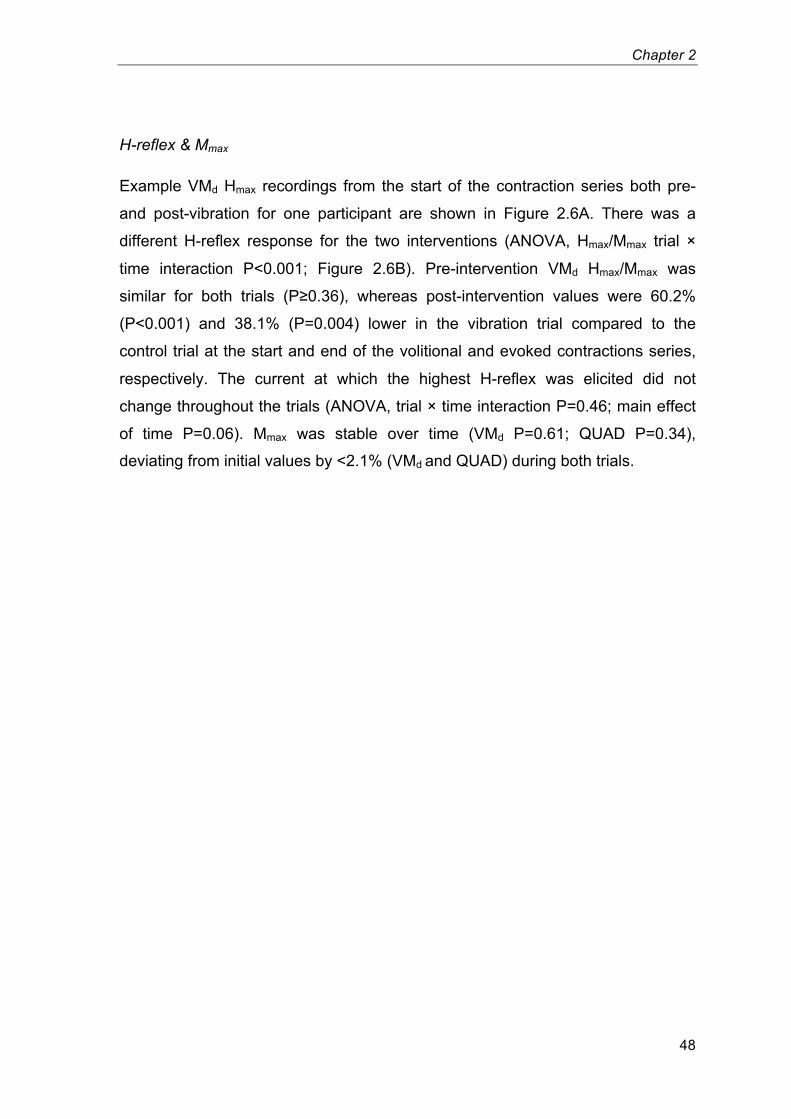
Chapter 2
48
H-reflex & Mmax
Example VMd Hmax recordings from the start of the contraction series both pre-
and post-vibration for one participant are shown in Figure 2.6A. There was a
different H-reflex response for the two interventions (ANOVA, Hmax/Mmax trial ×
time interaction P<0.001; Figure 2.6B). Pre-intervention VMd Hmax/Mmax was
similar for both trials (P≥0.36), whereas post-intervention values were 60.2%
(P<0.001) and 38.1% (P=0.004) lower in the vibration trial compared to the
control trial at the start and end of the volitional and evoked contractions series,
respectively. The current at which the highest H-reflex was elicited did not
change throughout the trials (ANOVA, trial × time interaction P=0.46; main effect
of time P=0.06). Mmax was stable over time (VMd P=0.61; QUAD P=0.34),
deviating from initial values by <2.1% (VMd and QUAD) during both trials.
Chapter 2
49
Figure 2.6 (A) Example of maximal H-reflex recordings from the distal vastus
medialis (VMd) recording site of one participant, recorded at the start of the
volitional and evoked contraction series both pre- and post-vibration. Abscissas
are time aligned with the input of the electrical stimulus. (B) Hmax/Mmax at all
four measurement time-points in both the vibration (filled triangles) and control
(open circles) trials. Data are mean ± SD (n=18). * Significant difference between
vibration and control trials (P<0.01).
Individual variability & training status
The attenuation of VMd Hmax/Mmax following vibration (percentage difference from
control) was highly variable between individuals (range -100 to +24.3%).
However, the effectiveness of the vibration at reducing Hmax/Mmax was not
Chapter 2
50
correlated with the equivalent changes in EVC force production (F50, F100 and F150;
all P≥0.54) or MVF (P=0.71).
The attenuation of VMd Hmax/Mmax was not influenced by training status (trial ×
time × group interaction P=0.93). Whilst the trained participants produced higher
explosive (voluntary and evoked) and maximal forces (all P<0.001), the groups
had similar responses to the two interventions (no trial × time × group interaction
for F50, F100 or F150, all P≥0.45; octet F25, F50 or F75, all P≥0.12; MVF, P=0.14).
2.5 – Discussion
The main finding of the present investigation was that application of a continuous
30-min vibration stimulus to the infrapatellar tendon did not affect maximal or
explosive knee-extensor force production, whereas vastus medialis H-reflex
amplitude was substantially reduced throughout these post-vibration contractions.
There was no association between the individual changes in H-reflex and
volitional performance (EVC or maximal force), and no effect of strength training
status on the responses to the vibration intervention was identified.
Contrary to the hypothesis, the 30-min tendon vibration had no effect on force
production during the initial 150 ms of the EVCs. This is in contrast to two studies
that reported substantial decreases in peak RFD of the knee-extensors following
30 min of rectus femoris vibration (~24%, Kouzaki et al. (2000); 70%, Jackson &
Turner (2003)). However, the validity of these previously reported decrements
may be questionable given that Kouzaki et al. (2000) provided no instructions to
generate force at a maximal rate, and the control (pre-intervention) assessments
of peak RFD were highly variable between trials in the study by Jackson & Turner
(2003). These studies also measured peak RFD during maximal strength
contractions, which would likely have led to significant underestimates of maximal
RFD (Sahaly et al. 2001). Moreover, more rigorous assessments of explosive
force production were unaffected by whole-body vibration (de Ruiter et al. 2003;
Erskine et al. 2007; Hannah et al., 2013). The present results also indicated that
EMG amplitude during the EVCs remained unchanged, as did the amplitude and
frequency of EMG during submaximal ramp contractions.
Chapter 2
51
MVF and the associated EMG amplitude were also unaffected by the 30-min
vibration. This is in agreement with one study (Ekblom & Thorstensson 2011), but
in contrast to a number of other studies that have observed decrements in
maximal force production of between 7 and 17% following prolonged vibration
(Kouzaki et al. 2000; Jackson & Turner 2003; Ushiyama et al. 2005; Konishi et al.
2009). The cause of the dichotomy among these results is not clear. However,
one study did not have a control trial (Konishi et al. 2009), three did not measure
extrafusal fibre excitability (via Mmax recordings) (Kouzaki et al. 2000; Jackson &
Turner 2003; Konishi et al. 2009), and the present study was the first to monitor
the intrinsic contractile properties of the muscle-tendon unit (via evoked octet
contractions). The present study showed a 60% decrease in quadriceps (VMd)
Hmax/Mmax following the vibration period. This is in agreement with previous
studies that have demonstrated decrements in triceps surae H-reflex responses
following a similar tendon vibration stimulus (≥55% (Heckman et al. 1984); 36%
(Ushiyama et al. 2005); 33% (Ekblom & Thorstensson 2011)). Although a 60%
reduction in resting Hmax/Mmax should not be thought to reflect a 60% decrease in
homonymous spinal reflex function during voluntary contractions, these results
may indicate that the vibration intervention was effective in compromising the
efficacy of the homonymous Ia afferent-α-motoneuron pathway. The present
investigation was the first to have measured H-reflex both pre and post functional
performance measures following a prolonged vibration stimulus, and
demonstrated that H-reflex was still attenuated (38%) following the completion of
the functional performance measures. This may infer that all of the functional
measures were performed under conditions of a compromised Ia afferent-α-
motoneuron pathway. The present results also showed that the excitability of the
extrafusal fibres was unaffected by the vibration intervention, as demonstrated by
the consistent Mmax responses during both trials. Additionally, no change in
evoked octet forces was evident following either intervention, illustrating that the
intrinsic contractile properties of the muscle-tendon unit were unaffected by the
prolonged tendon vibration.
Overall, despite a substantial reduction in Hmax/Mmax observed both at the start
and end of the post-vibration measurements, none of the volitional
measurements were affected following either intervention. Furthermore, at an
Chapter 2
52
individual level the magnitude of H-reflex depression did not demonstrate any
correlation with the changes in either maximal or EVC force production. These
results could suggest that performance of maximal and explosive voluntary
contractions of the quadriceps are not dependent on contributions to neural drive
via homonymous Ia afferents. In addition, these results were similar for both
strength trained and untrained individuals.
Repetitive activation of Ia afferents during vibration may attenuate the efficacy of
the Ia afferent-α-motoneuron pathway via one or more of a number of processes,
including; transmitter depletion at the Ia afferent terminals (Curtis & Eccles 1960;
Hultborn et al. 1996), interneuron-mediated presynaptic inhibition (Lapole et al.
2012), and reduced excitability of the Ia afferents (Lin et al. 2002). In the present
investigation, vibration had no effect on the current at which VMd Hmax was
elicited, suggesting that this latter mechanism was not the determining factor
underlying H-reflex depression. Bongiovanni et al. (1990) proposed that MVF
suppression was primarily due to transmitter depletion, whereas the depression
in H-reflex may be due to a presynaptic inhibition of transmitter release at the
monosynaptic Ia terminals. If these processes were to show different time-
courses following prolonged vibration there could be a disparity in the recovery of
MVF and H-reflex, allowing MVF to recover while H-reflex depression remained.
This possibility remains highly speculative as the recovery of these processes
has been poorly defined.
Alternatively, H-reflex measurements, particularly resting measurements, may not
provide an accurate reflection of the efficacy of the (more functionally relevant)
entire γ-loop following prolonged vibration. Stretch reflexes have been reported to
increase after vibration (Heckman et al. 1984; van Boxtel 1986; Shinohara et al.
2005) despite concurrent depressions in H-reflex also being observed (Heckman
et al. 1984; van Boxtel 1986). Additionally, any effect of the tendon vibration on
the Golgi tendon organs, and the efficacy of their inhibitory input to the α-
motoneurons via inhibitory Ib interneurons remains unknown. In summary, the
cause of the dichotomy between the present results, along with those of Ekblom
and Thorstensson (2011), and the more prevalent finding within the literature of a
reduction in maximal motor output following prolonged muscle/tendon vibration is
not clear.
Chapter 2
53
In conclusion; quadriceps maximal and explosive force production tasks were
unaffected by a 30-min tendon vibration, whereas H-reflex amplitude decreased
markedly. Individual depressions in H-reflex did not correlate with changes in
either EVC or maximal force production, and training status appeared to have no
effect on the influence of vibration on reflex or functional performance measures.
These results may indicate that for isometric contractions of the quadriceps
muscle group maximal and explosive force production is not dependent upon
input to the α-motoneurons via homonymous Ia afferents.
Chapter 3
Does sensorimotor cortex activity
change with quadriceps femoris torque
output? A human
electroencephalography study
Chapter 4
55
3.1 – Abstract
Encoding muscular force output during voluntary contractions is widely perceived
to result, at least in part, from modulations in neuronal activity within the
sensorimotor cortex. However, the underlying electrophysiological phenomena
associated with increased force output remains unclear. This study directly
assessed sensorimotor cortex activity using electroencephalography (EEG) in
humans performing isometric knee-extensions at a range of discrete torque levels.
Fifteen healthy males (age 24 (s=5) years) completed one familiarisation and one
experimental trial. Participants performed a cyclic series of 60 isometric knee-
extension contractions with the right leg, including 15 contractions of 5-s duration
at each of four discrete torque levels: 15, 30, 45 and 60% of maximal voluntary
torque (MVT). Isometric knee-extension torque, quadriceps electromyography
and EEG were recorded at rest and throughout all the contractions. EEG (0.5-50
Hz) was collected using a 32-channel active-electrode cap. A voxel-based
LORETA analysis calculated cortical activation within the sensorimotor cortex
(one of 27 MNI coordinates) for the entire 0.5-50 Hz range (cortical current
density (CCD)), as well as for each constituent frequency band in this range
(delta, theta, alpha, beta and gamma). Gamma band (30-50 Hz) cortical activity
increased with contraction torque (ANOVA, P=0.03). Conversely, activity within
the other frequency bands was not modulated by torque (P≥0.09), nor was
overall CCD (P=0.11). Peripheral neuromuscular activation (quadriceps EMG
amplitude) demonstrated distinct increases between each torque level (P<0.01).
In conclusion, sensorimotor cortical activity within the gamma band demonstrated
an overall increase with contraction torque, whereas both CCD and each of the
other constituent frequency bands were not modulated by increments in torque
magnitude during isometric knee-extension contractions up to 60%MVT.
Chapter 4
56
3.2 – Introduction
Understanding the cortical encoding of skeletal muscle contractions, including the
force of contractions, is of wide relevance to human function and health; including
neurological disorders, brain computer interfacing, healthy ageing and the
responses to physical training/rehabilitation. Several studies on non-human
primates have suggested that a number of cells within the motor cortex modulate
their activity in relation to the isometric contraction force of an active muscle
(Evarts 1968; Cheney & Fetz 1980; Evarts et al. 1983; Hepp-Reymond et al.
1999). However, animal investigations have typically been limited to studying
relatively low force amplitudes, and it is difficult to detect changes in the number
of participating cells or modifications in whole populations of cells.
In humans, studies utilising positron emission tomography (PET; Dettmers et al.,
1995) and functional magnetic resonance imaging (fMRI; Thickbroom et al. 1998;
Dai et al. 2001; Cramer et al. 2002; Ward & Frackowiak 2003; van Duinen et al.
2008; Keisker et al. 2009) have found cortical activation in sensorimotor regions
of the brain to increase with increments in force during isometric or near-isometric
contractions of the fingers/hand. However, findings are not unequivocal; Ludman
et al. (1996) found no difference in fMRI BOLD signal during cyclic finger flexion
of a light and heavy load, and Christensen et al. (2000) found no correlation
between bipedal recumbent cycling load and cerebral blood flow related
activation within the motor cortex. Moreover, both PET and fMRI techniques
measure haemodynamic responses within localised regions of the brain as an
indirect surrogate of neuronal activity. In contrast, measuring cortical electrical
activity provides a direct index of neuronal activation as this is the method of
communication within the central nervous system.
Decreases in surface electroencephalography (EEG) amplitude have been
observed within the alpha frequency band with increments in force during
isometric ‘pinching’ using the thumb and little finger (Mima et al. 1999). Similarly,
Dal Maso et al. (2012) found beta band activity to decrease with increments in
isometric knee flexion force in strength trained individuals. However, findings to
date have been inconsistent; both isometric elbow flexion force (Cremoux et al.
2013) and the magnitude of a resistive load applied against index finger
Chapter 4
57
extensions (Stančák et al. 1997) were found to have no effect on the amplitude of
EEG recorded during contractions. All of these studies have related contraction
force to changes in EEG recordings as they appear at the scalp. In contrast,
source localisation of EEG signals represents an increasingly viable technique for
the measurement of neuronal activity within sensorimotor cortex regions of
interest during motor tasks.
Recent investigations (Brümmer et al., 2011; Schneider et al., 2013) have
evaluated the source localised EEG signal originating within the motor cortex
during the performance of incremental ergometer cycling, and have reported an
increased cortical activation to accompany greater cycling loads. However,
cycling is a complex movement, with multiple joints involved and numerous
muscles each producing a constantly changing amount of force at different times
throughout the movement. Analysis of constant torque isometric contractions of a
single large muscle (e.g. the quadriceps), over a range of discrete force levels
may provide a more experimentally controlled situation in order to observe the
cortical encoding of skeletal muscle force production. Moreover, these studies
(Brümmer et al., 2011; Schneider et al., 2013) only reported the power of the
EEG signal for the entire 0.5-50 Hz recording (known as cortical current density
(CCD)), which does not enable examination of activity patterns in the narrower
constituent frequency bands.
The aim of this study was to examine cortical activity within the sensorimotor
cortex as determined by source localised EEG measurements during constant
torque isometric contractions of the quadriceps muscle group at a range of
discrete torque levels. Sensorimotor activity within the delta, theta, alpha, beta
and gamma bands was determined, in addition to overall CCD.
3.3 – Methods
Participants
The data for one participant included a high amplitude noise component in the
recorded EEG signals during almost all of the submaximal contractions
performed and was therefore excluded from further analysis. Subsequently,
Chapter 4
58
participants were fifteen healthy, injury-free, recreationally active males with no
known history of neuromuscular or skeletal disorders (mean ± s: age 24 ± 5 years,
stature 1.80 ± 0.06 m, body mass 76.7 ± 9.9 kg). The experimental procedures
were approved by the Loughborough University Ethical Advisory Committee, and
each participant provided written informed consent prior to their involvement.
Experimental protocol
A familiarisation session was completed 5-14 days prior to the experimental trial,
during which participants rehearsed performing maximal and submaximal
isometric knee-extension contractions. The experimental trial involved the
determination of maximal voluntary torque, and a cyclic series of 60 submaximal
isometric knee extension contractions; 15 contractions at each of four distinct
torque levels (15, 30, 45 and 60% of maximal torque) (Figure 3.1).
Electromyography (EMG), EEG and torque were measured simultaneously
during submaximal contractions, and real-time graphical feedback of contraction
torque was displayed on a computer monitor positioned in front of the participant.
All contractions were performed with the right leg. Participants were advised to
abstain from strenuous or atypical exercise for 36 hours prior to the experimental
trial, and to avoid the intake of nutritional stimulants (e.g. caffeine) on the day of
the trial.
Maximal voluntary contractions (MVCs): Following a prescribed warm-up of
submaximal isometric knee extensor contractions, participants performed four
MVCs, with 40 s rest between contractions. Participants were instructed to exert
a maximum effort of knee-extension torque continuously for 3-5 s, with visual
biofeedback and verbal encouragement provided. Maximal voluntary torque
(MVT) was determined as the highest torque over a 500 ms epoch during the four
repetitions, and amplitude of the quadriceps signal (EMGMVT) was also calculated
for this time window. Participants rested for 10-min following the MVCs, allowing
for the EEG cap to be fitted and the EEG signals to be visually inspected.
Submaximal contractions: For each contraction, in response to a verbal cue,
participants increased knee-extensor torque to the required level and maintained
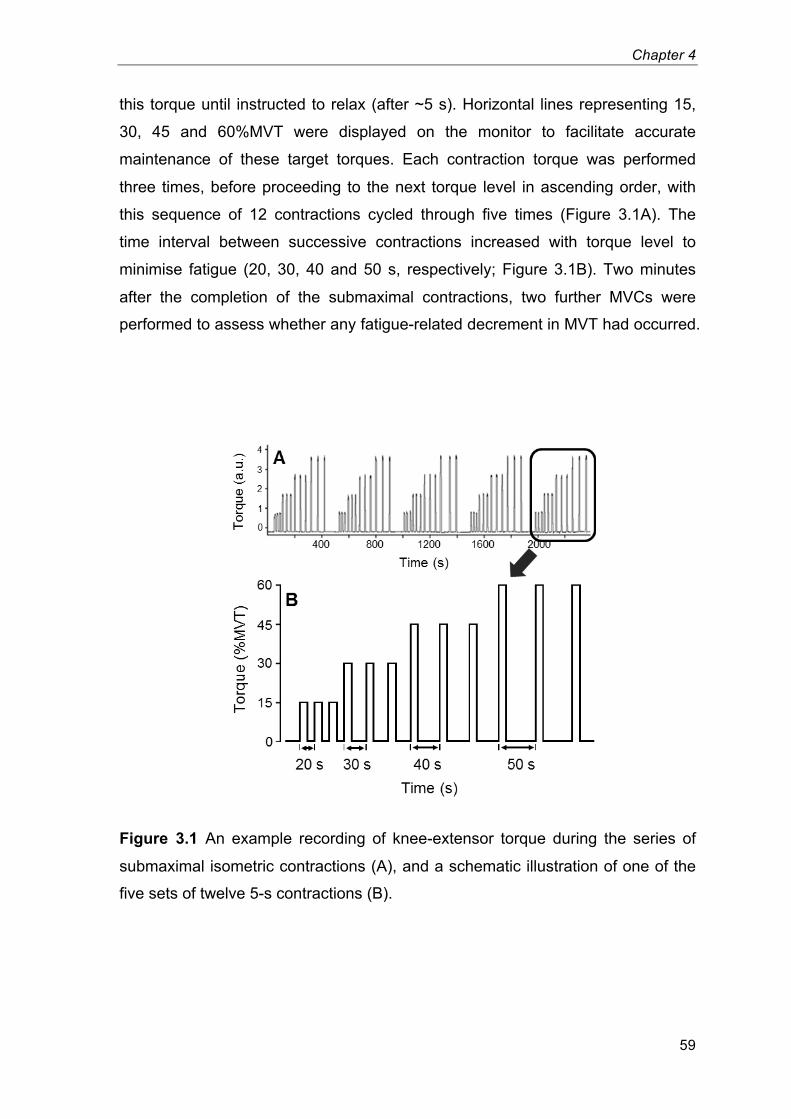
Chapter 4
59
this torque until instructed to relax (after ~5 s). Horizontal lines representing 15,
30, 45 and 60%MVT were displayed on the monitor to facilitate accurate
maintenance of these target torques. Each contraction torque was performed
three times, before proceeding to the next torque level in ascending order, with
this sequence of 12 contractions cycled through five times (Figure 3.1A). The
time interval between successive contractions increased with torque level to
minimise fatigue (20, 30, 40 and 50 s, respectively; Figure 3.1B). Two minutes
after the completion of the submaximal contractions, two further MVCs were
performed to assess whether any fatigue-related decrement in MVT had occurred.
Figure 3.1 An example recording of knee-extensor torque during the series of
submaximal isometric contractions (A), and a schematic illustration of one of the
five sets of twelve 5-s contractions (B).7
Chapter 4
60
Six 60-s segments of resting EEG data were also collected; one prior to the
submaximal contractions, and after every set of 12 contractions. During resting
collections, participants were instructed to keep their eyes closed, refrain from
moving/talking and focus on themselves in order to minimize shifts in cognitive
activity Brümmer et al. (2011).
Torque measurements
Isometric knee-extensor torque of the right leg was measured with participants
seated in a dynamometer (Con-Trex; CMV AG, Dübendorf, Switzerland) with hip
and knee angles of 95° and 110°, respectively. The rotational axes of the crank
arm and right knee joint were aligned, and the ankle brace was fastened 20 mm
proximal to the lateral malleolus of the ankle. Adjustable waist and shoulder
straps were used to prevent extraneous body movements, and the participants
were instructed to keep their arms relaxed with their hands resting in their lap
throughout all contractions. Torque data were sampled and recorded at 2000 Hz
using an external A/D converter (Micro 1401, CED, Cambridge, UK) and a PC
utilising Spike 2 software (CED, Cambridge, UK).
Electroencephalography measurements
BrainVision Recorder 1.2 (Brain Products, Munich, Germany) recorded EEG at a
sampling frequency of 500 Hz (0.016 Hz high pass filter, time constant 10 s, 6
dB/oct; 1000 Hz low pass filter, 30 dB/oct) using a portable actiCAP system
(Brain Products, Munich, Germany) that was equipped with 32 Ag/AgCl
electrodes. A flexible EEG cap with chinstrap was used to maintain electrode
positions against the scalp. One of three caps (notionally: small, medium or large)
was selected depending on participant head size. This cap adapted to individual
head shape and was permeable to air to avoid heating during contractions.
According to the international 10:20 system, EEG data was recorded at
(approximate) electrode positions Fp1, Fp2, F7, F3, Fz, F4, F8, FC5, FC1, FC2,
FC6, T7, C3, Cz, C4, T8, CP5, CP1, CP2, CP6, TP9, P7, P3, Pz, P4, P8, TP10,
PO9, O1, Oz, O2, and PO10. To ensure electrode positions were as accurate as
Chapter 4
61
possible the locations for electrodes Fp1 and Fp2 were first measured and
marked on the forehead prior to placing the cap. In fitting the cap, further care
was taken to ensure that electrode Cz was positioned over the vertex, and that
C3 and C4 were symmetrically situated. Reference (FCz) and ground (AFz)
electrodes were mounted additionally. Distances between electrodes were ~50
mm to avoid possible cross-talk due to salt bridges (perspiration rate was not
measured; however, subjectively perspiration rate increased but was not profuse
(i.e. substantially less than during whole-body exercise e.g. cycling)). Each
electrode was filled with SuperViscTM
electrode gel (Easycap GmbH, Herrsching,
Germany) to optimize conductivity. Analogue EEG signals were amplified and
converted to digital signals using the BrainVision 1.2 software.
Electromyography measurements
Surface EMG was recorded using pre-amplified (×100) single differential wireless
electrodes (20-450 Hz bandwidth; Trigno, Delsys, Boston, USA). Following
shaving, gentle abrasion and cleansing with ethanol, two electrodes were
positioned over each of the superficial muscles of the quadriceps at specific
percentages of thigh length (greater trochanter to lateral knee joint centre
distance) from the superior border of the patella as follows: vastus medialis, 35%
and 25%; vastus lateralis, 55% and 45%; and rectus femoris, 65% and 55%. The
proximal and distal electrodes on each muscle were offset laterally and medially,
respectively, from the longitudinal mid-line of the muscle belly by ~10 mm, and
aligned parallel to the presumed orientation of the muscle fibres. The EMG
signals were sampled at 2000 Hz and synchronised with the torque data using
the same data acquisition equipment.
Data analyses
A synchronised marker within the torque, EEG and EMG signals was manually
triggered using the Spike2 software when contraction torque was subjectively
determined to have stabilised at the required level. Data were segmented into
4.5-s periods immediately following these markers. Data segments were
Chapter 4
62
excluded from further analysis if the torque was not maintained throughout the
corresponding 4.5 s (the downward deflection initiating the return of torque to
baseline commenced ˂4.5 s after the marker).
BrainVision Analyzer 2.0.4 (Brain Products, Munich, Germany) was used for
offline EEG data processing, including careful visual inspection and systematic
exclusion procedures. EEG signals were high- and low-pass filtered at 0.5 and
50.0 Hz, respectively, using infinite impulse response digital filters (time constant
0.3183099 s, 48 dB/oct). Segments of EEG data that were determined to contain
a high noise component were excluded from subsequent analysis (semi-
automatic artefact rejection filter; gradient < 50.0 µV, max/min amplitude -100 to
100 µV). Eye blink artefacts were generally confined to Fp1, Fp2 and the frontal
electrodes and not typically present in the electrode channels located over the
motor regions (i.e. C3, Cz and C4), nevertheless, data segments seen to contain
eye blinks following the semi-automatic artefact rejection filter (offline visual
inspection) were discarded prior to subsequent analyses. A voxel-based,
integrated low-resolution brain electromagnetic tomography (LORETA) (Bai et al.
2007; Grech et al. 2008; Pascual-marqui et al. 2002) calculated cortical activity
(µV2/mm
4) at 27 Montreal Neurophysiological Institute (MNI) coordinates in a 3 ×
3 × 3 cube; (x:y:z) -10, 0, 10: -20, -30 -40: 50, 60, 70 (i.e. 10 mm separation in
medial-lateral, anterior-posterior and superior-inferior directions). This
configuration led to substantial overlap between voxels (spheres of 20 mm
diameter on MNI-Average-305-T1 head model) such that a comprehensive
covering of the leg area of the sensorimotor cortex was achieved, which also
allowed for variations in individual brain anatomy (see Appendix 3.1). Data from
individual contractions (segments) that were >2 standard deviations from the
mean (of the ≤15 contractions at that torque level for each individual participant)
were excluded from the remaining analyses. Subsequently, for each participant,
the voxel that displayed the greatest change in cortical activity between rest and
during the contractions (average cortical activity of the four torque levels; fold
change from rest) was selected as the region of interest within the sensorimotor
cortex. For each torque level data were then averaged within individuals before
group means were calculated. Each of these analyses were performed for the
whole 0.5-50 Hz frequency band (cortical current density (CCD)), and within each
Chapter 4
63
of the constituent frequency bands individually; 0.5-3 (delta), 3-7 (theta), 7-13
(alpha) 13-30 (beta) and 30-50 Hz (gamma). The number of contractions
excluded during the course of the analyses, and the voxel demonstrating the
peak change in cortical activity from rest (and thus selected as the sensorimotor
region of interest) may therefore have differed between frequency bands.
EMG signals were band-pass filtered at 6-500 Hz with a 4th order bidirectional
Butterworth digital filter, prior to further analyses. The amplitude of the EMG
signal was calculated as the root mean square (EMGRMS). EMGRMS for each
recording site during submaximal contractions was normalised to EMGMVT before
an overall average for the six quadriceps recording sites was determined.
To assess the steadiness and thus the distinctiveness of the different torque
levels intraindividual coefficients of variation in contraction torque were calculated
using the mean and standard deviation of 9000 data points (4.5 s × 2000 Hz) of
each submaximal contraction, and averaged within individuals for each torque
level before group means were determined (intraindividual within-contraction
coefficients of variation). Coefficients of variation in cortical activity were
calculated using the mean and standard deviation of the 15 contractions at each
torque level (minus any excluded contractions), with group means subsequently
determined for each frequency band (intraindividual between-contractions
coefficients of variation).
Statistical analyses
A mixed measures ANOVA was used to compare absolute cortical activity
between frequency bands (independent measure = frequency, repeated measure
= torque level). One-way repeated measures ANOVAs were used to test for
significant effects of knee extensor torque on EMGRMS, and cortical activity within
each separate frequency band. Prior to these one-way ANOVAs, EEG data were
log transformed as follows: ln(((‘cortical activity during contraction’ – ‘cortical
activity at rest’) / ‘cortical activity at rest’) + 1). Comparisons of cortical activity
between frequency bands were made at the location of peak change in CCD (fold
change from resting values). Comparisons of cortical activity between torque
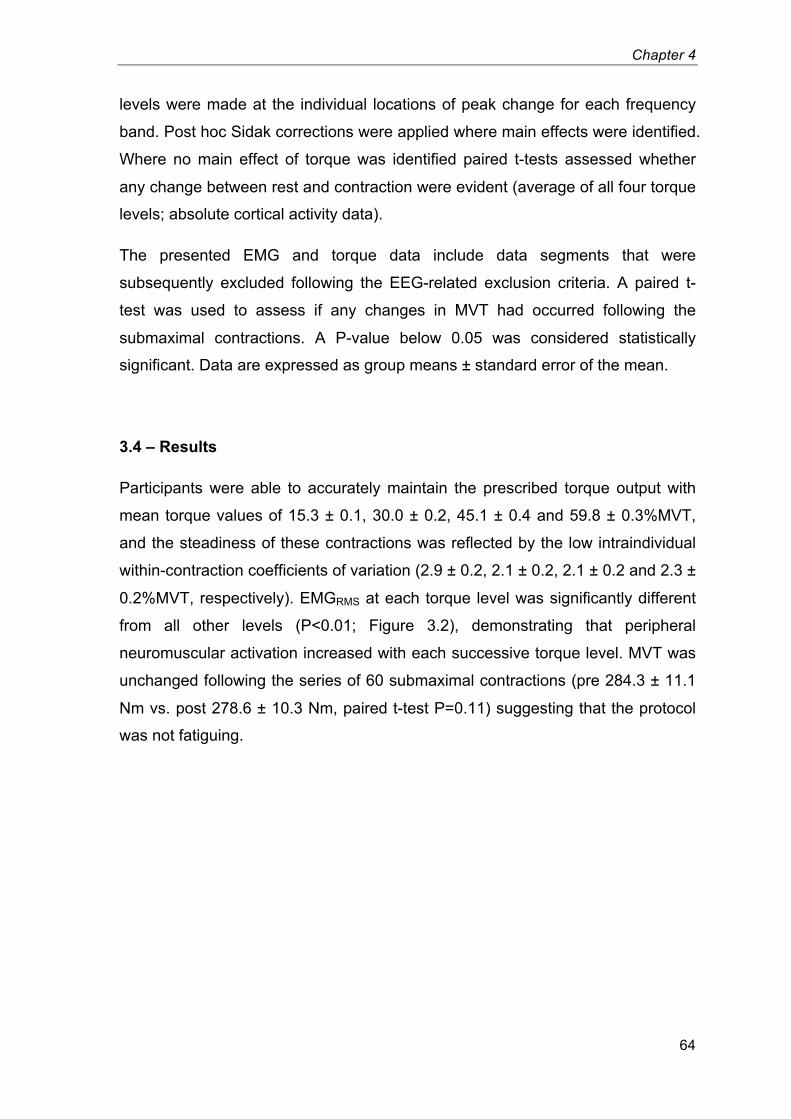
Chapter 4
64
levels were made at the individual locations of peak change for each frequency
band. Post hoc Sidak corrections were applied where main effects were identified.
Where no main effect of torque was identified paired t-tests assessed whether
any change between rest and contraction were evident (average of all four torque
levels; absolute cortical activity data).
The presented EMG and torque data include data segments that were
subsequently excluded following the EEG-related exclusion criteria. A paired t-
test was used to assess if any changes in MVT had occurred following the
submaximal contractions. A P-value below 0.05 was considered statistically
significant. Data are expressed as group means ± standard error of the mean.
3.4 – Results
Participants were able to accurately maintain the prescribed torque output with
mean torque values of 15.3 ± 0.1, 30.0 ± 0.2, 45.1 ± 0.4 and 59.8 ± 0.3%MVT,
and the steadiness of these contractions was reflected by the low intraindividual
within-contraction coefficients of variation (2.9 ± 0.2, 2.1 ± 0.2, 2.1 ± 0.2 and 2.3 ±
0.2%MVT, respectively). EMGRMS at each torque level was significantly different
from all other levels (P<0.01; Figure 3.2), demonstrating that peripheral
neuromuscular activation increased with each successive torque level. MVT was
unchanged following the series of 60 submaximal contractions (pre 284.3 ± 11.1
Nm vs. post 278.6 ± 10.3 Nm, paired t-test P=0.11) suggesting that the protocol
was not fatiguing.
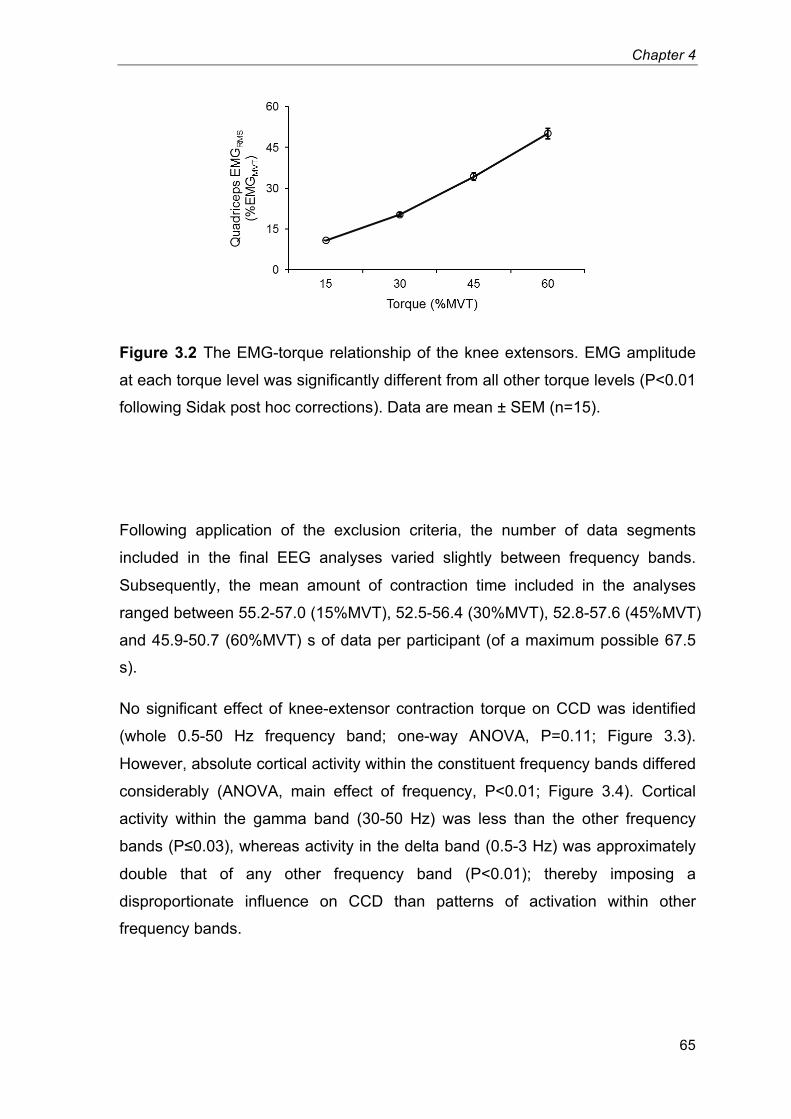
Chapter 4
65
Figure 3.2 The EMG-torque relationship of the knee extensors. EMG amplitude
at each torque level was significantly different from all other torque levels (P<0.01
following Sidak post hoc corrections). Data are mean ± SEM (n=15).8
Following application of the exclusion criteria, the number of data segments
included in the final EEG analyses varied slightly between frequency bands.
Subsequently, the mean amount of contraction time included in the analyses
ranged between 55.2-57.0 (15%MVT), 52.5-56.4 (30%MVT), 52.8-57.6 (45%MVT)
and 45.9-50.7 (60%MVT) s of data per participant (of a maximum possible 67.5
s).
No significant effect of knee-extensor contraction torque on CCD was identified
(whole 0.5-50 Hz frequency band; one-way ANOVA, P=0.11; Figure 3.3).
However, absolute cortical activity within the constituent frequency bands differed
considerably (ANOVA, main effect of frequency, P<0.01; Figure 3.4). Cortical
activity within the gamma band (30-50 Hz) was less than the other frequency
bands (P≤0.03), whereas activity in the delta band (0.5-3 Hz) was approximately
double that of any other frequency band (P<0.01); thereby imposing a
disproportionate influence on CCD than patterns of activation within other
frequency bands.
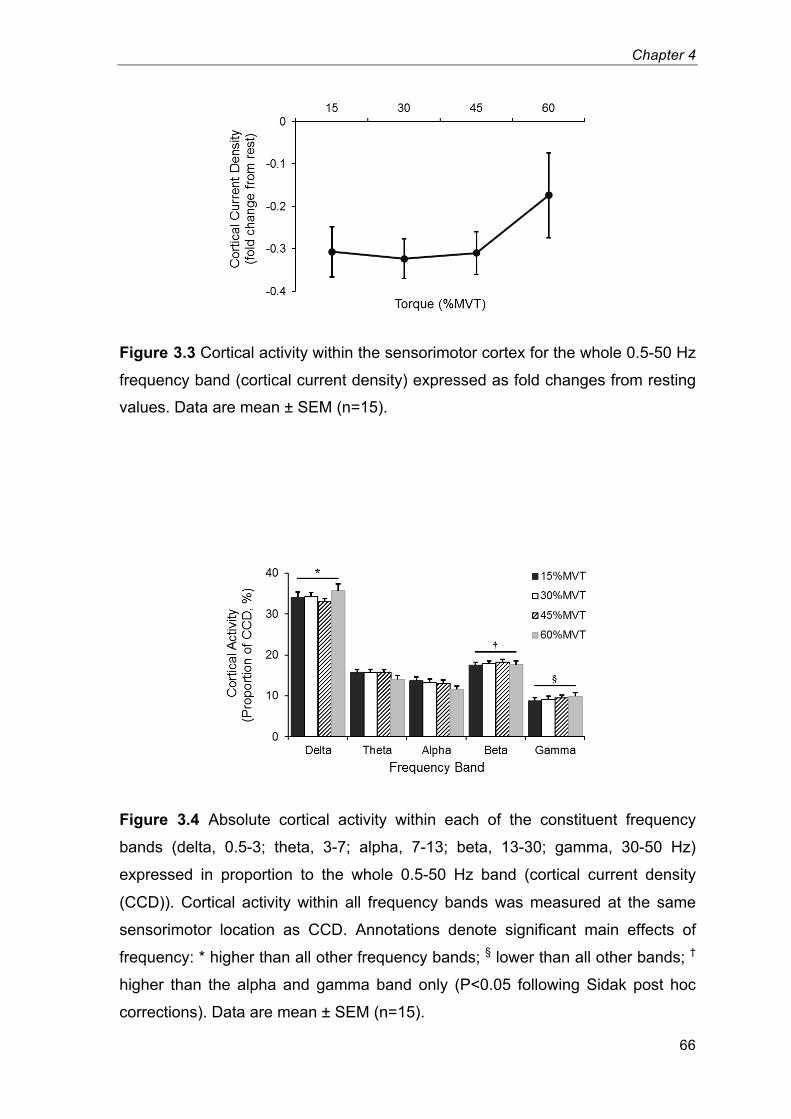
Chapter 4
66
Figure 3.3 Cortical activity within the sensorimotor cortex for the whole 0.5-50 Hz
frequency band (cortical current density) expressed as fold changes from resting
values. Data are mean ± SEM (n=15).9
Figure 3.4 Absolute cortical activity within each of the constituent frequency
bands (delta, 0.5-3; theta, 3-7; alpha, 7-13; beta, 13-30; gamma, 30-50 Hz)
expressed in proportion to the whole 0.5-50 Hz band (cortical current density
(CCD)). Cortical activity within all frequency bands was measured at the same
sensorimotor location as CCD. Annotations denote significant main effects of
frequency: * higher than all other frequency bands; § lower than all other bands;
†
higher than the alpha and gamma band only (P<0.05 following Sidak post hoc
corrections). Data are mean ± SEM (n=15).10
Chapter 4
67
Cortical activity within the gamma band increased with contraction torque (one-
way ANOVA, P=0.03; Figure 3.5), although no significant differences between
individual torque levels were identified following post hoc analysis. Activity within
the other frequency bands was not modulated by torque (delta, P=0.09; theta,
P=0.68; alpha, P=0.95; beta, P=0.11). Paired t-tests showed that delta, theta and
alpha activity was significantly lower during contractions compared with rest
(paired t-test, P≤0.02), whereas no change was observed within the beta band
(P=0.34).
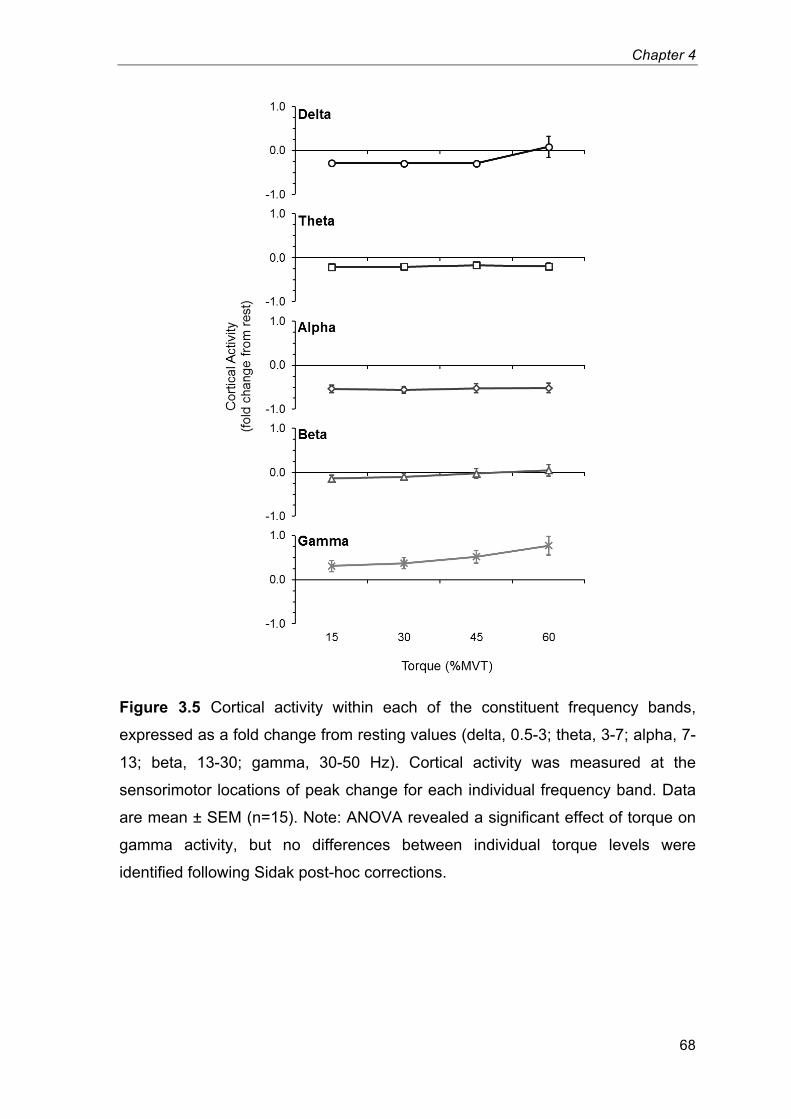
Chapter 4
68
Figure 3.5 Cortical activity within each of the constituent frequency bands,
expressed as a fold change from resting values (delta, 0.5-3; theta, 3-7; alpha, 7-
13; beta, 13-30; gamma, 30-50 Hz). Cortical activity was measured at the
sensorimotor locations of peak change for each individual frequency band. Data
are mean ± SEM (n=15). Note: ANOVA revealed a significant effect of torque on
gamma activity, but no differences between individual torque levels were
identified following Sidak post-hoc corrections.11
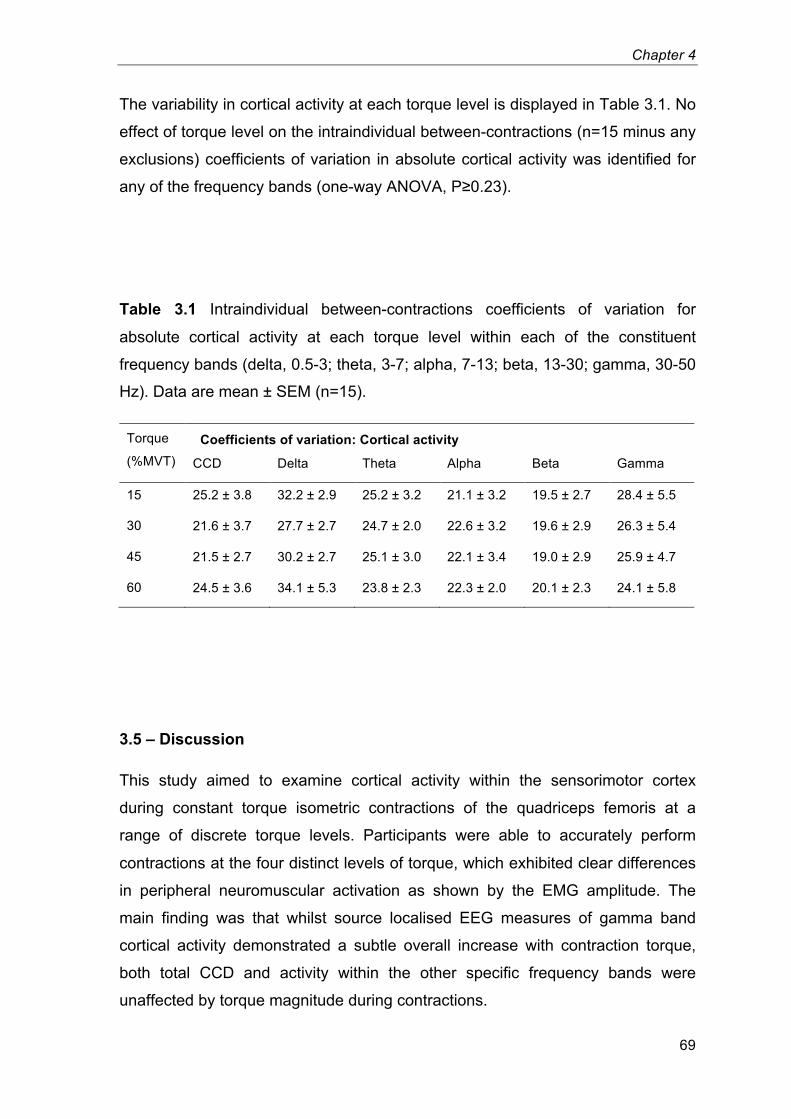
Chapter 4
69
The variability in cortical activity at each torque level is displayed in Table 3.1. No
effect of torque level on the intraindividual between-contractions (n=15 minus any
exclusions) coefficients of variation in absolute cortical activity was identified for
any of the frequency bands (one-way ANOVA, P≥0.23).
Table 3.1 Intraindividual between-contractions coefficients of variation for
absolute cortical activity at each torque level within each of the constituent
frequency bands (delta, 0.5-3; theta, 3-7; alpha, 7-13; beta, 13-30; gamma, 30-50
Hz). Data are mean ± SEM (n=15).2
Torque
(%MVT)
Coefficients of variation: Cortical activity
CCD Delta Theta Alpha Beta Gamma
15 25.2 ± 3.8 32.2 ± 2.9 25.2 ± 3.2 21.1 ± 3.2 19.5 ± 2.7 28.4 ± 5.5
30 21.6 ± 3.7 27.7 ± 2.7 24.7 ± 2.0 22.6 ± 3.2 19.6 ± 2.9 26.3 ± 5.4
45 21.5 ± 2.7 30.2 ± 2.7 25.1 ± 3.0 22.1 ± 3.4 19.0 ± 2.9 25.9 ± 4.7
60 24.5 ± 3.6 34.1 ± 5.3 23.8 ± 2.3 22.3 ± 2.0 20.1 ± 2.3 24.1 ± 5.8
3.5 – Discussion
This study aimed to examine cortical activity within the sensorimotor cortex
during constant torque isometric contractions of the quadriceps femoris at a
range of discrete torque levels. Participants were able to accurately perform
contractions at the four distinct levels of torque, which exhibited clear differences
in peripheral neuromuscular activation as shown by the EMG amplitude. The
main finding was that whilst source localised EEG measures of gamma band
cortical activity demonstrated a subtle overall increase with contraction torque,
both total CCD and activity within the other specific frequency bands were
unaffected by torque magnitude during contractions.
Chapter 4
70
The increase in sensorimotor gamma band activity that was observed is in
contrast to one comparable study that found no changes in motor cortex gamma
activity during isometric knee flexion/extension contractions over a similar range
of torque levels (~15-59%MVT; Dal Maso et al. (2012)). However, a number of
studies have suggested that gamma range oscillations, spread over a large
cortical area, may have a functional role in attention during the anticipation and
performance of sensorimotor tasks (Murthy & Fetz 1996a; Murthy & Fetz 1996b;
Rougeul-Buser 1994). Bonnet and Arand (2001) also suggested that 26-49 Hz
activity may relate to the level of physiological arousal in the central nervous
system. The present results may therefore reflect an increase in attention or
arousal when performing contractions of a greater strength. In addition, that the
variability in gamma activity between contractions was similar across torque
levels (and in fact lowest at the 60%MVT torque level; Table 3.1) might
substantiate that a neurological phenomenon was responsible for the overall
increase in gamma activity rather than the incursion of a noise source e.g.
muscle artefacts.
Cortical activity within both the alpha and beta bands was unaffected by
contraction torque. This is in accordance with two previous studies involving
isometric elbow flexion (Cremoux et al. 2013) and loaded finger extensions
(Stančák et al. 1997). Conversely, an increased suppression of cortical activity
with increments in contraction strength has been identified in the alpha band
during a pinching task (Mima et al. 1999) and in an upper beta band (21-31 Hz)
during isometric knee flexion contractions performed by strength trained
participants (Dal Maso et al. 2012). However, Dal Maso and colleagues (2012)
did not identify any torque-related modulations in beta activity during knee flexion
performed by endurance trained participants, or during knee extensions
performed by either strength or endurance trained participants. Stančák et al.
(1997) found that peak changes in alpha/beta activity corresponded to the
duration rather than amplitude of agonist EMG activation during brief finger
movements. This could indicate that cortical activity within alpha and/or beta
frequency bands may be modulated by motor parameters other than the force of
contraction. That beta activity did not differ from rest in the current study (P=0.34)
was perhaps surprising. Attenuations in beta band activity accompanying motor
Chapter 4
71
task performances have been consistently demonstrated by previous studies
(Jasper & Penfield 1949; Pfurtscheller & Lopes da Silva 1999; Jurkiewicz et al.
2006). However, beta oscillations may be re-established, at least partially, during
the held phase of steady contractions (Penfield 1954; Kilavik et al. 2013).
Moreover, the rest condition within the current study involved participants
assuming an extremely relaxed state. Contrasting rest with contraction periods
may therefore have involved marked differences in arousal and attention as well
as alterations in the motor state (Vogt et al. 2014). A more analogous state of
arousal/alertness between contraction periods and the baseline comparison may
therefore be beneficial to future studies comparing rest to periods of motor
activity.
Total CCD did not differ between contraction strengths. This was in accordance
with four of the five component frequency bands (delta to beta), the exception
being gamma band activity which increased. Gamma exhibited the lowest
absolute cortical activity of the five frequency bands, and therefore would have
had the smallest influence on the total CCD. The finding that CCD was not
modulated with contraction torque may appear to be in contrast with observations
of increased CCD with increments in power output during ergometer cycling
(Brümmer et al. 2011; Schneider et al. 2013), however, as cycling involves the
coordination of a number of muscles performing anisometric contractions, it is
plausible that cortical activity concerning motor variables other than force may
have contributed to these increases in sensorimotor activity. Indeed Ashe (1997)
suggested that static and dynamic force outputs may be controlled by
fundamentally different cortical processes. Moreover, the cortical responses to
whole body exercise (i.e. a dynamic, bilateral multiple joint motor task with more
comprehensive physiological (e.g. cardiovascular) responses) could be very
different to isolated single-joint motor tasks. In either case, these possibilities
were beyond the scope of the current investigation.
The present results are in contrast to a number of studies using fMRI measures
of cortical activation (Dai et al. 2001; Cramer et al. 2002; Ward & Frackowiak
2003; van Duinen et al. 2008; Keisker et al. 2009), which have observed linear
relationships between activation within a highly localised region of the
sensorimotor cortex and isometric contraction force. Current EEG technologies
Chapter 4
72
have a lower spatial resolution compared with fMRI techniques, which may limit
their sensitivity to changes in the activity of what may be only a small percentage
of sensorimotor cells that regulate isometric torque production (Ashe 1997).
Direct measures of neuronal activity offering a greater spatial resolution may be
required before any firm conclusions can be made. Future research should
therefore aim to measure the site-specific modulations in cortical activity with a
greater spatial resolution than is currently available with EEG, for example with
the use of magnetoencephalography (MEG).
In addition to the limited spatial precision provided by EEG, the location of the
brain from which the analysed signal was recorded was estimated based on a
standard (Montreal Neurological Institute) model. Differences in anatomy as well
as minor misplacements of the EEG cap would have resulted in the modelled
brain coordinates referring to different regions of the cortex within each
participants’ brain. In an attempt to accommodate for this inaccuracy, a large
area of the modelled brain was selected as potentially representing the leg area
of the sensorimotor cortex (see Appendix 3.1). The disadvantage of this
approach was that the selected region of interest for each participant may have
related to different regions of their cortex, and the calculation of group averages
across different regions of the participants’ cortex could have affected the results.
Obtaining anatomical MRIs of each participant’s brain would enable
coregistration of the recorded EEG signal with the topography of each
participants’ cortex. This would provide a level of control that the sampled EEG
were arising from the same region of the cortex in each individual.
Finally, a lack of overall samples at each torque level should be acknowledged.
This would have affected the signal-to-noise ratio of the results, and
compromised the ability of the analyses to discern changes in beta oscillatory
power from rest.
In conclusion; gamma band activity within the sensorimotor cortex, recorded
during muscular contraction, was shown to exhibit a subtle overall increase with
increments in isometric knee-extension torque, however, whether this
phenomenon reflects an explicit relationship with muscular force or a more
general increase in other task-related processes (e.g. attention) is not clear. Total

Chapter 4
73
CCD and sensorimotor cortical activity at lower frequencies (delta, theta, alpha
and beta) were not modulated by torque output over the range 15 to 60%MVT.
Chapter 4
74
Chapter 4
Modulation of post-movement beta
rebound by contraction force and rate of
force development
Chapter 4
75
4.1 – Abstract
Movement induced modulation of neural oscillations in the beta band are one of
the most robust neural oscillatory phenomena in the brain. In the preparation and
execution phases of movement, a loss in beta oscillatory amplitude is observed
(the movement related beta decrease (MRBD)). This is followed by a rebound
above baseline on movement cessation (the post movement beta rebound
(PMBR)). These effects have been measured widely, and recent work suggests
that they may have significant importance: They have potential to form the basis
of biomarkers for disease, and have been used in neuroscience applications
ranging from brain computer interfaces to markers of neural plasticity. However,
despite the robust nature of both MRBD and PMBR, the effects themselves are
poorly understood. In this study, a carefully controlled isometric wrist flexion
paradigm was employed to isolate two fundamental movement parameters; force
output, and the rate of force development (RFD). The results show that neither
altered force output nor RFD has any effect on the MRBD. In contrast, PMBR
was altered by both parameters: specifically, the force output of a muscle
contraction significantly modulates PMBR, with higher force resulting in greater
amplitude. RFD also modulates PMBR, with a greater RFD resulting in a PMBR
which is significantly higher in amplitude and shorter in duration. These findings
demonstrate that careful control of movement parameters can systematically
change PMBR; further for temporally protracted movements (low RFD) the PMBR
can be over 7s in duration. This means accurate control of movement and
judicious selection of paradigm parameters are critical in future clinical and basic
neuroscientific studies of sensorimotor cortex beta oscillations.
Chapter 4
76
4.2 – Introduction
Neural oscillations are a ubiquitous phenomenon generated in multiple brain
regions and observable using either invasive (microelectrode) or scalp based
(electroencephalography (EEG) or magnetoencephalography (MEG))
measurements. These oscillations comprise periodic signals typically measured
in the 1-200 Hz frequency range, and are generated by rhythmic electrical activity
synchronised across neuronal assemblies. They were first reported by Hans
Berger (Berger 1929), who measured differences in electric potential across the
scalp and noted the existence of an 8-13 Hz ‘alpha’ rhythm. Further prominent
frequency ranges have subsequently been identified including the delta (1-4 Hz),
theta (4-8 Hz), beta (13-30 Hz) and gamma (30-200 Hz) bands. Measurable
oscillations are present even when the brain is at “rest” (i.e. when a subject is
asked to “do nothing”) and for many years such effects were considered “brain
noise”. However more recently it has been shown that oscillations play an
important role in co-ordinating brain activity, with subtle and focal spatiotemporal
changes in oscillatory signatures being linked to stimulus presentation
(Stevenson et al. 2011), attentional shifts (Bauer et al. 2014) and task
performance (Puts et al. 2011).
In the sensorimotor system, motor action has been linked with robust changes in
neural oscillations in the beta band. Prior to and during unilateral movements a
decrease in beta amplitude is observed, beginning shortly before movement
onset and sustained throughout movement, with the largest effect occurring local
to contralateral primary sensorimotor cortex (Jasper & Penfield 1949; Salmelin &
Hari 1994; Pfurtscheller et al. 2003; Jurkiewicz et al. 2006). This is known as the
movement related beta decrease (MRBD). Following movement cessation, beta
oscillations exhibit a period of elevated (above baseline) amplitude, known as the
post-movement beta rebound (PMBR), which can last up to several seconds in
duration (Pfurtscheller et al. 1996; Jurkiewicz et al. 2006). These beta band
amplitude changes are extremely robust across individuals, they occur during
both internally (self-paced) and externally cued movements (Pfurtscheller &
Lopes da Silva 1999) as well as during cognitive tasks that require a motor
component (Brookes et al. 2012). In addition, similar effects are observed even in
Chapter 4
77
the absence of movement if, for example, a subject is asked to ‘think about
moving’ (Schnitzler et al. 1997; Pfurtscheller et al. 2005).
Despite their robustness, beta band changes remain relatively poorly understood.
High amplitude beta oscillations are thought to reflect inhibition (Cassim et al.
2001; Gaetz et al. 2011), a hypothesis supported by quantifiable relationships
between beta amplitude and local concentrations of the inhibitory
neurotransmitter gamma aminobutyric acid (GABA) (higher GABA concentrations
predict higher beta amplitude (Jensen et al. 2005; Gaetz et al. 2011; Hall et al.
2011; Muthukumaraswamy et al. 2013)). This means that the observed MRBD
likely reflects an increase in processing (reduced inhibition) during movement
planning and execution; whereas the PMBR is thought to reflect the active
inhibition of neuronal networks recruited during the preparation and execution
phases of the motor activity (Alegre et al. 2008; Solis-Escalante et al. 2012).
What is clear from recent work is that beta modulation, both during and after
stimulation, has great potential to be used as a biomarker for pathology, with
examples including Parkinson’s disease (S. Hall et al. 2014) and schizophrenia
[Robson et al., 2015]. Further, the PMBR has been used in neuroscientific
applications ranging from characterization of neural plasticity (Gaetz et al. 2010;
Mary et al. 2015) to use in brain computer interfaces (Pfurtscheller & Solis-
Escalante 2009). However, despite a vast number of emerging applications,
precise characterization of the neural generators of MRBD and PMBR, including
their modulation by task, remains incomplete.
Previous studies have shown little modulation of MRBD with task parameters. For
example, the reduction in beta amplitude during volitional contractions of the
fingers/arm has been shown to be unrelated to both movement speed (Stancák &
Pfurtscheller 1996; Stancák & Pfurtscheller 1995) and the weight of a
manipulated load (Pistohl et al. 2012; Stančák et al. 1997). In agreement,
Stevenson et al. [2011] showed that event related decreases in beta amplitude
within the visual cortices was not modulated by changing visual stimulus intensity
(Michelson contrast) or timing (drift frequency). Such findings have led some
authors to describe event related beta amplitude decrease as a cortical ‘gate’
with a ‘switching off’ of beta oscillations necessary to facilitate local ‘activity’.
(Indeed in the sensorimotor domain this might be consistent with the observation
Chapter 4
78
that Parkinson’s disease patients (with bradykinesia) exhibit abnormally high
resting amplitude of beta oscillations.) In contrast, PMBR is more variable in its
relationship with task parameters. Stevenson et al. [2012] found the beta rebound
to correlate negatively with inter-stimulus interval during median nerve electrical
stimulation. A greater PMBR has also been observed following finger extension
movements performed against a heavy resistive load compared to unloaded
extensions (Stančák et al. 1997), whereas no systematic difference in PMBR was
identified following slow and brisk finger movements (Stancák & Pfurtscheller
1996; Stancák & Pfurtscheller 1995; Stančák et al. 1997). At face value this may
suggest that PMBR is related to the magnitude of force output, but not to the
speed of muscular contraction. However, even during apparently simple
movement tasks numerous movement parameters are changing simultaneously
such as contraction force and rate of force development, but also joint position,
velocity and direction of movement (which determines the type of contraction i.e.
concentric, isometric or eccentric). To date, precise experiments investigating
neuro-oscillatory behaviour in response to single movement parameters are
lacking.
The present paper employs an isometric (static) task to remove the influence of
movement (joint position, velocity and direction of movement etc.) and thus
enables two fundamental parameters of motor output, force and rate of force
development (RFD), to be examined individually. MEG is used to measure MRBD
and PMBR in two experiments designed to isolate force and RFD as
systematically controlled independent variables, and hence elucidate their
influence on beta band oscillatory dynamics. In this way, it is shown that although
MRBD is unchanged by force or RFD, PMBR can be modulated systematically,
both in amplitude and duration.
4.3 – Methods
Subjects
Fifteen healthy adults (11 males, 2 left handed, age 28±5 (mean ± std) years)
with no known history of neurological conditions or neuromuscular / skeletal
Chapter 4
79
disorders, volunteered their participation. The experimental procedures were
approved by the Loughborough University Ethical Advisory Committee, and each
subject provided written informed consent prior to their involvement. All
experimental measurements were carried out in the MEG facility at the Sir Peter
Mansfield Imaging Centre, University of Nottingham, UK.
Experimental protocol
Subjects were seated upright in the MEG system with their right forearm and
hand positioned in a custom built isometric wrist-flexion dynamometer that was
secured rigidly to the armrest of the MEG system. The dynamometer held the
subject’s forearm in a neutral position of pronation/supination, radial/ulnar
deviation and wrist flexion/extension. In all experiments, subjects were asked to
exert wrist-flexion force against a cylindrical handle that was attached in series to
a strain gauge (see Figure 1A). During the experiment, subjects viewed a visual
display that showed (in real-time) force output as a function of time. Subjects
were shown a temporal profile of target force output prior to the initiation of
contraction and attempted to match their force output to the target profiles. During
the contraction real-time measured force output was overlaid on the target profile
and thus provided feedback (see Figures 1B and 1C). Two separate experiments
were undertaken in a pseudo-randomised order across subjects:
• Experiment 1 – Constant-force contractions: Subjects performed
contractions at four different force levels which were set at 5%, 15%, 35%
and 60% of the individual subject’s maximum voluntary force output (MVF).
Each contraction involved holding the target force as steadily as possible
for 3 s. The target profile (see Figure 1B) appeared on the visual display 3
s prior to the start of the prescribed constant-force contraction and
remained on screen for a total of 9.25 s (leaving a blank screen). A new
target profile appeared every 25 s. Three contractions were performed at
each force level, before proceeding to the next force level in ascending
order. This sequence of 12 contractions was repeated 5 times for a total of
60 contractions, providing 15 contractions at each force level (see also
Figure 1D).
Chapter 4
80
• Experiment 2 – Ramp contractions: Subjects performed ramp contractions
(i.e. a linear increase in force output over time) at three different rates of
force development (RFDs). Each contraction involved following a target
profile that increased linearly from rest to 65%MVF, in a time of 0.75, 2.25
or 6.75 s (see Figure 1C). Thus the prescribed RFDs were 86.7%, 28.9%
and 10.4% of the subject’s maximum voluntary force per second (MVF·s-1
),
respectively. The target profiles appeared 2 s prior to the start of the
prescribed ramp contraction and remained on screen for 9.25 s. A new
target profile appeared every 25 s. Four contractions were completed at
each RFD before proceeding to the next RFD in descending order, with
this sequence of 12 contractions repeated five times for a total of 60
contractions; 20 at each RFD (see Figure 1E).
In all subjects, the experimental session comprised determination of MVF,
followed by completion of the two MEG experiments described above. To
determine a subject’s MVF, subjects performed three maximal voluntary
contractions (no MEG acquisition), with 30 s rest between each. Subjects were
instructed to exert a maximum effort of wrist-flexion force continuously for 3 s,
with visual biofeedback and verbal encouragement provided. MVF was
determined as the overall peak force (averaged over a 200 ms epoch) during
these three contractions. In all subjects, a familiarisation session was completed
3-14 days prior to the experimental session. This involved subjects undertaking
the constant-force, ramp and MVF contractions until they were able to perform
each task with a high degree of accuracy. During MEG acquisition subjects were
instructed to refrain from any movements other than the prescribed wrist-flexion.
No verbal feedback was provided during performance of the experiments.
Subjects were asked to abstain from strenuous or atypical exercise for 36 hours
prior to the study, and to avoid the intake of nutritional stimulants (e.g. caffeine)
within two hours of the study.
Chapter 4
81
Figure 4.1 (A) A photograph of the isometric wrist-flexion dynamometer. (B/C)
Each target force profile (black) with single examples of real-time visual feedback
showing contraction force overlaid (red). B) Target profiles for the constant-force
contractions at 5% (top), 15% (upper centre), 35% (lower centre) and 60%
(bottom) maximal voluntary force. C) Target profiles for the ramp contractions,
with rates of force development of 86.7% (top), 28.9% (centre) and 10.4%
(bottom) maximum voluntary force output per second. (D) A schematic diagram
of the constant-force contractions experiment. (E) A schematic diagram of the
ramp contractions experiment. Blue, orange and green zones show time-periods
during which MRBD, PMBR (10-s window) and baseline oscillatory amplitude
were measured, respectively (one example shown; D&E). 12
Forc
e (%
MVF
)
Time (s)
A
D
E
×5
×5
25 s
25 s
Time (s)
Target profile Contraction force
B 5%MVF
15%MVF
35%MVF
60%MVF
0 3 6 9
C 86.7%MVF·s-1
28.9%MVF·s-1
10.4%MVF·s-1
0 3 6 9
60
0
60
0
60
0
60
0
65
0
65
0
65
0
Forc
e (%
MVF
)
Time (s)
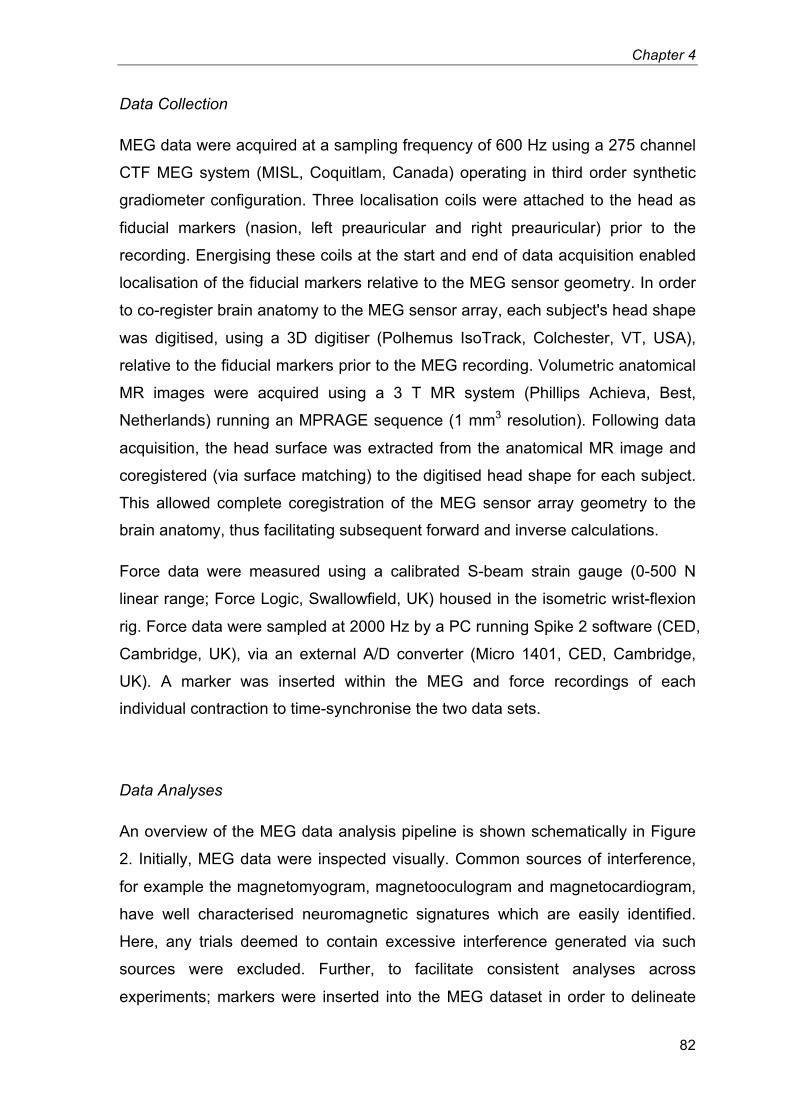
Chapter 4
82
Data Collection
MEG data were acquired at a sampling frequency of 600 Hz using a 275 channel
CTF MEG system (MISL, Coquitlam, Canada) operating in third order synthetic
gradiometer configuration. Three localisation coils were attached to the head as
fiducial markers (nasion, left preauricular and right preauricular) prior to the
recording. Energising these coils at the start and end of data acquisition enabled
localisation of the fiducial markers relative to the MEG sensor geometry. In order
to co-register brain anatomy to the MEG sensor array, each subject's head shape
was digitised, using a 3D digitiser (Polhemus IsoTrack, Colchester, VT, USA),
relative to the fiducial markers prior to the MEG recording. Volumetric anatomical
MR images were acquired using a 3 T MR system (Phillips Achieva, Best,
Netherlands) running an MPRAGE sequence (1 mm3 resolution). Following data
acquisition, the head surface was extracted from the anatomical MR image and
coregistered (via surface matching) to the digitised head shape for each subject.
This allowed complete coregistration of the MEG sensor array geometry to the
brain anatomy, thus facilitating subsequent forward and inverse calculations.
Force data were measured using a calibrated S-beam strain gauge (0-500 N
linear range; Force Logic, Swallowfield, UK) housed in the isometric wrist-flexion
rig. Force data were sampled at 2000 Hz by a PC running Spike 2 software (CED,
Cambridge, UK), via an external A/D converter (Micro 1401, CED, Cambridge,
UK). A marker was inserted within the MEG and force recordings of each
individual contraction to time-synchronise the two data sets.
Data Analyses
An overview of the MEG data analysis pipeline is shown schematically in Figure
2. Initially, MEG data were inspected visually. Common sources of interference,
for example the magnetomyogram, magnetooculogram and magnetocardiogram,
have well characterised neuromagnetic signatures which are easily identified.
Here, any trials deemed to contain excessive interference generated via such
sources were excluded. Further, to facilitate consistent analyses across
experiments; markers were inserted into the MEG dataset in order to delineate
Chapter 4
83
the start and end of a contraction. Contraction onset was defined as the time at
which force reached 2%MVF (ramp contractions) or the start of the plateau phase
on the target profile (constant-force contractions); contraction offset was
determined as the time at which the contraction force fell below 2%MVF when
returning to rest (both experiments).
Figure 4.2 Schematic diagram showing the MEG data analysis pipeline.13
MEG data acquisition Data sampled at 600 Hz using a 275
channel MEG system in third order
gradiometer configuration
Pre-processing Data visually inspected and filtered.
Contraction onsets and offsets marked
Beamforming Synthetic aperture magnetometry (SAM)
applied to spatially localise MRBD and
PMBR
Spatial normalisation Individual brain images
normalised to MNI space.
Individual locations of MRBD and
PMBR determined
Significance testing Influence of force and RFD on
MRBD and PMBR examined
Significance testing Location of PMBR and MRBD
compared statistically
Time-Frequency analysis Oscillatory amplitude within a-
priori determined time-frequency
windows calculated in order to
quantify MRBD and PMBR
Chapter 4
84
Spatial signature of beta changes
Following pre-processing, MEG data were analysed using synthetic aperture
magnetometry (SAM) (Vrba & Robinson 2001), a beamforming variant that has
been applied successfully to localise neural oscillatory amplitude changes in
many studies (van Drongelen et al. 1996; Van Veen et al. 1997; Robinson & Vrba
1998; Gross et al. 2001; Hillebrand et al. 2005). Data were first filtered to the beta
(15-30 Hz) band. This exact frequency band was iteratively determined by
generating time-frequency spectra (see below) and evaluating the banded power
responses. Importantly, the selection of a 15 Hz lower boundary avoided overlap
between beta and mu responses. Following this, oscillatory amplitude was
contrasted in active and control time windows in order to delineate the spatial
signatures of beta amplitude change. To localise MRBD:
• For the constant-force contractions, the active window was defined as
[0.75 < t < 2.75 s] relative to contraction onset.
• For the ramp contractions, the active window spanned [0.05 < t < 0.65 s],
[0.15 < t < 1.95 s] and [0.45 < t < 5.85 s] relative to contraction onset for
the 86.7, 28.9 and 10.4%MVF·s-1
contractions respectively.
In order to localise PMBR:
• An active window commencing 0.75 s after contraction offset and lasting
for 4 s was used for both the constant-force and ramp experiments.
In all cases control windows were defined within a [20.8 < t < 24.8 s] time window
relative to the initial presentation of the target profile. Note that the concatenated
duration of active and control windows were equal in each analysis (Brookes et al.
2008). The forward model was based upon a multiple local sphere head model
and the forward calculation by Sarvas (Sarvas 1987; Huang et al. 1999). Pseudo-
t-statistical images (5 mm3 isotropic resolution) were generated showing regions
of beta band oscillatory amplitude change between the active and control time
windows. Spatial clusters, occurring within sensorimotor regions were identified
and used as locations of interest (LOIs) for subsequent analysis.
Chapter 4
85
Time-frequency spectra
Following identification of LOIs using SAM, time-frequency spectrograms were
generated for each individual subject in order to measure oscillatory dynamics
throughout the experiment. A SAM beamformer was employed with weighting
parameters determined for each LOI using a covariance window spanning the
1Hz-150Hz frequency range, and a time window encompassing the entire
experimental recording (excluding trials rejected for excessive interference). The
derived beamformer weights for each location were multiplied by the MEG data
(filtered 1Hz-150Hz) in order to get a ‘virtual sensor’ time-series showing the
evolution of electrical activity at that location. Virtual sensor time-series were
frequency filtered into 31 overlapping frequency bands, and a Hilbert transform
was used to generate the amplitude envelope of oscillations within each band.
Specifically, the beta envelope of interest within the current investigation was
generated by combining two of these overlapping frequency bands (15-25 and
20-30 Hz). These envelope time-courses were then averaged across trials within
each condition type (i.e. 4 target forces for the constant-force contractions and 3
target RFDs for the ramp experiment). Averaged envelopes were then
concatenated in the frequency dimension to generate a single time-frequency
spectrum (TFS) per subject, for each LOI identified. TFSs were subsequently
averaged over all subjects leaving a single TFS for LOIs at the spatial maxima of
the MRBD and PMBR. Note that TFSs were temporally aligned to contraction
onset to examine MRBD, and contraction offset to analyse PMBR.
The effect of force/RFD on MRBD/PMBR
In order to assess the effect of force and RFD on MRBD and PMBR, first the
force measures were analysed. For the constant-force contractions, force output
was determined in the [0.75 < t < 2.75 s] window relative to contraction onset.
Average force values were calculated first within each individual (for each force
level), and subsequently across individuals to determine an overall group mean.
For each ramp contraction, RFD was calculated for each successive 10%MVF
increment in force between 2 and 62%MVF (i.e. 10%MVF/time taken). Overall
RFD for each individual contraction was then determined as the average RFD of
Chapter 4
86
these six increments. Mean averages of these values were again calculated
within each individual, and subsequently across subjects.
To assess the effect of force or RFD on neural oscillations, summary values of
MRBD and PMBR were extracted from the TFS data in each subject individually.
MRBD was calculated as the integral of beta amplitude within the same active
time windows as those used for SAM analyses (see above), and was divided by
the duration (in seconds) of the window. Thus MRBD represents the average
beta amplitude decrease during contraction. For the PMBR, the integral of the
beta envelope was calculated in the [0 < t < 10 s] window relative to contraction
offset in order to allow for this protracted response to reach baseline. (PMBR was
not normalised by duration.) For both the MRBD and PMBR responses, results
were generated based on LOIs for each response and each individual separately.
This analysis yielded a single value of both PMBR and MRBD, for each condition,
for each subject. These values were then averaged across subjects and plotted
against either force (constant-force experiment) or RFD (ramp experiment). In
addition, for the beta rebound, whether any observable changes in the measured
integral were driven by changes in PMBR amplitude or duration was investigated.
For this reason, post-hoc tests were also undertaken. Using data averaged
across trials and subjects, the PMBR duration was measured as the total
continuous time window during which the beta envelope was greater than 20% of
its overall maximum value. The PMBR amplitude was estimated as the mean
value of the envelope within this window.
In order to assess statistically the effect of force and RFD on MRBD and PMBR,
permutation testing was employed. A simple linear regression was applied to the
graphs of mean MRBD/PMBR versus force/RFD and the gradient of the
regression slope was determined. It was reasoned that if force/RFD was affecting
MRBD/PMBR then a non-zero gradient would be observed, whereas under a null
hypothesis where force/RFD had no effect, then the gradient would be close to
zero. It was further reasoned that under this null hypothesis, the order of
conditions (i.e. the order of the four force outputs in the constant-force
experiment, or equivalently the order of the three rates of force development in
Chapter 4
87
the ramp experiment) could be switched around with no effect on the result. This
latter consideration was used to form empirical null distributions testing for the
effect of 1) force on MRBD, 2) force on PMBR, 3) RFD on MRBD and 4) RFD on
PMBR. In each case, within each subject the order of conditions was switched
randomly (different random switch for each subject). The data were then
averaged across subjects to generate a ‘sham’ plot of mean MRBD/PMBR versus
force/RFD and the ‘sham’ linear regression slope determined. The gradient of the
regression slope in the ‘real’ data was then compared to the null distribution and
a p-value measured as the integral of the distribution between the real gradient
value and infinity divided by the total integral of the distribution.
For measurements of MRBD and PMBR integral a result was considered
significant at a level of 0.05; however, this was halved to account for a two tailed
test (i.e. either a significantly positive or negative gradient). It was further divided
by 4 to account for multiple comparisons across the 4 tests that were undertaken.
This meant that a p-value less than 0.00625 in any one single test would indicate
statistical significance. Measurements of PMBR duration and amplitude are
obviously related directly to integral metrics. These were therefore treated
separately to the integral measurements above. Four separate two tailed tests
were performed to investigate amplitude and duration in the constant-force and
ramp experiments. In order to account for these multiple comparisons a false
discovery rate (FRD) correction was applied (Benjamini–Hochberg procedure).
Location of the MRBD/PMBR response
Finally, significant difference in the spatial location of MRBD and PMBR were
identified. First, individual brain images were normalised to an anatomical
standard (Montreal Neurological Institute (MNI) brain) using FLIRT in FSL, which
allowed for the formation of group means, and comparisons to be made between
the spatial locations of the MRBD and PMBR responses. Following this, the MNI
coordinates for each peak (MRBD and PMBR) in each subject were recorded.
Having obtained x (left-right) y (anterior-posterior) and z (inferior-superior) MNI
coordinates, the difference in location between MRBD and PMBR was measured
as a simple three element vector. It was reasoned that any systematic spatial
Chapter 4
88
shift between MRBD and PMBR would manifest as a vector with a consistent
direction (e.g. it might be hypothesised that in all subjects, PMBR would be
shifted in the positive y direction with respect to MRBD). For this reason,
significance of the spatial shift was determined using a two-sided signed rank test
of the null hypothesis that any difference in x, y or x coordinates originated from a
distribution whose median is zero. The threshold for significance (p < 0.05) was
Bonferroni corrected (by dividing by 6 to give 0.0083) to account for multiple
comparisons across the 3 elements of the vector, and the two separate
experiments (constant-force and RFD).
4.4 – Results
All subjects were able to accurately perform the prescribed motor tasks. The
force outputs (group mean ± standard deviation) during the constant-force
contractions were 5.4±0.3, 15.3±0.5, 34.9±0.5 and 59.4±0.5%MVF. The mean
RFDs during the ramp contractions were 86.4±9.9, 29.7±1.5 and
9.9±0.3%MVF·s-1
.
Figure 3 shows the primary results of the constant-force experiment. The spatial
signatures of MRBD and PMBR, in an individual representative subject, are
shown in Figures 3A and 3E respectively. A clear MRBD, local to sensorimotor
cortex was observed in all subjects, and a clear PMBR, again local to
sensorimotor cortex was observed in 13 of the 15 subjects (see also the spatial
analysis below). Time-frequency spectrograms, averaged across subjects, are
shown in Figures 3B and 3F; Figure 3B shows the case for LOI at the peak
MRBD and Figure 3F shows the case for LOI at the peak PMBR. In both cases,
the upper panel shows 5%MVF, the upper middle 15%MVF, the lower middle
35%MVF and the bottom panel 60%MVF. In all of the TFS plots, blue represents
a decrease in oscillatory amplitude with respect to baseline whereas yellow
reflects an increase. Note that for MRBD, time zero indicates contraction onset;
for PMBR, time zero indicates contraction offset. A clear decrease in beta
oscillations (the MRBD) is observed both preceding and throughout the motor
task. This is followed by an increase above baseline following task cessation (the
PMBR). Given the close spatial proximity of the peaks in MRBD and PMBR it is
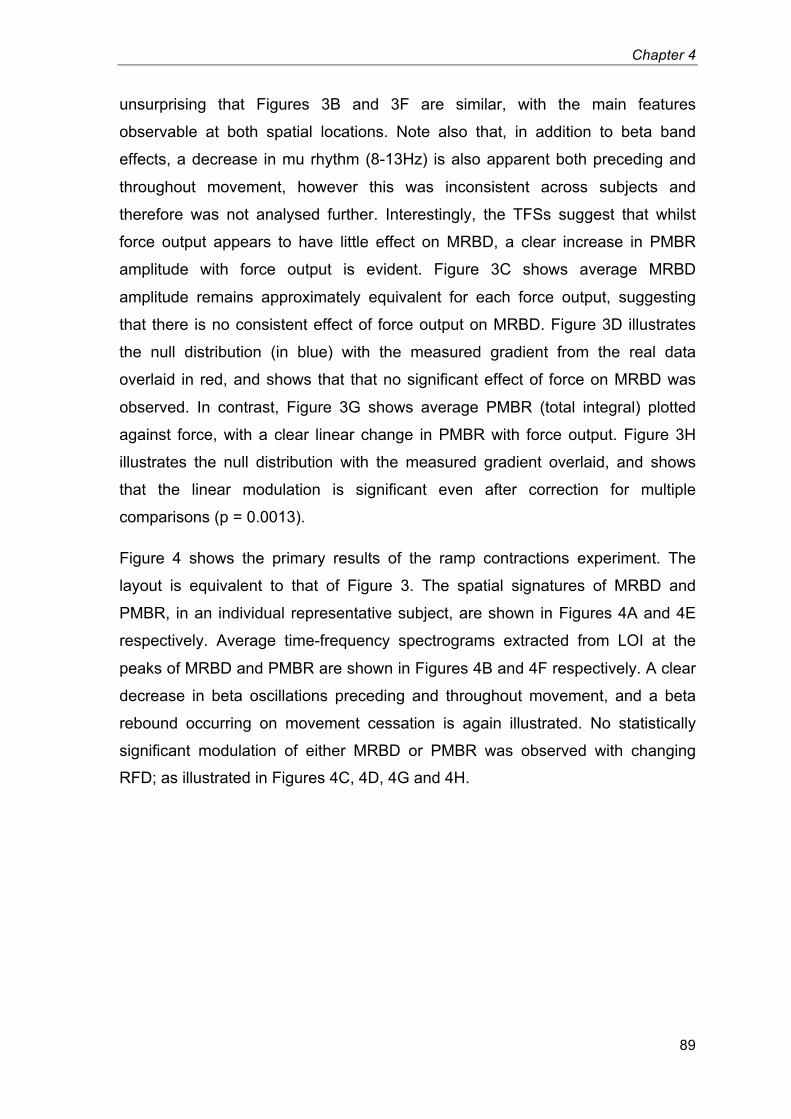
Chapter 4
89
unsurprising that Figures 3B and 3F are similar, with the main features
observable at both spatial locations. Note also that, in addition to beta band
effects, a decrease in mu rhythm (8-13Hz) is also apparent both preceding and
throughout movement, however this was inconsistent across subjects and
therefore was not analysed further. Interestingly, the TFSs suggest that whilst
force output appears to have little effect on MRBD, a clear increase in PMBR
amplitude with force output is evident. Figure 3C shows average MRBD
amplitude remains approximately equivalent for each force output, suggesting
that there is no consistent effect of force output on MRBD. Figure 3D illustrates
the null distribution (in blue) with the measured gradient from the real data
overlaid in red, and shows that that no significant effect of force on MRBD was
observed. In contrast, Figure 3G shows average PMBR (total integral) plotted
against force, with a clear linear change in PMBR with force output. Figure 3H
illustrates the null distribution with the measured gradient overlaid, and shows
that the linear modulation is significant even after correction for multiple
comparisons (p = 0.0013).
Figure 4 shows the primary results of the ramp contractions experiment. The
layout is equivalent to that of Figure 3. The spatial signatures of MRBD and
PMBR, in an individual representative subject, are shown in Figures 4A and 4E
respectively. Average time-frequency spectrograms extracted from LOI at the
peaks of MRBD and PMBR are shown in Figures 4B and 4F respectively. A clear
decrease in beta oscillations preceding and throughout movement, and a beta
rebound occurring on movement cessation is again illustrated. No statistically
significant modulation of either MRBD or PMBR was observed with changing
RFD; as illustrated in Figures 4C, 4D, 4G and 4H.
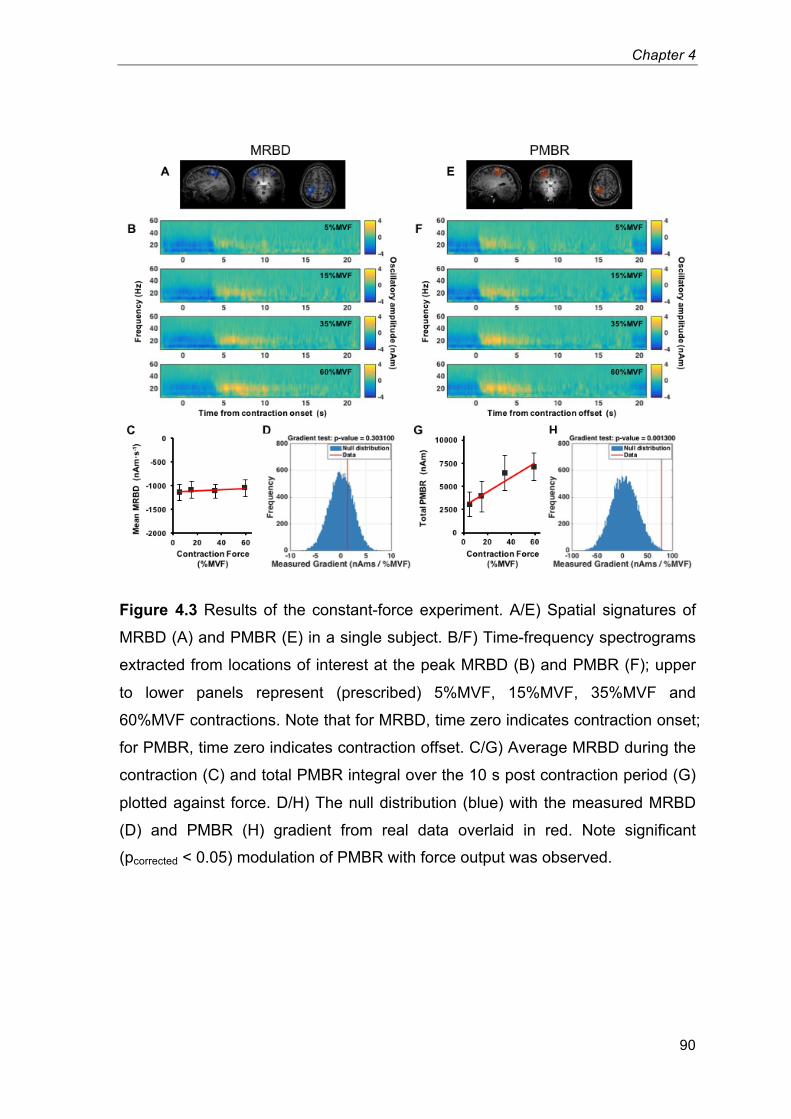
Chapter 4
90
Figure 4.3 Results of the constant-force experiment. A/E) Spatial signatures of
MRBD (A) and PMBR (E) in a single subject. B/F) Time-frequency spectrograms
extracted from locations of interest at the peak MRBD (B) and PMBR (F); upper
to lower panels represent (prescribed) 5%MVF, 15%MVF, 35%MVF and
60%MVF contractions. Note that for MRBD, time zero indicates contraction onset;
for PMBR, time zero indicates contraction offset. C/G) Average MRBD during the
contraction (C) and total PMBR integral over the 10 s post contraction period (G)
plotted against force. D/H) The null distribution (blue) with the measured MRBD
(D) and PMBR (H) gradient from real data overlaid in red. Note significant
(pcorrected < 0.05) modulation of PMBR with force output was observed.14
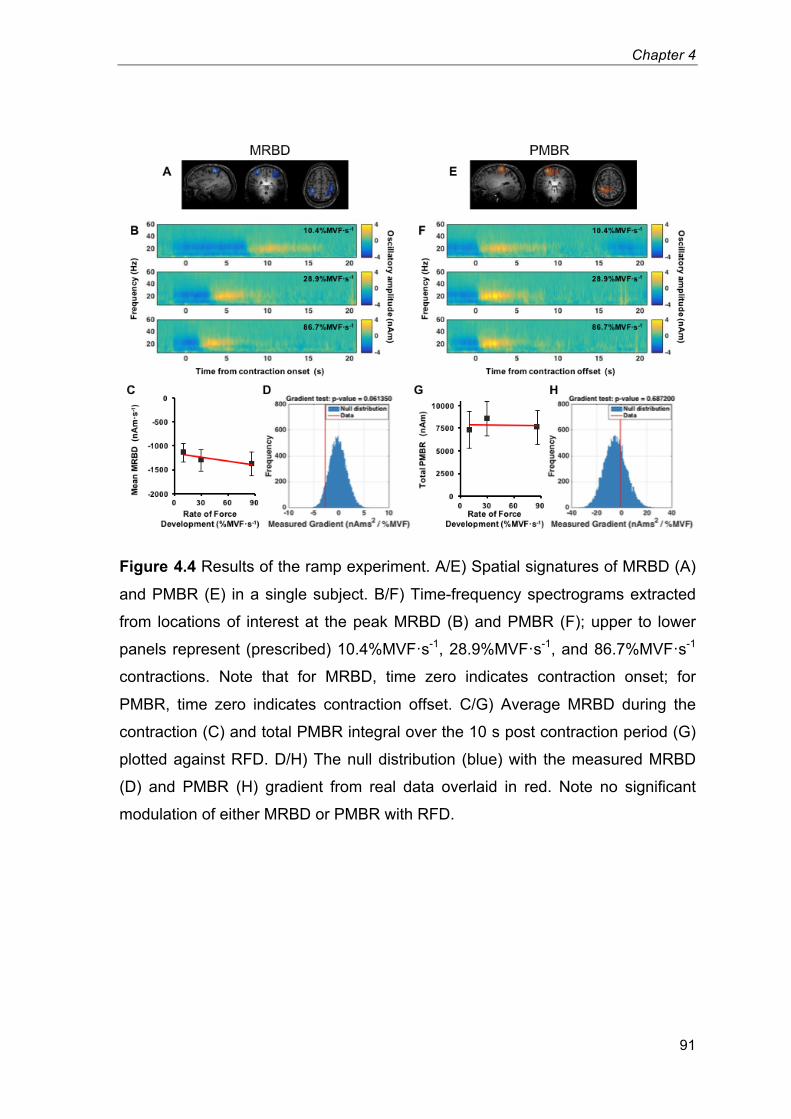
Chapter 4
91
Figure 4.4 Results of the ramp experiment. A/E) Spatial signatures of MRBD (A)
and PMBR (E) in a single subject. B/F) Time-frequency spectrograms extracted
from locations of interest at the peak MRBD (B) and PMBR (F); upper to lower
panels represent (prescribed) 10.4%MVF·s-1
, 28.9%MVF·s-1
, and 86.7%MVF·s-1
contractions. Note that for MRBD, time zero indicates contraction onset; for
PMBR, time zero indicates contraction offset. C/G) Average MRBD during the
contraction (C) and total PMBR integral over the 10 s post contraction period (G)
plotted against RFD. D/H) The null distribution (blue) with the measured MRBD
(D) and PMBR (H) gradient from real data overlaid in red. Note no significant
modulation of either MRBD or PMBR with RFD.15
Chapter 4
92
The results above show only MRBD and PMBR integral. However, for the PMBR,
an increased integral, which was measured in the [0 < t < 10 s] window post
contraction offset, could be driven either by an increase in amplitude of the
response, an increased duration of the response, or a combination of the two. For
this reason, both PMBR amplitude and duration were tested further. Figure 5
shows PMBR amplitude and duration measured during the constant-force
experiment. Figure 5A shows the time-courses of the beta envelopes in blue, with
estimated duration and mean amplitude overlaid in black. Figure 5B shows the
duration of the PMBR plotted against force output (upper panel), and Figure 5C
shows amplitude of the PMBR plotted against force output (upper panel). These
relationships are tested statistically in the lower panels of Figures 5B and 5C.
Note that the increase in PMBR amplitude with force is significant (p = 0.008).
However, the apparent increase in PMBR duration with force did not reach
significance following FDR correction.
Figure 6 shows the PMBR amplitude and duration measured during the ramp
experiment. Figure 6A shows the time-courses of the beta envelopes in blue, with
the estimated duration and mean amplitude overlaid in black. Figure 6B shows
the duration of PMBR plotted against RFD whilst Figure 6C shows amplitude of
the PMBR plotted against RFD. The lower panels of Figures 6B and 6C show
associated statistical testing. Interestingly, PMBR duration reduces significantly
(p = 0.008) with RFD, PMBR amplitude increases significantly (p = 0.004). It is
noteworthy that these two significant results combine to generate the negative
result (shown in Figure 4G) that PMBR integral is unaffected by RFD. This finding
is discussed further below.
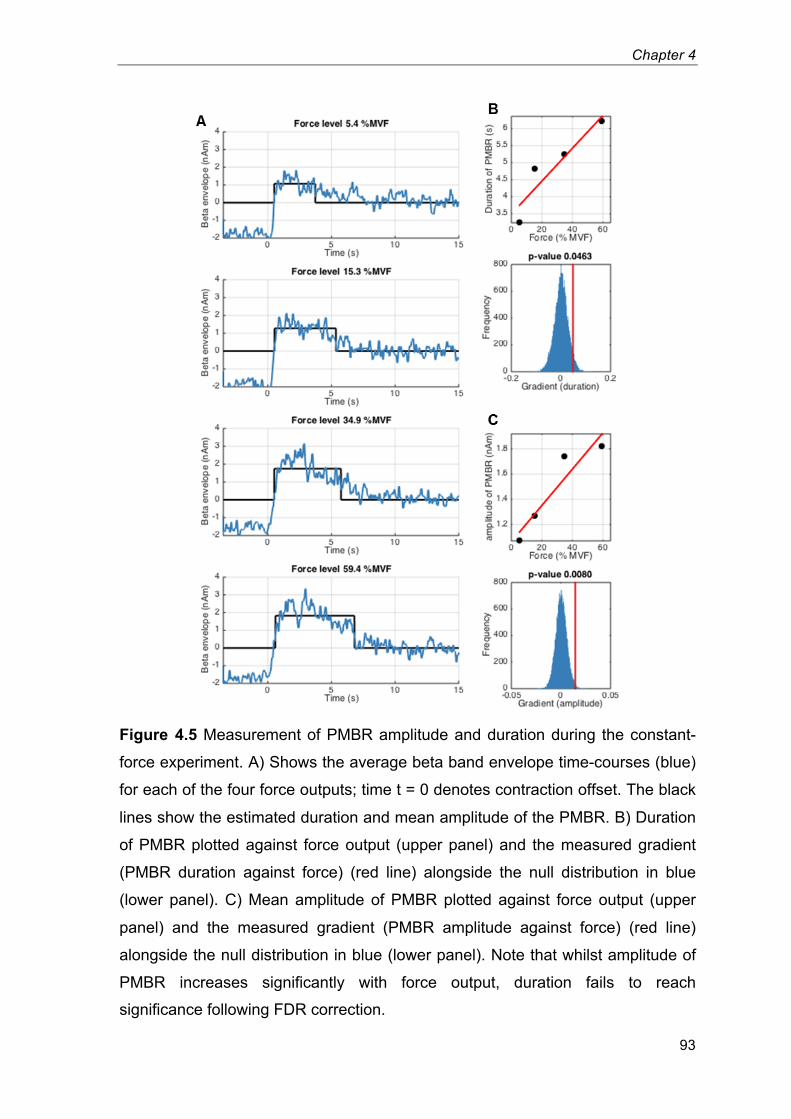
Chapter 4
93
Figure 4.5 Measurement of PMBR amplitude and duration during the constant-
force experiment. A) Shows the average beta band envelope time-courses (blue)
for each of the four force outputs; time t = 0 denotes contraction offset. The black
lines show the estimated duration and mean amplitude of the PMBR. B) Duration
of PMBR plotted against force output (upper panel) and the measured gradient
(PMBR duration against force) (red line) alongside the null distribution in blue
(lower panel). C) Mean amplitude of PMBR plotted against force output (upper
panel) and the measured gradient (PMBR amplitude against force) (red line)
alongside the null distribution in blue (lower panel). Note that whilst amplitude of
PMBR increases significantly with force output, duration fails to reach
significance following FDR correction.16
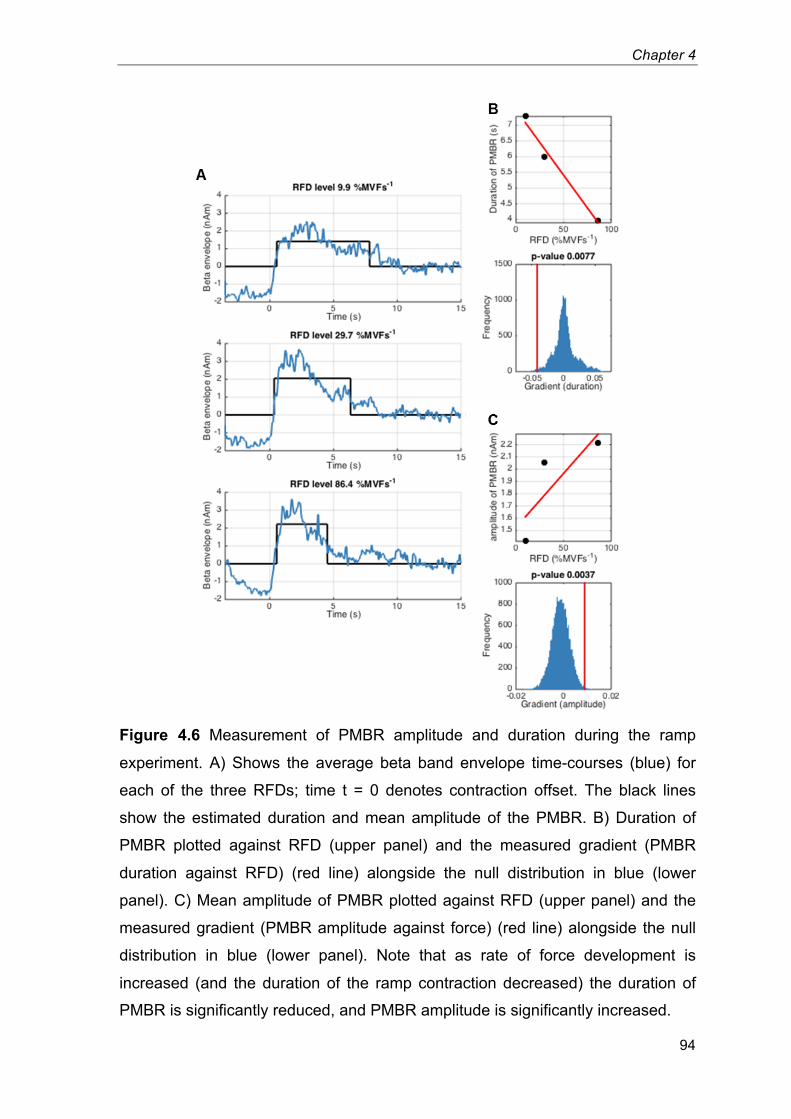
Chapter 4
94
Figure 4.6 Measurement of PMBR amplitude and duration during the ramp
experiment. A) Shows the average beta band envelope time-courses (blue) for
each of the three RFDs; time t = 0 denotes contraction offset. The black lines
show the estimated duration and mean amplitude of the PMBR. B) Duration of
PMBR plotted against RFD (upper panel) and the measured gradient (PMBR
duration against RFD) (red line) alongside the null distribution in blue (lower
panel). C) Mean amplitude of PMBR plotted against RFD (upper panel) and the
measured gradient (PMBR amplitude against force) (red line) alongside the null
distribution in blue (lower panel). Note that as rate of force development is
increased (and the duration of the ramp contraction decreased) the duration of
PMBR is significantly reduced, and PMBR amplitude is significantly increased.17
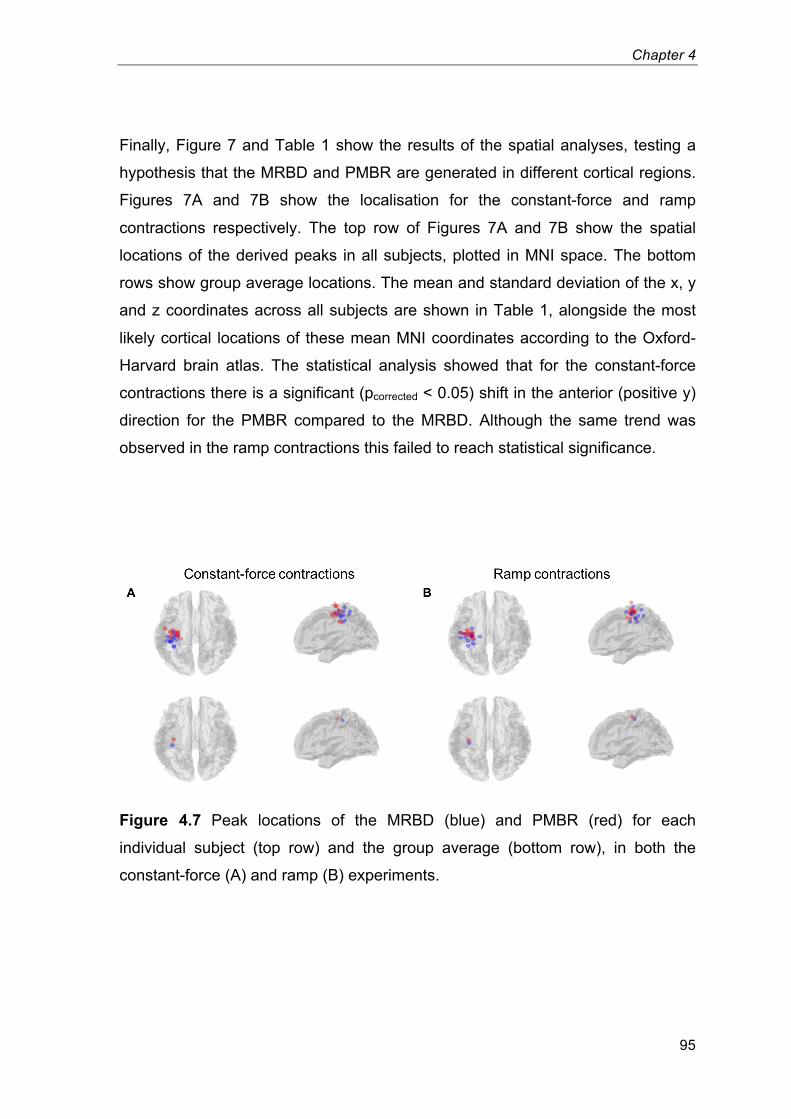
Chapter 4
95
Finally, Figure 7 and Table 1 show the results of the spatial analyses, testing a
hypothesis that the MRBD and PMBR are generated in different cortical regions.
Figures 7A and 7B show the localisation for the constant-force and ramp
contractions respectively. The top row of Figures 7A and 7B show the spatial
locations of the derived peaks in all subjects, plotted in MNI space. The bottom
rows show group average locations. The mean and standard deviation of the x, y
and z coordinates across all subjects are shown in Table 1, alongside the most
likely cortical locations of these mean MNI coordinates according to the Oxford-
Harvard brain atlas. The statistical analysis showed that for the constant-force
contractions there is a significant (pcorrected < 0.05) shift in the anterior (positive y)
direction for the PMBR compared to the MRBD. Although the same trend was
observed in the ramp contractions this failed to reach statistical significance.
Figure 4.7 Peak locations of the MRBD (blue) and PMBR (red) for each
individual subject (top row) and the group average (bottom row), in both the
constant-force (A) and ramp (B) experiments. 18
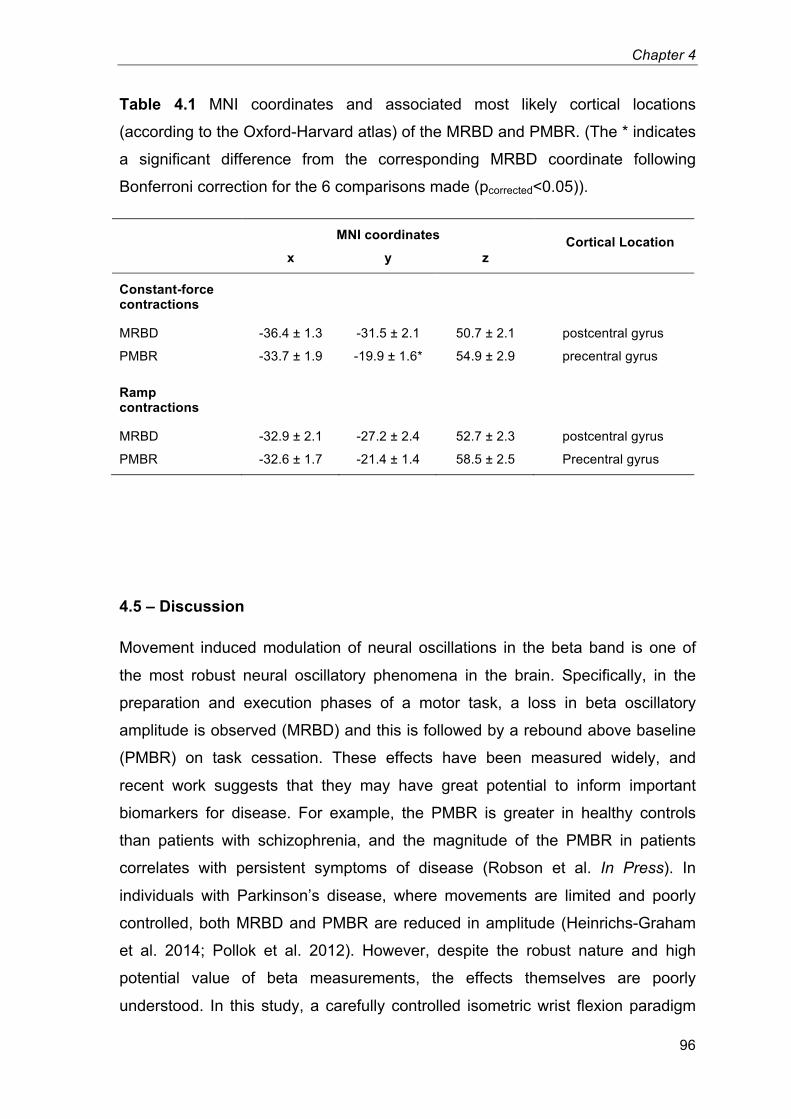
Chapter 4
96
Table 4.1 MNI coordinates and associated most likely cortical locations
(according to the Oxford-Harvard atlas) of the MRBD and PMBR. (The * indicates
a significant difference from the corresponding MRBD coordinate following
Bonferroni correction for the 6 comparisons made (pcorrected<0.05)).3
MNI coordinates Cortical Location x y z
Constant-force contractions
MRBD -36.4 ± 1.3 -31.5 ± 2.1 50.7 ± 2.1 postcentral gyrus
PMBR -33.7 ± 1.9 -19.9 ± 1.6* 54.9 ± 2.9 precentral gyrus
Ramp contractions
MRBD -32.9 ± 2.1 -27.2 ± 2.4 52.7 ± 2.3 postcentral gyrus
PMBR -32.6 ± 1.7 -21.4 ± 1.4 58.5 ± 2.5 Precentral gyrus
4.5 – Discussion
Movement induced modulation of neural oscillations in the beta band is one of
the most robust neural oscillatory phenomena in the brain. Specifically, in the
preparation and execution phases of a motor task, a loss in beta oscillatory
amplitude is observed (MRBD) and this is followed by a rebound above baseline
(PMBR) on task cessation. These effects have been measured widely, and
recent work suggests that they may have great potential to inform important
biomarkers for disease. For example, the PMBR is greater in healthy controls
than patients with schizophrenia, and the magnitude of the PMBR in patients
correlates with persistent symptoms of disease (Robson et al. In Press). In
individuals with Parkinson’s disease, where movements are limited and poorly
controlled, both MRBD and PMBR are reduced in amplitude (Heinrichs-Graham
et al. 2014; Pollok et al. 2012). However, despite the robust nature and high
potential value of beta measurements, the effects themselves are poorly
understood. In this study, a carefully controlled isometric wrist flexion paradigm
Chapter 4
97
was employed to isolate two important movement parameters; namely force
output and the rate of force development (RFD). The results show that neither
altered force output nor RFD has any effect on the MRBD. In contrast, PMBR
was systematically altered by both parameters; specifically, higher force output
results in significantly greater PMBR amplitude. Further, a greater RFD results in
a PMBR which is shorter in duration, and higher in amplitude.
The finding that MRBD is related to neither force output nor RFD supports a
number of previous studies suggesting that the event related beta decrease acts
as a cortical ‘gate’, the magnitude of which is unrelated to stimulus parameters.
The results are also in accordance with previous investigations suggesting that
neither contraction force (Cremoux et al. 2013; Stančák et al. 1997) nor
movement velocity (Stancák & Pfurtscheller 1996; Stancák & Pfurtscheller 1995)
influence MRBD observed during contractions. In addition, previous work has
shown a distinct ‘on/off’ property to stimulus evoked beta amplitude reductions,
not only in sensorimotor cortex but also in the visual and somatosensory systems
(Stevenson et al. 2011; Stevenson et al. 2012). In contrast, previous investigation
into the PMBR has found it to be more variable across stimulus conditions
(Stevenson et al. 2012). Nevertheless, to the author’s knowledge this paper
represents the first demonstration of monotonic increase in PMBR amplitude with
force output, and the first demonstration of increased PMBR amplitude and
decreased duration with RFD. The results are in some agreement with those of
Stančák et al. [1997] who demonstrated a greater PMBR following loaded finger
extensions against their heaviest external load (130 g) compared to their
unloaded extensions; although other movement parameters, including RFD,
would also have varied between different external loads. Contrary to the current
findings, no difference in PMBR was reported following isometric elbow flexion
between 25 and 75% maximal force (Cremoux et al. 2013). The reason for this
discrepancy is not clear, and further investigation of this phenomenon, including
whether it may differ across muscle groups, may therefore be warranted.
Prior to more focussed discussion of the results, it is helpful to understand the
purported role of beta oscillations. In general, beta oscillations are thought to
exert an inhibitory influence within the sensorimotor system, with a decrease in
beta amplitude potentially reflecting a switch to a state in which a greater range of
Chapter 4
98
movements can be made. It has been shown that voluntary movements are
slowed during periods of high beta oscillations (Gilbertson et al. 2005), and when
beta rhythms are entrained using transcranial alternating-current stimulation
(Pogosyan et al. 2009). In addition, it is known that attending to a particular
location in the body causes shifts in beta amplitude (Bauer et al. 2012; van Ede
et al. 2014), consistent with the notion that such events inhibit ipsilateral cortex
and promote encoding in contralateral cortex. The increase (above baseline
levels) in beta amplitude following a movement (the PMBR) has been suggested
to reflect inhibition of motor activity (Alegre et al. 2008; Solis-Escalante et al.
2012), which may facilitate motor control by preventing the generation of further
unwanted movements.
The precise relationship between oscillatory amplitude (which reflects high
synchrony across many neurons) and inhibition is not clear, however it has been
argued that reduced synchrony allows greater flexibility to encode information in
cellular assemblies (Brookes et al. 2015). Further evidence for the inhibitory
influence of beta synchrony comes from neurochemistry. Beta oscillations likely
depend upon a delicate balance between excitation and inhibition. This in turn is
primarily driven by glutamate (the major excitatory neurotransmitter in the cortex)
and GABA (the major inhibitory neurotransmitter in the cortex). There is good
evidence to suggest that beta modulation is strongly related to GABAergic
inhibition. For example, using magnetic resonance spectroscopy, Gaetz et al.
[2011] have shown that the magnitude of PMBR across subjects correlates
positively with individual subject GABA levels, pointing towards a positive
influence of GABA on PMBR. Muthukumaraswamy and colleagues [2013] have
provided evidence that blocking GABA uptake via administration of Tiagabine
alters baseline and task induced modulation of beta oscillations. A separate
pharmaco-MEG study by Hall et al. [2011] used administration of the GABA-A
receptor modulator diazepam to show that MRBD is a GABA-A mediated process
whereas PMBR appeared to be generated by a non-GABA-A mediated process.
Collectively, this evidence points towards the beta band response being a
potential marker of GABAergic inhibition. If this is indeed the case, then the beta
band response offers a direct and non-invasive way to probe neurochemical
Chapter 4
99
imbalance in diseases such as schizophrenia where there is good evidence that
GABA levels may be disturbed.
In the present study, the findings provide new information with regards to the
PBMR which may help to disentangle its functional role and generate new
hypotheses to be tested in future work. It was shown that, with greater force
output an increase in PMBR amplitude is observed (Figure 5) but there is no
significant change in the duration of the response. This potentially suggests that a
greater degree of inhibitory control is required following high force contraction in
order to return to a pre-contraction state. When peak force output is kept constant
but the duration over which this force is attained is decreased, (i.e. increasing
RFD) PMBR duration decreases while amplitude increases (Figure 6). These two
components of the rebound (amplitude and duration) might be affected by
independent aspects of the task, for example; it is possible that the variation in
duration of the rebound might be related to the duration of the stimulus; i.e.
longer stimulus durations will result in longer rebounds. Previous work
(Stevenson et al. 2011) investigated the effect of increasing the duration of the
motor stimulus (1 to 6 s) on beta responses and found increases in the integrated
PMBR with increased stimulus duration up to 4 s. However, the paradigm design
meant that as stimulus duration increased, the “rest period” decreased (minimum
4 s) (in order to maintain a constant trial length). Therefore, any prolongation of
PMBR may not have been fully captured, and more importantly, measures of
baseline beta amplitude may have been collected during the latter stages of the
PMBR, resulting in underestimation of the PMBR and overestimation of MRBD
during the longer duration stimuli. Indeed, short inter-stimulus intervals are a
consistent problem in studies of this type. the current findings show that the
duration of the PMBR can be in excess of 7 s. Therefore, when interpreting the
changes in oscillatory power, both during and following stimulation, it is important
to ensure that the electrophysiological response has fully returned to baseline
before baseline itself is quantified.
The variation in amplitude of the rebound with RFD is less intuitive. Recall that in
the RFD experiment, the peak force output is maintained for all RFDs, and only
the rate at which that force is attained is varied. The constant force experiment
showed a clear increase in PMBR with force output and, if one believes the
Chapter 4
100
simplest hypothesis that PMBR amplitude is affected by force alone, then the
finding of significantly modulated PMBR amplitude in the RFD experiment is
counter intuitive. Although highly speculative, it is possible that this difference in
amplitude may be driven by competing excitatory and inhibitory effects. When
contractions are sustained over a longer time period, the sensation of the handle
in the subjects’ hand may be retained following stimulus cessation, thereby
causing a sensory aftereffect which might dampen the post-stimulus rebound by
evoking a concurrent stimulus for beta decrease. For example, it may be the case
that, under a hypothesis that MRBD and PMBR have different neural generators,
the sensory aftereffect would generate MRBD in sensory cortex, but the
cessation of contraction would generate PMBR in motor cortex. The inherent
spatial smoothness of the beamformer estimated time series would necessarily
mix these two effects, so increased aftereffect induced MRBD could artifactually
decrease the apparent PMBR. This dampening of post-stimulus effects due to
aftereffects has previously been reported for visual stimuli (static versus flashing
checkerboards) in EEG alpha rebounds (Mullinger et al. 2015) and functional
Magnetic Resonance Imaging (fMRI) post-stimulus responses (Sadaghiani et al.
2009; Mullinger et al. 2015).
This study has provided some evidence that the MRBD and PMBR originate via
different neural generators. The idea that the MRBD and PMBR are
fundamentally different processes is well established; for example, Donner and
Siegel [2011] proposed that decreased beta amplitude is associated with local
encoding processes, whereas increased post stimulus beta amplitude is
associated with integrative processes over large networks. Firstly, the
observation that MRBD was not related to either force or RFD, whereas PMBR
was, adds support to suggestions that these may be independent phenomena
(Feige et al. 1996; Cassim et al. 2001; Jurkiewicz et al. 2006). Additionally, it was
shown that in one of the two experiments, a significant anterior shift in the spatial
location of the PMBR compared to the MRBD is measurable. These results are in
good agreement with several previous studies that have observed an anterior
shift in the PMBR compared to the MRBD (Stancák & Pfurtscheller 1995;
Salmelin et al. 1995; Jurkiewicz et al. 2006).
Chapter 4
101
Finally, the data presented here have important implications for the interpretation
of post-stimulus undershoots measured in fMRI data (Buxton 2012; van Zijl et al.
2012). This part of the response was historically believed to be vascular in origin
(Buxton et al. 1998) however there is a growing body of evidence that this
response reflects neuronal activity (Shmuel et al. 2006; Sadaghiani et al. 2009;
Mullinger et al. 2013). Recent work has shown that the post-stimulus fMRI
response to a 10 s median nerve stimulus is correlated with the EEG alpha
activity measured in a 10s window post-stimulation (Mullinger et al. 2013). The
work in this current study shows that, for long duration stimuli, the rebound will
occur on this time scale, rather than 1-3 s as is often previously reported. This
therefore provides potential new evidence for the link between electrophysiology
and fMRI measures of post-stimulus activity. Furthermore, previous studies have
noted some changes in fMRI undershoot amplitude and/or duration with varying
stimulus duration (Chen et al. 1998; Hu et al. 1997; Jin & Kim 2008). Conversely
a separate study showed no significant effects of stimulus amplitude or duration
on post-stimulus undershoot responses (Chen & Pike 2009) but in this study data
had been grouped over visual and motor cortices which may have hidden the
effects of interest in one sensory area. Further investigation is required to
determine whether task-specific modulations in the PMBR measured using MEG
might translate to the post-stimulus responses measured using fMRI.
Finally, the sole intention of the present study was to investigate the dependence
of beta band oscillatory phenomena on force output and RFD. Nevertheless, it is
important to note that a number of other electrophysiological effects are
observable in sensorimotor cortex, including the phase locked movement induced
evoked response. Previous work has suggested that the magnitude of these
movement-related cortical potentials might modulate with both force and RFD (do
Nascimento et al. 2005; Siemionow et al. 2000). No attempt to confirm these
findings was made as contraction kinematics surrounding force onset was not
carefully controlled, which would have undermined the validity of such analyses.
Future work should therefore aim to integrate these phase locked effects with
measurements of oscillatory power.
In conclusion, a carefully controlled isometric wrist flexion paradigm was
employed to isolate two fundamental movement parameters; force output, and
Chapter 4
102
the rate of force development (RFD). The results show that the amplitude of
movement related beta band decrease is the same regardless of changes in
either force or RFD. In contrast, systematically changing the force output of a
muscle contraction results in a linear modulation of PMBR, with a higher force
outputs resulting in greater amplitudes of post-stimulus response. Further, it was
found that increasing RFD generates significant increases in amplitude and
decreases in duration of PMBR. These findings demonstrate that careful control
of movement parameters can systematically change PMBR; further for temporally
protracted movements (low RFD) the PMBR can be over 7s in duration. This
means accurate control of movement and judicious selection of paradigm
parameters are critical in future clinical and basic neuroscientific studies of
sensorimotor cortex beta oscillations.
Chapter 5
The effect of physical fatigue on
oscillatory dynamics of the sensorimotor
cortex
Chapter 5
104
5.1 – Abstract
While physical fatigue is known to arise in part from supraspinal mechanisms
within the brain exactly how brain activity is modulated during fatigue is not well
understood. Therefore, this study examined how typical neuro-oscillatory
responses to voluntary muscle contractions were affected by fatigue. Eleven
healthy adults (age 27 (s = 4) years) completed two experimental trials in a
randomised crossover design. Both trials first assessed baseline maximal
voluntary isometric wrist-flexion force (MVFb). Participants then performed an
identical series of fourteen prescribed isometric wrist-flexor contractions (2 ×
100%MVFb, 10 × 40%MVFb, 2 × 100%MVFb) both before and after one of two
interventions: forty 12-s contractions at 55%MVFb (fatigue trial) or 5%MVFb
(control trial). Magnetoencephalography (MEG) was used to characterise both
the movement-related mu and beta decrease (MRMD and MRBD) and the post-
movement beta rebound (PMBR) within the contralateral sensorimotor cortex
during the submaximal (40%MVFb) contractions, while the maximal voluntary
contractions (100%MVFb) were used to monitor physical fatigue. The fatigue
intervention induced a substantial physical fatigue that endured throughout the
post-intervention measurements (28.9-29.5% decrease in MVF, P<0.001).
Fatigue had a significant effect on both PMBR (ANOVA, trial × time interaction:
P=0.018) and MRBD (P=0.021): the magnitude of PMBR increased following the
fatigue but not the control interventions, whereas MRBD was decreased post-
control but not post-fatigue. Mu oscillations were unchanged throughout both
trials. In conclusion, physical fatigue resulted in an increased PMBR, and offset
attenuations in MRBD.
Chapter 5
105
5.2 – Introduction
Physical fatigue can be defined as a reversible decline in the force generating
capacity of the neuromuscular system. During physical activity, fatigue arises not
only from peripheral processes within the active skeletal muscle(s) but also from
supraspinal mechanisms within the brain. Supraspinal fatigue is a component of
central fatigue, relating to a progressively suboptimal output from the motor
cortex. Supraspinal fatigue can account for as much as 66% of the exhibited
physical fatigue during a prolonged low-intensity muscle contraction (Smith et al.
2007), and as much as 30% during a 2-min maximal contraction (Taylor et al.
2006). Overall, fatigue has clear implications to physical performance, and may
be experienced as a chronic activity-limiting symptom that adversely affects the
quality of life in numerous patient groups. However, exactly how brain activity is
modulated during physical fatigue is not well understood. This is in large part due
to the difficulties in accurately recording brain activity in humans, particularly
during strenuous muscle contractions.
Previous attempts at neuroimaging the brain during physical fatigue have largely
relied upon functional magnetic resonance imaging (fMRI). Here, an increase in
sensorimotor ‘cortical activation’ is inferred from increases in the blood-oxygen-
level dependent (BOLD) fMRI signal, which have been found to accompany
fatigue onset during the performance of both maximal (J. Z. Liu et al. 2002;
Steens et al. 2012) and submaximal isometric contractions (Liu et al. 2003; van
Duinen et al. 2007; Benwell et al. 2007). However, the haemodynamically derived
fMRI signal is physiologically and temporally remote from the electrical activity
that is of primary interest as the method of communication within the brain.
Specifically, the electrophysiological interactions between neurons produce local
oscillations in electric and magnetic fields that can be measured non-invasively
using electroencephalography (EEG) and magnetoencephalography (MEG),
respectively. Moreover, MEG offers an improved spatial resolution and sensitivity
compared to electroencephalography (EEG), due in part to the fact that magnetic
fields are not distorted by the biological tissues between the cortex and recording
sensors (Cheyne 2013). Consequently, MEG can be used to record neuro-
oscillatory dynamics within highly localised regions of the cortex.
Chapter 5
106
In the sensorimotor system, motor action has been linked with robust changes in
neural oscillations in the mu (~7-15 Hz) and beta (~15-30 Hz) bands. During the
preparation and performance of unilateral movements, decreases in both mu and
beta amplitude are observed, with the largest effect occurring local to the
contralateral primary sensorimotor cortex (Jasper & Penfield 1949; Salmelin &
Hari 1994; Pfurtscheller et al. 2003). These phenomena are known as the
movement-related mu/beta decrease (MRMD/MRBD). Following movement
cessation beta oscillations then exhibit a period of elevated amplitude, known as
the post-movement beta rebound (PMBR) (Pfurtscheller et al. 1996; Jurkiewicz et
al. 2006). These phenomena have been measured widely, and recent work
suggests that they may have great potential to inform important biomarkers for
disease. For example, PMBR is greater in healthy controls than patients with
schizophrenia, and the magnitude of PMBR in patients correlates with persistent
symptoms of disease (Robson et al. In Press). In individuals with Parkinson’s
disease, where movements are limited and poorly controlled, both MRBD and
PMBR are reduced in amplitude (Heinrichs-Graham et al. 2014; Pollok et al.
2012). Additionally, these phenomena may have further clinical utility by
informing brain computer interfaces (Pfurtscheller & Solis-Escalante 2009).
Despite their robust nature and high potential value these movement-related
oscillatory phenomena are poorly understood. Specifically, whether these
phenomena are modulated by physical fatigue is largely unknown, even though
this may have important implications for the measurement and interpretation of
these phenomena and how it may also inform our understanding of the nature of
fatigue. One preliminary study measured sensorimotor oscillations during
submaximal contractions performed in a state of physical fatigue and reported an
elimination of MRBD (Tecchio et al. 2006). This might indicate a strong influence
of fatigue on the typically robust movement-related oscillatory dynamics
described above, crucially however, no control trial was conducted within this
study making it impossible to isolate fatigue and time/habituation effects.
Therefore, the purpose of this study was to conduct a rigorous investigation of
how movement-related oscillatory dynamics within the sensorimotor cortex are
influenced by physical fatigue.
Chapter 5
107
5.3 – Methods
Participants
Fourteen healthy adults with no known history of neurological or musculoskeletal
disorders volunteered their participation. Three participants found the fatigue
protocol (described below) particularly challenging, such that they were unable to
maintain the post-intervention contractions for the prescribed time, and were
omitted from subsequent analyses. This left a total of eleven participants (7
males, 2 left handed, age 27 ± 4 years [mean ± standard deviation]). The
experimental procedures were approved by the Loughborough University Ethical
Advisory Committee, and each participant provided written informed consent prior
to their involvement. All experimental measurements were carried out in the MEG
facility at the Sir Peter Mansfield Imaging Centre, University of Nottingham, UK.
Overview
Participants were well familiarised with the isometric wrist-flexion tasks and the
MEG environment prior to their participation in two experimental trials; conducted
in a randomised crossover design, ~7 days apart, and at a consistent time of day.
For both experimental trials, maximum voluntary force was first established at
baseline (MVFb), in order to prescribe the force of all subsequent contractions.
Each trial involved one of two interventions: a series of forty contractions of 12 s
duration at either 5%MVFb (control trial) or 55%MVFb (fatigue trial). Participants
also completed an identical series of fourteen contractions both pre- and post-
intervention; including ten contractions at 40%MVFb to measure movement-
related oscillatory dynamics with MEG, and a total of four maximal voluntary
contractions to monitor fatigue. Participants were advised to abstain from
strenuous or atypical exercise for 36 hours prior to each trial, and to avoid the
intake of nutritional stimulants (e.g. caffeine) within two hours of the trial. A
summary of the experimental protocols is illustrated in Figure 5.1.
Experimental set-up and force data collection
Chapter 5
108
Participants were seated upright in the MEG system with their right forearm and
hand positioned in a custom built isometric wrist-flexion dynamometer that was
secured to the armrest of the MEG system (Figure 5.1A&B). The dynamometer
held the participant’s arm in a neutral position of pronation/supination, radial/ulnar
deviation and wrist flexion/extension. Waist and right forearm straps were lightly
applied to maintain a consistent posture, but without risk of restricting blood flow.
Participants were instructed to exert wrist-flexion force against a cylindrical
handle that was attached in series to a strain gauge. Force data were measured
using a calibrated S-beam strain gauge (0-500 N linear range; Force Logic,
Swallowfield, UK) housed in the isometric wrist-flexion dynamometer. Force data
were sampled at 2000 Hz by a PC running Spike 2 software (CED, Cambridge,
UK), via an external A/D converter (Micro 1401, CED, Cambridge, UK). The
handle was sewn onto a mitt that participants wore throughout the trials to ensure
a consistent position of the handle relative to the hand (and therefore a constant
lever length). Participants were also instructed to refrain from any movements
other than the prescribed wrist-flexion (e.g. gripping).
Force prescription and feedback was facilitated by participants viewing a visual
display throughout the experimental procedures. They were presented with a
temporal profile of target force output prior to each of the prescribed contractions
and attempted to match their contraction force to the target profiles as closely as
possible. Real-time (measured) contraction force was overlaid on the target
profile and this provided feedback (see Figure 5.1C). The target force profile for
each contraction included a 2 or 3 s rest period (0%MVFb), a linear ramp of 1-s
duration, and a constant-force (plateau) phase at the prescribed force output.
Each profile was displayed on the screen for a total of either 10 s (40 and
100%MVFb contractions) or 15 s (5 and 55%MVFb contractions), and
disappeared to leave a blank screen immediately following each contraction.
Participants received prior instructions to cease the contraction as soon as the
target force profile had disappeared from the screen. A new target force profile
appeared on the display screen every 30 s. An additional 90 s of rest was
provided both before and after the 40-contraction interventions.
Chapter 5
109
Figure 5.1 A) A participant seated within the MEG scanner. B) A forearm
positioned within the isometric wrist-flexion dynamometer (white arrow denotes
direction of isometric force application). C) An example of a target force profile
with the real-time visual feedback of the performed contraction force overlaid. D)
A schematic of the experimental protocol. E) A schematic of the data
measurement periods (blue annotations) during the 40%MVF contractions. 19
Forc
e
Time
Target profile Contraction force
0
50
100
Forc
e (%
MVF
b)
×40
Intervention: Control = 5%MVFb
Fatigue = 55%MVFb
Pre-intervention contractions
Post-intervention contractions
A
D
CB
E
Time(s)
Force(M
VFb)
1s 6s
0.5s 5.5sForce,MMRD&MRBD:
PMBR:0– 10s
2%MVF
Contraction offset:
Chapter 5
110
Preliminary measurements
Each trial started with a short warm up of submaximal isometric wrist-flexions.
Participants then completed four maximal voluntary contractions, with 30 s rest
between contractions, from which a baseline value of maximal voluntary force
(MVFb) was established. Participants were instructed to exert a maximum effort of
wrist-flexion force continuously for 3 s, with visual biofeedback and verbal
encouragement provided. The peak force (200 ms epoch) during these
contractions was used as the measure of MVFb from which all subsequent force
outputs were prescribed. A 5-min rest was then provided before commencing the
pre-intervention contractions.
Pre- and post-intervention contractions and MEG data collection
Pre- and post-intervention contractions involved identical series of fourteen
prescribed wrist-flexion contractions: two maximal voluntary contractions
(MVFstart), ten contractions at 40%MVFb, and a further two maximal contractions
(MVFend) (Figure 5.1D). The 40%MVFb contractions were of 6-s duration, and
performed every 30-s, in order to measure neuro-oscillatory behaviour during
(MRMD & MRBD) and post-contraction (PMBR) with MEG. These MEG
recordings provided the primary outcome measures before and after
fatigue/control. Submaximal contractions were used so that they could be
performed in enough volume to collect a sufficient quantity of MEG data, and that
the same motor task (with respect to force output) could be replicated even
during a state of physical fatigue. The maximal voluntary contractions were used
to determined MVF at four time-points (not including MVFb), and monitor each
participants’ fatigue throughout each trial. For these maximal contractions, the
target force profile displayed a 3-s constant-force phase at 100%MVFb, and
participants had received prior instructions to perform a maximal effort of wrist-
flexion for this duration.
MEG data were collected during the series of 40%MVFb contractions. MEG data
were acquired at a sampling frequency of 600 Hz using a 275 channel CTF MEG
Chapter 5
111
system (MISL, Coquitlam, Canada) operating in third order synthetic gradiometer
configuration. Three localisation coils were attached to the head as fiducial
markers (nasion, left preauricular and right preauricular) prior to the recording.
Energising these coils at the start and end of data acquisition enabled localisation
of the fiducial markers relative to the MEG sensor geometry. In order to
coregister brain anatomy to the MEG sensor array, each participant's head shape
was digitised (Polhemus IsoTrack, Colchester, VT, USA) relative to the fiducial
markers prior to the MEG recording. Volumetric anatomical MR images were
acquired using a 3 T MR system (Phillips Achieva, Best, Netherlands) running an
MPRAGE sequence (1-mm3 resolution). Following data acquisition, the head
surface was extracted from the anatomical MR image and coregistered (via
surface matching) to the digitised head shape for each participant. This allowed
complete coregistration of the MEG sensor array to the brain anatomy, thus
facilitating subsequent forward and inverse calculations. A marker was inserted
within the MEG and force recordings of each individual contraction to time-
synchronise the two data sets. A marker was inserted within the MEG and force
recordings of each individual contraction to time-synchronise the two data sets.
Fatigue and control interventions
Both interventions comprised a series of 40 contractions; each of 12-s duration,
performed every 30 s, and at a constant-force of either 5%MVFb (control trial) or
55%MVFb (fatigue trial). The fatigue intervention was designed to induce physical
fatigue, whereas the control intervention was designed to involve the same
number and duration of contractions as the fatigue intervention, but without
posing a physical challenge. As fatigue developed during the fatigue trial,
participants attempted to maintain the 55%MVFb force output for as much of the
12 s as they could, and maintained a maximal effort of force output thereafter.
The specific force level for the fatigue intervention (55%MVFb) was selected
following lengthy pilot testing, which found this protocol to be realisable by most
participants, while also being fatiguing to all those who attempted it.
Chapter 5
112
Data Analyses
Mean force output and steadiness (within participant standard deviation;
40%MVFb contractions only) were determined for each individual contraction.
Averages of these mean and steadiness values were calculated first within each
individual, and subsequently across participants to determine group means. The
first and last 0.5 s of each contraction (constant-force phase) were excluded from
all analyses to ensure force output was at the prescribed level throughout the
analysed time-window.
MEG data were analysed using synthetic aperture magnetometry (SAM) (Vrba &
Robinson 2001), a beamforming variant used to localise neural oscillatory
amplitude changes. Data were first filtered to the mu (7-15 Hz) and beta (15-30
Hz) bands. Oscillatory amplitude was then contrasted in active and control time
windows in order to delineate the spatial signatures of mu and beta amplitude
change. To localise MRMD and MRBD an active window between 0.5 and 5.5 s
of the 40%MVFb contractions was used. To localise PMBR an active window
commencing 0.25 s after contraction offset and lasting 5 s was used. (Contraction
offset was defined as the time at which contraction force fell below 2%MVFb
when returning to rest and used to define the timing of PMBR measurements). In
all cases, the control window commenced 20 s after the prescribed contraction
onset (start of the ramp on the target force profile) and lasted for 5 s. The forward
model was based upon a multiple local sphere head model and the forward
calculation by Sarvas (Sarvas 1987; Huang et al. 1999). Pseudo-t-statistical
images (5 mm3 isotropic resolution) were generated showing regions of
oscillatory amplitude change in the mu and beta bands. Spatial clusters,
occurring within sensorimotor regions were identified and used as locations of
interest (LOIs) for subsequent analysis.
Following identification of LOIs using SAM, time frequency spectrograms were
generated for each individual participant in order to measure oscillatory dynamics
throughout the trials. A SAM beamformer was employed with weighting
parameters determined for each LOI using a covariance window spanning the 1-
150 Hz frequency range, and a time window encompassing the twenty 40%MVFb
contractions and inter-contraction rest periods (pre- and post-intervention
Chapter 5
113
measurements were concatenated). The derived beamformer weights for each
location were multiplied by the MEG data (filtered 1-150 Hz) in order to get a
‘virtual sensor’ time-series showing the evolution of electrical activity at that
location. Virtual sensor time-series were frequency filtered into 31 overlapping
frequency bands, and a Hilbert transform was used to generate the amplitude
envelope of oscillations within each band. These envelope time-courses were
then averaged across the ten contractions; both pre- and post-intervention, in
both the fatigue and control trials. Averaged envelopes were then concatenated
in the frequency dimension to generate a single time frequency spectrum (TFS)
per participant, for each LOI identified. TFSs were subsequently averaged over
all participants leaving a single TFS for the spatial maxima of MRMD, MRBD and
PMBR.
To assess the effect of fatigue on neural oscillations, mean values of MRMD,
MRBD and PMBR were extracted from the TFS data for each participant
individually. MRMD and MRBD were calculated as the integral of 7-15/15-30 Hz
amplitude across the same active time windows as those used for SAM analyses
(see above), and were divided by the duration (in seconds) of the windows. Thus,
MRMD and MRBD represent an average mu/beta amplitude decrease during the
40%MVFb contractions (where ‘mu/beta amplitude’ = the integral across the 7-
15/15-30 Hz frequency band). For PMBR, the total integral of the beta envelope
was calculated between 0-10 s following contraction offset, which allowed for this
protracted response to reach baseline. Results were generated based on LOIs
for each response and each individual separately. This analysis yielded a single
value of MRMD, MRBD and PMBR for each participant, both pre- and post-
intervention in both the fatigue and control trials (i.e. four values per participant).
These values were then averaged across participants to determine group means.
MRMD, MRBD and PMBR were also calculated as percentage changes from
baseline (resting) amplitude during the control windows used for SAM analyses.
Individual responses were confirmed as local to the contralateral sensorimotor
cortex in individual brain space following SAM beamforming, however, to
characterise the group mean spatial location of MRMD, MRBD and PMBR,
individual brain images were normalised to an anatomical standard (Montreal
Neurological Institute (MNI) brain) using FLIRT in FSL. The MNI coordinates for
Chapter 5
114
each peak (MRMD, MRBD and PMBR) in each participant were then measured,
before averaging across participants to create group means for each of the x
(left-right) y (anterior-posterior) and z (inferior-superior) coordinates. The most
likely cortical locations of the mean coordinates were then determined using the
Oxford-Harvard brain atlas.
Two-way repeated measures ANOVAs were used to compare both force output
and oscillatory amplitude changes between trials (control vs. fatigue trial) and
over time (pre- vs. post-intervention, or 4 time-points for MVF). Following a
significant trial × time interaction effect in MRBD and PMBR, post-hoc paired t-
tests were performed to elucidate the cause of these effects. Following a
significant interaction effect in MVF; two post-hoc one-way repeated measures
ANOVAs with Bonferroni corrections were conducted to compare MVF across the
four time-points for each trial. Paired t-tests were also used to compare MVF
between trials, and the average contraction force between the first and last five
repetitions of the fatigue intervention. A P-value below 0.05 was considered
statistically significant. Data are expressed as group means ± standard error of
the mean (SEM) unless otherwise stated.
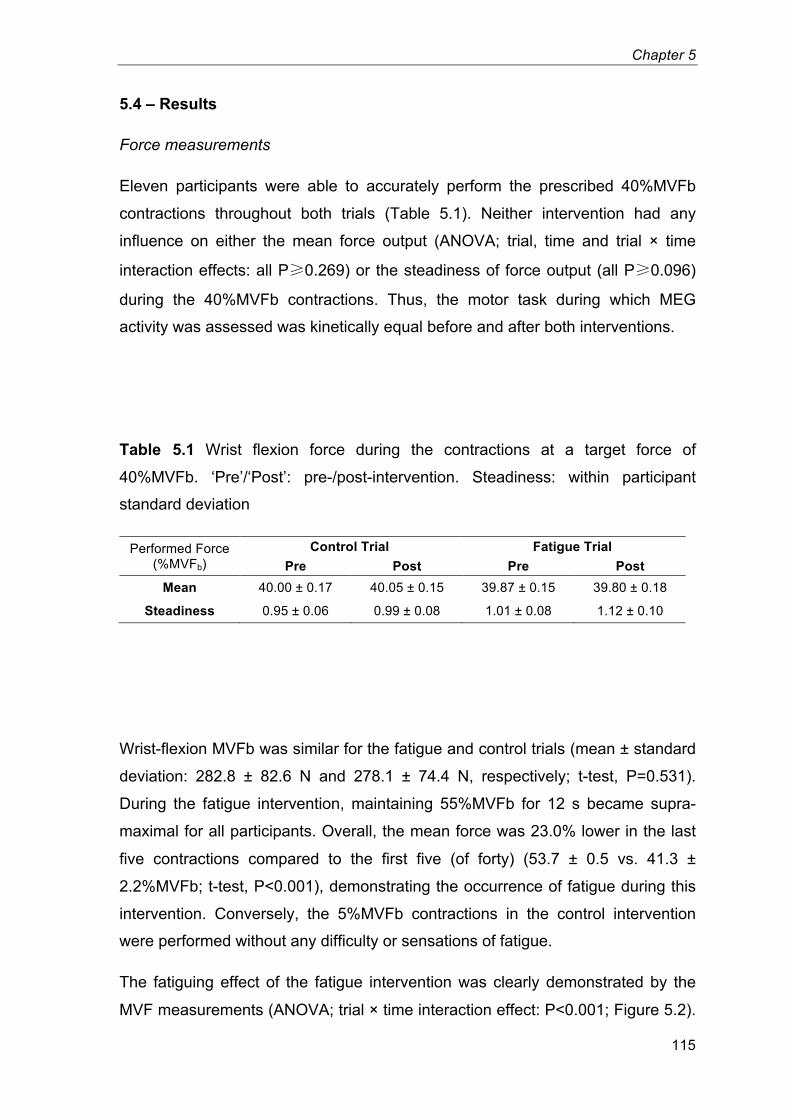
Chapter 5
115
5.4 – Results
Force measurements
Eleven participants were able to accurately perform the prescribed 40%MVFb
contractions throughout both trials (Table 5.1). Neither intervention had any
influence on either the mean force output (ANOVA; trial, time and trial × time
interaction effects: all P�0.269) or the steadiness of force output (all P�0.096)
during the 40%MVFb contractions. Thus, the motor task during which MEG
activity was assessed was kinetically equal before and after both interventions.
Table 5.1 Wrist flexion force during the contractions at a target force of
40%MVFb. ‘Pre’/‘Post’: pre-/post-intervention. Steadiness: within participant
standard deviation 4
Performed Force
(%MVFb)
Control Trial Fatigue Trial Pre Post Pre Post
Mean 40.00 ± 0.17 40.05 ± 0.15 39.87 ± 0.15 39.80 ± 0.18
Steadiness 0.95 ± 0.06 0.99 ± 0.08 1.01 ± 0.08 1.12 ± 0.10
Wrist-flexion MVFb was similar for the fatigue and control trials (mean ± standard
deviation: 282.8 ± 82.6 N and 278.1 ± 74.4 N, respectively; t-test, P=0.531).
During the fatigue intervention, maintaining 55%MVFb for 12 s became supra-
maximal for all participants. Overall, the mean force was 23.0% lower in the last
five contractions compared to the first five (of forty) (53.7 ± 0.5 vs. 41.3 ±
2.2%MVFb; t-test, P<0.001), demonstrating the occurrence of fatigue during this
intervention. Conversely, the 5%MVFb contractions in the control intervention
were performed without any difficulty or sensations of fatigue.
The fatiguing effect of the fatigue intervention was clearly demonstrated by the
MVF measurements (ANOVA; trial × time interaction effect: P<0.001; Figure 5.2).
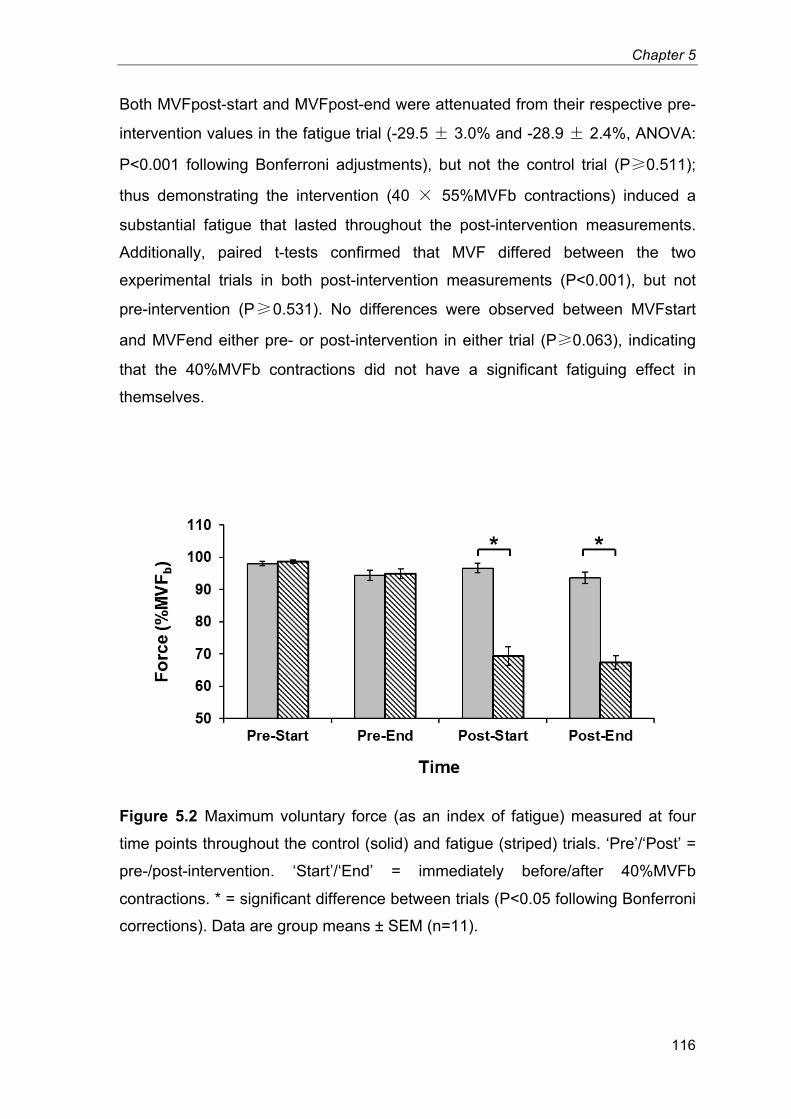
Chapter 5
116
Both MVFpost-start and MVFpost-end were attenuated from their respective pre-
intervention values in the fatigue trial (-29.5 � 3.0% and -28.9 � 2.4%, ANOVA:
P<0.001 following Bonferroni adjustments), but not the control trial (P�0.511);
thus demonstrating the intervention (40 � 55%MVFb contractions) induced a
substantial fatigue that lasted throughout the post-intervention measurements.
Additionally, paired t-tests confirmed that MVF differed between the two
experimental trials in both post-intervention measurements (P<0.001), but not
pre-intervention (P�0.531). No differences were observed between MVFstart
and MVFend either pre- or post-intervention in either trial (P�0.063), indicating
that the 40%MVFb contractions did not have a significant fatiguing effect in
themselves.
Figure 5.2 Maximum voluntary force (as an index of fatigue) measured at four
time points throughout the control (solid) and fatigue (striped) trials. ‘Pre’/‘Post’ =
pre-/post-intervention. ‘Start’/‘End’ = immediately before/after 40%MVFb
contractions. * = significant difference between trials (P<0.05 following Bonferroni
corrections). Data are group means ± SEM (n=11). 20
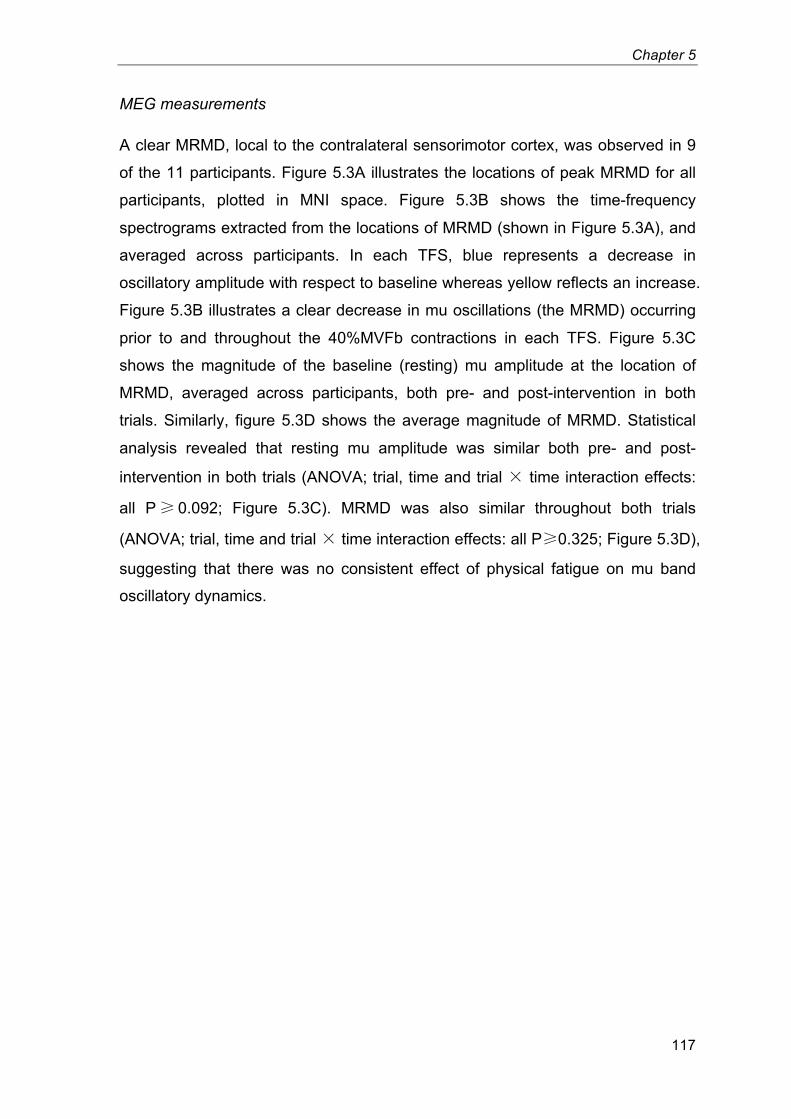
Chapter 5
117
MEG measurements
A clear MRMD, local to the contralateral sensorimotor cortex, was observed in 9
of the 11 participants. Figure 5.3A illustrates the locations of peak MRMD for all
participants, plotted in MNI space. Figure 5.3B shows the time-frequency
spectrograms extracted from the locations of MRMD (shown in Figure 5.3A), and
averaged across participants. In each TFS, blue represents a decrease in
oscillatory amplitude with respect to baseline whereas yellow reflects an increase.
Figure 5.3B illustrates a clear decrease in mu oscillations (the MRMD) occurring
prior to and throughout the 40%MVFb contractions in each TFS. Figure 5.3C
shows the magnitude of the baseline (resting) mu amplitude at the location of
MRMD, averaged across participants, both pre- and post-intervention in both
trials. Similarly, figure 5.3D shows the average magnitude of MRMD. Statistical
analysis revealed that resting mu amplitude was similar both pre- and post-
intervention in both trials (ANOVA; trial, time and trial � time interaction effects:
all P� 0.092; Figure 5.3C). MRMD was also similar throughout both trials
(ANOVA; trial, time and trial � time interaction effects: all P�0.325; Figure 5.3D),
suggesting that there was no consistent effect of physical fatigue on mu band
oscillatory dynamics.
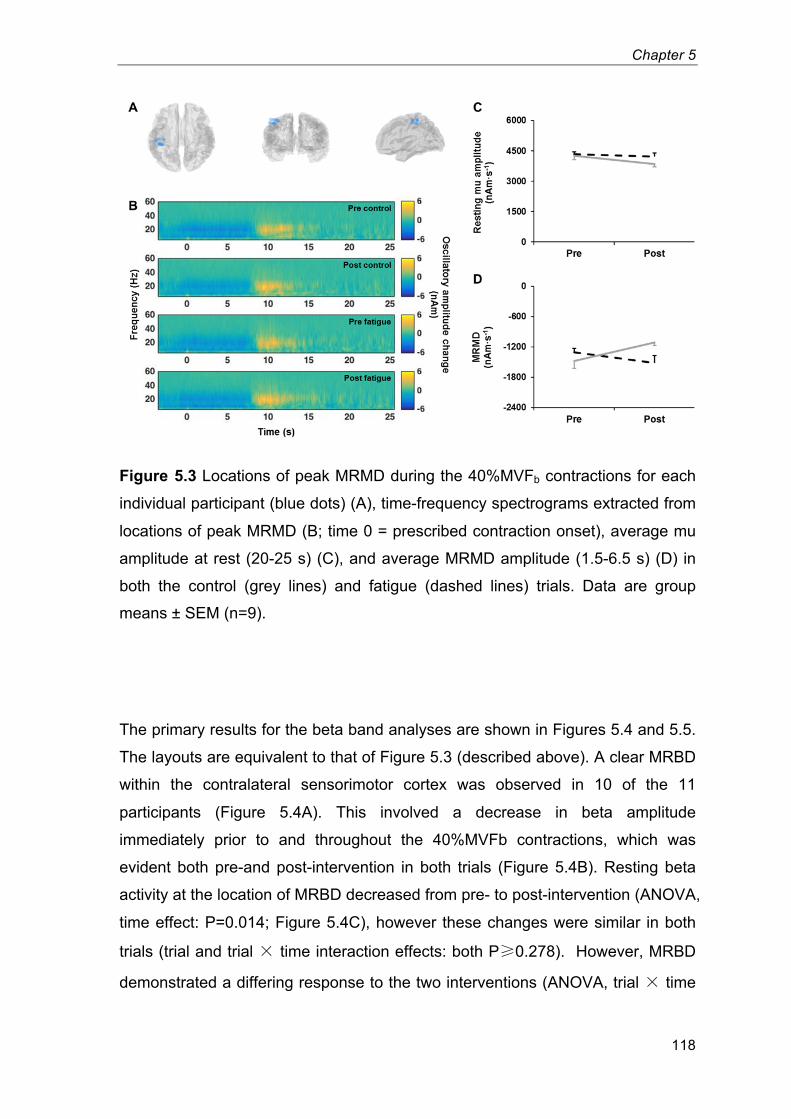
Chapter 5
118
Figure 5.3 Locations of peak MRMD during the 40%MVFb contractions for each
individual participant (blue dots) (A), time-frequency spectrograms extracted from
locations of peak MRMD (B; time 0 = prescribed contraction onset), average mu
amplitude at rest (20-25 s) (C), and average MRMD amplitude (1.5-6.5 s) (D) in
both the control (grey lines) and fatigue (dashed lines) trials. Data are group
means ± SEM (n=9). 21
The primary results for the beta band analyses are shown in Figures 5.4 and 5.5.
The layouts are equivalent to that of Figure 5.3 (described above). A clear MRBD
within the contralateral sensorimotor cortex was observed in 10 of the 11
participants (Figure 5.4A). This involved a decrease in beta amplitude
immediately prior to and throughout the 40%MVFb contractions, which was
evident both pre-and post-intervention in both trials (Figure 5.4B). Resting beta
activity at the location of MRBD decreased from pre- to post-intervention (ANOVA,
time effect: P=0.014; Figure 5.4C), however these changes were similar in both
trials (trial and trial � time interaction effects: both P�0.278). However, MRBD
demonstrated a differing response to the two interventions (ANOVA, trial � time
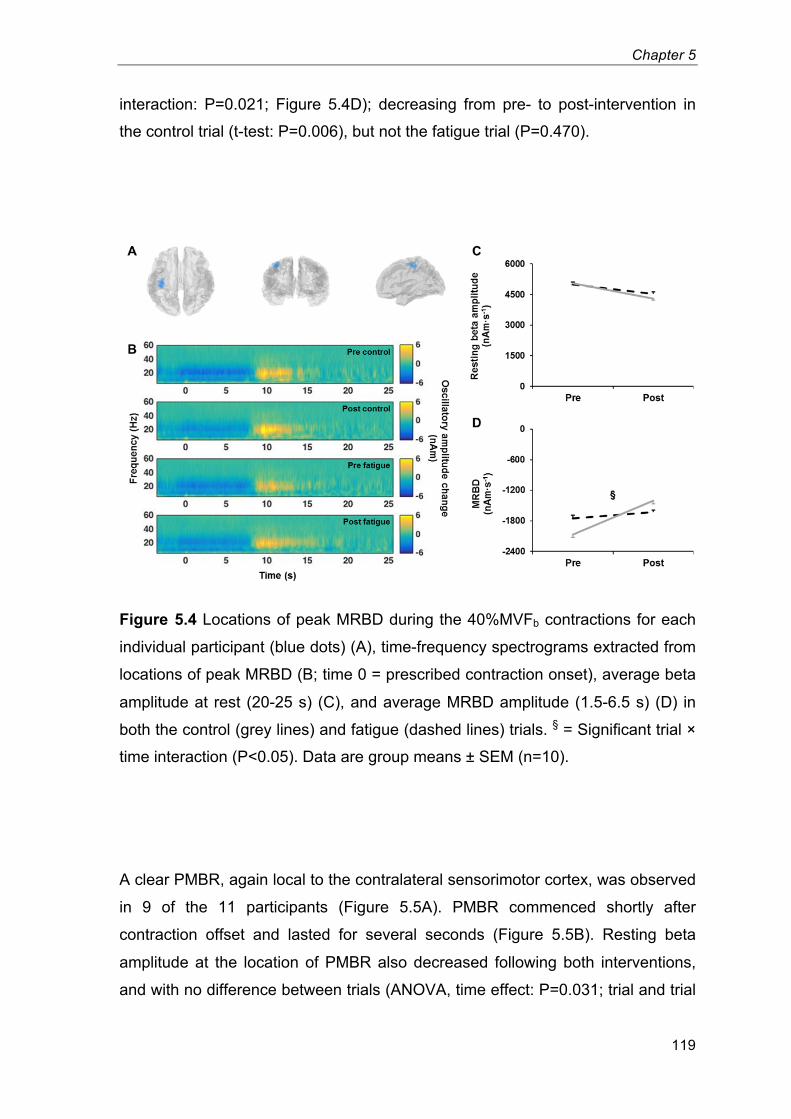
Chapter 5
119
interaction: P=0.021; Figure 5.4D); decreasing from pre- to post-intervention in
the control trial (t-test: P=0.006), but not the fatigue trial (P=0.470).
Figure 5.4 Locations of peak MRBD during the 40%MVFb contractions for each
individual participant (blue dots) (A), time-frequency spectrograms extracted from
locations of peak MRBD (B; time 0 = prescribed contraction onset), average beta
amplitude at rest (20-25 s) (C), and average MRBD amplitude (1.5-6.5 s) (D) in
both the control (grey lines) and fatigue (dashed lines) trials. § = Significant trial ×
time interaction (P<0.05). Data are group means ± SEM (n=10). 22
A clear PMBR, again local to the contralateral sensorimotor cortex, was observed
in 9 of the 11 participants (Figure 5.5A). PMBR commenced shortly after
contraction offset and lasted for several seconds (Figure 5.5B). Resting beta
amplitude at the location of PMBR also decreased following both interventions,
and with no difference between trials (ANOVA, time effect: P=0.031; trial and trial
Chapter 5
120
� time interaction effects: both P� 0.138; Figure 5.5C). Conversely, the
magnitude of PMBR was affected by physical fatigue (ANOVA; trial × time
interaction: P=0.018; Figure 5.5D); demonstrating an increase following the
fatigue intervention (t-test: P<0.001), but not the control intervention (P=0.623).
Figure 5.5 Locations of peak PMBR following the 40%MVFb contractions for
each individual participant (blue dots) (A), time-frequency spectrograms extracted
from locations of peak PMBR (B; time 0 = contraction offset), average beta
amplitude at rest (C), and PMBR amplitude (0-10 s) (D) in both the control (grey
lines) and fatigue (dashed lines) trials. § = Significant trial × time interaction
(P<0.05). Data are group means ± SEM (n=9). 23
The mean MNI coordinates of MRMD, MRBD and PMBR are displayed in Table
5.2, alongside the most likely cortical locations of these coordinates according to
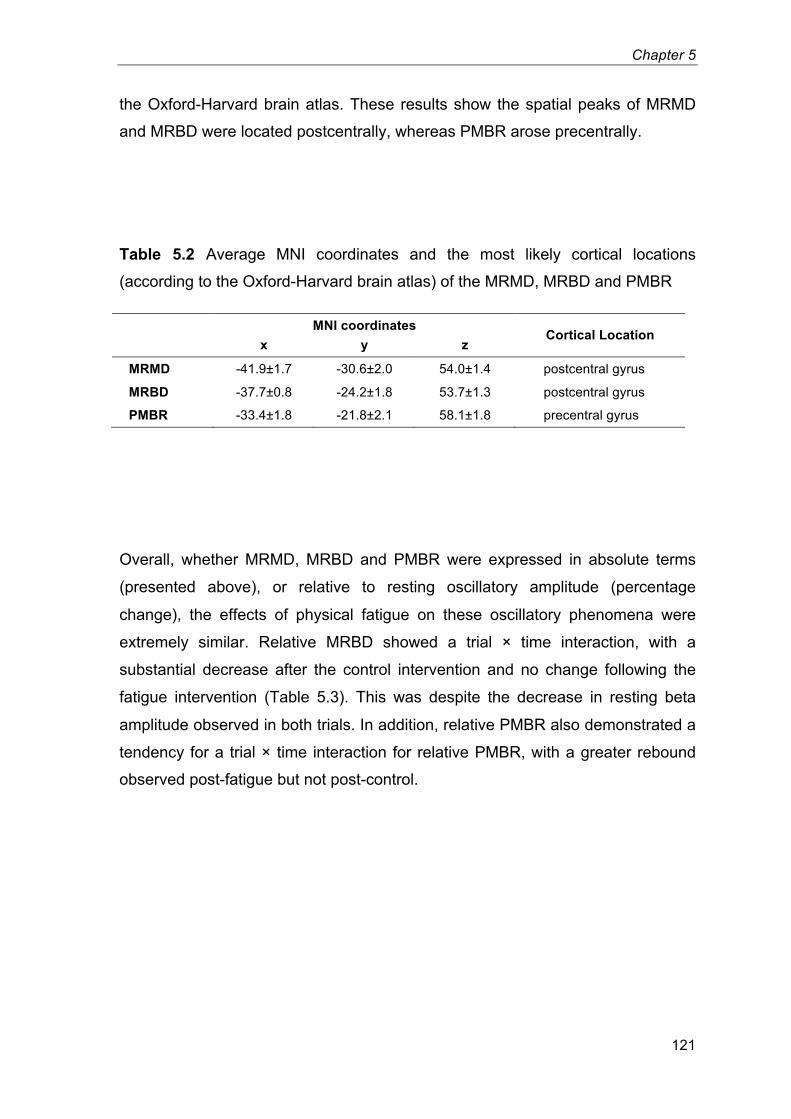
Chapter 5
121
the Oxford-Harvard brain atlas. These results show the spatial peaks of MRMD
and MRBD were located postcentrally, whereas PMBR arose precentrally.
Table 5.2 Average MNI coordinates and the most likely cortical locations
(according to the Oxford-Harvard brain atlas) of the MRMD, MRBD and PMBR
MNI coordinates Cortical Location
x y z
MRMD -41.9±1.7 -30.6±2.0 54.0±1.4 postcentral gyrus
MRBD -37.7±0.8 -24.2±1.8 53.7±1.3 postcentral gyrus
PMBR -33.4±1.8 -21.8±2.1 58.1±1.8 precentral gyrus
Overall, whether MRMD, MRBD and PMBR were expressed in absolute terms
(presented above), or relative to resting oscillatory amplitude (percentage
change), the effects of physical fatigue on these oscillatory phenomena were
extremely similar. Relative MRBD showed a trial × time interaction, with a
substantial decrease after the control intervention and no change following the
fatigue intervention (Table 5.3). This was despite the decrease in resting beta
amplitude observed in both trials. In addition, relative PMBR also demonstrated a
tendency for a trial × time interaction for relative PMBR, with a greater rebound
observed post-fatigue but not post-control.
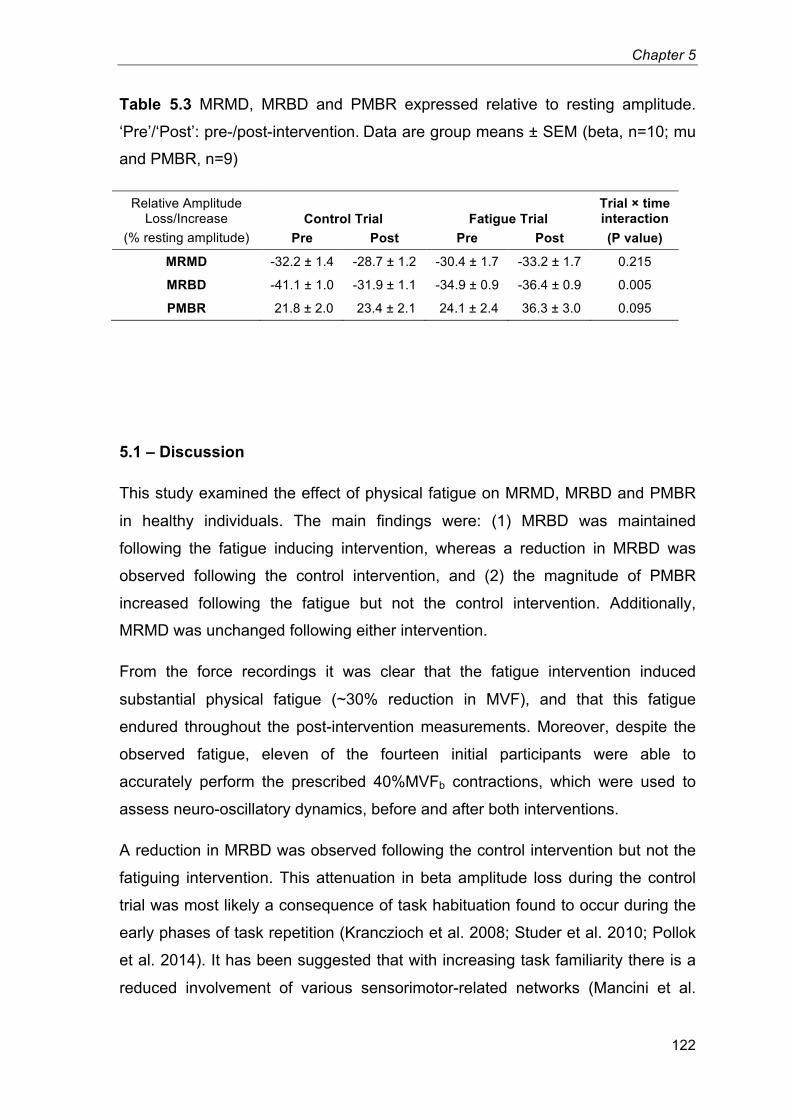
Chapter 5
122
Table 5.3 MRMD, MRBD and PMBR expressed relative to resting amplitude.
‘Pre’/‘Post’: pre-/post-intervention. Data are group means ± SEM (beta, n=10; mu
and PMBR, n=9) 6
Relative Amplitude
Loss/Increase
(% resting amplitude)
Control Trial Fatigue Trial
Trial × time interaction (P value) Pre Post Pre Post
MRMD -32.2 ± 1.4 -28.7 ± 1.2 -30.4 ± 1.7 -33.2 ± 1.7 0.215
MRBD -41.1 ± 1.0 -31.9 ± 1.1 -34.9 ± 0.9 -36.4 ± 0.9 0.005
PMBR 21.8 ± 2.0 23.4 ± 2.1 24.1 ± 2.4 36.3 ± 3.0 0.095
5.1 – Discussion
This study examined the effect of physical fatigue on MRMD, MRBD and PMBR
in healthy individuals. The main findings were: (1) MRBD was maintained
following the fatigue inducing intervention, whereas a reduction in MRBD was
observed following the control intervention, and (2) the magnitude of PMBR
increased following the fatigue but not the control intervention. Additionally,
MRMD was unchanged following either intervention.
From the force recordings it was clear that the fatigue intervention induced
substantial physical fatigue (~30% reduction in MVF), and that this fatigue
endured throughout the post-intervention measurements. Moreover, despite the
observed fatigue, eleven of the fourteen initial participants were able to
accurately perform the prescribed 40%MVFb contractions, which were used to
assess neuro-oscillatory dynamics, before and after both interventions.
A reduction in MRBD was observed following the control intervention but not the
fatiguing intervention. This attenuation in beta amplitude loss during the control
trial was most likely a consequence of task habituation found to occur during the
early phases of task repetition (Kranczioch et al. 2008; Studer et al. 2010; Pollok
et al. 2014). It has been suggested that with increasing task familiarity there is a
reduced involvement of various sensorimotor-related networks (Mancini et al.
Chapter 5
123
2009), and that reduced MRBD with task habituation is a neurophysiological
marker of early cortical reorganisation (Pollok et al. 2014). The results of the
present investigation indicate that this habituation response was counteracted by
the fatiguing intervention. Although the mechanism by which this was achieved is
beyond the scope of this investigation, it might be speculated that the task
dynamics, at least from a cortical perspective, might change with the induction of
fatigue. For example, physical fatigue requires an increased corticospinal output
to maintain the prescribed force output and also induces extensive group III and
IV afferent feedback in response to metabolite accumulation (Taylor & Gandevia
2008).
That MRBD was maintained following the fatigue intervention is in contrast to one
preliminary study that reported a complete elimination of MRBD during
submaximal contractions of the extensor communis digitorum performed after a
prolonged MVC of the same muscle (Tecchio et al. 2006). However, this study
lacked both a control trial and an objective measure of physical fatigue. (In the
current investigation, the presence of fatigue throughout the post-intervention
measurements was clearly demonstrated by the ~30% decrease in MVF versus
pre-fatigue values.) Furthermore, these authors found agonist electromyography
amplitude during the submaximal contractions to be unaffected by the
intervention, in contrast to the widely documented increase in electromyography
amplitude that would be expected to accompany fatigue (Bigland-Ritchie et al.
1986; Dorfman et al. 1990). It is therefore possible that the abolished MRBD
reported as a consequence of fatigue may instead reflect a habituation effect,
analogous to the attenuation in MRBD observed in the control trial of the current
investigation.
To the authors’ knowledge this was the first study to investigate the effect of
physical fatigue on PMBR. The results demonstrated that PMBR was augmented
following the fatiguing intervention but not the control intervention. The PMBR is
believed to reflect an active inhibition of neuronal networks recruited during the
preparation and execution phases of motor actions (Alegre et al. 2008; Solis-
Escalante et al. 2012). Therefore, higher PMBR after fatigue may reflect a greater
inhibitory response of neural networks that were more highly activated/excited
during contraction; potentially due to increases in corticospinal output or
Chapter 5
124
somatosensory processing (either directly or indirectly). For example, the
magnitude of the PMBR may be positively related to the volume of muscle
recruited during voluntary contractions (Pfurtscheller et al. 1998; chapter 4),
which increases with the development of fatigue. Alternatively, Cassim et al.
(2001) proposed that movement-related somatosensory processing may be
fundamental to the engenderment of the PMBR, having observed a PMBR to be
present following passive finger movements but not active movements performed
under ischaemic deafferentation. Therefore, increased activity of fatigue sensitive
afferents may also have contributed to the larger PMBR observed following the
development of physical fatigue.
That PMBR may be modulated by fatigue has wide implications for the
measurement and interpretation of this phenomenon. Recent work has
demonstrated that PMBR has the potential to be used as a biomarker for
pathology, with examples including Parkinson’s disease (Pollok et al. 2012;
Heinrichs-Graham et al. 2014; S. Hall et al. 2014) and schizophrenia (Robson et
al. In Press). Judicious design of study protocols is therefore essential to ensure
the PMBR is not affected by the experimental procedures, particularly when
investigating disorders in which susceptibility to fatigue represents a common
symptom.
Resting beta amplitude at the locations of both MRBD and PMBR demonstrated
similar decreases following both interventions. De Pauw et al. (2013) noted a
decreased resting beta activity across the whole brain after a prolonged intensive
cycling performance in the heat; designed to induce supraspinal fatigue.
Additionally, Jagannath & Balasubramanian (2014) found widespread decreases
in beta amplitude following a monotonous 60-min simulated driving task, which
was suggested to encompass elements of both mental fatigue and physical
fatigue (due to the extended period of posture maintenance). In the present study,
the decrease in beta amplitude following the interventions was not specific to the
fatigue trial; however, other fatigue modalities, such as mental fatigue arising
from the prolonged periods of concentration and task repetition, might have
contributed to this beta decrease. Although this possibility may be difficult to
confirm as different modalities of mental fatigue may influence spontaneous
oscillatory activity in different ways (Shigihara et al. 2013).
Chapter 5
125
Fatigue had no effect on either resting mu amplitude or MRMD, which were both
unchanged following both interventions. This indicated that mu activity within the
sensorimotor cortex was not affected by either the induction of physical fatigue,
or the prolonged period of task adherence involved in both trials.
Finally, it should be acknowledged that any potential effect of handedness on the
observed results is not known. Volunteers were not screened for handedness
upon selection for the study, and with a final sample of only 2 left hand dominant
participants (out of the eleven to complete the study) it was not realistic to
investigate any potential influence handedness may have had. In conclusion, this
study revealed two novel findings regarding the effects of physical fatigue on
movement-related sensorimotor oscillatory dynamics. Firstly, physical fatigue
offset the attenuation in MRBD observed with repetition of a motor task in a non-
fatiguing control trial. Secondly, PMBR was increased when submaximal
contractions were performed in a state of physical fatigue; which supports an
emerging theory that PMBR is sensitive to increases in corticospinal output and
changes in sensory input, both of which would be expected to occur with physical
fatigue.

Chapter 6
General Discussion
Chapter 3
127
6.1 – Introduction
1. In addition to the supraspinal motor drive, the recruitment of skeletal
muscle involves peripheral inputs to the motor unit pool. Excitatory input
from Ia afferents has been shown to contribute to the recruitment of high
threshold motor units (Bongiovanni et al. 1990), and the achievement of
maximal motor unit firing rates (Hagbarth et al. 1986; Macefield et al.
1993). However, whether maximal force development is dependent on this
input is not certain. Subsequently, the aim of chapter 2 was to examine
both maximal and explosive force production in the knee extensors
following a prolonged vibration of the infrapatellar tendon, which was
designed to attenuate the efficacy of the homonymous Ia afferent-α-
motoneuron pathway.
2. Neural oscillations are a ubiquitous phenomenon generated in multiple
cortical regions, and are observable using non-invasive measurement
techniques including EEG and MEG. In the sensorimotor system,
particular attention has been paid to the link between motor action and
modulations in mu (~7-15 Hz) and beta (~15-30 Hz) oscillations.
Numerous studies have reported somatotopically organised decreases in
mu and beta amplitude during the preparation and execution of voluntary
movement, followed by a period of elevated beta amplitude on movement
cessation (e.g. Jurkiewicz et al. 2006). However, despite the considerable
level of interest in the oscillatory responses to movements per se, the
potential influence of the motor parameters of the movements under
investigation is poorly understood. Therefore, the aim of chapters 3 and 4
was to examine the influence of voluntary contraction force/torque and
RFD on sensorimotor oscillatory dynamics.
3. During continued performance of a motor task, physical fatigue develops
through both supraspinal and peripheral processes (Gandevia et al. 1996).
However, whether the initial oscillatory responses to the motor task are
Chapter 3
128
modified when the efficacy of the neuromuscular pathway facilitating the
movement is challenged (i.e. as physical fatigue develops) has received a
paucity of attention. The aim of chapter 5 was therefore to investigate how
ongoing oscillatory activity within the sensorimotor cortex might be
affected by physical fatigue.
6.2 – Is maximal voluntary force development dependent upon Ia afferent input to the motor unit pool?
The results of chapter 2 indicated that both MVF and maximal RFD of the knee-
extensors were unaffected by a 30-min vibration of the infrapatellar tendon
despite concurrent decreases in H-reflex indicating a reduced efficacy of the
homonymous Ia afferent-α-motoneuron pathway. These findings are in
accordance with one previous investigation (Ekblom & Thorstensson 2011), but
in direct contrast to a number of other studies that have observed both 7-17%
decrements in maximal force production (Kouzaki et al. 2000; Jackson & Turner
2003; Ushiyama et al. 2005; Konishi et al. 2009) and ~24-70% reductions in peak
RFD (Kouzaki et al. 2000; Jackson & Turner 2003) following prolonged
muscle/tendon vibration. However, numerous concerns regarding the
methodologies employed in a number of these previous studies have been
described (chapters 1 & 2). While these shall not be listed again here in any
detail, it is perhaps worth repeating that in two of these previous studies (Kouzaki
et al. 2000; Jackson & Turner 2003) vibration was applied directly to the rectus
femoris muscle, evoking a tonic response that could have led to an accumulated
muscle fatigue over the 30-min vibration period. Despite this, potential changes in
extrafusal fibre excitability were not assessed in either of these studies.
Additionally, these same studies measured RFD during the performance of
maximal force contractions, which are unlikely to provide valid measurements of
peak RFD (Bemben et al. 1990; Sahaly et al. 2001)
Nevertheless, the cause of these dichotomous results is not certain. This may be
due in part to the fact that the mechanisms underlying the attenuated H-reflex
response was not known. Repetitive activation of Ia afferents during prolonged
tendon vibration might attenuate the efficacy of the Ia afferent-α-motoneuron
Chapter 3
129
pathway via a number of processes; including transmitter depletion at the Ia
afferent terminals (Curtis & Eccles 1960; Hultborn et al. 1996) and interneuron
mediated presynaptic inhibition (Lapole et al. 2012). However, presynaptic
inhibition of Ia afferents is decreased during voluntary contractions (Hultborn et al.
1987). Therefore, although highly speculative, it is plausible that both a recovery
from neurotransmitter depletion and a return to pre-vibration levels of presynaptic
inhibition during contractions was complete before performing the explosive (4
min 30 s following vibration termination) and maximal force contractions (6 min
50 s following vibration termination), while levels of presynaptic inhibition of Ia
afferents at rest remained elevated. This could explain why the results of chapter
2 differed from those of previous investigations (Kouzaki et al. 2000; Jackson &
Turner 2003; Ushiyama et al. 2005; Konishi et al. 2009); each of which completed
all assessments of maximal force production within 5 min following the cessation
of vibration. Of course further investigation on the time-courses of these
mechanisms (which have been poorly defined to date) is required to explore this
proposition.
In general, it is recommended that H-reflexes should be evoked upon a
background level of muscle activation (primarily to ensure a consistent level of
motoneuron excitability). However, in the presented work (chapter 2), H-reflex
responses were recorded at rest as the primary objective of this study concerned
the effect of vibration on the functional performance measures (i.e. maximal force
and peak RFD), and sustaining volitional contractions during the collection of the
H-reflex recordings could have led to physical fatigue, which would have
compromised the functional performance measurements. The consistent Mmax
responses also indicated that the excitability of the extrafusal fibres was not
affected by the tendon vibration. Additional recommendations also suggest that
H-reflexes might be evoked with a current intensity that generates a specific
motor response (e.g., 10–20 % Mmax) to help ensure stimulus constancy (Zehr
2002). However, a disproportionate change in the excitability of afferent axons
(compared to efferent axons) following repetitive spindle activation during the
tendon vibration would have invalidated this method (Lin et al. 2002). Moreover,
for H-reflexes to accurately represent transmission efficacy in Ia afferent-α-
motoneuron synapses during maximal contractions, they themselves would have
Chapter 3
130
to be recorded during maximal contractions (Stein & Thompson 2006). This
would be almost impossible during assessments of peak RFD, and would likely
compromise the validity of MVF assessments; although future studies specifically
investigating the effect of prolonged vibration on H-reflex amplitude during
maximal contractions would provide a valuable contribution to the current
literature. Importantly, the reader should be reminded that the 60% reductions in
resting Hmax/Mmax reported in chapter 2 were not considered to reflect a 60%
decrease in homonymous spinal reflex function during the voluntary contractions.
Instead these results were simply intended to indicate that the vibration
intervention appeared to be effective in compromising the efficacy of the
homonymous Ia afferent-α-motoneuron pathway.
Overall, whether maximal voluntary force development is dependent upon Ia
afferent input to the motor unit pool remains unclear. The results suggest that
maximal force development may still be achieved under conditions of impaired Ia
afferent-α-motoneuron transmission, however, further investigation may be
warranted to validate these assertions, and help to explain why comparable
investigations have indicated otherwise. One appropriate future study would
involve a repeated measures design, including measurements of functional
performance (i.e. MVF) in isolation in one trial, and assessments of the efficacy of
the homonymous Ia afferent-α-motoneuron pathway (via H-reflexes) during the
performance of these same functional measures in another trial. Both trials might
involve a 30-min tendon vibration stimulus, with experimental measurements
taken before, and at several time-points after vibration (matched in both trials).
This approach would enable any vibration-induced decrements in the efficacy of
the Ia afferent-α-motoneuron pathway during the performance of the maximal
force measures to be quantified (as opposed to inferring some unknown level of
attenuation from decrements observed at rest). These separate trials would also
ensure that the functional performance measures were not compromised by the
superimposition of the H-reflex measurements. In addition, attention should be
paid to whether the vibration evokes a tonic response with regular action
potentials evident in the EMG of the homonymous muscle; a simple measure that
was absent from chapter 2.
Chapter 3
131
6.3 – Contraction-driven changes in sensorimotor oscillations: Any modulation with the motor parameters of voluntary contractions?
Chapter 3 included EEG measures of cortical activity from the leg area of the
motor cortex (i.e. from 27 separate MNI coordinates that formed a 3 × 3 × 3 cube:
(x;y;z coordinates) -10, 0, 10; -20, -30, -40; 50, 60, 70) during isometric knee-
extensions of the right leg at four prescribed torque levels: 15, 30, 45 and
60%MVT. Oscillatory power was analysed within five frequency bands: 0.5-3
(delta), 3-7 (theta), 7-13 (alpha), 13-30 (beta) and 30-50 Hz (gamma) using
LORETA analyses. In chapter 4, MEG was collected during the performance of
both constant-force and ramp isometric wrist-flexion at distinct levels of force (5,
15, 35 and 60%MVF) and RFD (10.4, 28.9 and 86.7%MVF·s-1
), respectively.
Contraction-driven reductions in beta (15-30 Hz) amplitude were spatially
localised using beamforming (SAM), and time-frequency analyses were
conducted at the locations of peak change within the sensorimotor regions of
each individual participant. Contraction-driven reductions in mu (7-15 Hz)
amplitude were also identified in some participants, however these responses
were inconsistent (8 out of 15 participants demonstrated a significant mu
amplitude loss during both experiments) and as such were not included within
chapter 4. Additionally, contraction-driven changes in oscillatory amplitude were
sought at frequencies <7 Hz and >30 Hz, however, no significant contrasts
between rest and during contraction were identified (data not shown).
Chapter 3 reported the magnitude of the contraction-driven reductions in alpha
amplitude to be unaffected by the torque of the performed knee-extensions.
Similarly, for the participants of chapter 4 that did demonstrate a significant
contraction-driven mu amplitude loss, the magnitude of the mu decrease was
unaffected by either the force or RFD of wrist-flexion (data not shown). These
results are consistent with a number of investigations, which have suggested
contraction-driven alpha amplitude loss to be unrelated to voluntary contraction
force of the index finger extensors (Stančák et al. 1997), knee flexors/extensors
(Dal Maso et al. 2012) and elbow flexors (Cremoux et al. 2013). In contrast, one
study (Mima et al. 1999) found the magnitude of the alpha (8-12.9 Hz) amplitude
loss during contractions to be positively related to the force of isometric pinching
between the first and fifth digit. The cause of this inconsistency is not clear. Alpha
Chapter 3
132
activity has been proposed to reflect an inhibitory control of cortical processing
(Klimesch et al. 2007), with a decrease in alpha amplitude representing a release
of inhibition. Although the motor parameters (at least force/torque and RFD) of a
voluntary contraction appear unrelated to task-driven decreases in alpha
amplitude, other parameters such as task difficulty might influence the magnitude
of alpha amplitude loss (Dujardin et al. 1995). Therefore, although speculative,
task dynamics other than the force of finger pinching may have led to the variable
alpha decreases reported by Mima et al. (1999). Overall, the current results
further indicate that contraction-driven reductions in sensorimotor alpha/mu
amplitude are unrelated to the motor parameters of force/torque and RFD during
voluntary isometric contractions.
Both chapters 3 & 4 found the changes in beta amplitude between contraction
and rest to be unaffected by either contraction force/torque or RFD. These results
are perhaps contrary to one study (Dal Maso et al. 2012), which reported a
greater beta (21-31 Hz) amplitude loss during isometric knee-flexion contractions
of higher forces in strength-trained individuals. However, these authors found no
differences in beta amplitude loss were observed when the same motor task was
completed by endurance trained participants, or during knee extensions
performed by either cohort. In other words, the majority of their findings were in
agreement with the presented results. Several other investigations have also
found the magnitude of the contraction-driven reductions in beta amplitude to be
independent of both contraction force (Stančák et al. 1997; Mima et al. 1999;
Cremoux et al. 2013) and movement speed (Stancák & Pfurtscheller 1995;
Stancák & Pfurtscheller 1996); although chapter 4 was the first study to compare
oscillatory responses between isometric contractions of distinct RFDs. These
findings are also in agreement with investigations that found information
contained within the beta signal may be used to differentiate between periods of
movement and rest, but does not enable the decoding of movement
characteristics such as grasp type/posture (Pistohl et al. 2012; Chestek et al.
2013). Moreover, a similar trend has also been observed away from the motor
system; with beta amplitude decreases within the visual cortex showing no
relation to either the intensity (Michelson contrast) or timing (drift frequency) of a
visual stimulus (Stevenson et al. 2011).
Chapter 3
133
Collectively, these results support the hypothesis that the sensorimotor beta
rhythm may provide a localised gating of cortical activity (Perez-Orive et al. 2002)
with a distinct ‘on/off’ property (Stevenson et al. 2011). High amplitude beta
oscillations are widely believed to reflect inhibition. This premise is supported by
pharmacological interventions, for example, administration of GABAergic
agonists elicits increased amplitude of the beta rhythm in healthy individuals
(Jensen et al. 2005; Hall et al. 2011). (Note: gamma aminobutyric acid (GABA) is
the major inhibitory neurotransmitter in the mammalian cortex). A reduction in
sensorimotor beta amplitude during voluntary contractions might therefore reflect
a release of GABAergic inhibition, enabling task-related processing to occur.
Overall, beta amplitude loss in the sensorimotor cortex appears to be functionally
relevant to the induction of voluntary contractions, while being independent of the
parameters of the performed contractions.
Finally, chapter 3 observed a significant overall increase in 30-50 Hz gamma
activity with increments in knee extension torque. This was an unexpected finding.
Low frequency (<50 Hz) gamma rhythms having received far less attention within
the literature than the more prominent mu and beta rhythms, which demonstrate
robust contraction-driven decreases in amplitude. Also, Dal Maso et al. (2012)
observed similar decreases in 35-45 Hz power during isometric knee
extension/flexion of between 20 and 80% maximal torque. However, a greater
amplitude of gamma (31-50 Hz) has previously been reported during near-
maximal (>80%MVF) vs. submaximal (10-60%MVF) contractions of the first and
fifth digits (Mima et al. 1999), although no difference was identified between
submaximal contraction forces, and the augmented gamma activity was
ubiquitous across fronto-central regions of the cortex. Additionally,
augmentations in ~30-50 Hz gamma activity have previously been attributed to
increases in attention (Rougeul-Buser 1994) and physiological arousal (Bonnet &
Arand 2001). Therefore, the observed increases in gamma activity in chapter 3
may have related to the cognitive demands of increasing contraction strength
(and possibly task difficulty), rather than the motor parameters of the voluntary
contractions.
Although the results of chapters 3 and 4 were largely in agreement, a couple of
discrepancies were present. The movement-related reduction in sensorimotor
Chapter 3
134
beta amplitude is a robust phenomenon consistently demonstrated by numerous
studies (Jasper & Penfield 1949; Salmelin & Hari 1994; Pfurtscheller & Lopes da
Silva 1999; Pfurtscheller et al. 2003; Jurkiewicz et al. 2006); which, once again,
was clearly identified in chapter 4, but not chapter 3. The reason for this
discrepancy was unclear. While beta oscillations may be partially re-established
during the held phase of constant-force contractions (Penfield 1954; Kilavik et al.
2013), a significant decrease would have perhaps still been expected to endure
the length of the contraction, as observed in Figure 4.3A.
Additionally, in chapter 3, 30-50 Hz gamma amplitude was significantly elevated
during contractions compared to rest, and increased further with increments in
contraction torque, whereas in chapter 4, no significant change in the 30-50 Hz
band was observed between contractions and rest. These increases in gamma
amplitude (chapter 3) were attributed to changes in physiological arousal and/or
the attentional demands of the higher torque contractions. The disparity in results
between the two chapters may therefore have resulted from minor differences in
the study designs, which could have led to a difference in the arousal/attentional
levels during the assessment of baseline 30-50 Hz amplitude. In chapter 3,
baseline amplitude was collected during one minute blocks of EEG recording,
during which participants were instructed to close their eyes and relax (“focusing
on themselves”) as much as possible. This may have led to a reduction in both
arousal and attentional focus compared to a more typical waking state. In
comparison, chapter 4 measured baseline amplitude during shorter periods of
rest between each contraction. This latter approach is more common within the
literature; benefiting from a more comparable state of attention/arousal between
task and rest periods, as well as minimising the influence of drifts in baseline
oscillations on the quantification of task-driven changes in oscillatory amplitude.
This approach was re-adopted for chapter 5, and is recommended for future EEG
studies. Additionally, different experimental models were adopted: chapter 3
involved contractions of proximal lower limb muscles (quadriceps femoris),
whereas chapter 4 involved distal muscles in the upper limb. These muscle
groups have contrasting functional purposes; with the quadriceps involved in
locomotion and the wrist-flexors used primarily in object manipulation. To the
author’s knowledge, chapter 3 is unique in its adoption of a unilateral knee-
Chapter 3
135
extension paradigm for the measurement of movement-related oscillatory
dynamics. Future research contrasting the oscillatory responses to contractions
of functionally distinct muscle groups may therefore be warranted.
Oscillations of higher frequencies
In concluding that low frequency (<50 Hz) rhythms may not be directly related to
the motor parameters of voluntary contractions, a logical next step might be to
explore the higher frequency oscillations. In addition to the mu and beta
amplitude loss, an increase in the higher frequency gamma (>70 Hz) activity has
also been identified within the contralateral sensorimotor cortex during voluntary
muscle contractions (Crone et al. 1998; Pfurtscheller et al. 2003; Miller et al.
2007). Although no significant contraction-driven increase in gamma amplitude
was identified in chapter 4, this is most likely due to the specific study design
employed. Muthukumaraswamy (2010) found a strong gamma-band activity to be
present around the onset of force production, but not during the held phase of a
near-isometric constant-force contraction, whereas, in order that force and RFD
were distinct between comparisons, chapter 4 included only the constant-force
and constant-RFD phases of the isometric contractions in its analysis (i.e. the
analysis windows did not span contraction onset).
In one recent investigation, Flint et al. (2014) attempted to decode the force of
brief voluntary contractions from electrocorticography (ECoG) recordings
collected from 10 patients undergoing intracranial monitoring prior to surgical
treatment for epilepsy. Each patient had an electrode array covering the hand
area of the primary motor cortex. Recordings were collected while patients
pinched a force transducer between the thumb and index finger of the hand
contralateral to the recording array. This behaviour was performed for between 5-
10 min, with the peak force of the isometric pinches ranging from 2 to 69 N
(across all subjects). The authors were able to decode the performed isometric
force from the ECoG recorded from the primary motor cortex with a high
accuracy (60 ± 6% [mean ± SE] explained variance), with the high gamma band
(70-115 Hz in particular) and the local motor potential (a time domain feature)
providing the greatest fraction of the explained variance. Conversely, in
Chapter 3
136
accordance with the results of chapters 3 and 4, features extracted from the mu
and beta frequencies provided poor decoding of the continuous force output. This
study (Flint et al. 2014) might indicate that the recorded gamma responses may
contain some content regarding the force of voluntary muscle contractions.
However, other investigations (Szurhaj et al. 2005; Cheyne et al. 2008;
Muthukumaraswamy 2010) have shown that increases in sensorimotor cortex
gamma activity occur after the onset of EMG; prompting suggestions that this
gamma activity might not be pertinent to the control of muscular force output, but
may instead reflect the activation of localised oscillatory networks by either
afferent (Muthukumaraswamy 2010) or reafferent (Cheyne et al. 2008) feedback
to the sensorimotor cortex during movement. Moreover, these latter suggestions
are consistent with the existing hypothesis that high frequency oscillations might
represent an integration of somatosensory and motor-related information streams
(Mackay 1997).
Oscillations in other regions of the brain
It appears that oscillatory rhythms of the sensorimotor cortex do not reflect the
parameters of voluntary movements. However, oscillatory activity within other
regions of the brain, particularly the sub-cortical structures, has not been
considered in the prior discussion, as this was beyond the scope of the presented
studies (the non-invasive EEG and MEG techniques involved in chapters 3 and 4
are insensitive to these deeper lying neural assemblies). Oscillatory activity of
subcortical structures can be recorded intracranially using ECoG. Using this
approach, Joundi et al. (2012) found a positive correlation between 70-90 Hz
gamma activity within the subthalamic nucleus and movement speed during
reaching movements. Similarly, Brucke et al. (2012) observed a correlation
between 60-80 Hz activity in the globus pallidus internus and the displacement
and velocity of pronation/supination movements. However, Jenkinson et al. (2013)
suggested that for both these studies (Brucke et al. 2012; Joundi et al. 2012), the
increase in gamma activity may be representative of the conscious effort being
applied, rather than coding for any specific motor parameter.
Chapter 3
137
Non-rhythmical features of EEG/MEG
Overall, the functional role of neural oscillations does not appear to include the
encoding of task parameters such as voluntary contraction force or RFD.
However, other features of the EEG/MEG signal may contain information related
to task characteristics. For example, the magnitude of the movement-related
potential (a transient feature of the electrophysiological signal occurring in the
supplementary motor area and sensorimotor cortex during movement preparation)
has been found to correlate with both the force and RFD of isometric contractions
of the elbow flexors (Siemionow et al. 2000) and plantarflexors (do Nascimento et
al. 2005). However, the study of movement-related cortical potentials is restricted
to events surrounding the onset of discrete movements, and thus do not give
information regarding the control of force production during ongoing movements.
Decrypting the cortical encoding of ongoing movements would be of particular
benefit to various areas of research; including brain computer interfacing, and
diagnostics of neurological diseases.
Other measures of neuronal activity
Microelectrode recordings from individual cells of the primary motor cortex have
shown the activity (spiking frequency) of these cells may be closely related to
muscular force during volitional contractions (Evarts 1968; Cheney & Fetz 1980).
This would indicate that the motor cortex might be highly relevant in the control of
muscular force production. However, these microelectrode recordings examine
the rate of axonal spiking in these cells, whereas the EEG and MEG (as well as
the ECoG) signals are derived from dendritic current flows (Hall et al. 2014).
Moreover, only a small minority of motor cortex cells may modulate their activity
in relation to muscular force production (Ashe, 1997), and this activity may not be
measureable on the macroscopic scale of non-invasive measures such as EEG
and MEG, which instead reflect the synchronous activity of tens of thousands of
cells (Proudfoot et al. 2014).
6.4 – The effect of physical fatigue on oscillatory dynamics
Chapter 3
138
Chapter 5 recorded the movement-related oscillatory responses to submaximal
isometric contractions performed both before and after either a physically
fatiguing intervention (40 contractions of 12 s duration at 55%MVF) or a control
intervention of the same duration (40 contractions of 12 s duration at 5%MVF).
The results showed that the contraction-driven beta amplitude loss was
unchanged following the fatiguing intervention, whereas a reduction in the beta
amplitude loss was observed after the control intervention. Conversely, the
magnitude of the PMBR was increased following the fatiguing but not the control
intervention.
These results are in contrast to one previous MEG study (Tecchio et al. 2006),
which reported a total abolition of the contraction-driven beta amplitude loss
during submaximal contractions of the extensor communis digitorum performed
after a prolonged MVC of the same muscle. However, this study did not include a
control trial, and the extent of physical fatigue induced by the MVC was not
examined. In fact, these authors found no difference in the agonist EMG
amplitude between the submaximal contractions performed before and after the
prolonged MVC, whereas an increase would have been expected to accompany
physical fatigue (Bigland-Ritchie et al. 1986; Dorfman et al. 1990). Therefore, it is
possible that the abolition of the contraction-driven beta amplitude loss may not
have been a consequence of physical fatigue, but some other mechanism such
as a time/habituation effect. This hypothesis may be supported by the
observation that a reduction in the magnitude of the beta amplitude loss was also
present in the control trial of chapter 5.
Attenuation of the contraction-driven beta amplitude loss has been shown to
accompany task habituation occurring during the early phases of task repetition
(Kranczioch et al. 2008; Studer et al. 2010; Pollok et al. 2014). This reduced
amplitude loss has been suggested to represent a neurophysiological marker of
early cortical reorganisation (Pollok et al. 2014), which might occur as the task
becomes more familiar and requires lower involvement of various sensorimotor-
related networks (Mancini et al. 2009). In chapter 5, no attenuation in the
contraction-driven beta amplitude loss was observed during the fatigue trial,
which might indicate that this habituation response was counteracted by the
development of fatigue. During physical fatigue, a gradual increase in the motor
Chapter 3
139
drive is required to maintain a consistent force output, and the sensory feedback
to the cortex may be augmented by peripheral factors such as the accumulation
of metabolites (Taylor & Gandevia 2008). Although speculative, it is possible that
continuous amendments in cortical processing in response to these progressive
fatigue-related processes may prevent the task from becoming familiar; thereby
impeding the cortical reorganisation involved in the habituation of the task.
The main focus of chapter 5 was on the movement-related oscillatory dynamics
identified in chapter 4. The aim was to investigate whether these phenomena are
modified when the homeostasis of the neuromuscular pathway facilitating a
particular movement is challenged (in this instance, by using physical fatigue).
The contraction-driven reductions in mu and beta amplitude loss were located in
the contralateral sensorimotor cortex, and so this was the region of cortex
examined by chapter 5. However, physical fatigue may have a greater influence
on other regions of the brain, upstream of the motor cortex. As physical fatigue
develops, transcranial magnetic stimulation of the motor cortex evokes a
gradually increasing amplitude of superimposed twitch response during maximal
voluntary force output (Gandevia et al. 1996). This demonstrates a progressively
sub-optimal output from the motor cortex (i.e. a progression of supraspinal
fatigue), and that no part of the motor pathway “from the motor cortex to the
myofibril” can be operating at capacity (Gandevia et al. 1996). Thus, some
component of the physical fatigue must be occurring upstream of the motor
cortex.
Future research should investigate how other regions of the cortex are affected
by fatigue. During the analysis of Chapter 5, contrasting oscillatory amplitude
between the constant-force phases of contractions performed before and after
the fatiguing intervention did not identify any significant changes in oscillatory
amplitude anywhere across the cortex (at least none that were consistent across
participants; data not shown). A subtle shift in focus to examine how different
regions of the cortex are affected by physical fatigue (rather than how physical
fatigue affects the contraction-driven changes in oscillatory amplitude) may
therefore require a substantial shift in the analytical approach. An appropriate
next step might be to perform a connectivity analysis on the recorded MEG to
Chapter 3
140
examine how the interaction between different cortical locations is modulated
during fatigue.
6.5 – Modulations of PMBR
To the author’s knowledge chapter 4 was the first study to show PMBR to be
systematically modulated by the motor parameters of the preceding voluntary
contraction. Specifically, a higher force output resulted in a significantly greater
PMBR amplitude, and a greater RFD resulted in a PMBR which was shorter in
duration, and higher in amplitude. Additionally, chapter 5 was the first study to
investigate the effect of physical fatigue on PMBR; demonstrating a greater
PMBR following contractions performed by a fatigued muscle group.
The results of chapter 4 are in some agreement with those of Stančák et al.
(1997) who observed a higher PMBR amplitude following finger extensions
performed against a heavy external load (130 g) compared to unloaded
extensions. However, contrary to chapter 4, no difference in PMBR was reported
following isometric elbow flexion between 25 and 75%MVT (Cremoux et al. 2013).
The reason for this inconsistency is unclear, and further investigation of the
PMBR response, including whether it may differ across muscle groups, may
therefore be warranted.
The PMBR is widely believed to reflect a GABAergic inhibition of the
sensorimotor networks established during motor actions. For example, Gaetz et
al. (2011) demonstrated a positive correlation between the magnitude of PMBR
and local GABA concentrations (measured using magnetic resonance
spectroscopy). Chapters 4 and 5 might therefore indicate that stronger
GABAergic action may be evoked following contractions of higher forces and
following contractions performed in a state of physical fatigue, respectively. The
exact cause of the augmented PMBR is not immediately clear; however, both
studies (chapters 4 and 5) proposed that elevations in PMBR might represent
inhibition of sensorimotor networks that are in states of higher activity/excitation.
In support of this hypothesis; greater sensorimotor BOLD responses are
observed during contractions of higher force outputs (Dai et al. 2001; Cramer et
Chapter 3
141
al. 2002; Ward & Frackowiak 2003; van Duinen et al. 2008; Keisker et al. 2009)
and during contractions performed in a state of physical fatigue (Benwell et al.
2007; van Duinen et al. 2007; Post et al. 2009; Steens et al. 2012), with these
increases in the fMRI signal expected to arise from a combination of increases in
both efferent and afferent processing. Moreover, the PMBR may be positively
related to the BOLD signal change during voluntary contractions (Parkes et al.
2006). Increases in both efferent and afferent processing might therefore
necessitate more extensive GABAergic activity following contraction termination
in order to actively inhibit the sensorimotor networks recruited during the
contraction, and to re-establish the inhibitory circuits underpinning the ‘idling’
cortical rhythms (Pfurtscheller et al. 2005; Stevenson et al. 2011). This
hypothesis could be further examined by future studies investigating whether
other (perhaps external) stimuli that evoke a graded BOLD response also result
in an incremental beta rebound.
In the ramp contractions paradigm of chapter 4, an increase in PMBR duration
and a decrease in PMBR amplitude were found to accompany increases in RFD.
However, by keeping the peak force of the ramp contractions constant, the
duration of the contractions was shortened with increases in RFD, and it was
speculated that this change in the length of contraction may have influenced
PMBR duration, rather than the RFD itself. Specifically, it was suggested that
longer contractions may result in longer PMBRs. One previous investigation
(Stevenson et al. 2011) has investigated the effect of increasing the duration of a
motor stimulus (1, 2, 4 and 6 s of index finger tapping) on beta responses and
found increases in the integrated PMBR with increases in stimulus duration up to
4 s, after which a slight decrease was noted. However, the study design involved
a fixed trial length of 12 s, meaning that as stimulus duration increased, the rest
period between bouts of finger tapping decreased (minimum 4 s). Therefore, any
further prolongation of PMBR following 6 s of finger tapping may not have been
fully captured. Moreover, measures of baseline beta amplitude may have been
collected during the latter stages of the PMBR, resulting in an underestimation of
the PMBR during the longer duration stimuli.
An explanation as to why the amplitude of PMBR may have increased with RFD
is less intuitive. However, this effect appeared to be less linear than the
Chapter 3
142
previously described results, with a lower amplitude PMBR observed following
the 9.9%MVF·s-1
contractions than both the 29.7 and 86.4%MVF·s-1
contractions,
which were of a similar amplitude (see Figure 5.6A&C). Subsequently, it was
speculated that when the ramp contractions were sustained over a longer time
period, the sensation of the handle in the participant’s hand may have been
retained following contraction cessation, contributing to a sensory aftereffect that
might have dampened the recorded PMBR by evoking a concurrent stimulus for
beta decrease. The hypothesis here is that a sensory aftereffect may produce a
stimulus-driven beta decrease in the sensory cortex that overlaps (temporally and
spatially) with the PMBR in the adjacent motor cortex, leading to an
underestimation of the extra-cranially recorded PMBR. In accordance with this
hypothesis, previous studies using both EEG (Mullinger et al. 2015) and fMRI
(Mullinger et al. 2015; Sadaghiani et al. 2009) have attributed dampening of (the
recorded) post-stimulus responses in the visual cortex to aftereffects following
different visual stimuli (static vs. flashing checkerboards).
The results of chapter 4 were useful not only in extending our understanding of
the PMBR, but also provided two important recommendations for future studies of
post-stimulus beta rebound responses. Firstly, use of motor tasks in
investigations of beta oscillations must ensure that the parameters of the
performed contractions are carefully controlled so as to remove the influence of
movement parameters on the magnitude and duration of the PMBR. Secondly, a
sufficient inter-stimulus interval must be incorporated in to the study design so
that the full rebound response can be characterised, and more importantly, an
accurate assessment of baseline oscillatory amplitude can be made that is not
biased by a lengthy rebound response. Furthermore, longer inter-stimulus breaks
may help prevent the development of physical fatigue, which may also influence
the magnitude of PMBR as shown in chapter 5.
6.6 – MRBD and PMBR: independent phenomena?
Chapters 4 and 5 have provided some evidence that MRBD and PMBR originate
via separate neural generators. Firstly, a significant anterior shift in the spatial
location of the PMBR compared to the MRBD was shown in the constant-force
Chapter 3
143
contractions experiment in chapter 4. This was supported by a similar (albeit non-
significant) trend in the ramp contractions paradigm, and although no statistical
analysis was conducted, chapter 5 also reported PMBR to arise anteriorly to
MRBD. These results are in agreement with several previous investigations that
have also reported PMBR to arise anteriorly to MRBD (Stancák & Pfurtscheller
1995; Salmelin et al. 1995; Jurkiewicz et al. 2006). In addition, the results of
Chapter 4 showed PMBR was systematically modulated by both the force and
RFD of the performed contractions, whereas MRBD was unaffected by either
parameter. Similarly, chapter 5 demonstrated PMBR to be increased following
the development of physical fatigue, whereas MRBD was unchanged. These
results are again in agreement with the previous investigations, which have
suggested the MRBD to exhibit a distinct ‘on/off’ property, while the PMBR might
be more variable in its relationship with task parameters (Stevenson et al. 2011;
Stevenson et al. 2012).
Further dissimilarities between MRBD and PMBR have also been reported
previously. For example, the beta power loss during contractions may be more
widespread (spatially) than the ensuing PMBR (Pfurtscheller et al. 1996), and the
frequency of the PMBR has been reported as slightly higher (Feige et al. 1996),
or lower (Müller-Putz et al. 2007) than the preceding MRBD.
One argument for MRBD and PMBR not being wholly independent is that one
phenomenon is seldom observed without the other. The only exception (to the
author’s knowledge) comes from an investigation by Cassim et al. (2001), which
reported an abolition of PMBR following ischaemic deafferentation. These
authors suggested that afferent feedback may therefore be fundamental to the
engenderment of the PMBR, however, a rebound in beta power has been
observed following imagined contractions; both in healthy controls (Pfurtscheller
et al. 2005; Schnitzler et al. 1997), and in a paraplegic patient (Müller-Putz et al.
2007).
Overall, the hypothesis that the MRBD and PMBR are fundamentally different
processes is not new. Donner and Siegel (2011) proposed that decreases in beta
amplitude may be associated with local encoding processes, whereas increases
in beta amplitude might reflect integrative processes over large networks.
Chapter 3
144
Moreover, Muthukumaraswamy et al. (2013) suggested that PMBR may be a
GABAA receptor mediated process while PMBR may be GABAB receptor
mediated. Nevertheless, the results of the present findings add support to the
hypothesis that these two oscillatory phenomena may reflect the actions of
separate neuronal substrates (Feige et al. 1996; Pfurtscheller et al. 1996b), and
may have functionally distinct roles (Jurkiewicz et al. 2006).
Chapter 3
145
6.7 – Summary of the Key Findings
1. Chapter 2 addressed the importance of Ia afferent contributions to
maximal force development. It found both maximal and explosive force
production were unaffected following a 30-min tendon vibration. This was
despite a marked decrease in H-reflex amplitude, which indicated that the
vibration stimulus was effective in attenuating the efficacy of the Ia
afferent-α-motoneuron pathway. These results indicated that for isometric
contractions of the quadriceps muscle group, maximal and explosive force
production may not be dependent upon input to the α-motoneurons via
homonymous Ia afferents.
2. Chapters 3 and 4 examined whether movement-related changes in
oscillatory amplitude might be modulated by the motor parameters of the
performed contractions (specifically contraction force/torque and RFD).
The main findings were:
a. Chapters 3 and 4 found the changes in alpha/mu and beta
amplitude between contraction and rest to be unaffected by either
contraction force/torque or RFD.
b. Chapter 3 observed the 30-50 Hz gamma band activity during
contractions to be augmented with increments in knee-extension
torque, although this was attributed increases in physiological
arousal and/or the attentional demands of the higher torque
contractions, rather than the motor parameters directly.
c. Chapter 4 showed monotonic modulation of PMBR with both wrist-
flexor contraction force and RFD. Specifically, increases in PMBR
amplitude accompanied increases in isometric contraction force;
and both an increase in PMBR amplitude and a decrease in PMBR
duration accompanied the increments in RFD.
Chapter 3
146
d. Chapter 4 also found PMBR could be >7 s duration. This result
highlighted the necessity for future study designs to incorporate an
inter-stimulus interval sufficient enough for assessments of baseline
oscillatory amplitude to be made following the completion of the
PMBR.
3. Chapter 5 investigated whether oscillatory activity within the sensorimotor
cortex may be modulated when contractions were performed in a state of
physical fatigue. The results demonstrated:
a. MRBD was attenuated during the control trial, whereas the
magnitude of MRBD was maintained during the fatigue trial. This
finding indicated that physical fatigue might counteract a habituation
response, whereby the MRBD is reduced as a motor task becomes
familiar (as observed in the control trial).
b. PMBR was increased following the fatiguing intervention, but
remained unchanged following during the control trial. This increase
in PMBR was thought to represent an increase in GABAergic action.
Specifically, it was suggested that contractions performed in a state
of physical fatigue may involve an increase in both efferent and
afferent processing, and that a greater GABAergic action might then
be necessary to actively inhibit the sensorimotor networks recruited
during these contractions.
Chapter 3
147
6.8 – Future research
The key findings reported above include a number of novel results which might
open up further avenues for exploration. In particular, future studies should seek
to:
1. Examine the effect of prolonged tendon vibration on the efficacy of the
homonymous Ia afferent-α-motoneuron pathway during the performance of
maximal force production.
2. Investigate the movement-related oscillatory responses to different
contraction types (i.e. isometric/concentric/eccentric contractions).
3. Examine the PMBR response to constant-force isometric contractions of
different durations.
4. Corroborate the reported effects of physical fatigue on MRBD and PMBR
using other fatiguing paradigms.
5. Examine how the interaction between different cortical locations is
modulated during physical fatigue using connectivity analyses of MEG
recordings.
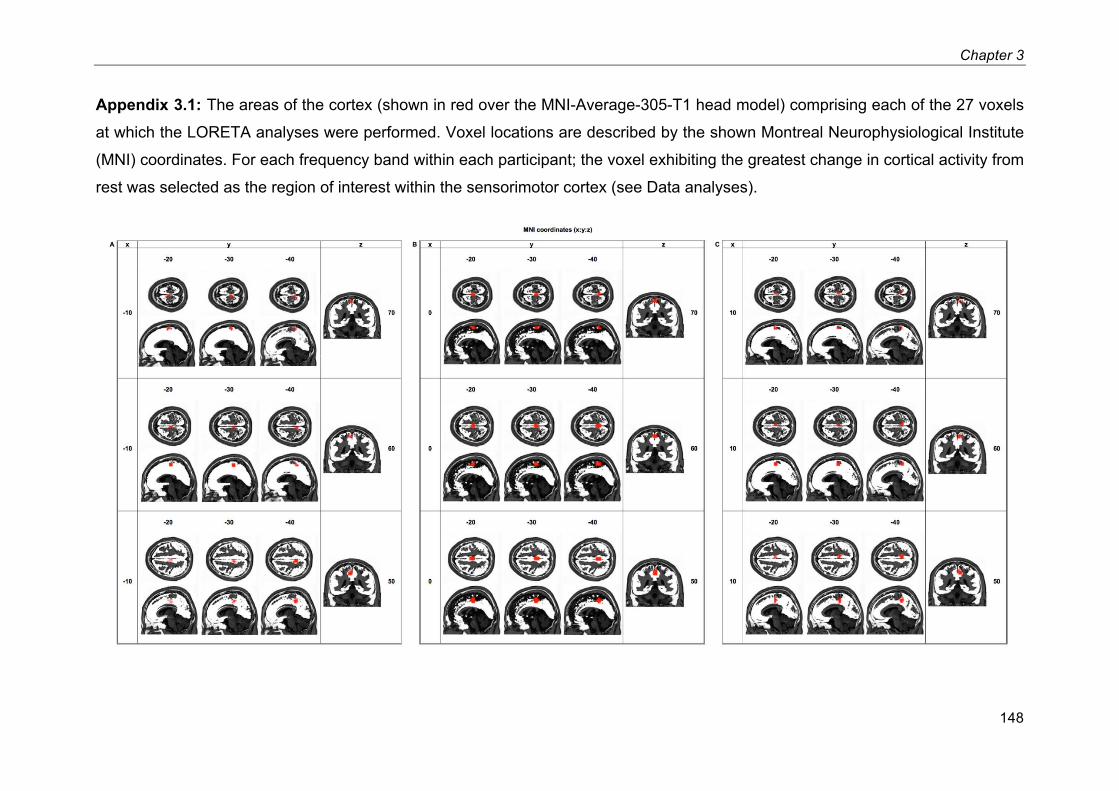
Chapter 3
148
Appendix 3.1: The areas of the cortex (shown in red over the MNI-Average-305-T1 head model) comprising each of the 27 voxels
at which the LORETA analyses were performed. Voxel locations are described by the shown Montreal Neurophysiological Institute
(MNI) coordinates. For each frequency band within each participant; the voxel exhibiting the greatest change in cortical activity from
rest was selected as the region of interest within the sensorimotor cortex (see Data analyses).
149
References Abbruzzese, M. et al., 1997. Testing for pre-synaptic and post-synaptic changes
in the soleus H reflex pathway following selective muscle vibration in humans.
Neuroscience Letters, 231, pp.99–102.
Alegre, M. et al., 2008. Oscillatory changes related to the forced termination of a movement. Clinical Neurophysiology, 119(2), pp.290–300.
Allen, G., McKenzie, D. & Gandevia, S., 1998. Twitch interpolation of the elbow flexor muscles at high forces. Muscle & Nerve, 21(3), pp.318–328.
Allison, G.T., 2003. Trunk muscle onset detection technique for EMG signals with
ECG artefact. Journal of Electromyography and Kinesiology, 13(3), pp.209–216.
Ashe, J., 1997. Force and the motor cortex. Behavioural Brain Research, 87, pp.255–269.
Bai, X. et al., 2007. Evaluation of cortical current density imaging methods using
intracranial electrocorticograms and functional MRI. NeuroImage, 35(2), pp.598–608.
Bailey, S.P. et al., 2008. Changes in EEG during graded exercise on a recumbent cycle ergometer. Journal of Sports Science and Medicine, 7, pp.505–511.
Bauer, M. et al., 2014. Attentional modulation of alpha/beta and gamma
oscillations reflect functionally distinct processes. Journal of Neuroscience, 34(48), pp.16117–16125.
Bauer, M., Kennett, S. & Driver, J., 2012. Attentional selection of location and
modality in vision and touch modulates low-frequency activity in associated sensory cortices. Journal of Neurophysiology, 107(9), pp.2342–2351.
Belanger, A. & McComas, A., 1981. Extent of motor unit activation during effort. Journal of Applied Physiology, 51(5), pp.1131–1135.
Bemben, M., Clasey, J. & Massey, B., 1990. The effect of the rate of muscle
150
contraction on the force-time curve parameters of male and female subjects. Research Quarterly for Exercise and Sport, 61(1), pp.96–99.
Benwell, N., Mastaglia, F. & Thickbroom, G., 2007. Changes in the functional MR
signal in motor and non-motor areas during intermittent fatiguing hand
exercise. Experimental Brain Research, 182(1), pp.93–97.
Berger, H., 1929. Über das elektrenkephalogramm des menschen. Arch Psychiat
Nervenkr, 87, pp.527–570.
Bigland-Ritchie, B., Cafarelli, E. & Vøllestad, N., 1986. Fatigue of submaximal
static contractions. Acta Physiologica Scandinavica. Supplementum, 556, pp.137–148.
Blinkenberg, M. et al., 1996. Rate dependence of regional cerebral activation
during performance of a repetitive motor task: a PET study. Journal of
Cerebral Blood Flow and Metabolism, 16(5), pp.794–803.
Bongiovanni, L., Hagbartht, K.-E. & Stjernbergt, L., 1990. Prolonged muscle
vibration reducing motor output in maximal voluntary contractions in man. Journal of Physiology, 423, pp.15–26.
Bonnet, M.H. & Arand, D.L., 2001. Impact of activity and arousal upon spectral EEG parameters. Physiology & Behavior, 74(3), pp.291–298.
van Boxtel, A., 1986. Differential effects of low-frequency depression, vibration-
induced inhibition, and posttetanic potentiation on H-reflexes and tendon
jerks in the human soleus muscle. Journal of Neurophysiology, 55, pp.551–568.
Brookes, M. et al., 2015. Complexity measures in magnetoencephalography: Measuring “disorder” in schizophrenia. Plos One, 10(4), p.e0120991.
Brookes, M. et al., 2008. Optimising experimental design for MEG beamformer imaging. NeuroImage, 39(4), pp.1788–1802.
Brookes, M. et al., 2012. Task induced modulation of neural oscillations in electrophysiological brain networks. NeuroImage, 63(4), pp.1918–1930.
151
Brucke, C. et al., 2012. Scaling of movement is related to pallidal γ oscillations in patients with dystonia. Journal of Neuroscience, 32(3), pp.1008–1019.
Brümmer, V. et al., 2011. Primary motor cortex activity is elevated with incremental exercise intensity. Neuroscience, 181, pp.150–162.
Buckthorpe, M. et al., 2012. Reliability of neuromuscular measurements during
explosive isometric contractions, with special reference to electromyography normalization techniques. Muscle & Nerve, 46, pp.566–76.
Buxton, R., 2012. Dynamic models of BOLD contrast. NeuroImage, 62(2), pp.953–961.
Buxton, R., Wong, E. & Frank, L., 1998. Dynamics of blood flow and oxygenation
changes during brain activation: The ballon model. Magnetic Resonance in
Medicine, 39(17), pp.855–864.
Cassim, F. et al., 2001. Does post-movement beta synchronization reflect an idling motor cortex? NeuroReport, 12(17), pp.3859–3863.
Chatrian, G., Petersen, M. & Lazarte, J., 1959. The blocking of the rolandic
wicket rhythm and some central changes related to movement. Electroencephalography and Clinical Neurophysiology, 11(3), pp.497–510.
Chen, J. & Pike, G., 2009. Origins of the BOLD post-stimulus undershoot. NeuroImage, 46(3), pp.559–568.
Chen, W. et al., 1998. Spatial and temporal differentiation of fMRI BOLD
response in primary visual cortex of human brain during sustained visual simulation. Magnetic Resonance in Medicine, 39(4), pp.520–527.
Cheney, P. & Fetz, E., 1980. Functional classes of primate corticomotoneuronal
cells and their relation to active force. Journal of Neurophysiology, 44(4), pp.773–791.
Chestek, C. et al., 2013. Hand posture classification using electrocorticography
signals in the gamma band over human sensorimotor brain areas. Journal of
Neural Engineering, 10(2), p.026002.
152
Cheyne, D., 2013. MEG studies of sensorimotor rhythms: a review. Experimental
Neurology, 245, pp.27–39.
Cheyne, D. et al., 2008. Self-paced movements induce high-frequency gamma oscillations in primary motor cortex. NeuroImage, 42(1), pp.332–342.
Christensen, L. et al., 2000. Cerebral activation during bicycle movements in man.
Experimental Brain Research, 135, pp.66–72.
Cramer, S. et al., 2002. Motor cortex activation is related to force of squeezing.
Human Brain Mapping, 16(4), pp.197–205.
Cremoux, S. et al., 2013. Motor-related cortical activity after cervical spinal cord
injury: Multifaceted EEG analysis of isometric elbow flexion contractions. Brain Research, 1533, pp.44–51.
Crone, C. & Nielsen, J., 1989. Methodological implications of the post activation
depression of the soleus H-reflex in man. Experimental Brain Research, 78, pp.28–32.
Crone, N. et al., 1998. Functional mapping of human sensorimotor cortex with
electrocorticographic spectral analysis. II. Event-related synchronization in the gamma band. Brain, 121, pp.2301–2315.
Curtis, D. & Eccles, J., 1960. Snaptic action during and after repetitive stimulation. Journal of Physiology, 150, pp.374–398.
Cushing, H., 1909. A note upon the faradic stimulation of the postcentral gyrus in conscious patients. Brain, 32, pp.44–53.
Dai, T. et al., 2001. Relationship between muscle output and functional MRI-measured brain activation. Experimental Brain Research, 140, pp.290–300.
Dal Maso, F., Longcamp, M. & Amarantini, D., 2012. Training-related decrease in
antagonist muscles activation is associated with increased motor cortex
activation: evidence of central mechanisms for control of antagonist muscles. Experimental Brain Research, 220, pp.287–295.
Desmedt, J. & Godaux, E., 1978. Mechanism of the vibration paradox: excitatory
153
and inhibitory effects of tendon vibration on single soleus muscle motor units in man. Journal of Physiology, 285, pp.197–207.
Dettmers, C. et al., 1995. Relation between cerebral activity and force in the
motor areas of the human brain. Journal of Neurophysiology, 74(2), pp.802–
815.
Deutekom, M. et al., 2000. No acute effects of short-term creatine
supplementation on muscle properties and sprint performance. European
Journal of Applied Physiology, 82(3), pp.223–229.
Donner, T. & Siegel, M., 2011. A framework for local cortical oscillation patterns. Trends in Cognitive Science, 15(5), pp.191–199.
Dorfman, L., Howard, J. & McGill, K., 1990. Triphasic behavioral response of
motor units to submaximal fatiguing exercise. Muscle and Nerve, 13(7),
pp.621–628.
van Drongelen, W. et al., 1996. A spatial filtering technique to detect and localize
multiple sources in the brain. Brain Topography, 9(1), pp.39–49.
van Duinen, H. et al., 2007. Effects of motor fatigue on human brain activity, an fMRI study. NeuroImage, 35(4), pp.1438–1449.
van Duinen, H. et al., 2008. Relation between muscle and brain activity during
isometric contractions of the first dorsal interosseus muscle. Human Brain
Mapping, 29(3), pp.281–99.
Dujardin, K., Bourriez, J. & Guieu, J., 1995. Event-related desynchronization
(ERD) patterns during memory processes: effects of aging and task difficulty.
Electroencephalography and Clinical Neurophysiology, 96(2), pp.169–182.
Earles, D. et al., 2002. Pre-and post-synaptic control of motoneuron excitability in athletes. Medicine & Science in Sports & Exercise, 34(11), pp.1766–1772.
van Ede, F., Szebényi, S. & Maris, E., 2014. Attentional modulations of
somatosensory alpha, beta and gamma oscillations dissociate between anticipation and stimulus processing. NeuroImage, 97, pp.134–141.
154
Ekblom, M. & Thorstensson, A., 2011. Effects of prolonged vibration on H-
reflexes, muscle activation, and dynamic strength. Medicine & Science in
Sports & Exercise, 43, pp.1933–1939.
Erskine, J. et al., 2007. Neuromuscular and hormonal responses to a single
session of whole body vibration exercise in healthy young men. Clinical
Physiology and Functional Imaging, 27, pp.242–248.
Evarts, E., 1969. Activity of pyramidal tract neurons during postural fixation. Journal of Neurophysiology, 32(3), pp.375–385.
Evarts, E. et al., 1983. Motor cortex control of finely graded forces. Journal of
Neurophysiology, 49(5), pp.1199–1215.
Evarts, E., 1968. Relation of pyramidal tract activity to force exerted during voluntary movement. J Neurophysiology, 31, pp.14–27.
Feige, B. et al., 1996. Neuromagnetic study of movement-related changes in rhythmic brain activity. Brain Research, 734(1), pp.252–260.
Flint, R. et al., 2014. Extracting kinetic information from human motor cortical
signals. NeuroImage, 101, pp.695–703.
Folland, J., Buckthorpe, M. & Hannah, R., 2013. Human capacity for explosive
force production: Neural and contractile determinants. Scandinavian Journal
of Medicine & Science in Sports, 24(6), pp.894-906.
Folland, J., Wakamatsu, T. & Fimland, M., 2008. The influence of maximal
isometric activity on twitch and H-reflex potentiation , and quadriceps femoris performance. European Journal of Applied Physiology, 104, pp.739–748.
Folland, J.P. & Williams, A.G., 2007. The Adaptations to Strength Training
Increased Strength. Sports Medicine, 37(2), pp.145–168.
Gaetz, W. et al., 2010. Neuromagnetic imaging of movement-related cortical
oscillations in children and adults: Age predicts post-movement beta rebound. NeuroImage, 51(2), pp.792–807.
Gaetz, W. et al., 2011. Relating MEG measured motor cortical oscillations to
155
resting γ-aminobutyric acid (GABA) concentration. NeuroImage, 55(2), pp.616–621.
Gandevia, S., 2001. Spinal and supraspinal factors in human muscle fatigue. Physiological reviews, 81(4), pp.1725–89.
Gandevia, S. et al., 1996. Supraspinal factors in human muscle fatigue: evidence
for suboptimal output from the motor cortex. Journal of Physiology, 490(2), pp.529–536.
Gilbertson, T. et al., 2005. Existing motor state is favored at the expense of new
movement during 13-35 Hz oscillatory synchrony in the human corticospinal system. The Journal of Neuroscience, 25(34), pp.7771–7779.
Goodall, S. et al., 2012. Transcranial magnetic stimulation in sport science: A commentary. European Journal of Sport Science, (14), pp.S332–S340.
Grech, R. et al., 2008. Review on solving the inverse problem in EEG source analysis. Journal of NeuroEngineering and Rehabilitation, 5, p.25.
Gross, J. et al., 2001. Dynamic imaging of coherent sources: Studying neural
interactions in the human brain. PNAS, 98(2), pp.694–699.
Grünbaum, A. & Sherrington, C., 1901. Observations on the Physiology of the
Cerebral Cortex of the Anthropoid Apes. Proceedings of the Royal Society of
London, 69, pp.206–209.
Hagbarth, K.-E. et al., 1986. Gamma loop contributing to maximal voluntary contractions in man. Journal of Physiology, 380, pp.575–591.
Hall, E. et al., 2014. The relationship between MEG and fMRI. NeuroImage, 102(1), pp.80–91.
Hall, S. et al., 2014. GABA-mediated changes in inter-hemispheric beta
frequency activity in early-stage Parkinson’s disease. Neuroscience, 281,
pp.68–76.
Hall, S. et al., 2011. The role of GABAergic modulation in motor function related neuronal network activity. NeuroImage, 56(3), pp.1506–1510.
156
Hannah, R., Minshull, C. & Folland, J., 2013. Whole-body vibration does not
influence knee joint neuromuscular function or proprioception. Scandinavian
Journal of Medicine & Science in Sports, 23, pp.96–104.
Hayward, L. et al., 1986. Tendon vibration-induced inhibition of human and cat
triceps surae group I reflexes: evidence of selective lb afferent fiber activation. Experimental Neurology, 94, pp.333–347.
Heckman, C. et al., 1984. Can Ib axons be selectively activated by electrical stimuli in human subjects? Experimental Neurology, 86, pp.576–582.
Heckman, C. & Binder, M., 1991. Computer simulation of the steady-state input-
output function of the cat medial gastrocnemius motoneuron pool. Journal of
Neurophysiology, 65(4), pp.952–967.
Heinrichs-Graham, E. et al., 2014. Neuromagnetic evidence of abnormal
movement-related beta desynchronization in Parkinson’s disease. Cerebral
Cortex, 24(10), pp.1–10.
Henneman, E., Somjen, G. & Carpenter, D., 1965. Excitability and inhibitability of
motoneurons of different sizes. Journal of Neurophysiology, 28(3), pp.599–620.
Hepp-Reymond, M. et al., 1999. Context-dependent force coding in motor and premotor cortical areas. Experimental Brain Research, 128, pp.123–133.
Hillebrand, A. et al., 2005. A new approach to neuroimaging with
magnetoencephalography. Human Brain Mapping, 25(2), pp.199–211.
Hoffmann, P., 1918. Über die beziehung der sehnenreflexe zur willkürlichen
bewegung und zum tonus. Z Biol, 68, pp.351–370.
Holtermann, A. et al., 2007. Enhanced H-reflex with resistance training is related
to increased rate of force development. European Journal of Applied
Physiology, 101, pp.301–312.
Hopkins, J. & Wagie, N., 2003. Intrasession and intersession reliability of the
quadriceps Hoffmann reflex. Electromyography and Nlinical neurophysiology, 43(2), pp.85–89.
157
Hu, X., Le, T. & Uğurbil, K., 1997. Evaluation of the early response in fMRI in
individual subjects using short stimulus duration. Magnetic Resonance in
Medicine, 37(6), pp.877–884.
Huang, M., Mosher, J. & Leahy, R., 1999. A sensor-weighted overlapping-sphere
head model and exhaustive head model comparison for MEG. Physics in
Medicine and Biology, 44(2), pp.423–440.
Hultborn, H. et al., 1987. Assessing changes in presynaptic inhibition of Ia fibres: a study in man and the cat. The Journal of Physiology, 389(1), pp.729–756.
Hultborn, H. et al., 1996. On the mechanism of the post-activation depression of
the H-reflex in human subjects. Experimental Brain Research, 108, pp.450–462.
Humphries, B. et al., 2004. The influence of vibration on muscle activation and
rate of force development during maximal isometric contractions. Journal of
Sports Science and Medicine, 3(1), pp.16–22.
Jackson, S. & Turner, D., 2003. Prolonged muscle vibration reduces maximal
voluntary knee extension performance in both the ipsilateral and the
contralateral limb in man. European Journal of Applied Physiology, 88, pp.380–386.
Jagannath, M. & Balasubramanian, V., 2014. Assessment of early onset of driver
fatigue using multimodal fatigue measures in a static simulator. Applied
Ergonomics, 45(4), pp.1140–1147.
Jasper, H. & Andrews, H., 1938. Electro-encephalography III. Normal
differentiation of occipital and precentral regions in man. Archives of
Neurology and Psychiatry, 39, pp.96–115.
Jasper, H. & Penfield, W., 1949. Electrocorticograms in man: Effect of voluntary
movement upon the electrical activity of the precentral gyrus. Archiv für
Psychiatrie und Zeitschrift Neurologie, 183, pp.163–174.
Jenkinson, N., Kühn, A. & Brown, P., 2013. γ oscillations in the human basal ganglia. Experimental Neurology, 245, pp.72–76.
158
Jensen, O. et al., 2005. On the human sensorimotor-cortex beta rhythm: sources and modeling. NeuroImage, 26(2), pp.347–355.
Jin, T. & Kim, S.-G., 2008. Cortical layer-dependent dynamic blood oxygenation,
cerebral blood flow and cerebral blood volume responses during visual
stimulation. NeuroImage, 43(1), pp.1–9.
Joundi, R. et al., 2012. Oscillatory activity in the subthalamic nucleus during arm
reaching in Parkinson’s disease. Experimental Neurology, 236(2), pp.319–326.
Jurkiewicz, M. et al., 2006. Post-movement beta rebound is generated in motor
cortex: Evidence from neuromagnetic recordings. NeuroImage, 32, pp.1281–1289.
Kameyama, O., Hayes, K. & Wolfe, D., 1989. Methodological considerations
contributing to variability of the quadriceps H-reflex. American Journal of
Physical Medicine & Rehabilitation, 68(6), pp.277–282.
Keisker, B. et al., 2009. Differential force scaling of fine-graded power grip force in the sensorimotor network. Human Brain Mapping, 30, pp.2453–65.
Kilavik, B. et al., 2013. The ups and downs of beta oscillations in sensorimotor cortex. Experimental Neurology, 245, pp.15–26.
Klimesch, W., Sauseng, P. & Hanslmayr, S., 2007. EEG alpha oscillations: The inhibition-timing hypothesis. Brain Research Reviews, 53(1), pp.63–88.
Konishi, Y., Kubo, J. & Fukudome, A., 2009. Effects of prolonged tendon vibration
stimulation on eccentric and concentric maximal torque and EMGs of the
knee extensors. Journal of Sports Science and Medicine, 8, pp.548–552.
Kouzaki, M. et al., 2000. Decrease in maximal voluntary contraction by tonic
vibration applied to a single synergist muscle in humans. Journal of Applied
Physiology, 89, pp.1420–1424.
Kozelka, J. & Pedley, T., 1990. Beta and mu rhythms. Journal of Clinical
Neurophysiology, 7(2), pp.191–207.
159
Kranczioch, C. et al., 2008. Short-term learning of a visually guided power-grip
task is associated with dynamic changes in EEG oscillatory activity. Clinical
Neurophysiology, 119(6), pp.1419–1430.
Kuriki, H. et al., 2011. Comparison of different analysis techniques for the
determination of muscle onset in individuals with patellofemoral pain syndrome. Journal of Eectromyography and Kinesiology, 21, pp.982–987.
Lapole, T., Canon, F. & Pérot, C., 2012. Acute postural modulation of the soleus
H-reflex after Achilles tendon vibration. Neuroscience Letters, 523(2), pp.154–157.
Leocani, L. et al., 1997. Event-related coherence and event-related
desynchronization/synchronization in the 10 Hz and 20 Hz EEG during self-
paced movements. Electroencephalography and Clinical Neurophysiology, 104(3), pp.199–206.
Li, C. & Bak, A., 1976. Excitability characteristics of the A- and C-fibers in a peripheral nerve. Experimental Neurology, 50, pp.67–79.
Lin, C.-Y. et al., 2002. Excitability of human muscle afferents studied using threshold tracking of the H reflex. Journal of Physiology, 545(2), pp.661–669.
Liu, J. et al., 2003. Human brain activation during sustained and intermittent
submaximal fatigue muscle contractions: an FMRI study. Journal of
Neurophysiology, 90(1), pp.300–312.
Liu, J. et al., 2002. Nonlinear cortical modulation of muscle fatigue: a functional MRI study. Brain Research, 957(2), pp.320–329.
Ludman, C. et al., 1996. Force of voluntary exercise does not affect sensorimotor
cortex activation as detected by functional MRI at 1.5 T. NMR in Biomedicine, 9(5), pp.228–32.
Macefield, V. et al., 1993. The firing rates of human motoneurones voluntarily
activated in the absence of muscle afferent feedback. Journal of Physiology,
471, pp.429–443.
Mackay, W., 1997. Synchronized neuronal oscillations and their role in motor
160
processes. Trends in Cognitive Sciences, 1(5), pp.176–183.
Mancini, L. et al., 2009. Short-term adaptation to a simple motor task: A
physiological process preserved in multiple sclerosis. NeuroImage, 45(2), pp.500–511.
Mary, A. et al., 2015. Aging reduces experience-induced sensorimotor plasticity.
A magnetoencephalographic study. NeuroImage, 104, pp.59–68.
Merton, P., 1954. Voluntary strength and fatigue. Journal of Physiology, 123,
pp.553–564.
Miller, K. et al., 2007. Spectral changes in cortical surface potentials during motor movement. The Journal of Neuroscience, 27(9), pp.2424–2432.
Mima, T. et al., 1999. Force level modulates human cortical oscillatory activities. Neuroscience Letters, 275, pp.77–80.
Müller-Putz, G. et al., 2007. Event-related beta EEG-changes during passive and
attempted foot movements in paraplegic patients. Brain Research, 1137(1), pp.84–91.
Mullinger, K. et al., 2015. fMRI post-stimulus undershoots in visual cortex are
neuronal in origin. In ISMRM Proc. p. 2415.
Mullinger, K. et al., 2013. Poststimulus undershoots in cerebral blood flow and
BOLD fMRI responses are modulated by poststimulus neuronal activity. PNAS, 110(33), pp.13636–13641.
Murthy, V.N. & Fetz, E.E., 1996a. Oscillatory activity in sensorimotor cortex of
awake monkeys: Synchronization of local field potentials and relation to behavior. Journal of Neurophysiology, 76, pp.3949–3967.
Murthy, V.N. & Fetz, E.E., 1996b. Synchronization of neurons during local field
potential oscillations in sensorimotor cortex of awake monkeys. Journal of
Neurophysiology, 76, pp.3968–3982.
Muthukumaraswamy, S., 2010. Functional properties of human primary motor
cortex gamma oscillations. Journal of Neurophysiology, 104(5), pp.2873–
161
2885.
Muthukumaraswamy, S. et al., 2013. The effects of elevated endogenous GABA levels on movement-related network oscillations. NeuroImage, 66, pp.36–41.
do Nascimento, O., Nielsen, K. & Voigt, M., 2005. Relationship between plantar-
flexor torque generation and the magnitude of the movement-related
potentials. Experimental Brain Research, 160(2), pp.154–165.
Pääsuke, M., Ereline, J. & Gapeyeva, H., 2001. Knee extension strength and
vertical jumping performance in nordic combined athletes. The Journal of
Sports Medicine and Physical Fitness, 41, pp.354–361.
Parkes, L., Bastiaansen, M. & Norris, D., 2006. Combining EEG and fMRI to
investigate the post-movement beta rebound. NeuroImage, 29(3), pp.685–696.
Pascual-marqui, R.D. et al., 2002. Functional imaging with low resolution
electromagnetic tomography (LORETA): review , comparisons , and new
validation. Japanese Journal of Clinical Neurophysiology, 30, pp.81–94.
De Pauw, K. et al., 2013. Brain mapping after prolonged cycling and during
recovery in the heat. Journal of applied physiology (Bethesda, Md. : 1985), 115(9), pp.1324–31.
Penfield, W., 1954. Mechanisms of voluntary movement. Brain, 77(1), pp.1–17.
Perez-Orive, J. et al., 2002. Oscillations and sparsening of odor representations in the mushroom body. Science, 297(5580), pp.359–365.
Pfurtscheller, G. et al., 2005. Beta rebound after different types of motor imagery in man. Neuroscience Letters, 378(3), pp.156–159.
Pfurtscheller, G. et al., 2003. Spatiotemporal patterns of beta desynchronization
and gamma synchronization in corticographic data during self-paced
movement. Clinical Neurophysiology, 114(7), pp.1226–1236.
Pfurtscheller, G. & Lopes da Silva, F., 1999. Event-related EEG/MEG
synchronization and desynchronization: basic principles. Clinical
162
Neurophysiology, 110(11), pp.1842–1857.
Pfurtscheller, G. & Solis-Escalante, T., 2009. Could the beta rebound in the EEG
be suitable to realize a “brain switch”? Clinical Neurophysiology, 120(1), pp.24–29.
Pfurtscheller, G., Stancák, A. & Neuper, C., 1996. Post-movement beta
synchronization. A correlate of an idling motor area? Electroencephalography and Clinical Neurophysiology, 98(4), pp.281–293.
Pfurtscheller, G., Zalaudek, K. & Neuper, C., 1998. Event-related beta
synchronization after wrist, finger and thumb movement. Electroencephalography and clinical neurophysiology, 109(2), pp.154–60.
Pierrot-Deseilligny, E. & Burke, D., 2005. The circuitry of the human spinal cord:
its role in motor control and movement disorders, Cambridge University
Press.
Pineda, J. a., 2005. The functional significance of mu rhythms: Translating
“seeing” and “hearing” into “doing.” Brain Research Reviews, 50(1), pp.57–68.
Pistohl, T. et al., 2012. Decoding natural grasp types from human ECoG. NeuroImage, 59(1), pp.248–260.
Pogosyan, A. et al., 2009. Boosting cortical activity at Beta-band frequencies slows movement in humans. Current Biology, 19(19), pp.1637–1641.
Pollok, B. et al., 2014. Changes of motor-cortical oscillations associated with motor learning. Neuroscience, 275, pp.47–53.
Pollok, B. et al., 2012. Motor-cortical oscillations in early stages of Parkinson’s
disease. The Journal of Physiology, 590(13), pp.3203–3012.
Post, M. et al., 2009. Voluntary activation and cortical activity during a sustained
maximal contraction: An fMRI study. Human Brain Mapping, 30(3), pp.1014–1027.
Proudfoot, M. et al., 2014. Magnetoencephalography. Practical Neurology, 14(5),
163
pp.336–343.
Puts, N. et al., 2011. Regionally specific human GABA concentration correlates
with tactile discrimination thresholds. The Journal of Neuroscience, 31(46), pp.16556–16560.
Rao, S. et al., 1996. Relationship between finger movement rate and functional
magnetic resonance signal change in human primary motor cortex. Journal
of Cerebral Blood Flow and Metabolism, 16(6), pp.1250–1254.
Robinson, S. & Vrba, J., 1998. Functional neuroimaging by synthetic aperture
magnetometry. In T. Yoshimoto et al., eds. Recent Advances in
Biomagnetism. Sendai, Japan: Tohoku University Press, pp. 302–305.
Robson, S. et al., Abnormal visuomotor processing in schizophrenia. NeuroImage
Clinical.
Roll, J., Vedel, J. & Ribot, E., 1989. Alteration of proprioceptive messages
induced by tendon vibration in man: a microneurographic study.
Experimental Brain Research, 76, pp.213–222.
Rougeul-Buser, A., 1994. Electrocortical rhythms in the 40 Hz band in cat: in
search of their behavioural correlates. In G. Buzsáki et al., eds. Temporal
Coding in the Brain. Berlin: Springer-Verlag, pp. 103–114.
de Ruiter, C. et al., 2004. Initial phase of maximal voluntary and electrically
stimulated knee extension torque development at different knee angles.
Journal of Applied Physiology, 97(5), pp.1693–1701.
de Ruiter, C. et al., 2003. Short-term effects of whole-body vibration on maximal
voluntary isometric knee extensor force and rate of force rise. European
Journal of Applied Physiology, 88, pp.472–475.
De Ruiter, C. et al., 1999. Temperature effect on the rates of isometric force
development and relaxation in the fresh and fatigued human adductor pollicis muscle. Experimental Physiology, 84(6), pp.1137–1150.
Sadaghiani, S., Uǧurbil, K. & Uludaǧ, K., 2009. Neural activity-induced
modulation of BOLD poststimulus undershoot independent of the positive
164
signal. Magnetic Resonance Imaging, 27(8), pp.1030–1038.
Sahaly, R. et al., 2001. Maximal voluntary force and rate of force development in
humans - importance of instruction. European Journal of Applied Physiology, 85, pp.345–350.
Salmelin, R. et al., 1995. Functional segregation of movement-related rhythmic
activity in the human brain. NeuroImage, 2(4), pp.237–243.
Salmelin, R. & Hari, R., 1994. Spatiotemporal characteristics of sensorimotor
neuromagnetic rhythms related to thumb movement. Neuroscience, 60(2), pp.537–550.
Sarvas, J., 1987. Basic mathematical and electromagnetic concepts of the
biomagnetic inverse problem. Physics in Medicine and Biology, 32(1), pp.11–22.
Schieppati, M., 1987. Excitability of human soleus motoneurones. , pp.271–284.
Schneider, S. et al., 2013. Cortical current density oscillations in the motor cortex
are correlated with muscular activity during pedaling exercise. Neuroscience,
228, pp.309–314.
Schnitzler, A. et al., 1997. Involvement of primary motor cortex in motor imagery: a neuromagnetic study. NeuroImage, 6(3), pp.201–208.
Shigihara, Y. et al., 2013. Two types of mental fatigue affect spontaneous
oscillatory brain activities in different ways. Behavioral and brain functions :
BBF, 9(1), p.1.
Shinohara, M. et al., 2005. Prolonged muscle vibration increases stretch reflex
amplitude, motor unit discharge rate, and force fluctuations in a hand muscle.
Journal of Applied Physiology, 99, pp.1825–1842.
Shmuel, A. et al., 2006. Negative functional MRI response correlates with
decreases in neuronal activity in monkey visual area V1. Nature
Neuroscience, 9(4), pp.569–577.
Sidhu, S., Bentley, D. & Carroll, T., 2009. Locomotor exercise induces long-
165
lasting impairments in the capacity of the human motor cortex to voluntarily
activate knee extensor muscles. Journal of Applied Physiology, 106(2), pp.556–565.
Siemionow, V. et al., 2000. Relationship between motor activity-related cortical
potential and voluntary muscle activation. Experimental Brain Research, 133, pp.303–311.
Smith, J. et al., 2007. Sustained contraction at very low forces produces
prominent supraspinal fatigue in human elbow flexor muscles. Journal of
Applied Physiology, 103, pp.560–568.
Soda, P. et al., 2010. Human movement onset detection from isometric force and
torque measurements: a supervised pattern recognition approach. Artificial
Intelligence in Medicine, 50(1), pp.55–61.
Søgaard, K. et al., 2006. The effect of sustained low-intensity contractions on
supraspinal fatigue in human elbow flexor muscles. Journal of Physiology, 573(2), pp.511–523.
Solis-Escalante, T. et al., 2012. Cue-induced beta rebound during withholding of
overt and covert foot movement. Clinical Neurophysiology, 123(6), pp.1182–1190.
Stancák, A. & Pfurtscheller, G., 1995. Desynchronization and recovery of beta
rhythms during brisk and slow self-paced finger movements in man. Neuroscience Letters, 196(1-2), pp.21–24.
Stancák, A. & Pfurtscheller, G., 1996. Event-related desynchronisation of central
beta-rhythms during brisk and slow self-paced finger movements of
dominant and nondominant hand. Cognitive Brain Research, 4(3), pp.171–183.
Stančák, A., Riml, A. & Pfurtscheller, G., 1997. The effects of external load on
movement-related changes of the sensorimotor EEG rhythms. Electroencephalography and Clinical Neurophysiology, 102, pp.495–504.
Staude, G., 2001. Precise onset detection of human motor responses using a
166
whitening filter and the log-likelihood-ratio test. IEEE Transactions on
Biomedical Engineering, 48(11), pp.1292–305.
Steens, a. et al., 2012. Mechanisms underlying muscle fatigue differ between
multiple sclerosis patients and controls: A combined electrophysiological and
neuroimaging study. NeuroImage, 59(4), pp.3110–3118.
Stein, R. & Thompson, A., 2006. Muscle reflexes in motion: How, what, and why? Exercise and Sport Sciences Reviews, 34(4), pp.145–153.
Stevenson, C. et al., 2012. Paired pulse depression in the somatosensory cortex:
Associations between MEG and BOLD fMRI. NeuroImage, 59(3), pp.2722–2732.
Stevenson, C., Brookes, M. & Morris, P., 2011. β-Band correlates of the fMRI BOLD response. Human Brain Mapping, 32(2), pp.182–97.
Studer, B. et al., 2010. The effects of practice distribution upon the regional
oscillatory activity in visuomotor learning. Behavioral and Brain Functions,
6(1), p.8.
Szurhaj, W. et al., 2005. Intracerebral study of gamma rhythm reactivity in the
sensorimotor cortex. European Journal of Neuroscience, 21(5), pp.1223–1235.
Tanaka, M., Shigihara, Y. & Watanabe, Y., 2011. Central inhibition regulates motor output during physical fatigue. Brain Research, 1412, pp.37–43.
Tanaka, M. & Watanabe, Y., 2012. Supraspinal regulation of physical fatigue. Neuroscience and Biobehavioral Reviews, 36(1), pp.727–734.
Taylor, J. & Gandevia, S., 2008. A comparison of central aspects of fatigue in
submaximal and maximal voluntary contractions. Journal of Applied
Physiology, 104(2), pp.542–550.
Taylor, J., Todd, G. & Gandevia, S., 2006. Evidence for a supraspinal
contribution to human muscle fatigue. Clinical and Experimental
Pharmacology and Physiology, 33, pp.400–405.
167
Taylor, J.L. et al., 2000. Supraspinal fatigue during intermittent maximal voluntary
contractions of the human elbow flexors. Journal of Applied Physiology, 89, pp.305–313.
Tecchio, F. et al., 2006. Cortical short-term fatigue effects assessed via rhythmic
brain-muscle coherence. Experimental Brain Research, 174(1), pp.144–151.
Thach, W., 1978. Correlation of neural discharge with pattern and force of
muscular activity, joint position, and direction of intended next movement in motor cortex and cerebellum. Journal of Neurophysiology, 41(3), pp.654-676.
Thickbroom, G. et al., 1998. Isometric force-related activity in sensorimotor cortex measured with functional MRI. Experimental Brain Research, 121, pp.59–64.
Tillin, N. et al., 2010. Neuromuscular performance of explosive power athletes
versus untrained individuals. Medicine & Science in Sports & Exercise, 42(4),
pp.781–790.
Tillin, N., Folland, J. & Pain, M., 2013. Identification of contraction onset during
explosive contractions. Response to Thompson et al. “Consistency of rapid
muscle force characteristics: influence of muscle contraction onset detection
methodology” [J Electromyogr Kinesiol 2012;22(6):893-900]. Journal of
Electromyography and Kinesiology, 23(4), pp.991–994.
Tillin, N., Pain, M. & Folland, J., 2013. Explosive force production during isometric
squats correlates with athletic performance in rugby union players. Journal of
Sports Sciences, 31, pp.66–76.
Todd, G., Gorman, R. & Gandevia, S., 2004. Measurement and reproducibility of
strength and voluntary activation of lower-limb muscles. Muscle & Nerve, 29(6), pp.834–842.
Todd, G., Taylor, J. & Gandevia, S., 2003. Measurement of voluntary activation of
fresh and fatigued human muscles using transcranial magnetic stimulation.
Journal of Physiology, 551(2), pp.661–671.
Ushiyama, J. et al., 2005. Difference in aftereffects following prolonged Achilles
tendon vibration on muscle activity during maximal voluntary contraction
168
among plantar flexor synergists. Journal of Applied Physiology, 98, pp.1427–1433.
Van Veen, B. et al., 1997. Localization of brain electrical activity via linearly
constrained minimum variance spatial filtering. IEEE Transactions on
Biomedical engineering, 44(9), pp.867–880.
Vogt, T. et al., 2014. Artificial gravity exposure impairs exercise-related neurophysiological benefits. Physiology & Behavior, 123, pp.156–161.
Vrba, J. & Robinson, S., 2001. Signal processing in magnetoencephalography. Methods, 25(2), pp.249–271.
Wannier, T., Maier, M. & Hepp-Reymond, M., 1991. Contrasting properties of
monkey somatosensory and motor cortex neurons activated during the control of force in precision grip. Journal of neurology, 65(3), pp.572–589.
Ward, N. & Frackowiak, R., 2003. Age-related changes in the neural correlates of motor performance. Brain, 126(4), pp.873–888.
Zehr, E., 2002. Considerations for use of the Hoffmann reflex in exercise studies.
European Journal of Applied Physiology, 86(6), pp.455–468.
Zehr, E. & Stein, R., 1999. What functions do reflexes serve during human locomotion? Progress in Neurobiology, 58(2), pp.185–205.
van Zijl, P., Hua, J. & Lu, H., 2012. The BOLD post-stimulus undershoot, one of the most debated issues in fMRI. NeuroImage, 62(2), pp.1092–1102.