Embed Size (px)
Citation preview
CREATIVE EXPERIENCE AND ACADEMIC ACHIEVEMENT AS DETERMINANTS OF SELF-ESTEEM AND EMOTIONAL
STABILITY OF VISUALLY HANDICAPPED STUDENTS
ABSTRACT OF THE
THESIS SUBMITTED FOR THE AWARD OF THE DEGREE OF
lottor of pi)iIos;opl)p IN
PSYCHOLOGY
BY
MAJDA TARANNUM
Under the Supervision of
DR. NAIMA K. GULREZ (Reader)
DEPARTMENT OF PSYCHOLOGY ALIGARH MUSLIM UNIVERSITY
ALIGARH (INDIA)
2008

ABSTRACT
The objective of the present'endeavour was aimed to study the
'•Creative Experience and Academic. Achievement as^determinants of Self-
esteem and Emotional Stabihty of Visually Handicapped. Students". Keeping
in view the objective of the study, an empiricaf investigation was undertaken
and thereafter data were tabulated and analysed with the help of Product-
moment coefficient of correlation, t-test and Regression analysis for obtaining
results.
The thesis comprises of six chapters. Chapter-I emphasises on the
present scenario of the visually handicapped students vis-a-vis independent
variable i.e. creative experience and academic achievement and dependent
variable self-esteem and emotional stability as a part of the introduction of
Ph.D. thesis.
In the past, handicapped children were excluded from the purview of
nominal experience. They have been treated as defective beings and believed
that these children will not profit from regular schools and their facilities.
In the early nineteenth century as the idea of democracy, individual freedom
and egalitarianism swept in west, and advancement in learning theory and
technology contributed to the emergence of optimistic attitude towards
handicapped pupils. A handicap is a disadvantage for a given individual,
resulting from impairment or disability, that limits or prevents the fulfilment
of a role that is considered normal depending on age, sex, social and cultural
factors for that individual. Individual whose normal learning and development
is impaired by visual conditions and who therefore, need specific conditions
and related services in order to develop their abilities can be identified as
visually handicapped. Creativity is a highly complex cognitive ability that
involves the generation of new concept or ideas, or new associations between
existing concepts or ideas. Scientifically, the products of creative thought are
usually considered to have both originality and appropriateness. Academic
achievement is the knowledge attained or skills developed in the school
subjects, are usually designed by test scores or by marks assigned by teachers
or by both. Self-esteem refers to an individual's sense of his or her value or
worth, or the extent to which a person values, approves of, appreciates, prizes,
or likes him or herself Emotional stability is considered as one of the
important aspect of human life. An emotionally stable individual has the
capacity to withstand delay in satisfaction of needs, capability to tolerate a
reasonable amount of frustration, belief in long term planning and is able of
delaying or revising his expectations in terms of demands of the situations.
Chapter II has been devoted to review of literature. A perusal of
readily available literature on creativity the researcher reviewed that in certain
studies visually handicapped were more creative than the sighted students. In
a large number of studies the sighted students were more creative in
comparison to visually handicapped students. Whereas, a few studies
concluded that there is no significant difference between the handicapped and
sighted students on creativity. The reviewed literature shows that creativity
influences self-esteem. The studies concluded creativity develops self-esteem.
A number of studies assessed the effect of sex on creativity. Amongst them
some studies found that gender did not significantly influence creative
thinking. While other studies show that boys are much more creative than
girls. A few studies found opposite result. Existing literature compare the
academic achievement of visually handicapped and sighted students. Several
studies found that visually handicapped students were academically better
than sighted students. Visual status has no main effect on academic
achievement. Some studies revealed the result that sighted students do
academically better than visually handicapped students. A number of studies
indicated significant relationship between self-esteem and academic
achievement. A few studies depicted that there is no significant correlation
between self-esteem and academic achievement.
Many researchers found similar self-concept profile for sighted
adolescents and adolescents with visual impairment. Whereas a few studies
concluded that visually handicapped students scored high on self-concept than
sighted students. Various scholars examined gender differences in global self-
esteem and concluded that male scored high on self-esteem than female.
Reviewed studies showed that visually handicapped were less emotionally
stable than sighted students. Many scholars concluded in their studies that
male students are more emotionally stable than female students.
Chapter III incorporated the method and procedure opted for
investigation. The study was conducted on 200 students. Of these, 100 were
visually handicapped and 100 were sighted students. For measuring academic
achievement, the researcher had used the annual examination marks of the
students obtained from the office records of the institution. The creative
experience of students is measured by ratings of their concerned teachers on a
five-point scale. Self-esteem of students is measured through Self-Esteem
Inventory, developed by M.S Prasad and G.P. Thakur (1977). Emotional
stability of children is measured through Emotional Stability Test for
Children, developed by A. Sengupta and A. K. Singh (1985). In the present
study, researcher had used SPSS 15.0 package for undertaking Regression
analysis, t-test and Correlation of coefficient.
Chapter IV and V is devoted to result and discussion. The results
conclude that creative experience has no influence on self-esteem. Some
earlier studies support this finding. They found no significant relationship
between creativity and self-esteem. On the other hand several studies found
positive relationship between self-esteem and creativity.
Results also showed that academic achievement did not emerge as
significant predictor of self-esteem of visually handicapped students. Sighted
students' academic achievement predicts their self-esteem. A number of
studies supported the findings that academic achievement is a significant
predictor of self-esteem. These studies also concluded that there is
continuous interaction between self-esteem and academic achievement.
Results also conclude that creative experience is not a significant predictor of
emotional stability. There have been many researcher found in their study that
creative individual are less emotionally stable, more intellectually self-
sufficient and more radical. But on the other side some researcher found
creativity to be much more associated with emotional stability.
A result also shows that academic achievement has no significant
contribution in explaining emotional stability. Some scholars concluded in
their studies. Some scholars concluded in their studies that general
intelligence, big five personality traits and construct work drive in relation to
two measures of collegiate academic performance a single course grade, and
self-reported grade point average. Emotional stability was significantly
related to course grade but not with grade point average.
Table shows that there is no significant difference between the mean
scores of visually handicapped and sighted students on creative experience.
Some studies support this finding. Studies conducted on divergent thinking
found that blind and sighted did not differ on divergent thinking. Significant
difference found between the mean scores of visually handicapped and
sighted students on different other studies. These studies conclude that sighted
students scored significantly high mean score on academic achievement than
visually handicapped students. A few studies compared academic
achievement of sighted and visually handicapped students. They found no
main effect of visual status on academic achievement.
Result also shows there is no significant difference between the
mean scores of visually handicapped and sighed students on self-esteem.
Some researcher investigated the self-concept of students with and without
visual impairment. They found no significant difference between the self-
concept of visually impaired and sighted students. Other studies suggested
that young people with visual impairment, including with low vision has a
lower self-concept in several dimensions than their peers without impairment.
Result also shows no significant differences between the mean scores of
visually handicapped and sighted students on emotional stability. Studies
found that blind children possess the same personality characteristics as that
of the sighted one.
In the light of the research experience it is suggested that further
research is required for assessing other factors which influence academic
achievement of visually challenged students. Personality of blind and normal
children can be studied in more detail by taking a large sample to draw more
fruitful generalization.
CREATIVE EXPERIENCE AND ACADEMIC ACHIEVEMENT AS DETERMINANTS OF SELF-ESTEEM AND EMOTIONAL
STABILITY OF VISUALLY HANDICAPPED STUDENTS
THESIS SUBMITTED FOR THE AWARD OF THE DEGREE OF
Boctor of $t|ilo£(opI)p IN
PSYCHOLOGY
BY
MAJDA TARANNUM
Under the Supervision of
DR. NAIMA K. GULREZ (Reader)
DEPARTMENT OF PSYCHOLOGY ALIGARH MUSLIM UNIVERSITY
ALIGARH (INDIA)
2008

T7565

Dr. Naima K. Gulrez ^^^^k DEPARTMENT OF PSYCHOLOGY Reader P^^W^\ Aligarh Muslim jUniversity
Aligarh-202002, U.P, India PHONES: InterlialOff. 1580, 1581
Dated:. 30:±Al
CERTIFICATE
This is to certify that the thesis entitled 'Creative ^Experience and
Jlcademic Achievement as (Determinants of Self-esteem aMf(EmotitmafSta6iBty of
1'Hsualfy yfamdcappedStudlmts^', by !Majda Tdrannum is an original piece of
work and has been carried out under my supervision. The Ph.D. thesis is
suitable for submission to the examiners for evaluation. She has
completed the required attendance as per the university rules.
Dr. Naima K. Gulrez (Reader) Department of Psychology Aligarh Muslim University Aligarh
ACKNOWLEDQEMENT
First of all, I am grateful to Allah the most beneficent and
merciful, whose benign benediction gave me the required zeal for the
completion of this work.
I express my deep sense of gratitude to Dr. Naima K. Gulrez,
my supervisor for her invaluable guidance which helped me in
accomplishing this task. She inculcated genuine interest in me to make
this study a worthwhile attempt. Her keen interest, fruitful advices
and painstaking involvement throughout the course of this
investigation inspired me to take up this assignment with
commitment.
I extend my gratefulness to Dr. Romana Siddique Lecturer in
Psychology, for providing all possible help for the statistical analyses
of the data. I would like to thank Prof. Hamida Ahmed, Department of
Psychology, for her valuable suggestions from the very beginning till
the accomplishment of the work.
I am also thankful to Dr. Mahmood S. Khan Chairman,
Department of Psychology, for providing me all support. Thanks are
due to all the teachers and colleagues of the department who
encouraged me throughout.
I am indebted to my parents whose continuous prayers,
sacrifices, encouragement and inclination towards higher education
have pushed me to this stage to accomplish the task. I owe special
thanks to my brothers Mr. Abdul Rashid, Mr. Abdul Aziz, and Mr.
Abdul Matin for their financial and emotional support. My sisters Ms.
Wajda Tabassum and Ms. Sajda Taraimum deserve special thanks for
their love, care and support throughout the completion of the task.
With a deep sense of gratitude, I acknowledge my friend Ms.
Sabahat for her suggestions, fruitful discussions and support. Her
constant love, care and cooperation helped me in completing the task.
She was a great solace to me throughout.
I wish to acknowledge all my friends, Ms. Sultana, Ms. Shagufta,
Ms. Deeba, Ms. Afifa, Ms. Naseem, Ms. Sharia, Mr. Naim and Mr.
Moin for their encouragement and cooperation. I offer profound
gratitude to all my well wishers and my respondents for their help and
support.
Last but not the least I am thankful to Mr. Tajuddin, Mr.
Sharique and Mr. Majaz for their help.
M^DA TARANNUM
Contents
Page Nos.
Certificate
Acknowledgement
List of Tables
Chapter - 1
Introduction
Chapter - II
Review of Literature
Chapter - III
Method
Chapter - IV
Results
Chapter - V
Discussion
Chapter - VI
Summary
References
Appendices
Appendix - 1 Demographic Information Sheet
Appendix - II Creative Experience Rating Scale
Appendix - III Self-Esteem Inventory
Appendix - IV Emotional Stability Test for Children
i-u
iii-v
1-32
33-84
85-93
94-120
121-144
145-155
156-190
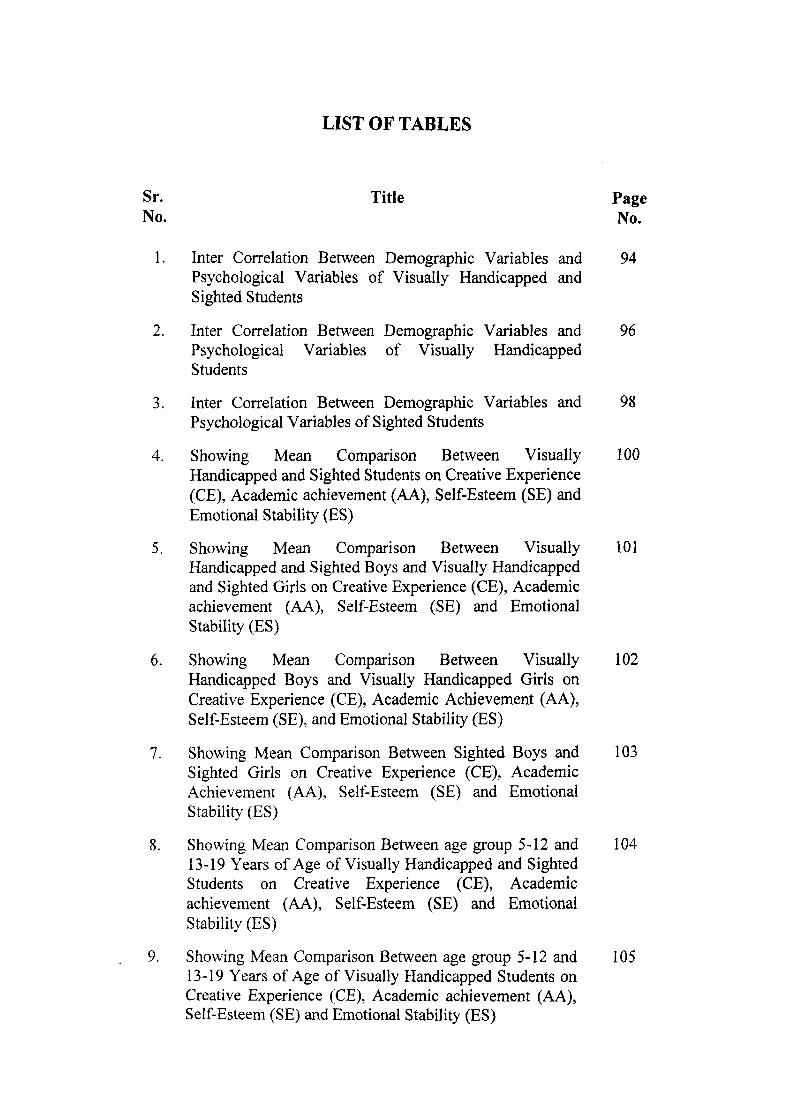
LIST OF TABLES
Sr. Title Page No. No.
1. Inter Correlation Between Demographic Variables and 94 Psychological Variables of Visually Handicapped and Sighted Students
2. Inter Correlation Between Demographic Variables and 96 Psychological Variables of Visually Handicapped Students
3. Inter Correlation Between Demographic Variables and 98 Psychological Variables of Sighted Students
4. Showing Mean Comparison Between Visually 100 Handicapped and Sighted Students on Creative Experience (CE), Academic achievement (AA), Self-Esteem (SE) and Emotional Stability (ES)
5. Showing Mean Comparison Between Visually 101 Handicapped and Sighted Boys and Visually Handicapped and Sighted Girls on Creative Experience (CE), Academic achievement (AA), Self-Esteem (SE) and Emotional Stability (ES)
6. Showing Mean Comparison Between Visually 102 Handicapped Boys and Visually Handicapped Girls on Creative Experience (CE), Academic Achievement (AA), Self-Esteem (SE), and Emotional Stability (ES)
7. Showing Mean Comparison Between Sighted Boys and 103 Sighted Girls on Creative Experience (CE), Academic Achievement (AA), Self-Esteem (SE) and Emotional Stability (ES)
8. Showing Mean Comparison Between age group 5-12 and 104 13-19 Years of Age of Visually Handicapped and Sighted Students on Creative Experience (CE), Academic achievement (AA), Self-Esteem (SE) and Emotional Stability (ES)
9. Showing Mean Comparison Between age group 5-12 and 105 13-19 Years of Age of Visually Handicapped Students on Creative Experience (CE), Academic achievement (AA), Self-Esteem (SE) and Emotional Stability (ES)
IV
10. Showing Mean comparison Between age group 5-12 and 106 13-19. Years of Age of Sighted Students on Creative Experience (CE), Academic achievement (AA), Self-Esteem (SE) and Emotional Stability (ES)
11. Showing Mean Comparison Between Visually 107 Handicapped and Sighted Students of Joint and Nuclear Family System on Creative Experience (CE), Academic achievement (AA), Self-Esteem (SE) and Emotional Stability (ES)
12. Showing Mean Comparison Between Visually 108 Handicapped Students of Joint and Nuclear Family System on Creative Experience (CE), Academic achievement (AA), Self-Esteem (SE) and Emotional Stability (ES).
13. Showing Mean Comparison Between Sighted Students of 109 Joint and Nuclear Family System on Creative Experience (CE), Academic achievement (AA), Self-Esteem (SE) and Emotional Stability (ES)
14. Showing Mean Comparison Between Visually 110 Handicapped and Sighted Student of Urban and Rural Area on Creative Experience (CE), Academic achievement (AA), Self-Esteem (SE) and Emotional Stability (ES).
15. Showing Mean Comparison Between Visually 111 Handicapped Student of Urban and Rural Area on Creative Experience (CE), Academic achievement (AA), Self-Esteem (SE) and Emotional Stability (ES)
16. Showing Mean Comparison Between Sighted Student of 112 Urban and Rural Area on Creative Experience (CE), Academic achievement (AA), Self-Esteem (SE) and Emotional Stability (ES)
17. Self-Esteem Regressed on Creative Experience (CE) and 113 Academic Achievement (AA) of Visually Handicapped Students and Sighted Students
18. Self-Esteem Regressed on Creative Experience (CE) and 113 Academic Achievement (AA) of Visually Handicapped Students
19. Self-Esteem Regressed on Creative Experience (CE) and 114 Academic Achievement (AA) of Sighted Students
20. Emotional Stability Regressed on Creative Experience 114 (CE) and Academic Achievement (AA) of Visually Handicapped and Sighted Students
21. Emotional Stability Regressed on Creative Experience 115 (CE) and Academic Achievement (AA) of Visually Handicapped Students
22. Emotional Stability Regressed on Creative Experience 115 (CE) and Academic Achievement (AA) of Sighted Students
23. Self-Esteem Regressed on Gender, Age, Family System 116 (FS) and Area of Living (AL) of Visually Handicapped and Sighted Students
24. Self-Esteem Regressed on Gender, Age, Family System 117 (FS) and Area of Living (AL) of Visually Handicapped Students
25. Self-Esteem Regressed on Gender, Age, Family System 117 (FS) and Area of Living (AL) of Sighted Students
26. Emotional Stability Regressed on Gender, Age, Family 118 System (FS) and Area of Living (AL) of Visually Handicapped and Sighted Students
27. Emotional Stability Regressed on Gender, Age, Family 119 System (FS) and Area of Living (AL) of Visually Handicapped Students
28. Emotional Stability Regressed on Gender, Age, Family 119 System (FS) and Area of Living (AL) of Sighted Students

c PTER-1
IlTEODUCTlOl
In the past, handicapped children were generally excluded from the
purview of nominal experience. They have been treated as defective beings
and believed that these children will not profit from regular schools and their
facilities. The handicapped were viewed as the dregs in society or as awful
persons who were prevented their participation in the activities necessary for
survival. The handicapped students' way of thinking is greatly influenced by
the mind-set and opinion of others, especially the family, the few school
personnel and the peers with whom they interact. The attitude handicapped
students hold to themselves can affect their social, psychological, emotional
and academic growth and ultimately their functioning in society.
In the early nineteenth century, as the idea of democracy, individual
freedom and egalitarianism swept in west, and advancement in learning
theory and technology contributed to the emergence of optimistic attitude
towards handicapped pupils. UNESCO envisaged the most positive response
to this section of population in the year 1946. The Wamock committee (1978)
reviewed a report on the educational provisions for the handicapped children
and youth in England under the Act of Education for all handicapped children
(U.S. Public Law, 94-142). These are the milestones in the care, welfare and
education of the handicapped children.
In India educational provisions for handicapped children has become a
priority as a result of the National Policy on Education 1986. This Policy
came into existence just before the International Year for disabled persons
1987 and during the period of 1983-92, which is declared as the World
Decade of Disabled Persons by UN General Assembly. The National Policy
with its commencement possessed almost all the favourable ethos. All these
attempts brought the galore of publicity on the needs of the blind in the world
and in India as well.
Estimates of the number of disabled vary greatly, depending on the
definitions, the source, the methodology and the extent of use of scientific
instruments in identifying and measuring the degree of visual disability. In
2002 there were 161 million visually impaired people in the world, of whom
124 million had low vision and 37 million were blind (10 revision of
International Statistical Classification of Diseases, 2004). In India the need
for the study of blind children arises fi"om the fact that almost one-third of the
world's blind reside over here. A blind person in India lives under a curse. He
or she is a burden on the family and is either abandoned or allowed to waste
away. The disabled population in India is approximately over 90 million, of
these 40.5 million are visually handicap in which 12 million are blind and
28.5 million are with low vision. Hence, blindness is a severe handicap.
Blindness has a definite and distinctive effect upon the development of the
individual's personality because at least 75 to 80 percent of all impression that
the sighted ones get are registered through the sense of sight. Visually
handicapped children suffer in a number of ways in which affectionate
deprivation is the most acute and all pervasive. Affectionate deprivation
comprises of unsympathetic behaviour, less attention, insecurity and
maladjustment, aggression and several other problems.
Handicap is generally the repercussions of impairment and disability.
An individual does not easily recognize impairments until they obstruct in the
performance of ones daily activities. Impairment refers to any loss or
abnormality of psychological, physiological or anatomical structure or
function, for example the loss of a little finger is impairment. On the other
hand disability means any restriction or lack (resuhing from impairment) of
ability to perform an activity in the manner, a normal person does. Disability
is a functional inability of an individual as a result of impairment. But it does
not always be a consequence of impairment. For example, a person who has
lost his/her little finger (impairment) may not be experiencing any disability
when compare to another individual who has lost his/her upper limbs.
Handicap is the result or the consequence of impairment as well as disability.
It is the manifest limitation that prevents fulfilment of the social role expected
for the age, sex, or cultural background of an individual (WHO, 1980). A
person may lose a limb and still not face any impediments at ones job. Thus,
he/she is physically impaired but not handicapped. The concept of handicap is
subjective, situational and a matter of social perception. Hence, we can say
that a person with disability may or may not be handicapped, and a person
who is handicapped may or may not have a disability.
A handicapped person is the one who is challenged by emotional,
physical, mental, and social or age hurdles. Handicap is an inability that
leaves one at a comparative disadvantage. So conceived, a handicap is a
special case of inability. In other words, we can say it is a barrier imposed by
society, the environment, or the attitudes that prevent a person with a
disability from performing a role, which is normal for that particular person.
Different psychologists and organizations have given various
definitions of handicap.
English and English (1958) defined handicap in term of reduced
"aptitude" in performing the ordinary tasks of life or a particular vocation,
thus distinguishing a handicap from crippling condition which they associate
with inabihty to perform a certain Icind of task. Their distinction (which they
correctly state is not always observed) is in the same direction as ours but
somewhat less comprehensive.
Whitten (1974) described handicapped person as "one who has severe
physical or mental disability which seriously limits his functional capacities
(mobility, communication, self- care, self-direction, work tolerance or work
skills) in term of employability".
Thompson (1974) defined handicapped children as "one who, because
of his physical, mental or emotional problems or a combination of such
problems; needs educational, social, psychological and medical services
beyond those which have been offered traditional programmes, to minimize
his full potential for useful and meaningful participation in society and for
self-fulfilment".
According to the United Nations Standard Rules on the Equalization of
Opportunities for Persons with Disabilities (1994), the term handicap means,
"The loss or limitations of opportunities to take part in the life of the
community on an equal level with others. It describes the encounter between
the person with a disability and the environment. The purpose of this term is
to emphasize the focus on the shortcomings in the environment and in many
organized activities in society, for example, information communication and
education, which prevent persons with disabilities from participating on equal
terms". Handicap is therefore, a function of the relationship between handicap
person and his/her environment. It occurs when they encounter cultural,
physical, or social barriers that prevent them to take part in the life of
community on an equal level with others.
According to WHO (1976), "A handicap is a disadvantage for a given
individual, resulting from impairment or disability, that limits or prevents the
fulfilment of a role that is considered normal depending on age, sex, social
and cultural factors for that individual". The roles so defined must be
universal and include the capacities to position oneself within one's
environment and respond to environmental stimuli. It is for an independent
existence in a normal fashion according to sex, age and culture to maintain
social relationships, and preserve self-sufficiency. Thus, handicap is a result
of health condition and is related to factors such as individual resources and
the collective environment. It is made up of situations that put individuals at a
disadvantage from the perspective of societal norms.
Various types of handicap occur in human beings that impede them in
their societal activities. They are the foUowing-
1. Physical / Loco motor handicaps
2. Visual handicaps
3. Hearing handicap
4. Mental handicaps
5. Learning handicaps
6. Multiple handicaps.
Visual Handicap
Individual whose normal learning and development is impaired by
visual conditions and who therefore, need specific conditions and related
services in order to develop their abilities can be identified as visually
handicapped (Whitmore, 1981). American Foundation for the Blind (1961)
has given two sets of definition of visually handicapped. The first one is based
on the concept of measurably diminished vision and the second one is based
on educational needs, which draw distinction between children with visual
handicap into categories of a blind and partially sighted. Apparently these two
definitions are interconnected. For educators the second definition which
focussing on educational needs is preferred because it explains the
characteristics that are useful in determining suitable programming (Whitmer
«& Maker, 1985).
The Census of India (2001) defines visually disable as "a person who
cannot see at all or has blurred vision even with the help of spectacles. A
person with proper vision in one eye will also be treated as visually disabled.
A person may have blurred vision and had no occasion to test whether his or
her eye sight would improve by using spectacles would be treated as visually
disabled".
On the other hand, National Sample Survey Organization (2002)
defines visually disabled person as the "loss or lack of ability to execute tasks
requiring adequate visual acuity. Visual disabled include (a) those who did
not have any light perception-both eyes taken together and (b) those who had
light perception but could not correctly count the fingers of hand (with
spectacles/contact lenses if he/she used spectacles/contact lenses) from a
distance of 3 meters in good day light with both eyes open. Night blindness
was not considered as visual disability".
Visual handicap includes-
• Partially sighted
• Low vision
• Legally blind
• Totally blind
Partially Sighted
One, who after the best possible adjustments and ocular corrections
uses remaining vision for learning is called partially sighted. Partially sighted
person has visual acuity of 20/70 or less after best possible correction. It
means that a person with normal 20/20 vision will correctly identify an object
from 200 feet, while partially sighted person will need to be as close as 70
feet to identify the same object. In educational context, the term partially
sightedness is generally used to explain a visual impairment that requires
special educational services. The partially sighted students face the challenge
of disability in much the similar as a totally blind student. Accommodations
for partially sighted students include the use of readers, audio taped text, and
raised line drawings. They may be able to use large print books and a closed
circuit TV or other magnifying device.
Low Vision
WHO consultation has suggested "a person with low vision is one who
has impairment of visual functioning even after treatment and/or refractive
correction, and has a visual acuity of less than 6/18 to light perception, or a
visual field of less than 10 from the point of view of fixation, but who uses, or
is potentially able to use, vision for the planning and/or execution of task".
The term low vision used to describe several levels of very limited sight,
which interfere with a person's daily routine activities. Low vision applies to
all individuals with sight who are unable to read the newspaper at a normal
viewing distance, even with the aid of eyeglasses, or contact lenses. However,
a person with low vision may benefit from any of a variety of available
optical devices, such as electronic magnifying glasses or eyeglass mounted
telescope, special software developed for computer users with low vision,
which can display type in large size or read text aloud.
Legal Blindness
In order to decide, which people may require special education and
assistance because of their visual disabilities, various governmental
jurisdictions developed more complex definitions referred to as legal
blindness. According to Rehabilitation Services Administration U.S., "legal
blindness refers to central visual acuity 20/200 or less in the better eye with
best correction or widest diameter of visual field subtending on angle of no
greater than 20 degree". By this definition, we can conclude that a legally
blind person would have to stand 20 feet from an object to see it with the
same degree of clarity as a normally sighted person could firom 200 feet.
Total Blindness
Total blindness refers to the complete lack of form and light perception
and is clinically recorded as "NLP", an abbreviation for No Light Perception.
Total blindness is the inability to distinguish light from dark. A person
suffering from total blindness needs Braille, raised-line drawings, audio
recordings, and/or other non-visual media as an accommodation for accessing
the content of visually presented materials (National Dissemination Centre for
Children with Disability).
Causes of Visual Impairment
Blindness can be resulted due to many causes. It may be an outcome of
environmental factors that acted before, during or after birth, or it may be a
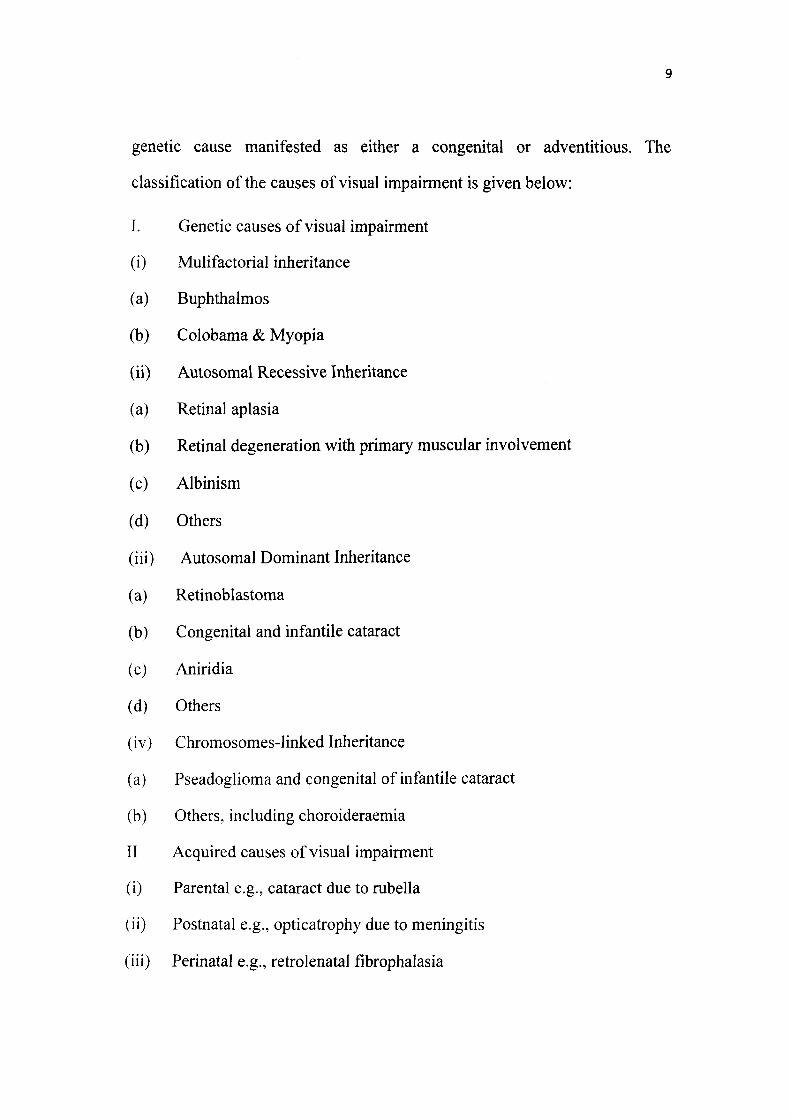
genetic cause manifested as either a congenital or adventitious. The
classification of the causes of visual impairment is given below:
I. Genetic causes of visual impairment
(i) Mulifactorial inheritance
(a) Buphthalmos
(b) Colobama & Myopia
(ii) Autosomal Recessive Inheritance
(a) Retinal aplasia
(b) Retinal degeneration with primary muscular involvement
(c) Albinism
(d) Others
(iii) Autosomal Dominant Inheritance
(a) Retinoblastoma
(b) Congenital and infantile cataract
(c) Aniridia
(d) Others
(iv) Chromosomes-linked Inheritance
(a) Pseadoglioma and congenital of infantile cataract
(b) Others, including choroideraemia
II Acquired causes of visual impairment
(i) Parental e.g., cataract due to rubella
(ii) Postnatal e.g., opticatrophy due to meningitis
(iii) Perinatal e.g., retrolenatal fibrophalasia
10
Psychological and Behavioural Characteristics of Blind Children
The blind are in minority in the world. They differ in their
characteristics, requirements, achievements and behaviours from those of the
sighted. All these characteristics assign the sighted a leading position in social
situation. The blind deal of speculation exists regarding the characteristics of
the blind. Mental potentialities were supposed to be normal in this medical
anomaly. Several people believe that blindness is a handicap not only because
it decreases mobility, but also it is accompanied by the lack of initiative and
spontaneity. Mickell (1953) observed that the blind pre-school child has its
own unique pattern of growth. It takes longer for him to progress in walking,
talking and also in motor coordination, as the typical eye-hand coordination in
his case has been substitute by ear-hand coordination.
The blind children show various problems in case of behaviour,
learning, placement and social adjustment. Some children suffer from other
sensory difficulties. The objects of learning are also sometimes too large or
not easily accessible for them in order to enable them to touch, taste, smell, or
listen to them. Like any other physically challenged children, the visually
handicapped children also vary with respect to creativity. This may be
attributed to several factors.
Since the beginning of civilization, man has experienced the greatest
pleasure and bliss by adopting creative values in his life. Creative imagination
of man has played an immensely important role in the development of
society. It is essential for leading a happy life. In addition, the future of our
civilization depends upon the quality of the creative imagination of the next
generation. In teaching, all students should be provided with opportunities for
11
creative expression so that they turned into contended, balanced and happy
citizens (Torrance, 1962).
Torrance (1965) further outlines, "Creative thinking is indeed a
powerful force. It has given us the alphabet, printing, radio, television,
computers, spacecraft, great art, architecture, music and literature. It has given
us our great advances in scientific discovery and medicine. It has also given
us war plunder, crime and smashed atom".
Creativity is essentially a human phenomenon. It is a process in man,
which helps him to achieve dignity and meaning in life. Bruner (1962) argues
that the creative act may bring man to a new dignity. Toynbee (1964)
considers creativity as man greatest asset. Creativity is an innate and the most
valued human quality that can never be overlooked. It is an intuitive genius
present in human as a distinct potential, unique gift, which is spontaneous, but
not common amongst all the individuals. Creativity, with its many definitions
has been known for a long time to have its influence on human activity in
almost all spheres-scientific, technical, literature, and artistic.
Taylor (1964) realized that "creative acts affect enormously not only
scientific progress, but society in general. Those nations who learn best in
their people may find themselves in very advantageous positions". It can also
be said that it is the creativity that has made life so easy and luxurious .The
progress and potential of a country is measured in terms of its great thinkers,
artists and scientists etc. So the importance of creativity is something that
cannot be ignored.
The concept of creativity has a wide range. The way in which different
societies have understood the concept of creativity has changed throughout
12
history. Tatarkiewics (1980) in his book 'History of Six Ideas' presents a
historical survey of the term creativity.
The ancient Greeks believed that the muses were the source of all
inspiration; in reality has no similar term "to create" or "creator". The
expression "poiein" (to make) sufficed. The sole exception was poetry to the
Greek view. The poet was seen as making new things -bringing to life new
world-while the artist only imitate. In Rome these Greek views was modified,
and Horace wrote that not only poets but also painters were entitled to the
freedom of daring whatever they wished. Unlike Greek, Latin had a term for
"creating" ("creatio") and for "creator", and had two expressions for "to
make"-"facere" and "creare".
An essential change comes in the Christian period: "creatio" came to
designate God's act of "creation from nothing". "Creatio" thus took on a
different meaning than "facere" ("to make"), and ceased to apply to human
functions. The ancient view that art is not a domain of creativity persisted in
this period. Another shift occurred in more modem times. Renaissance men
had a sense of their own independence, freedom and creativity, and sought to
give voice to this sense of independence and creativity. Baltasar Gracian
(1601-1958) wrote, "Art is the completion of nature, as it were a second
creator..." By the IS"' Century and the Age of Enlightenment, the concept of
creativity was appearing more often in art theory, and was linked with the
concept of imagination.
In the 19" century only art was regarded as creativity. At the turn of
the 20 century, there began to be discussion of creativity in the science and
in nature. The formal starting point of the scientific study of creativity is
13
sometimes considered to be Guilford's address to the American psychological
association in 1950, which helped to popularize the topic. Since then the
researchers from a variety of fields have studied the nature of creativity from
a scientific point of view.
Creativity is a highly complex cognitive ability that involves the
generation of new concept or ideas, or new associations between existing
concepts or ideas. Scientifically, the products of creative thought are usually
considered to have both originality and appropriateness. In other words, the
ability to make something original, to imagine things that do not exist, and to
come up with new ideas is called creativity. Creativity can make common
things special and special things common! Creativity is essentially a form of
problem solving that involves problems for which there are no easy answers:
that is problem for which popular or conventional responses do not work.
Apart from above discussed concepts the true nature of creativity has
not been fully understood as yet. Its nature is so complex that it still remains
shrouded in mystery. On the whole, it has been noted that creativity as a
concept is not easy to be defined. Various popular as well as highly technical
definitions have been put forward in support of the nature of creativity.
Fromm (1959) stated two broad meanings of creativity. First, it refers
to the production of something novel and fijrther it may refer to the attitude
which may persist even when nothing new created. Oldham and Cummings
(1996) defined creativity as usefial novelty-not novelty for its own sake, but
novelty that can be applied and add value to organization's products and
services. Weisberg (1986) proposed that creativity is the novel use of tools to
solve problems or novel problem solving.
14
Brunnelle (1970) has viewed creativity as a process through which
some novel ideas or an object is produced in a new fashion or arrangement. In
the absence of this process there cannot be any product and ultimately no
creativity. Kunt (1982) has also regarded creativity as consisting of various
processes like framing, probing, exploring, affirming and realizing. Wallas
(1926) has also considered creativity as a process leading to some new idea or
object.
Goldner (1962) has explained that creativity is an organized
comprehensive activity of brain toward an original outcome. So, it is an
innovative and not a reproductive activity. Mendick (1964) considered
creative thinking in the light of framing new combination of associative
elements, which either meet specified requirement or is found to be useful in
some way. The more mutual remote elements of the new combination, the
more creative is the process. But according to Barron (1961) creativity does
not simply mean exploration, invention, or discovery of some new things or
relations rather it refers to making new combinations out of existing objects
and elements.
Celye (1962) recognized one more dimension of creativity and states
that it leads to generation of new interpretations. These interpretations
emphasize that creativity involves the combination of old ideas or products
into new forms, but the old extends the base for new ideas. Guilford (1968)
considered creativity as a scientific kind of thinking and labelled it as
divergent thinking. Divergent thinking makes deviation from the common and
obvious thought and action. It helps an individual in examining various
possible solutions to a problem and not centring around single correct
15
solution. Divergent thinking enables the individual to be more flexible and
fluent, involving richer flow of ideas and resulting in some novel and creative
solution. In convergent thinking the person follows the prevailing mode of
thought, information and action to arrive at one right answer that could be
attain by other individual also.
Getzels and Jackson (1962) have also considered creativity as a
specific type of cognitive ability, which has its reflexion in the performance
of the subjects on verbal test of creativity. Creativity, he claims, depends upon
novel and varied responses on the test. Torrance (1965) examined creativity
as a process through which a creative individual manifests sensitivity to the
problem, deficiencies, missing elements and irregularities. He is very much
anxious for the correct solution by way of formulating hypothesis about
deficiencies, testing and retesting in the light of various modifications and
ultimately achieves solution of the problem.
Sternberg (1999) explained creativity as the ability to produce work
that is both novel (i.e. original, unexpected) and appropriate (i.e., useful,
adaptive concerning task constraints). In his view creativity is the topic of
wide scope that is important at both individual and societal levels for a wide
range of task domains. At an individual level creativity is relevant, for
example, when one is solving problems on the job and in daily life. At a
societal level, creativity can lead to new scientific findings, new movements
in art, new inventions, and new social programs. Smith (2005) in his article
has mentioned Simon's view of creativity. Simon says "we judge thought to
be creative when it produces something that is both novel and interesting and
valuable".
16
Cassado and Simonton (2003) explained the nature of creativity and
said that the creativity entails three essential and product-focused criteria:
novelty, adaptiveness or appropriateness to the problem at hand, and
completeness. Pesut (1990) presented a model that conceptualizes creative
thinking as a self-regulatory process in which creative technologies are
reframed as meta cognitive strategies. The model has heuristic value for those
interested in the dynamics of self-regulated creative thought, which is viewed
as a function of attention/awareness deployment. Plucker, Beghetto and Dow
(2004) said that the construct of creativity has a great deal to offer educational
psychology. Creativity appears to be an important component of problem
solving and other cognitive abilities, healthy social and emotional wellbeing
and scholastic and adult success.
Vygotsky (1990) distinguished between two forms of the inner world
or construction of the mind, one is reproductive, which is closely connected
with memory, and the second is the combinatory or creative which is related
to the ability to deal with change and the creation of new forms or activity. At
an early age children's creative processes are expressed in their play.
Psychological analysis reveals that creative combining (a) slowly develops in
to more complex forms at each age level of childhood and (b) does not appear
but itself in the behaviour of the child but emerges through other forms of
activity and through accumulation of experience.
Mumford, Olsen and James (1989) studied the influence of age on
creativity and argue that the creation of new understandings is most likely to
occur in the earlier phases of people's careers. Daccy (1989) examined the
evidence in support of the theory that there are certain critical periods in life
17
during which creative ability can be cultivated most effectively. These six
periods are 0-5yrs, 10-14 yrs, 18-20 yrs, 28-30 yrs, 40-45 yrs and 60-65 yrs.
EI-Murad and West (2004) mentioned that creativity is arguably the most
important element in advertising success.
Plucker (2004) focussed on a question that whether creativity is
content general or content specific is one of the most controversial issues in
contemporary creativity research. Recent studies provide support for both
positions, but the results of these investigations may be influenced by several
factors, including the presence of a method affect. This study investigates the
method effect by analyzing quantity of creative achievement simultaneously
using structural equation modelling.
Kurtzberg (2005) explored objectivity measured creative fluency and
subjectively perceived creativity in cognitive diverse team. Findings present
that creativity as a complex multidimensional construct and cognitive
diversity as an important predictor of both team emotions and outcomes.
Creativity, achievement and intelligence are sometimes used interchangeably
but achievement particularly academic achievement is actually the result of
intelligence and creativity.
During the past several decades, continual efforts have been made to
develop a feasible system of education. Education is the most important
instrument for human resource development. It is the key to national
prosperity and welfare. No investment is likely to yield greater returns than
the investment in human resources of which the education is the most
important part. Modern societies cannot attain their aim of economic growth
and higher cultural standards without making the effective use of the talents
18
of their citizens. This necessitates that education should be provided
according to capabilities and potentialities of the learners. Students with a
very wide variety of capabilities and potentialities seek admissions to the
schools. Our school should, therefore, offer diversity of educational
programmes suited to the varying aptitudes, interests and talents of the
students'. Through this we can improve academic achievement of students in
the class.
Academic achievement has great importance in the present socio
economic and cultural context. Obviously in schools great emphasis is placed
on formal education. The effectiveness of any educational system is gauged to
the extent of the student achievement whether be it in cognitive, affective or
psychomotor domain. Academic means the field of English, Foreign
Languages, History, Economics, Mathematics and Science. And the
achievement means accomplishing whatever goals one set for him/her self.
The concept of academic achievement refers to the achievement by the
individual, of objectives related to various types of knowledge and skills.
These objectives are socially established, based on the age, prior learning and
capacity of individuals with regard to education, socialization and
qualification. Studies conducted on academic achievement notably focus on
student progress and individual, institutional and organizational factors of
achievement, along with social relationship interactions that determine,
facilitate or hinder academic achievement. Academic achievement is related
to the acquisition of principles, generalization, capacity to perform efficiently
and certain manipulations of objects, symbols and ideas. Two types of
measurements are often used as indicators of academic achievement; these are
grades and standardized test scores.
19
According to Good (1973) academic achievement is the "knowledge
attained or skills developed in the school subjects, are usually designed by test
scores or by marks assigned by teachers or by both". Academic achievement
is the successful accomplishment or performance in particular subjects, areas,
or courses, usually by reasons of skills, hard work and interest typically
summarized in various types of grades, marks, scores or descriptive
commentary (Gene 1983).
Academic achievement can also be called as academic attainment,
academic performance, scholastic performance and academic aspiration.
Academic achievement can be defined as the combination of knowledge and
skills that a child acquires after a course of instructions and it can be
measured in term of marks obtained in a given area of knowledge.
According to Remmers and Gage (1955) scholastic achievement is the
degree to which the pupil has moved towards the objectives of the school.
From this definition it is clear that the academic performance measures the
extent to which individuals have acquired certain knowledge, skills, concepts
and abilifies as a result of instrucdons and training received at the school or
college. Verma and Upadhayay (1981) described academic achievement as
the attainment or the accomplishment of a student in some area or particular
branch of knowledge, after certain period of training.
Academic achievement means earning a grade point average of 3.0 or
more, based on a 4.0 grade point system, or the equivalent, based upon the
most recent cumulative grade point average. An assessment of Academic
achievement can also be done on the basis of the ability to perform well in
academic education. Superior academic achievement normally indicates a
20
grade point average of 3.5 or higher on the four-point scale or standing in the
upper 10% of the class.
Academic performance is defined as the percent of eligible (non-
exempt) public school students in grade 3 and 8 scoring at the satisfactory or
excellent level on curriculum-based assessments in six content areas: reading,
writing, language usage, mathematics, science and social studies. In other
words academic performance really means three things: the ability to study
and remember facts, being able to study effectively, and see how facts fits
together and form larger pattern of knowledge and being able to think for
oneself in relation to facts and thirdly being able to communicate knowledge
verbally or down on paper.
Students academic achievement can be influenced by his intelligence,
interest, aptitude, hard labour, method of learning, socio-economic status,
family inference, home environment, parental aspiration and reward,
personality characteristics, sex differences, quality of teaching, school
environment and peer influence (Peterson, 1984). Since self-esteem of an
individual is a sense of his or her worth and value, it may be determined by
one's creativity and achievement.
Over the past few decades, self-esteem has been the theme of
numerous conferences and the subject of many books. The topic has huge
exposure. Parents and teachers have been endlessly instructed about how
important it is to build a child's self-esteem. Self-esteem is a widely used
concept both in popular language and in psychology. It refers to an
individual's sense of his or her value or worth, or the extent to which a person
values, approves of, appreciates, prizes, or likes him or herself (Blascovich &
Tomaka, 1991).
21
The most broad and commonly cited definition of self-esteem in
psychology is Rosenberg's (1965) who explained it as a favourable or
unfavourable attitude toward the self Self-esteem is usually dealt with the
evaluative component of the self-concept, a broader representation of the self
that includes cognitive and behavioural aspects as well as evaluative or
affective ones (Blascovich & Tomaka, 1991). While the construct is most
often used to refer to a global sense of self-worth, narrower concepts such as
self-confidence or body-esteem are used to imply a sense of self-esteem in
more specific areas. It is also extensively assumed those self-esteem functions
as a trait; that is, it is stable across time within individuals. Self-esteem is an
extremely popular construct within psychology, and has been related to
virtually every other psychological concept or field, including personality
(e.g., shyness), behavioural (e.g., task performance), cognitive (e.g.,
attribution bias), and clinical concepts (e.g., anxiety and depression). While
some researchers have been particularly concerned with understanding the
nuances of the self-esteem construct, others have focussed on the adaptive and
self-protective functions of self-esteem (Blascovich & Tomaka, 1991).
Self-esteem is considered as one of the oldest concepts in Psychology.
American psychologist and philosopher William James first coined it in 1980.
The term self-esteem comes from a Greek word meaning "reverence for self.
Murk (1995) has described six major contributors of the development of the
concept of self-esteem.
William James (1890) was an American psychologist and the first
contributor of the development of self-esteem. He described self-esteem as an
affective phenomenon which lived as a feeling or an emotion. It is a dynamic
22
process affected by success and failures and thus opens to enhancement.
James observed a connection between self-esteem, values, success and
competence.
Another contributor to the development of the self-esteem was Robert
White (1963). He has given the psychodynamic approach to self-esteem. He
perceives self-esteem as a developmental phenomenon. Self-esteem develops
gradually being affected by and in turn effecting experience and behaviour.
Self-esteem has two sources: an internal source i.e., our own
accomplishments and external source i.e., affirmations from others. The
concept of competence is central to this approach.
Morris Rosenberg (1965) was another contributor to the development
of the concept of self-esteem. Rosenberg has given socio cultural approach to
self-esteem. He defined self-esteem as an attitude (either positive or negative)
that people have about themselves. He said that self-esteem is a product of the
influences of culture, society, family and interpersonal relationships. The
amount of self-esteem, an individual has in proportional to the degree to
which they positively measure up to a core set of self-values. Rosenberg
relates self-esteem to anxiety and depression. Feelings/beliefs of worthiness
about oneself are central to this approach.
Stanley Coopersmith (1967) was also a famous contributor to the
development of the concept of self-esteem. Coopersmith gives importance to
the behavioural perspective of self-esteem. He explains that self-esteem is an
attitude and expression of worthiness. Coopersmith includes success as well
as self worth as a sign of self-esteem. He sees self-esteem as a construct or
acquired trait, that is, an individual learns how worthy they are initially from
23
parents. This is reinforced others. The children model the respect and
worthiness of self that they see in their parents.
Nathaniel Branden (1969) gave a humanistic view of self-esteem. He
defined self-esteem as "the experience of being competent to cope with the
basic challenges of life and being worthy of happiness". According to him
self-esteem is dynamic in nature. It is related to our ability to live in such a
way as to honour our view of ourselves. He gives importance to competence,
sense of personal worth, self-confidence and self-respect. He says self-esteem
is a basic human need and lack of it has serious negative consequences like
suicide, anxiety, substance abuse and depression.
Seymour Epstein (1985) has given a cognitive experiential view to
self-esteem. He considered self-esteem as basic need of a person that
motivates him consciously and unconsciously. It is a consequence of an
individual's understanding of the world and others and how others related to
them.
Self-esteem has recently been defined by Silverstone (1992) as, "the
sense of contentment and self acceptance that stems from persons appraisal of
their own worth, significance, attractiveness, competence and ability to satisfy
their aspirations".
Bailey (2003) explained that self-esteem is a simplistic term for varied
and complex mental stages pertaining to how one views oneself. Pyszezynski
and Cox (2004) proposed that self-esteem derived from self-determined
standard of value may reduce defensiveness, closed-mindedness, and
indifference to others as well as promote personal growth, but they
acknowledge the daunting barriers to the attainment of such self-
determination is based on self-worth.
24
Brace, Gary and Emma (2004) defined self-esteem is a function of
multiple indexes of how a person stands in relation to those around him or
her. Self-esteem can also be defined as the collection of beliefs or feelings
that we have about ourselves, or our "self perceptions". How do we judge
ourselves influences our behaviours, motivations, and attitudes and affect our
emotional adjustment.
Self-esteem reflects the intrinsic beliefs in the self, i.e. the overall
opinion and value of a person-how a person honestly feels about and values
himselfherself. Possessing a healthy aptitude for good self-esteem involves
self-respect, self-acceptance and an appreciation of self-worth that embraces
both strengths and limitations. People with good self-esteem feel good about
themselves and see their selves as worthwhile. People with chronic self-
esteem give little value on their opinions and ideas and constanfly think that
they are not good enough.
Robins and Trzesniewiski (2005) explain the way self-esteem develops
across the life span. On an average, self-esteem is relatively high in
childhood, drops during adolescence (particularly for girls), and then declines
sharply in old age.
Self-esteem begins to develop in childhood, but it solidifies and gains
momentum during the trying years of adolescence. The teenage years tend to
be a crucial "make it or break it" period when it comes to self-esteem because
at this very moment the youngsters are searching for an identity. If this
process goes awry, the teen is likely to have negative feelings about the self,
leading to low self-esteem. Self-esteem fluctuates with child growth. It is
frequently changed and fine-tuned, because it is affected by child's
25
experiences and new perceptions. As child grows, he confronted with many
situations that affect his level of self-esteem. By these situations either he
develop high self-esteem or low self-esteem.
High self-esteem means that individuals appreciate their inherent worth
and themselves. It means persons with a positive attitude, evaluate themselves
highly, they are convinced of their abilities and they see themselves powerful
and competent-in control of their own lives and able to do what they want
(Smelser & Vasconcellos, 1989). Children with high self-esteem enjoy
interacting with others. They are comfortable in social setting and get pleasure
from group activities. They are able to work towards finding solutions when
challenges arise. Children with high self-esteem know their weaknesses, and
accept them. High self-esteem raises a sense of optimism that is very
important aspect of life. When someone has high level of self-esteem he/she
must be confident, happy and sure of oneself He/she will be highly motivated
and has the attitude to succeed. Self-esteem is therefore very crucial to one
and is a cornerstone of a positive attitude towards living.
Positive self-esteem is important because when people experience it,
they feel good and look good, they are effective and productive, and they
respond to other people and themselves in healthy, positive and growing
ways. People who have positive self-esteem know that they are lovable and
capable, and they care about themselves and other people. They do not have
to build themselves up by tearing other people down or by patronising less
competent people. The people with solid self-esteem are better equipped to
cope with troubles that arise in their careers or in their personal life. The
quicker they pick themselves up after a fall; the more energy they have to
26
begin anew. The higher the self-esteem, the more ambitious the people tend to
be, not necessarily in a career or financial sense, but in terms of what they
hope to experience in life-emotionally, romantically, intellectually,
creatively, and spiritually. The lower their self-esteem, the less they aspire to,
and the less they are likely to achieve.
Since the beginning of civilization, the low self-esteem syndrome has
been unintentionally passed fi-om parent to child, teacher to child, and
generation to generation. In recent times low self-esteem has been one of the
most popular and jfrequently invoked psychological explanations for
behavioural and social problems. The vast majority of society suffers firom the
emotionally crippling disease known as low self-esteem. Low self-esteem is a
lack of self-regard and admiration. Many persons who have low self-esteem
avoid seeking new jobs, initiating relationships, or learning new skills for fear
of negative response or failure. Several other persons avoid social settings and
refrain from sharing their views for the same reasons. Some isolate, become
people pleasers, and remain passive. Others get aggressive and cause chaos in
their relationships. The people with low self-esteem disrupt their lives to some
degree.
A child who has low self-esteem may not want to try new things. He
/she may frequently speak negative about his or her self They may exhibit a
low tolerance for frustration, giving up easily or waiting for somebody else to
take over. Children with low self-esteem tend to be overly critical of and
easily disappointed. Kids with low self-esteem see temporary setbacks as
permanent intolerable conditions. This propels a sense of pessimism which
predominates among those people who have low self-esteem. Common
27
elements of low self-esteem include: negative thoughts and beliefs about self,
devaluing of self-worth, poor opinion of self, self doubt and condemnation,
self criticism, propensity for depressive thinking and hopelessness and
distorted world view. Low self-esteem usually develops from early life
messages about being unacceptable in some way. This unacceptable attitude
of the surroundings becomes strengthen over time which develops a sense of
low self-worth.
There are some negative consequences of low self-esteem to ones life
style like,
• Insecurity about who they are and lack of belief in themselves.
• Inability to open oneself to others and inability to trust others.
• Inability to make decisions because of confusion and fear of making
mistakes or to disappoint others and
• Inability toward oneself for one's own goodness and accomplishment.
Everyone's self-esteem is influenced by many factors (Osbom, 1997).
Factors that constantly shape and influence our self-esteem include our own
thoughts and perception, other people, school experiences, sports experiences,
work experiences, illness, disability or injury, culture, religion and role and
status in society. Self-esteem is the product of two internal assessments or
judgements, the global judgement and one's self worth. The key to self-
esteem is that the amount of discrepancy between what a person desires and
what that person believes, he/she has achieved and the overall sense of
support that person feels from people around him/her (Rosenberg, 1965).
28
Hence self-esteem is very important for the individual's growth and
development. Importance of self-esteem can be considered from several
perspectives. First, it is important to normal psychological development. To
adequately cope with the challenges of growth and development, persons
need to believe that they have the capacity to achieve what they need and
want and they deserve of happiness and joy in life. Lacking a belief in either
of the above, they may be productive in an external sense, but are probably
less effective and creative. On the other hand if they possess high self-esteem
they may be more creative and effective. The effects of self-esteem may also
be seen in career planning and decision-making.
Registering for advanced placement classes or applying to a highly
competitive college may also challenge the self-esteem of an individual.
Many people can attest the experienced times when they were on top, when
they were at their "peak performance". These "peaks" in their performance
curve show that when people believe in them and believe that they can
achieve almost anything, they are expressing a self-esteem, which motivates,
excites and empowers them. Like self-esteem the emotional stability and the
personality pattern of an individual may be affected by his level of creativity
and academic achievement.
Emotions are as important in the life of an individual as life itself Life
would be colourless without emotions. The term emotions refer to feelings,
distinctive thoughts, psychological and biological states and range of
propensities to act (Goleman, 1995). Emotion is one of the dimensions of
personal experience. There are eight innate, primary emotions. They are joy,
anticipation, anger, disgust, sadness, surprise, fear and acceptance. A person
29
can be called emotionally stable if he/she is able to display his/her emotions
in appropriate degree with reasonable control.
Emotional stability is one of the effective determinants of the
personality patterns. It is helpful to control the growth of adolescent
development. Stable emotional behaviour at any level reflects the fruits of the
normal emotional development. An individual who is able to maintain his/her
emotions stable and under control even in extreme circumstances, might still
be emotionally stunned or be childish in his/her behaviour sometimes.
An emotionally stable individual has the capacity to withstand delay in
satisfaction of needs, capability to tolerate a reasonable amount of frustration,
belief in long term planning and is able of delaying or revising his/her
expectations in terms of demands of the situations. A child who is
emotionally stable has a capacity to make effective adjustments with
himself/herself, members of the family, relatives and his peers in the school,
society and culture. However, stability does not mean merely the capacity for
such attitudes and functions, but also the ability to enjoy them fully. A
number of characteristics like the capability of responding in gradation,
ability to delay responses, especially negative emotions, freedom from
unreasonable fears and the ability to commit mistakes without feeling
disgraced etc. are found in an emotionally stable individual.
Emotional stability is considered as one of the important aspect of
human life. Pupil must be able to control his or her emotions adequately and
also express them appropriately. It is the ability to be stable emotionally.
Emotional stability is the calm and peace in mind. In the state where a person
facing a difficult situation and conflict, but remain rational or able to control
30
ones anger or emotion it means that person is emotionally stable. Emotional
stability means one handle ones emotions well. If a person is doing a paper on
a topic he/she should focus on how to handle stress, anger, happiness, or any
other feelings that human have.
Pupil must be able to control his or her emotions adequately and also
express them appropriately. According to Smitson (1974) emotional stability
is the process in which the personality is continuously striving for greater
sense of emotional health, both intra-physically and intra-personally. Scott
(1968) opined that emotional stability is one of the seven important indicators
of superior mental health. It also affects the learning of the pupils. Emotional
control may impair performances in situations which require flexibility and
adaptability on the part of the person or pupil. If the pupils have no or very
little emotional control, it may lead to anxiety, feelings of inferiority and guilt
(Frandsen, 1961). It has also been found that if the pupils want to be mentally
healthy; these unhealthy feelings must be replaced by the feelings of self-
respect, security and confidence which can be achieved only after a good
sense of emotional stability emerges.
Emotional stability is a broad dimension of normal personality
characterized by confidence and poise, at the high end and by a tendency to
experience chronic negative emotions, at the low end. The construct is one of
the most widely used and important magnitudes of adult personality and plays
a central role in approximately every scheme of personality and in most
explanations of both normal and abnormal behaviour. Factor-pure adjective
for the negative pole of emotional stability are pinky, emotional,
oversensitive, jumpy, and sentimental. The factor-pure adjectives for the
31
corresponding positive pole of emotional stability are sober, imperturbable,
unshakeable, cool and resilient.
Emotional stability involves a person's ability to remain stable and
balanced. A person who has high emotional stability is even tempered, calm
secure and somewhat resistant to stress. A person who has low emotional
stability tends to be moody, anxious, depressed, insecure and very susceptible
to stress. In most professions, a person who has high emotional stability is
referred. Employees with low emotional stability are more likely to be
distracted from work by stress, deadlines, or situations in their personal lives,
whereas those with high levels of this trait are more able to control thek
emotions and feelings at work.
The big five personality traits classify person's personality in to the
categories of neuroticism, extroversion, agreeableness, consciousness and
openness to experience. In these big five personality traits neuroticism is one
of the most important traits. Neuroticism is the tendency to easily experience
negative feelings and unpleasant emotions such as anger anxiety depression or
vulnerability. There is an inverse relationship between neuroticism and
emotional stability. Individuals who are high on neuroticism are more likely
to experience negative feelings such as anxiety, anger, or depression and they
are also emotionally reactive. People who are emotionally stable are less
likely to experience negative feelings. They face difficult situations very
easily. They do not react poorly to environmental stress and they are more
likely to interpret threatening situations normally.
Research Objectives:
1. To find out whether creative experience and academic achievement
predict self-esteem of visually handicapped students.
32
2. To find out whether creative experience and academic achievement
predict emotional stability of visually handicapped students.
3. To find out whether creative experience and academic achievement
predict self-esteem of sighted students.
4. To find out whether creative experience and academic achievement
predict emotional stability of sighted students.
5. To find out whether visually handicapped students differ from sighted
students with respect to creative experience, academic achievement, self-
esteem and emotional stability.
6. To find out visually handicapped boys differ from visually handicapped
girls with respect to creative experience, academic achievement, self-
esteem and emotional stability.
7. To find out whether sighted boys and sighted giris differ with respect to
creative experience, academic achievement, self-esteem and emotional
stability.
8. To find out the relationship of creative experience, academic
achievement, self-esteem and emotional stability of visually
handicapped students.
9. To find out the relationship of creative experience, academic
achievement, self-esteem and emotional stability of sighted students.
Since the review of the related literature is a very important
requirement for the actual planning and execution of any research work, thus
every well planned research is preceded by a review of related literature. It
not only allows the researcher to acquaint with current knowledge in the field
or area in which she is going to conduct her study but explains the procedure
for organizing the related literature in a very systematic manner. It determines
the limits of one's field, and helps in suggesting the areas and scope for
further researches. This way the investigator is easily enabled to select the
variables relevant for her research work. In order to avoid international
duplication of well established findings, review of related literature
familiarizes the researcher with what is already known, what others have
attempted to find out and the knowledge about the recommendations of study,
and previous researches finally equips the researcher for the selection of the
variables related to the study. Thus, in this way it provides proper guidelines
for carrying out the investigation successfiilly by making the steps familiar to
the researcher. Keeping in view the great importance of the previous
researches the investigator has attempted to review the related research works
conducted to study one of the most neglected segment of society i.e. visually
handicapped students.
CREATIVE EXPERIENCE
A perusal of readily available literature on creativity the researcher
reviewed that in certain studies visually handicapped were more creative than
the sighted students. In a large number of studies the sighted students were
more creative in comparison to visually handicapped students. Whereas, a few
studies concluded that there is no significant difference between the
34
handicapped and sighted students on creativity. The reviewed literature
shows that creativity influences self-esteem. The studies concluded creativity
develops self-esteem. A number of studies assessed the effect of sex on
creativity. Amongst them some studies found that gender did not significantly
influence creative thinking. While other studies show that boys are much
more creative than girls. A few studies found opposite result.
Halpin, Halpin, and Torrance (1973) Compared scores of verbal
fluency, verbal flexibility, and verbal originality on the Torrance Tests of
Creative Thinking for 81 blind and 81 sighted 6-12 yr olds. Blind subjects
were more verbally fluent, flexible, and original. Scores did not vary
significantly by age, sex, or race. Brambring (2007) compared the average
ages at which four children with congenital blindness acquired 29 verbal
skills with given age norms for sighted children. The results indicated only
small developmental delays in the acquisition of verbal skills in the four
children, but a high degree of variability in developmental delays within and
across nine categories of verbal skills. Brambring (2007) compared the
average ages at which four children with congenital blindness acquired 32
fine motor skills with age norms for sighted children. The results indicated
that the children experienced extreme developmental delays in the acquisition
of manual skills and a high degree of variability in developmental delays
within and across six categories of fine-motor skills.
Kamila (1986) compared the creative thinking of blind and normal
children. The finding of the study revealed that the normal children tend to
score significantly higher than the blind children on all the three creative
abilities viz. fluency, flexibility and originality and creativity has positive
35
correlation with scholastic achievement. Siddique (1989) conducted a study
on creative potential of blind children in relation to their socio-economic
status. He found that: (i) Higher socio-economic status group was higher in
creative potential; (ii) Children coming from urban area have more creative
potential in comparison to children coming from rural area; (iii) Blind boys
were found much more creative than the blind girls; (iv) Highly creative blind
children belong to educated families while low creative children come from
uneducated families. Arora (2000) made a study of creative potential of
congenitally impaired children. For this purpose a sample of 50 congenitally
blind were selected. Findings revealed that congenitally blind children were
poor on creative potential. Boys of congenitally blind group are more superior
on creative potential and its component like fluency, flexibility and
originality.
Wyver and Markham (1999) compared the scores of 19 children with
severe congenital visual impairment (aged 4-12 yrs) and 82 children of same
age and gender with full vision on the alternate uses test for measurement of
divergent thinking. Results showed that there were no significant differences
in comparison of the mean scores of children with severe visual impairment
and students with jfuU vision. Madsen, Clifford and Darrow (1989) compared
scores of 32 sight-impaired students on the musical aptitude profile with their
performance on a test devised by Walker (1981) to pair visual imagery with
musical stimuli. Resuhs indicated that subjects mean scores on the musical
aptitude profile was almost identical to the composite mean for similar age
matched sighted students. Walker test yield a lower mean. Lister, Leach, and
Walsh (1989) examined the extent to which the development of conversation
concepts in 24 visually handicapped children is similar to that in 50 sighted
36
children. Results showed strong support for similarity in order of acquisition
of conversation concepts by visually handicapped subjects and sighted
children. Visually handicapped subjects were similar to sighted children in
their range of explanations for their conversation judgments.
Asha (1997) compared the level of creativity of hearing impaired and
normal children. Results showed that normal children were more creative than
the hearing impaired children. Though the groups did not differ in ideation
fluency, significant differences were observed in the flexibility and originality
aspects of creativity. Niaz, Saud and Ruiz (2000) explored how creativity and
cognitive variables like mental capacity, cognitive style and mobility-fixity
dimension can explain academic performance among 141 11 grade
Venezuelan high school students. Results showed that the mobility-fixity
dimension was the most consistent predictor of academic achievement. The
mobility-fixity dimension and creativity, although related, perhaps represent
different aspects of academic performance. Khare and Grewal (1997)
investigated the relationship between three cognitive abilities: creativity (CR),
academic achievement (AA) and Speed of Information Processing Ability
(SIPA). Results indicated that the relationship between SIPA and CR among
urban and rural primary school boys was negative but significant. Coefficient
of correlation between SIPA and AA score of rural primary school children
were found to be significant but those between CR and AA scores of urban
and rural primary school children were found to be largely insignificant.
Reynolds (1992) examined the impact of art education on creative
thinking, academic achievement, self-esteem, locus of control, and
appreciation for the arts. A sample of 615 participants divided into three
37
groups, experimental, modified control, and the control group. A pre-posttest
design was used to measure outcomes. Results indicated that participants
involved in the arts education program scored significantly better than their
control group peers in the areas of creativity, social and parental self-esteem
and appreciation for the arts. Auh (1997) conducted a study and found that the
best predictor of compositional creativity were informal musical experiences,
musical achievement, and academic grades. The findings also suggested that
compositional creativity was significantly related to informal musical
experiences, musical aptitude, musical achievement, and academic grades.
Silvia and Phillips (2004) examined when self-evaluation influences
creativity. They predicted that feeling able to improve would buffer against
the detrimental effects of self-evaluation on creativity. Two experiments
manipulated self-evaluation and perceived ability to improve potential failure
on the creativity task. Self-evaluation reduced creativity in both experiments,
but only when people did not affect creativity. Connections between self-
motives, creativity and defensiveness are discussed.
Kalliopuska (1989) studied the impact of ballet on the personality of
62 Finnish ballet students ranging in age from nine to seventeen. He
concluded that ballet can help develop self-expression, improves self-esteem
and self respect, creates self-confidence and develops sensitivity and
empathy. Cole, Sugioka and Yamagata (1999) investigated a supportive
classroom environment for developing student creativity. Observations and
interview data collected focused on assessment, classroom activities and the
teacher's effort in creating this supportive environment. Teacher student
relationships and encouraging multiple perspectives was significant to this
creative milieu. Fasco (2001) examined the relationship of US public school
38
education and student creativity. He included some important areas such as
the relation of cognitive and learning styles of creativity, the transferral of
creative thinking skills across domains, the use of authentic tasks, the role of
motivation in creative thinking, teacher attitudes, and the relation of meta
cognition and creativity. Findings suggested the need to increase the teaching
of creativity.
Jurcova and Stubuova (1999) compared the relationship between
social skills and personality characteristics in 227 Slovak high school students
of high or low originality. They found that personality independence
approachability dominance and self-confidence as well as higher creative
cognitive abilities all take part in social skills in highly original students. In
subjects with low originality, self-control, vigilance and rule-consciousness
play a greater role. Gluck, Ernst and Unger (2002) investigated whether artists
who face strong external constraints in their creative work differ in their
conceptions of creativity from the artists who are free in their choice of topics
and materials, time schedule and so on. They take 64 artists from different
domain and 47 psychology students as a control group. They found
differences for example regarding the importance of function for a creative
product or regarding the importance of the ability to solve problems for a
creative person. Also psychology students tended to emphasize poshive
feelings evoked by creative activities where as both groups of artists often
referred creativity as hard work.
Oka (2003) aimed to clarify through an analysis of Campbell's music
education program what factors were necessary for the development of
education programs for persons with visual disabilities in the United States,
39
especially in relation to the development of vocational education in the 19*
century. He suggested that an excellent teacher, good quality teaching
materials and tools, appropriate educational content, help with finding
employment for pupils and systemization and succession of teaching methods
were indispensable for the improvement of education, especially vocational
education.
Kelgeri, Khadi, and Phadnis (1989) assessed the effect of sex and
locality on the creativity of 59 boys and 41 girls from an urban area and 58
boys and 42 girls from a rural area. They found that creative performance of
urban subjects was significantly better than that of rural subjects. There was
no association between sex and creativity in subjects. Campos, Lopez,
Gonzalez and Parez-Fabello (2000) investigated relationship between
imagining capacity and various aspects of creativity in a sample of 728
students of both sexes. Findings suggested that imagining capacity and sex
both influence aspects of creativity.
Lee (2002) examined the effect of gender and the psychosocial
environment on the development of creative thinking in real-life situations
and the effects of formal education. Results showed that gender did not
significantly influence creative thinking abilities in real-life situations.
Education exerted no significant effects on creative thinking. It is concluded
that males and females perform differently in the core issues around which
they build creafivity in real-life. Saeki, Fan and Van (2001) assessed cross-
cultural differences in creative thinking of 51 American and 54 Japanese
college students. They found that American college students showed
statistically significantly higher scores on the Torrance Test of Creative
40
Thinking than the Japanese college students. No gender differences were
found in either culture. Performance on the TTCT did not correlate with the
performance on broad academic aptitude/achievement measure for either
culture.
Pufal (1998) investigated the relationship among self-acceptance,
locus of behavior control, and level of adolescents' creative thinking abilities.
From a sample of 250 pupils, 30 creative and 30 control non-creative pupils
were selected. The young people with high level of creative thinking abilities
were found to have significant higher levels of internal control and self-
acceptance when compared with the less creative control group. Girls showed
a higher level of internal locus of control than boys. Bansan and Agarwal
(1997) examined the differences in creative thmking ability among young
children. Mehdi's Non-Verbal Test for Creative Thinking was administered to
24 rural and urban students of classes' IV and V prior to and subsequent to
exposure to computers for a period of 2 months. The treatment group was
trained and was given coaching; the control group received no training.
Findings revealed marked improvement in creative ability of the treatment
group as compared to the control group. No significant difference was noted
between rural and urban children.
Yong (1994) examined the relationship between creativity and
intelligence for 397 Malaysian secondary school pupils. It was found that
students who are intelligent have higher verbal fluency or capacities than do
students who are less intelligent and this superiority in verbal skills could
explain their verbal creativeness. Preckel, HoUing and Wiese (2006)
investigated threshold theory, which predicts that there is a weaker
41
relationship between creativity and intelligence for an IQ above 120 than for
an IQ below 120. The results indicated that for ages 12-16 years correlations
between creativity and intelligence are of comparable size throughout the
ability range. Baldwin (2001) discussed the relationship between creativity
and intelligence and the basic construct and recognition of creativity in
African American students. He stated the culture of an individual can
influence approaches to stimuli; for African American students, expression of
creativity can be similar to those shown by children of other ethnic groups,
but the interpretation of these behaviors will vary according to the ingrained
opinion of what behaviors can be considered creative positives instead of
deficits.
Saweyer (2006) focused on three defining characteristics of group
creativity (1) improvisation (2) collaboration (3) emergence. To demonstrate
these three characteristics, the author presents several examples of group
creativity in both music and theater. Then author explores how both structure
and improvisation are always present in-group creativity. The author
concluded by suggesting some implications for musical education and for
education in general. Claxton, Pannells and Rhoads (2005) explored the
developmental trends in creativity from the proposed 4*- grade slump through
beginning adolescence in the 9* grade. A measure of divergent thinking and
divergent feeling was used to assess both the cognitive and affective process
related to creative production. The study found indications of significant
differences in creativity related to divergent feeling and grade.
Zhou and Oldham (2001) examined developmental assessment
strategies and creative personality on individuals' creative performance. 68
42
college students perfonned a role-playing task in laboratory setting and
completed personality questionnaire. Results showed that individuals
exhibited the highest creative performance when they expected a self-
administered assessment and had creative personality. Kaufman and Baer
(2004) asked 241 students to give self-ratings of their creativity in domains.
They also examined how such self-assessments in diverse domains relate to
other measure of cognitive ability and to creativity as measured with a
personality scale. In general, if students viewed themselves as generally
creative, they also viewed themselves as creative in different areas. The only
area that was not correlated with general creativity rating was mathematics.
Wolfradt and Pretz (2001) investigated the relationship between creativity and
personality among 204 subjects. The results of this investigation show a close
association between creativity and specific personality traits.
Hussain and Sajid (1990) investigated the relationship between
creativity, socio-economic status, family structure, parents' interest in creative
activities and traditional nontraditional living conditions among 8 and 10
grade 400 males. They concluded that socio-economic status was positively
related to creativity. Parents' interest in creative activities and traditional
living conditions were significantly associated with verbal creativity. The
joint family structure was positively associated with verbal and non-verbal
creativity. Kumar and Sharma (1993) studied the differential relationship
between creativity and familial background factors among normal, physically
handicapped and problem children. They concluded that reward and presence
of father and biological mother were powerful determinants of creativity for
all normal, physically handicapped and problem children. A healthy familial
43
environment was a significant factor for normal and handicapped subjects, but
not for problem children.
Shaw and Conway (1990) examined differences in how 12 high and
12 low-creative subjects used conscious and unconscious clues to solve
anagrams. Results indicated that high creative subject had significantly faster
threshold times and used more unconscious clues and unconsciously primed
solutions. Individual differences related to creativity may influence the
processing of consciously presented information. Loska, Loksova and
Korcova (2000) examined the effects of evaluation expectation and working
conditions on creative work characteristics of 80 university students who
created collages in the presence of others or alone while expecting or not
expecting evaluation. Results showed that expectation of an evaluation
influenced all 5 creativity variables. No significant differences were found
concerning those working alone vs. those working in the presence of others.
The expectation of no evaluation exerted more influence when subjects were
not in the presence of others.
Read (2005) explored creativity and motivation in the second half of
life. While many quantitative studies on creativity show decline with
advancing age, there is some evidence that creativity may change qualitatively
over time. The purpose of the study is to explain self perceived changes in
creativity over the life span. Findings indicated that participants do not
perceive a decline in creativity with age. In-depth analysis of the interviews
concluded qualitative coding to establish a number of themes that permeated
the self-perceptions regarding changes in creativity over time.
44
Matuga (2004) addressed some primary questions in this study
concern the role of self-regulation while children were engaged in drawing
picture of real and make-believe objects. The study questions were addressed
by examining the private speech and drawings of real and make-believe
objects made by 108 children. Findings indicate differences in the use of
private speech for self-regulation purposes by participants based on the type
of drawing task real or make-believe, grade, and creative ability level of
participants. This study also found a moderate positive correlation between
the drawing and creative ability of participants.
Kaufman and Baer (2004) asked 241 students to give self-ratings of
their creativity in domains. They also examined how such self-assessments in
diverse domains relate to other measure of cognitive ability and to creativity
as measured with a personality scale. In general, if students viewed
themselves as generally creative, they also viewed themselves as creative in
different areas. The only area that was not correlated with general creativity
rating was mathematics.
Baer, Oldham, Hollings-Head and Jacobsohn (2005) examined the
possibility that sibling demographic difference and sib size moderate the
relation between an individual's birth order and his or her creativity. Results
showed that first bom with large sibling group were more creative when they
had relatively more siblings close in age or of the opposite sex.
ACADEMIC ACHIEVMENT
Existing literature compare the academic achievement of visually
handicapped and sighted students. Several studies found that visually
handicapped students were academically better than sighted students. Visual
status has no main effect on academic achievement. Some studies revealed the
45
result that sighted students do academically better than visually handicapped
students. A number of studies indicated significant relationship between self-
esteem and academic achievement. A few studies depicted that there is no
significant correlation between self esteem and academic achievement.
Pereira (1990) addressed the main problems of blind and visually
impaired (BVI) children's education in relation to their motor development
problems and the ways that they can be solved. Subjects included 67 blind
and visually impaired children and 150 sighted children. The difference
between the blind and visually impaired and sighted children was basically
founded in balance performance. Compel, Van Ban and Schreuder (2003)
investigated whether the difficulties with reading of children with low vision
are a matter of reduced visual input or also a consequence of a lack of
orthographic knowledge because of less reading experience. The results
indicated that reduced visual input is the only causes of these children's lower
reading performance.
Wyver, Markham and Hlavacek (2000) examined differences in the
performance of 15 children with congenital visual impairments and 15 sighted
children on 2 tasks involving inference and 1 task involving free association.
Results indicated some differences between the 2 groups when the
information was visual, but not when it was non-visual. The results of a word
association task found that visual impairment affected some aspects of
responses to both visual and non-visual items, but had little effect on other
aspects. Differences in semantic and lexical functioning seem to be related to
the way the 2 groups acquire information. Fellenius (1999) compared the
reading performance of 82 visually impaired readers in Sweden to 6,305
46
Swedish sighted students. Results revealed that the 2 groups of students were
in a more equivalent environment in school than at home. The greatest
differences between the 2 groups were found in their statements about their
interactions with family member at home, particularly for readers with
specific reading media, such as Braille and closed circuit television.
Grenier and Giroux (1997) compared the spelling of 7 students with
functional blindness who read Braille with that of 180 sighted students
reading conventional print. Students were in grades 9-11 and attending
regular high schools in Quebec. The students with blindness were
significantly ahead of their sighted peers in usage and grammatical spelling.
Klinkosz, Sekowsk and Brambring (2006) compared academic achievement
of sighted and visually handicapped students. They found no main effect of
visual status on academic achievement. But there were some significant
differences between the personality traits of the visually impaired and sighted
groups.
Evans and Douglas (2008) compared the experiences of 10
participants who were blind and 10 participants who were sighted in working
through an online learning task and explores the application of cognitive load
theory. It considered the quality of the learning experience and the
implications for practitioners.
Odetokun (1999) compared the academic achievement of the blind
and low vision pupils. He tried to find out which of the group of subjects
performed better in English language and arithmetic. The factors responsible
for the difference in their academic achievement were identified. Findings
revealed that the low vision subjects had higher academic achievement than
47
the blind subjects. Okoro (1993) compared the academic achievement of
sighted and visually impaired pupils, when expose to two different teaching
methods in science. A sample of 60 pupils was drawn fi-om two co
educational schools one school was for visually impaired children while the
other was for sighted pupils. The 20 subjects were used as the first
experimental group, another 20 as the second experimental group and the
remaining 20 as the control group. A pre test posttest control group design
was used. A pre test was administered to all of the subjects. The experimental
groups received the treatment, one being exposed to practical method and the
other to alternative to practical method of teaching science. The control group
received no treatment at all then a posttest was administered to all of the
subjects. It was found out that treated groups performed better than the
control group; pupils exposed to practical method of teaching performed
better than those exposed to alternative to practical approach; visually
impaired pupil performed better than the sighted pupils using the two
methods.
Oakland et al (2000) conducted study on preferences in learning
styles for 21 students with visual impairments (aged 10-17) and their sighted
peers. He found that students with or without visual impairment did not differ
in their frequency for preferences for either on extraverted or introverted
styles. However, students with visual impairment more frequently preferred
practical, thinking or organized style in contrast with their sighted peers. Also
in contrast with their sighted peers, boys with visual impairments tended to
prefer extraverted styles and girls with visual impairments tended to prefer
introverted styles. 10-15 year old students with visual impairment generally
displayed a preference for thinking styles, while those older than 15 preferred
48
feeling styles, whereas those older than 15 generally preferred more flexible
style.
Beaty (1994) conducted a study on assessment of psychological and
academic adjustment of 30 undergraduates with visual impairments and 43
nondisabled undergraduates. Result revealed no intergroup differences on
psychosocial adjustment. The mean grade point average of subjects with
visual impairments was higher than that of nondisabled subjects. Blind/low
vision students scored higher than sighted students on self-esteem. Mioduser,
Lahav, and Nachmias (2000) investigated the use of diagnostic and remedial
adaptive computer tool to help students with low vision decrease their
spelling mistakes. The results indicated a clear change in the performance of
an 8* grade student, from phonetic writing to process writing; or gradual
evaluation to automation in spelling and model word retrieved and the central
role of the computer tools in improving the students performance.
Freeman and Alkin (2000) to shed light on the efficacy of integration,
30 studies were reviewed on the academic and social attainments of school-
age children with mental retardation. When comparing children with mental
retardation in general education and special education classroom, integrated
students perform better than their comparable segregated students on
measures of academic achievement and social competence.
Lan (2005) has three purposes in his dissertation (1) to examine a
model of causal relationship among socio-economic status, parenting,
adolescents academic achievement and adolescents self-esteem (2) to examine
whether or not the proposed model is structurally invariant across gender and
grade (3) to determine whether family income, parental and maternal
49
education and occupational prestige contribute to nurturant and punitive
parenting, adolescents academic achievement and self-esteem. Structural
equation results showed that socioeconomic status has a significant and
positive effect on nurturant parenting and adolescents' academic achievement,
which, in turn affect adolescents self-esteem. MANOVA results showed a
gender effect for academic achievement and a grade effect for parenting.
Multiple regression results found a significant effect of parental education on
adolescents' academic achievement.
Feather (1998) studied attitudes toward high achievers, self-esteem,
and value priorities among Australian, American and Canadian students.
Results showed that American students gave more emphasis to achievement,
competence, and conformity values and were more in favor of rewarding high
achievers; Australian students gave less emphasis to conformity values, rated
prosocial values as higher in importance, and reported equalitarianism;
Canadian students gave less emphasis to affiliative contentment values.
Trautwein, Ludtke, Koller and Baumet (2006) examined the directionality of
effects between global self-esteem, domain specific academic self-concepts,
and academic achievement. Special emphasis is placed on learning
environments as potential moderators of the direction of these effects.
Reciprocal effects were found between self- esteem, academic self-concept
and academic achievement.
Aremu (2004) investigated the psychological and sociological
determinants of academic achievement of school-going adolescents. Results
showed that the six psychological and sociological factors like-motivation,
anxiety, and locus of control, self-esteem, parent's education, parental
50
discipline, culture, and governance would jointly determine academic
aciiievement of adolescents, specifically; motivation, anxiety, parental
discipline and governance were found to be significant in determining
academic achievement among adolescents. Perry, Gwendolyn and Takyi
(2002) investigated the effects of team sport participation self-confidence,
self-efficacy and educational attainment of adolescent females. Result showed
that good performance in sports enable subjects to have some control over
their behavior and their future. They also displayed more self-confidence,
improved grades and an increased desire to attain college.
Jonson-Reid et al (2005) examined that the promotion of self-esteem
remains a major focus of school-based intervention programs designed to
improve children's academic performance. Findings suggested that strategies
that build a student's belief in the importance of education might do more to
increase academic self-efficacy among African American youths than would a
focus on self-esteem. Legum and Hoare (2004) assessed the effects of a 9-
week career intervention program on at risk middle school students career
maturity levels, self-esteem and academic achievement. Results revealed that
the sample's career maturity attitude and competency levels and academic
achievement improved but such increases were not statistically significant.
El-Anzi (2005) examined the relationship of academic achievement
with anxiety, self-esteem, optimism and pessimism. The important findings of
the investigation were the significant positive correlation between academic
achievement and both optimism and self-esteem- where as the correlation
were negative between academic achievement and both anxiety and
pessimism. Maikhuri (1997) examined the relationship between self-concept
51
and academic achievement in a sample of 200 college students of both sexes
between 16-18 years of age. Results revealed no significant correlation
between academic achievement and self-concept. However significant
differences were observed in the academic achievement of the high and low
self-concept groups.
Kobal and Musek (2001) tested hypothesis that academic
achievement affects different components of self-concept in 230, 16-17 yr
olds. They also investigated the possible influence of nationality in modifying
the relationship between academic achievement and self-concept. The results
of two factors (academic x nationality) analysis of variance and discriminant
analysis showed significant correlation between academic achievement and
various indices of self-concept, which varied in a nationality dependent
fashion. Skaalvik and Hagtvet (1990) examined causal relationship among
academic achievement and self-concept of ability and general self-esteem for
two cohorts of Norwegian school children. The result supported different
causal relationship in the two cohorts, suggesting a recursive model at grade 3
and 4 and a reciprocal model at grade 6 and 7.
Strassburger et al (1990) explored differences in academic
achievement between 67 Hispanic and 304 Anglo 7 -9 grade students along
the dimensions of academic self-esteem, locus of control, and socio-economic
status. Academic locus of control differentially affected Hispanic and Anglo
subjects, but this interaction accounted for minimal variance in grade point
average. Socio-economic status also contributed to Grade Point Average
differences, but the size of effect was small. In addition, self-esteem
accounted for the largest amount of Grade Point Average variance, regardless
52
of subjects' ethnicity. Justice, Lindsey and Marrow (1999) examined the
relations of self concept, self-esteem and social preference to the academic
achievement of African American preschool children enrolled in a Head Start
program. Findings suggested that the development of academic is important
for the school achievement of minority children.
Ginter and Dwinell (1994) investigated the relationship between
duration of loneliness, self-esteem and performance in academic assistance
courses. Findings showed that the frequency and intensity of the effects of
loneliness correlated inversely with self-esteem. Self-esteem did not correlate
with achievement in courses. The frequency of the effects of loneliness
positively correlated with achievement. Astin (1992) found that individuals
with high academic self-concept of ability (ASC) perceived their effort as
validation of positive academic achievement, and low effort as an indicator of
low achievement. Furthermore, individuals perceive those with high self-
concept of ability as successful even when they are not.
Einar and Knut (1990) examined causal relationships among
academic achievement, self-concept of ability, and general self-esteem for
two cohorts of Norwegian school children. Measures of the three variables
were collected when the students in the two cohorts were attending third and
sixth grade and 18 months later. The results supported different causal
relationships in the two cohorts, suggesting a recursive model at Grades 3 and
4 and a reciprocal model at Grades 6 and 7. Accordion, Accordion, and
Slaney (2000) examined the relationship of perfectionism with measures of
achievement and achievement motivation and mental health aspects of
depression and self-esteem in high school students. Results indicated that
53
subject's personal standards were significant predictor of academic
achievement and achievement motivation. The relationship between
perfectionism and depression and self-esteem found as subject's personal
standards increased, their level of self-esteem increased. Furthermore, when
subject's experienced discrepancy between their personal standards and actual
performance their depression level increased and self-esteem decreased.
Aunola, Stattin and Nurmi (2000) investigated the relationship
between the achievement strategies adolescents deploy in a school context
and their self-esteem, school adjustment, and internalizing and externalizing
problem behaviors. The results suggested that the achievement strategies
adolescents deploy are reflected not only in their school adjustment but also in
their overall problem behavior. Moller and Koller (2000) described 2 studies,
which deal with attributions following academic achievement. Study 1
investigated the influence of different types of instructions, self-concepts of
ability and out comes on causal attributions in a school setting. In study 2, 160
university students worked on an unfamiliar task. The results supported the
assumption that students spontaneously generate attributions to raise or at
least preserve their self-esteem.
Skellenger and Hill (1994) studied the effects of a shared teacher-
child play intervention to increase the amount and type of targeted play
behavior of 3 young children aged 5-7 yrs with visual impairment. Results
evidenced the effectiveness of shared teacher-child play as a method of
increasing the play skills of young children with visual impairments. Moneta
and Sin (2002) examined the effects of trait intrinsic and extrinsic motivations
on creativity and academic performance in Hong Kong college students.
54
Findings suggested that intrinsic motivation correlated negatively with yr 1
grade point average whereas extrinsic motivation correlated positively. They
also suggested that our college environment discourages intrinsic motivation
and creativity.
Thompson and Kelly-Vance (2001) examined the impact of
mentoring on the academic achievement of at risk youth involved in Big
Brother/Big Sister. Results indicated that boys in the treatment group made
significantly higher academic gains than control group, even after controlling
for ability. Ponsford and Lapadat (2001) examined the perception and
performance in terms of achievement motivation theory within a Canadian
educational context in 3 12* grade students at risk of failing. Results indicated
that academic, social family and peer factors influenced their decision
making.
Trusty et al (2000) studied the effects of gender, socioeconomic
status and 4 types of 8'''- grade academic performance on post secondary
educational choices at late adolescence. Results showed that gender had
strongest independent influences on educational choice. Gender also interacts
with socio-economic status and academic performance. Relationship between
socio-economic status and educational choice were stronger for women then
for men. Pajares and Valiante (2001) determined whether gender differences
in writing motivation and achievement of middle school students are a
function of gender stereotypic beliefs rather than of gender. Findings
suggested that a feminine orientation is adaptive in the area of writing,
whereas masculine orientation is beneficial when escorted by a feminine
orientation.
. ^ \ « « Nw. .__^ >f?
Robinson-Awana et al (2001) examined aa^sgent self-est^e^y
gender-role perception, gender-role orientation, and attribtttioti^i^^l^^J^Sss a
function of academic achievement by having 3 groups of lO' , 11th and 12*
grade males and females. Author took a self-esteem inventory under 2 sets of
instructions, a standard set and an opposite-gender instruction and for
attributional style and gender-role inventory he took standard sets of
instructions. The results of the self-esteem inventory under standard
instructions revealed a significant difference in favor of males. Under
opposite-gender instructions, academically below average and average
females ascribed significantly higher levels of self-esteem to males. However,
females in the above average academic group attributed significantly lower
self-esteem to males.
Stipek and Byler (2001) assessed effects of the age at which children
entered kindergarten on children's academic achievement, social skills
academic engagement, relationship with teachers and self ratings of academic
skills. Results indicated the only advantage found in kindergarten and third
grade for children who were relatively old when they entered school was in
more positive feeling about their teachers.
Daftuar, Sinha and Daftuar (2000) examined the relationship of risk
taking with academic achievement in students coming from different
habitational backgrounds. It was found that non-tribal urban high achievers
had greater risk taking tendency than their counterpart low achievers. Also
rural students showed greater risk taking than urban students. Mohanty (2000)
examined the role of school type in determining psychological differentiation
and academic achievement of tribal and non-tribal students in the context of
primary education. The results showed that psychological differentiation and
56
academic achievement were positively related. Academic achievement of
non-tribal students was higher than the tribal and both groups were
comparable on psychological differentiation.
Peng and Wright (1994) hypothesized that Asian American students
have higher academic achievement than other minority students because they
are more likely to experience certain home environments and educational
activities that are conductive to learning. Findings indicated that Asian
American students were more likely to live to an intact 2-parent family, to
spend more time doing homework, and to attend more lessons outside of
school. Asian American parents also had higher educational expectation for
their children, although they did not directly help their children in schoolwork
more than other parents.
Marjoribanks (2005) examined relations between family background,
adolescents' academic achievement, aspirations, and young adults'
educational attainment. Results indicated that, while family background and
academic achievement measures had medium associations with attainment,
adolescents' educational aspirations made a large independent contribution to
explaining differences in adults' educational attainment. Koutsoulis and
Campbell (2001) examined the influence of home environment on motivation
and achievement of male and female high school students. Results indicated
that the best predictor for high school students' achievement is their prior
ability. Math and science self-concept were found to be positive predictors for
students science and math achievement. Parental pressure found to be a
negative predictor of motivation and math and science achievement especially
for girls.
57
Bacete and Ramirez (2001) examined whether parental involvement
in school activities and family socio-economic status are associated with
children's academic achievement. Results suggested that academic
achievement is directly influenced by the cultural level of the family and the
child's intelligence but is indirectly influenced by parental involvement in
school activities and socio economic status of child's family. Patel (1979)
studied the relationship of family, personal and social adjustment to
achievement in high school students. A sample of 350 students classify into
200 low and 150 high achievers. Results indicate that high achievers score
much more than low achievers in all the three areas of adjustment. Girls score
better than boys on family adjustment, but boys score much higher than girls
on personal adjustment.
Poulson and Fouts (2001) examined the effect of teacher-student
attunement on the academic performance of students with and without
learning disabilities. Results indicated that the attuned teaching resulted in
significantly more teacher-student attunement than did the non-attunement
condition. The attuned teaching condition significantly improved academic
performance over non-attuned teaching. Valas (2001) examined the relations
between academic achievement, helplessness and psychological adjustment,
controlled for gender and age. Results showed that academic achievement is
directly and indirectly related to the pattern of attribution, expectation,
helplessness and psychological adjustment. The result also indicated that boys
showed more helpless behavior than did girls, while on the other hand girls
reported more psychological adjustment.
58
Durbrow, Schaefer and Jimerson (2000) suggested that learning
related behaviors, anxiety and attention might influence academic
performance of children who live in industrial countries. Result indicated that
academic performance might be improved in these children by reducing
children's anxiety level and promoting appropriate learning behavior. White
(1982) used meta-analysis techniques to examine almost 200 studies that
considered the relationship between socioeconomic status (SES) and
academic achievement. Results indicated that as SES is typically defined and
used, it is only weakly correlated with academic achievement.
Mishra (1997) examined the contribution of certain child rearing
practices towards the cognitive development of children. Study 1 assessed the
perceptual ability, concept formation, child rearing-practices and academic
achievement in 54 boys and 54 girls and their graduate mothers. Results
revealed that parental responsiveness was found to be positive correlated with
children's academic achievement. Study 2 assessed the relationship between
child-rearing practices and the development of self-esteem. It was seen that
low self-esteem was due to the mother's use of symbols of rejection, control
indigence, permissiveness and less encouragement. Interesting gender
differences were observed.
SELF-ESTEEM
Many researchers found similar self-concept profile for sighted
adolescents and adolescents with visual impairment. Whereas a few studies
concluded that visually handicapped students scored high on self-concept than
sighted students. Various scholars examined gender differences in global self-
esteem and concluded that male scored high on self-esteem than female.
59
Hen, Weisse, and Lifshitz (2007) examined self-concept and quality
of friendship of 40 adolescents with visual impairments (20 in public schools
and 20 in a residential school) were compared to those of 41 sighted
adolescents. The findings indicate a similar self-concept profile for sighted
adolescents and adolescents with visual impairments, although the scores of
the participants with visual impairments were higher in all domains except
their fathers' concept of them. Griffin-Shirley and Nes (2005) studied self-
esteem and empathy among 71 students with visual impairments and 88
sighted students. They found no significant differences between the two
groups of students in their level of self-esteem, empathy towards others and
bonding with pets.
Obiakar and Stile (1990) compared the self-concept of visually
impaired and normally sighted students. The self-concept was measure with
the Student Self-Assessment Inventory (SSAI), which assesses children self-
knowledge, self-ideal and self- esteem as related to physical maturity, peer-
relation, academic success and school adaptiveness. They found that visually
impaired subjects scored high than normally sighted subjects on 5 of the 12
SSAI subscales. This result refutes the notion that visually impaired children
have poorer self-concepts than normally sighted.
Huurre, Komulainen and Aro (1999) studied social support from
friends and family in relation to the self-esteem of adolescents with visual
impairments. The subjects were 13-16 yrs old who were blind or had low
vision. A control group of sighted and visually impaired adolescents were
assessed using self-reported questionnaire. They found that the self-esteem of
the sighted and visually impaired adolescents did not differ significantly,
60
although the self-esteem of visually impaired girls tended to be lower than
that of fully sighted girls. Relationships with friends and family significantly
contributed to the enhancement of self-esteem for all the visually impaired
Subjects.
Shapiro, Moffett, Lieberman, and Dummer (2008) examined
perceived competence; ratings of importance of physical appearance, athletic
competence, and social acceptance; discrepancy scores; and global self-worth
of 43 children with visual impairments. The findings revealed that the
children discounted the importance of physical appearance, athletic
competence, and social acceptance and had moderately high ratings of global,
or overall, self-worth. The results are discussed in relation to understanding
the effects of discounting strategies on domain-specific and overall self-
esteem
Satapathy, Sujata and Singhal, Sushila (2000) investigated the stress,
self-esteem, adjustment level, and academic performance differences between
visually and hearing impaired of students of class VIII and X. Results showed
that the visually impaired students were less stressed, had higher self-esteem,
higher level of adjustment, and better academic performance than the hearing
impaired students. It was found that hearing impaired adolescents also
exhibited more behavior problems than did visually impaired students. Class
VIII and class X subjects differed significantly; the class VIII subjects were
more somatized, obsessive, sensitive, anxious and depressed than the class X
subjects. Male and female subjects did not differ significantly on total stress
scores, although males showed significantly more obsessive and compulsive
behavior.
61
Christy, Shanimole and Nuthetie (2002) analyzed the self-perceptions
of children with visual impairments. Results indicated that the subjects had no
significant problems in expressing moods and feelings, preferences and
decisions. Some subjects showed variation and problems in expressing
sympathy (46%), the choice of clothes (34%), and preferences for
environments and items (50%) and 54% respectively). There are relatively
few problems with respect to the expression of needs and wants. It was
concluded that self-perceptions are stronger and take place more often in
childhood than at any other time of life.
Lopez-Justicia et al (2005) examined differences in self-concept
between children with congenital low vision and their sighted peers. The
findings revealed that the children with low vision scored lower than those
with normal vision in aspects of their relationships with classmates but higher
in their relationship with parents. No differences were found on other general
or specific facets of the self-concept, such as physical ability, physical
appearance, verbal ability, mathematics, or general subjects.
Dummer et al (2008) examined perceived competence; ratings of
importance of physical appearance, athletic competence, and social
acceptance; discrepancy scores; and global self-worth of 43 children with
visual impairments. The findings revealed that the children discounted the
importance of physical appearance, athletic competence, and social
acceptance and had moderately high ratings of global, or overall, self-worth.
The results are discussed in relation to understanding the effects of
discounting strategies on domain-specific and overall self-esteem.
62
Lea-Wood (1995) examined the self-esteem of gifted and non-gifted
adolescent girls. Results revealed that non-gifted girls were higher in both
total and social self-esteem than the gifted girls and that the differences in
total self-esteem were related to year level. Norman, Ramsay, Martray and
Roberts (1999) compared two groups of gifted students, one group was highly
gifted and other group was moderately gifted, on self-concept, emotional
autonomy, and anxiety. Although a measure of academic ability was used to
create distinctive ability groups, the results did not support the hypothesis that
highly gifted students would be more likely to display lower self-concept and
more adjustment problems than moderately gifted group.
Theresa (2006) studied the relationship between children's self-
concept, academic achievement, and teacher's rating of children's self-
concept. The differences between grade levels, sex, and ethnic group
membership were tested by analysis of variance. He found significant
correlation between child's self-concept and teacher's rating of child's self-
concept, and between teacher's rating of child's self-concept and child's
academic achievement. He also found significant ethnic group differences in
self-concept, academic achievement, and teacher's rating of self-concept in
this study, with interethnic groups showing the higher scores.
Maqsud and Rouhani (1991) explored the relationship between
socioeconomic status, locus of control, self concept, and academic
achievement of secondary school pupils. Results revealed that socioeconomic
status was significantly and positively associated with intemality, self-
concept, and academic achievement in English. Externality was significantly
but negatively related to self-concept and achievement in English. Self-
63
concept was significantly and positively correlated to measures of
achievement in English and mathematics. Mathematics achievement of male
students was significantly higher than female ones.
Song and Hattie (1984) investigated the relation between home
environment, self-concept, and academic achievement in 2,297 14-15 yr old
Koreans. Data on subjects was collected in 4 different samples to test 4
structural equation models. Group 1 consisted of 537 males, Group 2
consisted of 537 males, Group 3 consisted of 611 females, and Group 4
consisted of 612 females. Results show that over the 4 samples, self-concept
was a mediating variable between home environment and academic
achievement.
Gerken (1983) determined the relationship between self-concept and
locus of control, and the relationship of each variable to ability, achievement,
and degree of over-or underachievement in a group of seventh graders in an
urban junior high school. Support was found for the association between
students' attitudes concerning self-concept and locus of control and their
academic achievement, between attitudes and ability, and between attitudes
and over-or underachievement. These relationships were stronger for the
female group than the male group. Teasly and Lee (2006) investigated the
impact of community-outreach after school academic enhancement program
on self reported levels of self-esteem in African American male youth.
Findings revealed that higher GPAs are related to higher levels of school self-
esteem in participants and that school self-esteem is related to member
program satisfaction scores.
Midgatt et al (2002) examined the relationship between self-esteem
and achievement with students' characteristics and parental variables in a
64
sample of 164 fourth grade and 152 seventh grade children and their parents.
They found a modest but significant positive correlation between self-esteem
and achievement. The result also showed that the relationships between
family processes and achievement were mediated by the children's academic
effectiveness but not by self-esteem. When the child and family variables
were examined in combination, the significant association between self-
esteem and achievement disappeared.
Zaleka (2004) reviewed recent studies that investigated the academic,
social and general self-concept of students with learning disability and their
normal achieving peers and compare the results with those of a previous
meta-analysis of relatively older studies, by Chapman. Result indicated that
the academic self-concept of learning disabled students is more negative than
that of their normally achieving peers. Unlike Chapman's conclusion,
however, the evidence is less clear for general self-concept. This is also true
for self-concept. Because the evidence that shows no group differences
outweighs that indicating better social and general self concept scores for
normally achieving children, the conclusion that children with learning
disability hold more negative social and general self concept than do normally
achieving children is not warranted.
Guay, Larose, and Boivin (2004) tested children academic self-
concept, family socio-economic status, family structure and academic
achievement in elementary school as predictors of children's educational
attainment level in young adulthood. Resuh indicated that academic self
concept predicted educational attainment. Result also indicated that the
academic self-concept/educational attainment level relation was still
65
significant while controlling for family socio-economic status, family
structure and academic achievement.
Lane, Lane, and Kyprianou (2004) investigated the relationship
between self-efficacy, self-esteem, previous performance accomplishments
and academic performance. Correlation result indicated significant
relationship between self-efficacy and self-esteem. Multiple regression result
indicated that self-efficacy mediated the relationship between performance
accomplishment and academic performance. Findings lend support to the
predictive effectiveness of self-efficacy measures in academic achievement
setting.
Stalikas and Gavaki (1995) examined the relationship between ethnic
identity self-esteem and academic achievement in secondary school children.
Result found a strong and positive relationship existed between the three
variables. A positive ethnic identity was related to better self-esteem and
higher academic achievement. Sapp (1990) assessed academic performance,
academic self-concept and self-esteem of 250 junior high at risk students.
Results revealed that there is a significant relationship between grades and
academic self-concept and grade and wide range achievement test-Revised,
suggesting that academic self-concept could be used to predict academic
achievement.
Trusty, Peck, and Mathews (1994) investigated the relationship
among achievement, socio-economic status and self-concept. Results
indicated that achievement /socio-economic status clusters accounted for
roughly 24% of the variability in self-concept scores. Low achieving / low
socio economic status students generally have more negative social and
66
emotional self-perception, whereas low achieving/higher socio economic
status students had more negative school related self- perceptions.
Mc Cabe, Randi, Blankstein and Mills (1999) examined the relation
between interpersonal sensitivity and social problem-solving as predictors of
self-esteem, depressive symptoms and academic performance of college
students. Results showed that interpersonal sensitivity was related to problem
solving- in particular, negative problem orientation. Both interpersonal
sensitivity and social problem solving were significant predictors of self-
esteem and depressive symptoms. Interpersonal sensitivity was a significant
predictor of academic performance for both males and females. Though, in
females' social problem solving was not related to academic performance. In
males negative problem orientation and dysfunctional problem solving styles
were important aspects of problem-solving related to academic performance.
Roberts and Cotton (1994) assessed effect of participation by black
U" grades in a mentoring program on self-esteem and academic
performance. Results found that there were no differences at pretest between
control and experimental groups on the dependent measures. After three
months of mentoring, the pretest- posttest group showed a higher mean school
self-esteem score than subject in the posttest- only condition, but not higher
than the control group which was pre tested and post tested. There were no
significant effects in terms of measure of global self-esteem or grade point
average.
Osboume (1995) tested three assumptions on a representative sample
of 8 graders, first African American student's score lower on measures of
academic achievement than white students, second, African American
67
students tend not to report lower self-esteem than white students and third
correlation between measure of academic achievement and global self-esteem
should be moderate. Results revealed a pattern of weakening correlation
between self-esteem and academic out comes from the 8 to 10 grade for
African American students, particularly black male students. Whereas the
correlations for white students remained stable or increased.
Badura, Millard, Peluso and Ortman (2000) investigated the effects
of participating in peer education training on 30 undergraduate peer
educators. He found that subject reported significantly more leadership, health
knowledge and active involvement in changing personal health behaviors
after completing peer education training than at the onset of the course. Self-
esteem did not significantly increase.
Erkut, Szalacha, Coll and Alarcon (2000) examined self-esteem as a
multidimensional construct in one Latino subgroup, Puerto Rican girls and
boys during early adolescence. Resuhs strongly suggested that Latino
subgroups needed to be studied separately. The mean level of self-esteem
found among Puerto Rican girls and boys were generally similar to those
found among Harter's sample of predominantly Anglo middle school students
from the suburbs of Denver except that Puerto Rican youth did not show
gender differences in over all self-esteem. Gender differences in mean levels
of self-esteem indifferent domain were similar to those Anglo youth,
regardless of the Puerto Rican youth's individual level of psychological or
behavioral acculturation come in to view. Psychological acculturation
appeared to play a more protective role for girls and behavioral acculturation
operates a risk factor for boys.
68
AIves-Martin et al (2002) analyzed what strategies are pursued in
order to protect self-esteem when it is threatened by a negative self-evaluation
of school competence. Participants were school students from the seventh to
ninth grades. Results showed that there are significant differences between the
self-esteem enjoyed by successfiil and unsuccessful students in the seventh
grade, such differences disappear in the eighth and ninth grades. They also
found that students with low levels of academic achievements attribute less
importance to school-related areas and revealed less favorable attitude
towards school.
Zhang and Postiglione (2001) examined the nature of thinking styles.
694 participants responded of the thinking styles inventory and the self-
esteem inventory and provided a range of socio-economic status indicators.
Findings reveal that when age was control, thinking styles and self-esteem
overlapped. Those students who reported using thinking styles that are
creativity generating and more complex and those who reported higher self-
esteem tend to be students from higher SES families. Zhang (2001) examined
the relationship between thinking styles and self-esteem and ones
extracurricular experiences to both thinking style and self-esteem. Results
showed that thinking styles and self-esteem are statistically related. At the
same time, both thinking styles and self-esteem are statistically related to the
participants' extracurricular experiences.
Costa-Giomi (2004) examined the effects of three years piano
instruction on sample of 117 fourth-grade children attending public schools in
Montreal. The children had never participated in formal music instruction,
and did not have a piano at home. Experimental group received individual
69
piano lessons weekly for three years and were given an acoustic piano at no
cost to their families. Children in the control group did not participate in
formal music instruction. Results indicated that piano instruction had a
positive effect on children's self-esteem and music marks but did not affect
the academic achievement in math and language measured by standardized
test and school report card. Chandha (1989) used a path analytic recursive
model to determine relationship between personality and background
variables and academic achievement of 307 12 graders. Results indicated that
creativity, sex and quality of family relationship accounted for 12.8% and
19.2% of variance for self-concept and locus of control accounted for 57.8%
of the variance for academic achievements,
Fickova (1999) analyzed the relationship between personality
dimensions and self-esteem indicators in high school students. Results
indicate that personality dimensions like neuroticism, extraversion,
conscientiousness, state and trait anxiety are reliable predictors of self-esteem.
Blanty et al (2004) analyzed the relationship of self-esteem and life
satisfaction to factors of the Five Factors model of personality. They found
that both self-esteem and life satisfaction are connected with emotional
stability, extraversion and consciousness. Agreeableness is related to life
satisfaction, but not to self-esteem. The divergence between self-esteem and
life satisfaction is also based on the difference between the closeness of their
relations towards neuroticism, the correlation between self-esteem and
neuroticism is significantly higher than that between life satisfaction and
neuroticism.
70
Robins et al (2001) examined the relation between self-esteem and
Big Five Personality dimensions. Data were collected from 326,641
individual who ranged in age from 9 to 90. Collectively, the Big Five
accounted for 34% of the variance self-esteem. High self-esteem individuals
were emotionally stable, extrovert, conscientious and were somewhat
agreeable and open to experience. Despite this extensive research, the
relations between self-esteem and Big Five largely cut across age, sex, social
class, ethnicity and nationality. High self-esteem individuals tended to ascribe
socially desirable traits to them and this tendency partially medicated relations
between the Big Five and self-esteem.
Kling et al (1999) conducted a study to examine gender differences
in global self-esteem. Result indicated that male score higher on standard
measure of global self-esteem than females but the difference is small. Mullis
and Chapman (2000) studied the relationship between coping gender, age and
self-esteem in adolescents. Results found that adolescents with higher self-
esteem used more problem-focused coping strategies and adolescents with
lower self-esteem used more emotion focused coping strategies. No age
differences were found.
Cheng and Puge (1989) investigated the problems and characteristics
of 137 female and 119 male students. Results showed that subject's anxiety
levels was generally negatively related to their level of self-esteem. Subjects
with high anxiety tended to have low self-esteem and subjects with low
anxiety tended to have high self-esteem. Although sex of the subjects did not
seem to have an influence on anxiety levels, Subject's self-esteem was related
to sex. Male tended to have higher self-esteem than the female.
71
Vasuki and Reddy (1997) explored the self-esteem of single children
using an expost facto design. The incidental sampling technique was used to
select 20 boys and 20 girls in the age group of 9-15years from urban families.
Data were collected from friends, families, classmates, and teachers and also
from the respondents themselves. Results revealed that most of the children
had high self-esteem. No gender differences in the self-esteem of 12-15 years
olds were found. Overall all boys showed high self-esteem. Results also
indicated significant differences in the self-esteem of boys of the two age
groups whereas the same was not observed in the case of girls.
Smith et al (1999) examined the relationship of ethnic identity to
self-esteem, perceived self efficacy and prosocial attitudes of 100 male and
female adolescents from different social ethnic backgrounds. The findings
suggested that ethnic identity and self-esteem are distinct but related
contributors to young people's perceptions of their ability to achieve
academically to find meaningful careers and to value prosocial means of goals
achievement.
Vinutha, Rajini and Nagalakshmi (1989) administered the culture
free self-esteem inventories for children and adults to 184 boys and 184 girls.
In general, results indicate high self-esteem for boys and girls. Data also
indicated that boys had significantly higher self-esteem on general, social and
academic self-esteem than girls. Girls were more defensive than boys.
Mc Gee and Williams (2000) examined the predictive association
between both global and academic self-esteem from ages 9 to 13 years and a
variety of health compromising behaviors at age 15, in a large sample of
youngsters. Result showed that levels of global self-esteem significantly
72
predicted adolescent's report of problem eating, suicidal ideation, and
multiple health compromising behaviors. Earlier levels of self-esteem were
unrelated to later substance use and early sexual activity.
Kamis et al (2000) examined the extent to which self-esteem stability
relates to self-regulatory styles, self-concept clarity, and goal-related affect.
Results supported the notion that individuals with unstable self-esteem are not
likely to possess a strong sense of self. Specifically, unstable as compared to
stable self-esteem was associated with self-regulatory styles rejecting lower
levels of self-determination, lower self-concept clarity and goal-related affect
characterized by greater tenseness and less interest.
Khalid (1988) explored the consequences of minority status for the
self- esteem of 80 Pakistani children living in the Scotland by comparing their
level of self- esteem with that of 80 age-matched Scottish children. Results
showed that the minority status of the Pakistani community in Scotland did
not have negative consequences for Pakistani subjects self-esteem. Pakistani
minority and Scottish children had similar levels of self-esteem.
Matthews and Odom (1989) investigated the relationship between
anxiety and self-esteem. Result showed that there were moderately significant
relationship between state anxiety and measure on the general self and
academic sub tests and on the total test. There was also a significant, but
moderate and pronounced relationship between trait anxiety and the home -
parents and school-academic subsets. All relationship were negative
indicating, as predicted, that low levels of both state and trait anxiety
associated moderately with high levels of self-esteem.
73
Cornell, Delcourt, Goldberg and Bland (1995) presented the
standardized achievement scores and self-concept levels of 299 black, 52
Hispanic and 595 white elementary school students placed in gifted and
regular school programs. Results indicated that minority students identified
for gifted programs, although white gifted program students scored
significantly higher than both black and Hispanic gifted program students.
There were no minority-group differences in academic or social self-concept.
Results also suggest that the distinction between academic and social self-
concept used with white students may not be applicable to minority students.
Aberson, Healy and Romero (2000) examined the relationship
between self-esteem and in-group bias. He focused on effects of in-group bias
strategy and measurement of self-esteem. Results indicated that both high and
low self-esteem individuals exhibited in-group bias; however, expression of
in-group bias by individuals with low self-esteem is constrained by situational
factors. Additionally, individual-level factors such as personal self-esteem
may be usefiil in predicting collective enhancement.
Kavussanu and Hamisch (2000) examined the relationship of global
orientations and perceptions of athletic ability to global self-esteem. Results
showed that high task orientated children reported significantly higher self-
esteem than low task oriented children. Among high task oriented boys, those
with high-perceived ability had higher self-esteem. In addition high ego
oriented boys had higher self-esteem when they perceived themselves as
having high ability in relation to their peers. Finally, among low oriented
girls, those with high-perceived ability reported higher self-esteem.
74
Willoughby, Polatajko, Currado, Harris et al (2000) examined the
self- esteem of adolescents with mental health problems referred to a pre-
vocational program in an effort to compare clinical practice with empirical
findings. The self-perception profile for adolescents and the importance rating
scale for adolescents were used to compare the self-esteem of the adolescents
with normative sample. Results indicated no differences between the two
groups' self-esteem and no change in self-esteem scores following
participation in the prevocational program.
Twenge and Campbell (2002) analyzed that socio-economic status
has a small but significant relationship with self-esteem. Higher socio
economic status individuals report higher self-esteem. The effect size is very
small in young children, increases during young adulthood, continues higher
in middle age, and is then smaller for adults over the age of 60. The effect size
increased over time for women but decrease for men. Asian and American
show higher effect size and occupation and education produce higher
correlation with self-esteem than income does.
EMOTIONAL STABILITY
Reviewed studies on emotional stability showed that visually
handicapped were less emotionally stable than sighted students. Many
scholars concluded in their studies that male students are more emotionally
stable than female students. Several investigations revealed that children with
high emotional stability have better study habits than their counterparts with
low emotional stability.
Bhargava and Lavania (1981) compared the personality factors of
sensory disabled and normal children having same age and sex. The result
75
showed that the sensory disabled were more reserved emotionally unstable,
shy, dependent, sentimental, secure and relaxed than their counterparts i.e. the
normal children. Kapoor and Sen (1984) made a comparative study of the
congenitally and adventitiously blind and their sighted peers on some
personality variables. The results indicated that the congenitally and
adventitiously blind group does not differ significantly from each other or
from their sighted peers on the personality variables, emotional stability,
perceptual rigidity and social responsibility.
Rath (1988) compared the personality dynamics of blind and sighted
students. The result showed that the blind subjects were less adjusted on the
dimensions of family relationship, emotional stability, adjustment to reality,
mood and conformity in comparison to sighted students. Goel and Sen (1985)
reported a few studies which were carried out recently in the context of
personality dimension of the visually handicapped. The results showed a large
number of the subjects have poor self-concept and emotional stability, below
average intelligence and physical dependence.
Sharma (2006) purports to find out the efficacy of emotional stability
on the study habits of visually disabled students. The results reveal that
children with high emotional stability have better study habits than their
counterparts with low emotional stability.
Ophir-Cohen et al (2005) examined the developmental attachments of
both children with visual impairments, with and without emotional deficits,
behavior deficits or both. He found that an emotional and behavioral deficit
was significantly related to gross motor and visual motor integration,
expressive and receptive language, and social and personal development, and
76
that there was an interaction between the effect of the mother's education and
the child's age on the child's perception of language.
Dyck et al (2004) assessed whether children with a sensory disability
have consistent delay in acquiring emotion recognition and emotion
understanding abilities. Younger and older hearing-impaired children, vision
impaired children, and children with no sensory impairment were assessed.
Results indicated that when compared with age-peers, hearing impaired
children and adolescents have significant delays or deficits on emotional
recognition tasks. When compared children group-matched for verbal ability,
the achievement of hearing impaired on ERS equals or exceeds that of
controls; visually impaired children underachieve on an emotion recognition
task and over achieve on an emotion vocabulary task compared to verbal
ability match peers.
Borrela et al (1999) assessed the relationship between a stable
personality trait, a mood state and immune response to examination stress. A
self-reported measure of emotional stability was obtained in a sample of 39
subjects. Emotional stability was investigated by completing a neuroticism
scale and a state-trait anxiety scale. Natural killer cell activity was measured
at base line, long before the examination time, and on the examination day.
Subjects were divided in to 3 groups based on emotional stability and state-
anxiety scores, high emotional stability/low anxiety, medium and low
emotional stability/high anxiety. Examination stress induced significant
increase in natural killer cell activity in the high emotional stability/low
anxiety group, no effect in the medium group, and significant decrease in the
low emotional stability/high anxiety group. Findings suggest that the state-
)f I
anxiety acts in concert with a stable personality tra(t^^mQdulate-flj(ku;krkiller
response in healthy subjects exposed to psychological nafuralisticstress.
Gumora and Arseni (2002) investigated the connections of middle
school students' emotional dispositions and academic related affect with their
school performance. Results indicated that although students' emotion
regulation, general effective dispositions and academic effect were related to
each other, each of these variables also made a unique significant contributor.
Overall, these results provide support for the socio-emotional factors in
students' school performance.
Chowdhury (2006) investigated the impact of personality traits on
students' academic achievement in an undergraduate marketing course taught
by the same professor. All personality traits except extraversion positively
and significantly predicted students' overall grade. Extraversion was
positively related (r =.140) but not statistically significant. Openness (r=.279)
and Neuroticism (r=.341) were positively related to students' academic
achievement and were more important predictors of overall grade of the
students than agreeableness (r =.245) and conscientiousness (r=.237).
Susan and Lounsbury (2004) studied general intelligence, Big Five
personality traits, and the construct Work Drive in relation to two measures of
collegiate academic performance: a single course grade received by
undergraduate students in an introductory psychology course, and self-
reported GPA. Result showed that general intelligence and Work Drive were
significantly positively related to both course grade and GPA, while one Big
Five trait (Emotional Stability) was related to course grade only.
78
Lowenstein, Meza and Thome (1983 ) investigated the relationship
between ability, attainment and emotional stability, as measured by
neuroticism, in underachieving, emotionally disturbed children. Forty children
participated in four groups. Three experimental groups received different
treatments in a therapeutic community, the fourth (control group) comprised
children attending remedial units in mainstream education. For group 1
emphasis was on individualized education; for group 2 on psychological
treatment and for group 3 on individualized education and psychological
treatment combined. Pre- and post-experiment assessments were made on
emotional stability, intelligence, reading, spelling and math's quotients,
vocational aspirations and contentment with life. All the experimental groups
showed significant improvements on all the criteria assessed. Group 3
improved most, P less than 0.001 on all criteria except contentment and
vocational aspirations. The control group showed deterioration over the
experimental year on all criteria but mostly not at a significant level.
Barthelemy (2006) determined whether aggression adds incremental
validity above and beyond the big five personality factors in predicting
academic success. Results indicated that aggression does in fact add
incremental validity above and beyond the big five personality factors in a
sample of middle school students. Results also indicated that the big five
personality factors are significantly correlated with academic performance.
More specifically, conscientiousness, openness, agreeableness, and emofional
stability are significantly correlated with grades in the current sample. When
aggression is added in to the statistical model, conscientiousness, openness
and aggression are significantly correlated with grades.
79
Lorenzo, Frost and Reinherz (2000) described the academic and
psychosocial functioning of 102, 16-20 yr old Asian American adolescents
and compared their academic, behavioral and emotional functionmg and
social support with that of cohort of predominately Caucasian American
adolescents. They found that Asian American students performed better
academically and reported fewer delinquent behaviors. However these Asian
American youth reported higher levels of depressive symptomalogy,
withdrawn behavior, and social problems. They also perceive themselves
more poorly and were more dissatisfied with their social support. These
differences highlight the unique mental health needs of older Asian American
youth.
Blanty, Jalinck, Blizkovska and Klimusova (2004) analyzed the
relationship of self-esteem and life satisfaction to factors of the Five Factors
model of personality. They found that both self-esteem and life satisfaction
are connected with emotional stability, extra version and consciousness.
Agreeableness is related to life satisfaction, but not to self-esteem. The
divergence between self-esteem and life satisfaction is also based on the
difference between the closeness of their relations towards neuroticism, the
correlation between self-esteem and neuroticism is significantly higher than
that between life satisfaction and neuroticism.
Ignatus and Kokkonen (2005) aimed to classify, how the Big Five
personality traits are linked to generalized trust and general self-esteem,
taking into consideration the mediating role of sex. Two samples are used,
121 secondary school students formed one sample and 130 university students
formed other. Results showed that the averages of the university students in
80
the all traits studied significantly higher than those of the secondary school
students. Both the boys and the men were more stable emotionally stable than
the girls and the women. The boys in secondary school also have higher self-
esteem than the girls. Results also revealed that the big five traits explained
substantial part of the variation of both generalized trust as well as general
self-esteem in both samples.
Judge et al (2004) presented a review of research on core self-
evaluations, a broad personality trait indicated by 4 more narrow traits: self-
esteem, generalization self efficacy, locus of control, and emotional stability.
They found that the 4 core traits are highly related, load on a single unitary
factor, and have dubious incremental validity controlling for their common
core.
Tolphin et al (2004) examined the role of border line personality
feature in the day-to-day stability of college students' negative affect and self-
esteem and their reactivity to interpersonal stressors. For two week at the end
of each day student completed a checklist of daily stressors and measure of
state affect and self-esteem. They predict that the person who scores high on a
measure of borderline feature would be related to more interpersonal
stressors, great negative affective and self-esteem reactivity to these stressors,
and less day-to-day carryover of negative mood and self-esteem. The findings
demonstrate the utility of a daily process methodology and multilevel
modeling to study the day-today, functioning of individual with borderline
feature.
Cosbay (2001) examined clothing interest as a mediating factor in
self-perception of sociability, emotional stability, and dominance when either
81
satisfaction or dissatisfaction with clothing was specified. Results revealed
that specific dimensions of clothing interest suggesting a risk-avoiding
orientation toward dress were most likely to mediate self-perceptions of
sociability, emotional stability and dominance when one was either satisfied
or dissatisfied with one's clothing.
Stemelova and Cmaricova (2004) investigated mutual relations
between personality factors, existential characteristics and subjectively
perceived self-esteem. Results revealed that the level of self-esteem
negatively correlates with that of personality factor neuroticism and positively
with the level of extraversion, consciousness, the existential characteristics
personality, existentiality and the overall ESK scores. Personality and
existentiality showed statistically significant positive correlation with the
factors extraversion, agreeableness and consciousness, similarly as also did
the over all. ESK scores which, in addition, showed a significant negative
correlation with neuroticism. The result obtained brought support to the
presumed relations among existential characteristics, personality factor and
self-esteem.
Makikangas, Kinnunen, and Feldt (2004) investigated the
relationship between self-esteem and optimism and examined the prospective
relationships between these two personality constructs, mental distress and
physical symptoms. Results showed that latent variables of optimism and self-
esteem were highly interrelated, forming the core construct of personal
construct of personal resilience, which turned out to be stable over the one-
year period. Results also indicated that high personal resilience measured at
timel reduced mental distress at time 2. Furthermore, a high level of physical
82
symptoms at time 1 showed to predict a high level of mental distress at
time 2.
Aleem (2005) sets the following objectives: 1. To find out the
prevalence of emotional stability among male and female students. 2. To
examine difference between the mean scores of male and female students on
emotional stability. Emotional stability questionnaire was administered on 50
male and 50 female students of different colleges of New Delhi. Results
showed that male students are found to be more emotionally stable than
female students. Hay and Ashman (2003) investigated gender differences
associated with the development of adolescents' sense of general self-concept
and emotional stability were investigated with 655 adolescents. Relationships
with parents were important for males' emotional stability, but not females'.
Peer relations were more influential in the formation of adolescents' emotional
stability than parental relationships.
Budaev (1999) examined the sex differences of students in the big
five-personality structure, as assessed by combined Jackson personality
inventory and personality research form scales. This study tested the
hypotheses that the personality factors which lies between classical
agreeableness vs. hosdlity and neuroticism vs. emotional stability is the basic
dimension of dominance related aggressiveness maintained by frequency
dependent selection. The hypothesis predicts that this personality factor
should explain more variance in males than females. Results showed that
females characterized by higher scores on the personality factor of
agreeableness and low emotional stability vs. the personality factor of
hospitality and high emotional stability. As predicted, the personality factor of
83
agreeableness and low emotional stability explained significantly more
variance in males than females, both absolutely and in relation to other
personality factor.
Hills and Argyle (2001) studied the relationship between happiness
and extraversion and emotional stability. Result showed that emotional
stability more strongly associated with happiness than extraversion, and
account for more of the total variability in multiple regression. Emotional
stability was also the greater correlate for a majority of the 29 items of the
oxford happiness inventory, and the sole significant predictor of the happiness
of younger people.
Vitters (2001) tested the relationship between emotional stability,
extraversion, and subjective well being of students. It was hypothesized that
the effect from emotional stability on subjective well-being indicators (life
satisfaction, presence of affect and absence of negative effect) is stronger than
the corresponding for, the effect from extraversion. Moreover, it was
anticipated that if emotional stability were controlled for the effect from
extraversion on subjective well-being would decrease substantially. In several
multiple variances accounted for by emotional stability was 34%, while
similar figure for extraversion were 1%.
Satapathy and Singhall (2001) examined the significant variables
(e.g. age of onset, severity of impairment, parents' education and occupation,
family income, parental impairment status and preschool education) as
correlates and predictors of social emotional adjustments of 75 visually and
80 hearing impaired adolescents. Results revealed behavior problems, stress
and academic performance to be the common predictors of and contributors to
84
social emotional adjustment. No background variables contributed to
adjustment in the case of visually impaired students but family income and
parents deafness contributed positively in the hearing impaired students.
Colbert et al. (2004) focused on the joint relationship of personality
and perceptions of the work situation with deviant behavior. He found that
positive perceptions of the work situation are negatively related to workplace
deviance. He also found that the personality traits if conscientiousness,
emotional stability, and agreeableness moderated this relationship specifically
the relationship between perceptions of the developmental environment and
organizational deviance was stronger for employees low in conscientiousness
or emotional stability, and relationship between perceived organizational
support and interpersonal deviance was stronger for employees low in
agreeableness.
Any scientific research programme has to be systematic, controlled,
empirical and critical investigation of hypothetical proposition, about the
presumed relationship among different variables. It involves systematic and
sound procedures in order to achieve objectivity in finding the results .In
order to enhance the objectivity as well as predictive value of the findings, it
becomes imperative to choose an appropriate research design. Selection and/
or development of the relevant standardized tools and tests, identification of
adequate sampling for collecting data, the careful tabulation and analysis of
data by administering the appropriate statistical techniques and finally the
interpretation of the results in accordance with the problem, are the major
steps being taken throughout the research process. The present endeavour
aims to study creative experience and academic achievement as determinants
of self esteem and emotional stability of visually handicapped students.
To meet these objectives the following methodology was adopted.
Participants
A sample of 200 students was chosen through non probability
convenient sampling. Of these, 100 students were visually handicapped and
the remaining 100 students were sighted one. The sample of visually
handicapped students were selected from Ahmadi School for Blinds, Aligarh
Muslim University, Aligarh and the sample of sighted students were drawn
from Union School of Aligarh Muslim University, Aligarh. The sample of
visually handicapped students consisted 63 boys and 37 girls and in the
sample of sighted students there were 50 boys and 50 girls. The upper age
limit of the sample is 19 years. The general information or the family
background of the visually handicapped sample is that 70% of them belong to
nuclear family system while 30% students have joint family system. In case of
86
sighted students as high as 80% students live in the nuclear family system and
only 20% belong to the joint family system. It means a large number of students
belong to the nuclear family system. In case of area of living 29% visually
handicapped students belong to rural area and 71% belong to urban area whereas
5% sighted students belong to rural area and 95% belong to urban area.
The socio economic status of the parents is one of the major indicators of
the psychological and behavioural characteristics of the sampled population. The
socio economic status of the parents has been assessed with the help of education
levels, employment structure and income levels.
The educational profile of visually handicapped students' parents shows
that 12% parents have primary education while a higher percentage of secondary
level education can be seen that is 39%). The college/university educated parents'
percentage is 26%. A total of 22.5% parents are uneducated. On the other hand
the 16.5%) parents of the sighted students have primary education. The secondary
and college/university levels education is 31.5% and 25.5% respectively. A
formidable 26.5%) parents are uneducated in the sighted students' sample. A
comparative assessment of education levels of both the sample students reveal
that visually handicapped students' parents have higher education levels than the
sighted student's parents. The employment structure of the sampled visually
handicapped students' parents showed that out of total employed parents 30.9%
are employed in the public sector/government services and 69.1%) have the
private sector employment. Whereas the sighted students' parents have 24.5%)
public sector employment and as high as 75.5% private sector employment. It
means the visually handicapped students parents are more employed in
government services than the normal students' parents. The most important
indicator of socio economic status is income. The average monthly income of the
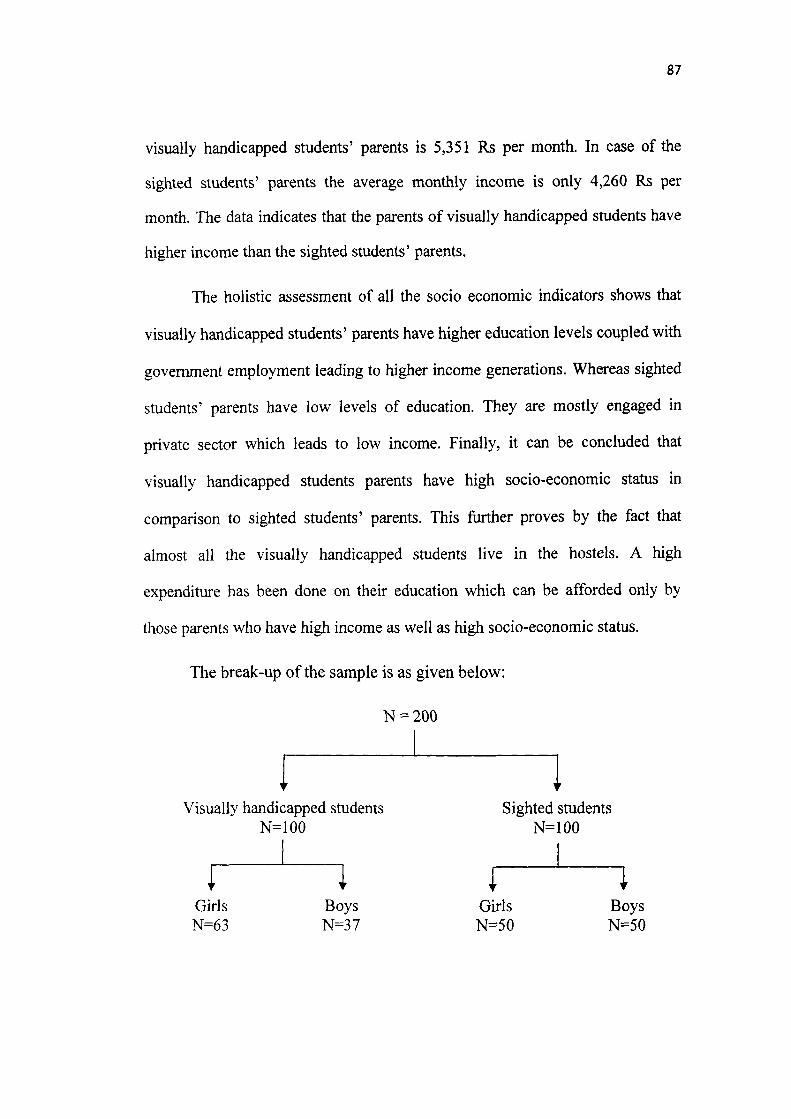
87
visually handicapped students' parents is 5,351 Rs per month. In case of the
sighted students' parents the average monthly income is only 4,260 Rs per
month. The data indicates that the parents of visually handicapped students have
higher income than the sighted students' parents.
The holistic assessment of all the socio economic indicators shows that
visually handicapped students' parents have higher education levels coupled with
government employment leading to higher income generations. Whereas sighted
students' parents have low levels of education. They are mostly engaged in
private sector which leads to low income. Finally, it can be concluded that
visually handicapped students parents have high socio-economic status in
comparison to sighted students' parents. This further proves by the fact that
almost all the visually handicapped students live in the hostels. A high
expenditure has been done on their education which can be afforded only by
those parents who have high income as well as high socio-economic status.
The break-up of the sample is as given below:
N = 200
1 r
Visually handicapped students N= 100
T T
Girls Boys N=63 N=37
1 '
Sighted students N= 100
i i Girls Boys N=50 N=50
88
Tools
In the present study the researcher used the following tools to measure
the academic achievement, creative experience, self-esteem and emotional
stability of visually handicapped and sighted students.
Demographic Information Sheet
Demographic information about gender, age, class, family system and
area of living were obtained on a separate sheet.
The Measure of Academic Achievement
For measuring academic achievement, the researcher had used the
annual examination marks of the students obtained from the office records of
the institution.
The Measure of Creative Experience
The creative experience of the students is measured by ratings of their
concerned teachers on a five-point scale.
Self-Esteem Inventory
Self-esteem of the students is measured through self-esteem inventory,
developed by Prasad and Thakur (1977). It consisted of 30 items which were
selected from a list of 65 items representing self of the individual. Of the
thirty items, seventeen were socially desirable and thirteen were socially
undesirable. The scale was developed with a view to assess personally
perceived self and socially perceived self. Although two identical sets of
statements were used, they differed with regard to the instructions. Personally
perceived self was to be assessed on the basis of following instructions:
"There are some statements in this inventory. You please read these
statements one by one carefully. Each statement has a seven-point answer
scale, from completely true to completely false. You are requested to encircle
89
the point of the scale related to the particular statement which in your
personal opinion is most suitable in. your case. Kindly go through all the
statements one by one and see that none is left over".
Socially-perceived self was to be determined on the basis of the following
instructions:
"Again you are given the same set of statements. On the last occasion
you rated yourself on the basis of your personal opinion, related to the
statements, but this time you have to rate yourself on the basis of your idea
about what others think of you on those statements. Other things remaining
the same you have to reply to the items of the inventory",
Scoring
Scoring of the scale was done as follows:
The item which are socially desirable would get 7 score if answered
completely true and 1 if answered completely false. Other intermediate
answers would get scores accordingly. The socially undesirable items would
be scored in the opposite manner, i.e. the completely false would get 7 score
and completely true would get 1 score. An individual who has taken both the
sets of the inventory will have two-cross-one for the personally perceived self
and the other for the socially perceived self. For each inventory the maximum
score an individual can get is 210 and the minimum score 30.
Reliability
The two sets of the inventory were administered by the authors (Prasad
& Thakur 1997) to a sample of 400 students for finding the reliability of the
scale. Split-half reliability coefficient were calculated for both sets of the
inventory which came out to be .82 and .78 for personally perceived self and
socially perceived self respectively . Of the 400 students, 150 students were
90
administered the two sets of the inventory again after a gap of six weelcs for
evaluating after retest reliability co efficient. Retest reliability coefficient
found for both the tests were.69 and .66 respectively for personally perceived
self and socially perceived self
Emotional Stability Test for Children
Emotional stability of children is measured through Emotional
Stability Test for Children, developed by Sengupta and Singh (1985). This
scale contains 15 items for testing emotional stability of children. The
maximum possible score of this test is 15.
Scoring
In emotional stability test for children, each item of the test is scored as
either +1 or 0. There are two types of items in this test, that is, positive and
negative. All positive items which are endorsed by the subjects as 'Yes' and
the negative items, item no. 9 and 10 which are endorsed by the subject as
'No' are given a score of+1. A score of zero is given to all other answers.
Thus high scores on the test indicate low emotional stability or control
whereas low scores on the test indicate high emotional stability or control.
Reliability
The reliability of the emotional stability was computed through two
methods. In test- retest reliability, the test was administered twice on a sample
of 150 pupils with 14 days gap. Subsequently, Pearson r was computed
between the two sets of scores. The obtained value of Pearson r was .70 which
was significant beyond .01 level. For the split-half relialjility of the test, it was
administered on a fresh sample of 150 pupils of both rural and urban
population. For the split half reliability of the test, it was again administered
91
on a fresh sample of 150 pupils. Subsequently the test was splitted by the odd-
even method. The resulting odd-even correlation coefficient was .55.
DESIGN:
In this study the researcher has to probe into some of the factors, viz
creative experience and academic achievement that determines the self esteem
and emotional stability of visually handicapped students. In the present
research creative experience and academic achievement are the mdependent
variables whereas self-esteem and emotional stability are the dependent
variables.
Academic achievement is being measured through the annual
examination marks of the students.
Creative experience of students is being estimated through ratings of
their concerned teachers on five point scale. In this scale, students who
attained 1 rating by their teachers, it means those students have very poor
creative experience. The students who got 2 rating have poor creative
experience. 3 rating has been given to those students who have average
creative experience. However, 4 rating showed the students who got good
creative experience. And finally students who acquired 5 rating have very
good creative experience. The questions asked to the teachers are based on
following dimensions:
1. Games.
2. Paintings.
3. Music.
4. Solving puzzles.
5. Make unique things by simple object.
6. Singing.
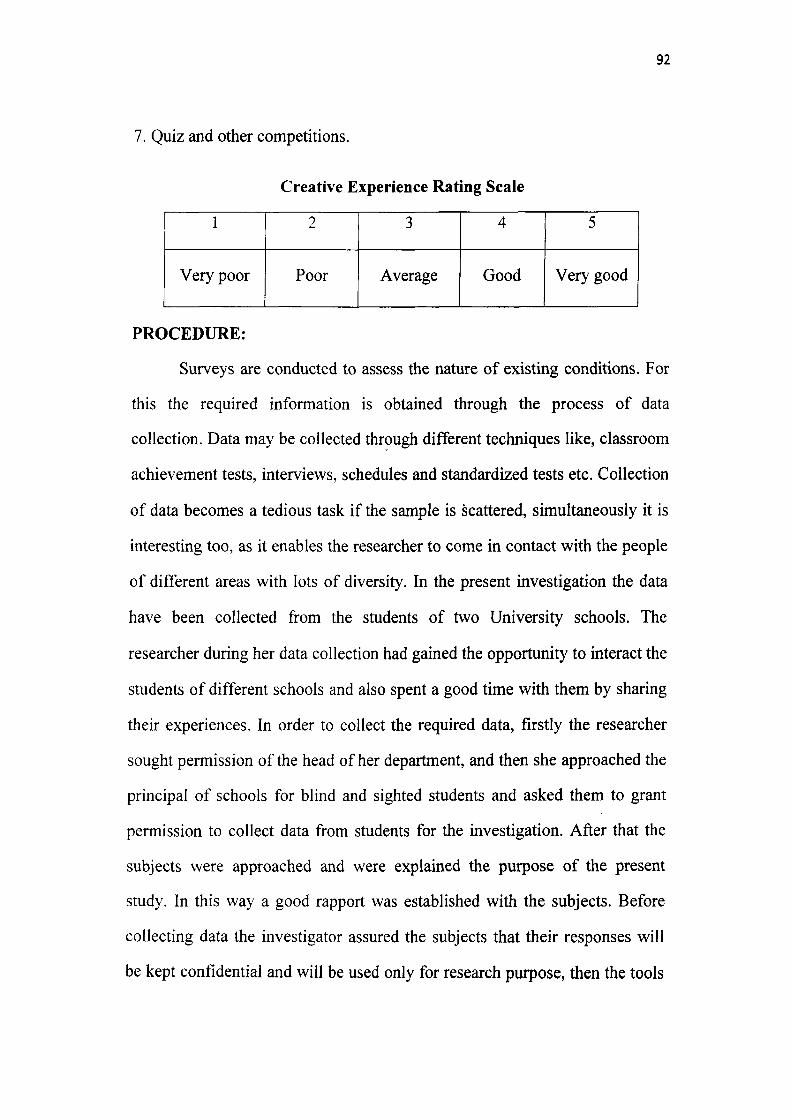
7. Quiz and other competitions.
92
Creative Experience Rating Scale
1
Very poor
2
Poor
3
Average
4
Good
5
Very good
PROCEDURE:
Surveys are conducted to assess the nature of existing conditions. For
this the required information is obtained through the process of data
collection. Data may be collected through different techniques like, classroom
achievement tests, interviews, schedules and standardized tests etc. Collection
of data becomes a tedious task if the sample is scattered, simultaneously it is
interesting too, as it enables the researcher to come in contact with the people
of different areas with lots of diversity. In the present investigation the data
have been collected from the students of two University schools. The
researcher during her data collection had gained the opportunity to interact the
students of different schools and also spent a good time with them by sharing
their experiences. In order to collect the required data, firstly the researcher
sought permission of the head of her department, and then she approached the
principal of schools for blind and sighted students and asked them to grant
permission to collect data from students for the investigation. After that the
subjects were approached and were explained the purpose of the present
study. In this way a good rapport was established with the subjects. Before
collecting data the investigator assured the subjects that their responses will
be kept confidential and will be used only for research purpose, then the tools
93
were administered on them and the investigator explained the items to the
participants.
Statistical analysis
Scientific explanation of any finding is not possible unless some
statistical treatments have been given to the data obtained. Statistics provide
very clear picture of the results only in the form of its numerical results.
Therefore, statistical treatment to the data obtained is inevitably necessary to
become sure about the reliability pattern of the result as well. Analysis means
categorizing, reducing and summarizing data to obtain results of research
problems.
Appropriate statistics were used to fulfil the research objectives. In the
present investigation, researcher had used SPSS 15.0 package for undertaking
Product-moment coefficient of correlation, t-test and Regression analysis.
Pearson product-moment coefficient of correlation is the most widely used
method of measuring the degree of relationship between two variables. In this
study Pearson product moment correlation method was applied for
determining the relationship between creative experience, academic
achievement, self-esteem and emotional stability. Inter group comparisons
were conducted by applying t-test.
Regression analysis is considered to be the most usefiil technique
because it ascertains the influence of several independent variables on the
dependent one. In the present study there are two independent variables i.e.
creative experience and academic achievement and two dependent variables
i.e. self-esteem and emotional stability through this technique the researcher
intends to determine the significant predictors of criterion or dependent
variables. Thus regression analysis was used by the investigator.
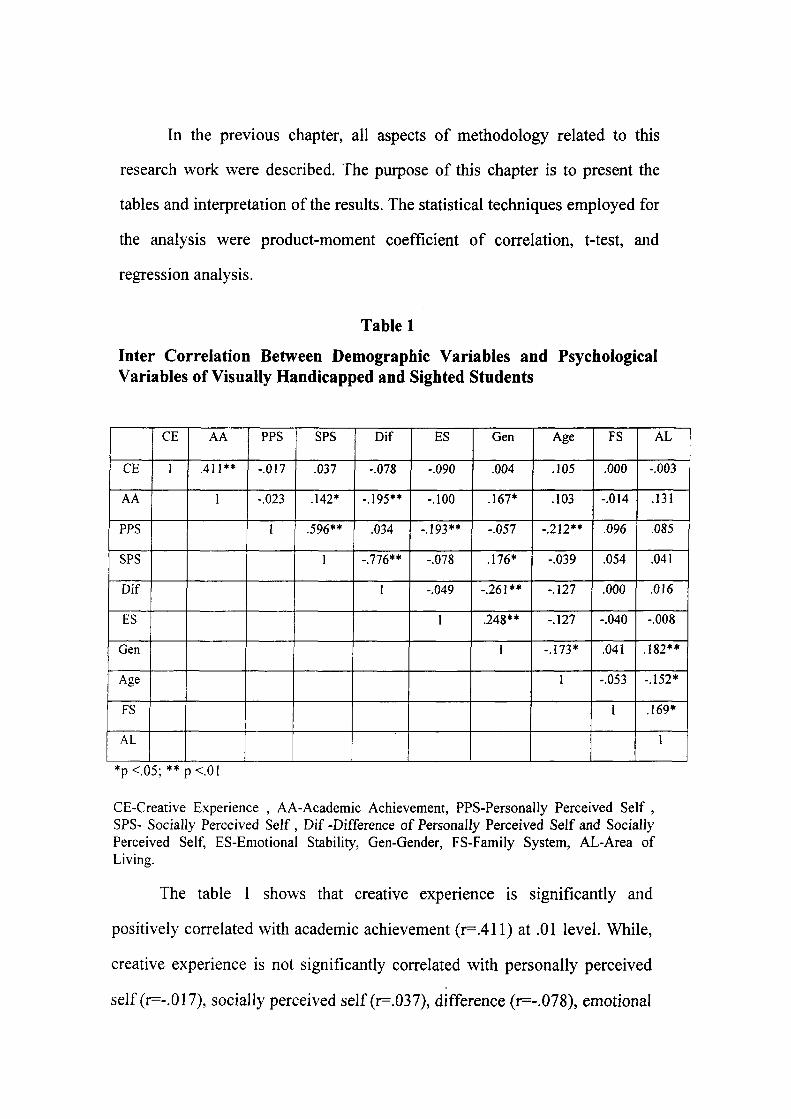
In the previous chapter, all aspects of methodology related to this
research work were described. The purpose of this chapter is to present the
tables and interpretation of the results. The statistical techniques employed for
the analysis were product-moment coefficient of correlation, t-test, and
regression analysis.
Table 1
Inter Correlation Between Demographic Variables and Psychological Variables of Visually Handicapped and Sighted Students
CE
AA
PPS
SPS
Dif
ES
Gen
Age
FS
AL
CE
1
AA
.411**
1
PPS
-.017
-.023
I
SPS
.037
.142*
.596**
1
Dif
-.078
-.195**
.034
-.776**
1
ES
-.090
-.100
-.193**
-.078
-.049
1
Gen
.004
.167*
-.057
.176*
-.261**
.248**
1
Age
.105
.103
-.212**
-.039
-.127
-.127
-.173*
1
FS
.000
-.014
.096
.054
.000
-.040
.041
-.053
I
AL
-.003
.131
.085
.041
.016
-.008
.182**
-.152*
.169*
1
*p<.05;**p<.01
CE-Creative Experience , AA-Academic Achievement, PPS-Personaily Perceived Self , SPS- Socially Perceived Self , Dif -Difference of Personally Perceived Self and Socially Perceived Self, ES-Emotional Stability, Gen-Gender, FS-Family System, AL-Area of Living.
The table 1 shows that creative experience is significantly and
positively correlated with academic achievement (r=.411) at .01 level. While,
creative experience is not significantly correlated with personally perceived
self (r=-.017), socially perceived self (r=.037), difference (r=-.078), emotional
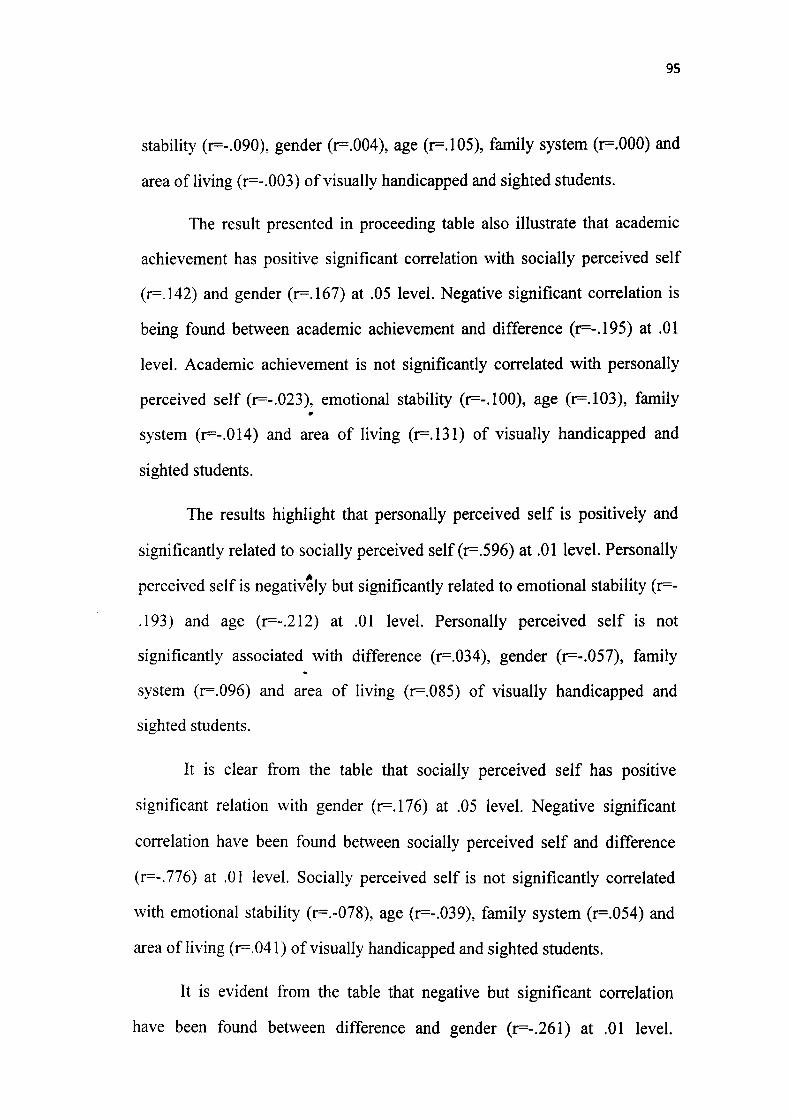
95
Stability (r=-.090), gender (r=.004), age (r=.105), family system (r=.000) and
area of living (r=-.003) of visually handicapped and sighted students.
The result presented in proceeding table also illustrate that academic
achievement has positive significant correlation with socially perceived self
(r=.142) and gender (r=.167) at .05 level. Negative significant correlation is
being found between academic achievement and difference (r=-.195) at .01
level. Academic achievement is not significantly correlated with personally
perceived self (r=-.023), emotional stability (r=-.100), age (r=.103), family m
system (r=-.014) and area of living (r=.131) of visually handicapped and
sighted students.
The results highlight that personally perceived self is positively and
significantly related to socially perceived self (r=.596) at .01 level. Personally
perceived self is negatively but significantly related to emotional stability (r=-
.193) and age (r=-.212) at .01 level. Personally perceived self is not
significantly associated with difference (r=.034), gender (r=-.057), family
system (r=.096) and area of living (r=.085) of visually handicapped and
sighted students.
It is clear from the table that socially perceived self has positive
significant relation with gender (r=.176) at .05 level. Negative significant
correlation have been found between socially perceived self and difference
(r=-.776) at .01 level. Socially perceived self is not significantly correlated
with emotional stability (r=.-078), age (r=-.039), family system (r=.054) and
area of living (r=.041) of visually handicapped and sighted students.
It is evident from the table that negative but significant correlation
have been found between difference and gender (r=-.261) at .01 level.
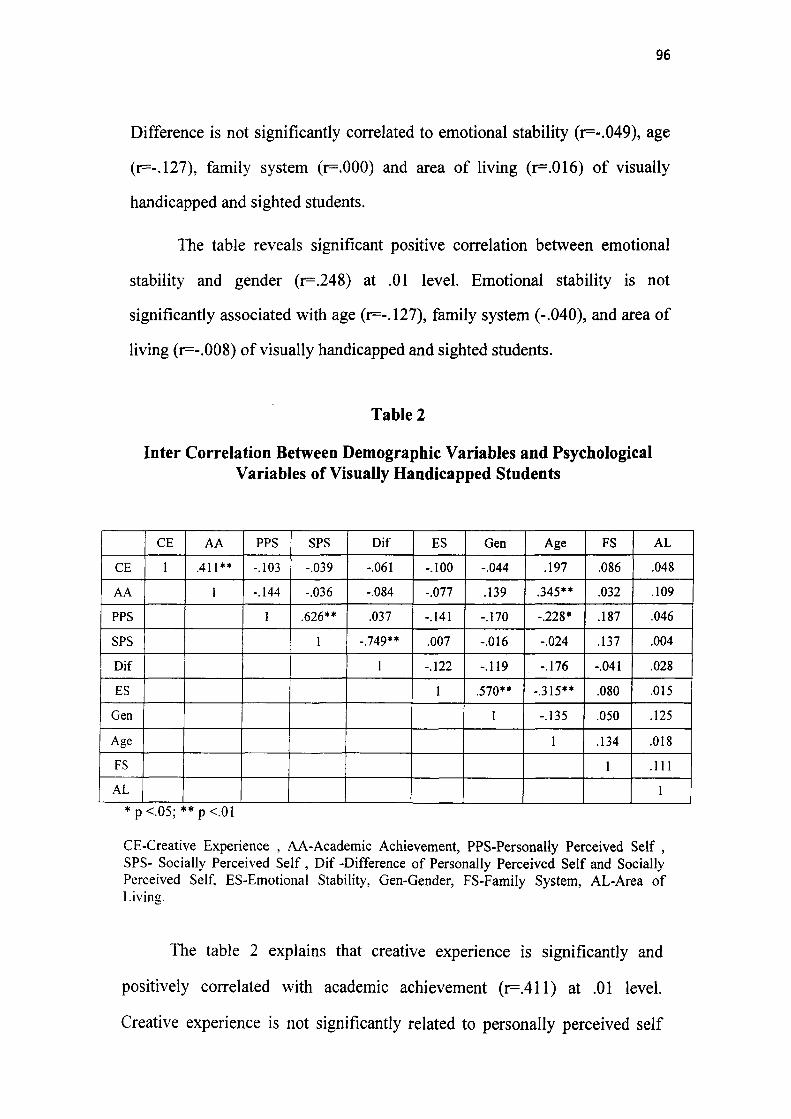
96
Difference is not significantly correlated to emotional stability (r=-.049), age
(r=-.127), family system (r=.000) and area of living (r=.016) of visually
handicapped and sighted students.
The table reveals significant positive correlation between emotional
stability and gender (r=.248) at .01 level. Emotional stability is not
significantly associated with age (r=-.127), family system (-.040), and area of
living (r=-.008) of visually handicapped and sighted students.
Table 2
Inter Correlation Between Demographic Variables and Psychological Variables of Visually Handicapped Students
CE
AA
PPS
SPS
Dif
ES
Gen
Age
FS
AL
CE
1
AA
.411**
1
PPS
-.103
-.144
1
SPS
-.039
-.036
.626**
1
Dif
-.061
-.084
.037
-.749**
1
ES
-.100
-.077
-.141
.007
-.122
1
Gen
-.044
.139
-.170
-.016
-.119
.570**
1
Age
.197
.345**
-.228*
-.024
-.176
-.315**
-.135
1
FS
.086
.032
.187
.137
-.041
.080
.050
.134
1
AL
.048
.109
.046
.004
.028
.015
.125
.018
.111
1
*p<.05; **p<.01
CE-Creative Experience , AA-Academic Achievement, PPS-Personally Perceived Self , SPS- Socially Perceived Self , Dif -Difference of Personally Perceived Self and Socially Perceived Self, ES-Emotional Stability, Gen-Gender, FS-Family System, AL-Area of Living.
The table 2 explains that creative experience is significantly and
positively correlated with academic achievement (r=.411) at .01 level.
Creative experience is not significantly related to personally perceived self
97
(r=-.103), socially perceived self (r=-.039), difference (r=-.061), emotional
stability (r=-.100), gender (-.044), age (r=.197), family system (r=.086) and
area of living (r=.048) of visually handicapped students.
It can also be observed from table that academic achievement is
significantly and positively correlated with age (r=.345) at .01 level.
Academic achievement is not significantly correlated with personally
perceived self (r=-. 144), socially perceived self (r=-,036), difference (-.084),
emotional stability (r=-.077), gender (r=.139), family system (r=.032) and
area of living (r==.109) of visually handicapped students.
It is being noticed from table that there is significant positive
correlation between personally perceived self and socially perceived self
(r=.626) at .01 level. Personally perceived self is negatively but significantly
correlated with age (r=-.228) at .05 level. Personally perceived self is not
significantly correlated with difference (r=.037), emotional stability (r=-.141),
gender (r=-.170), family system (r=.187) and area of living (r=.046) of
visually handicapped students.
The table also mentions that socially perceived self is negatively but
significantly correlated with difference (r=-.749) at .01 level. Socially
perceived self is not significantly correlated with emotional stability (r=.007),
gender (r=-.016), age (r=-.024), family system (r=.137) and area of living
(r=.004) of visually handicapped students.
The table defines that difference has no significant correlation with
emotional stability (r=-.122), gender (r=-.119), age (r=-.176), family system
(r=-.041), and area of living (r=.028) of visually handicapped students.
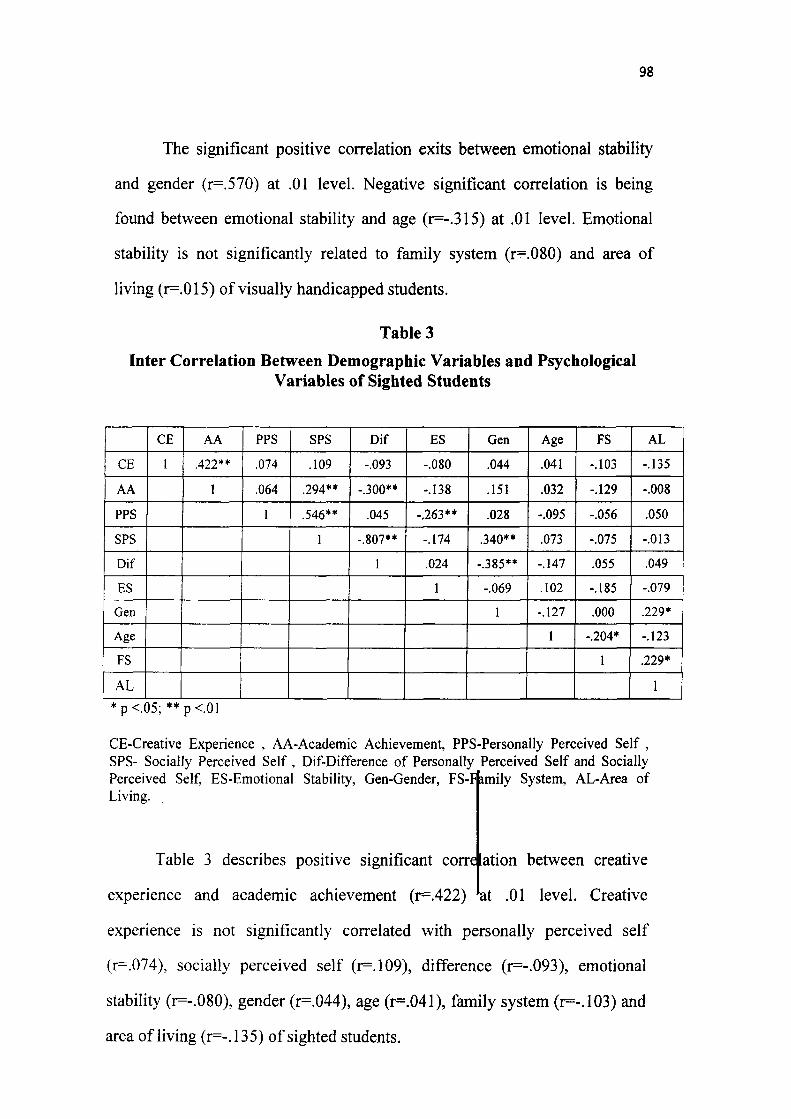
98
The significant positive correlation exits between emotional stability
and gender (r=.570) at .01 level. Negative significant correlation is being
found between emotional stability and age (r=-.315) at .01 level. Emotional
stability is not significantly related to family system (r=.080) and area of
living (r=.015) of visually handicapped students.
Table 3
Inter Correlation Between Demographic Variables and Psychological Variables of Sighted Students
CE
AA
PPS
SPS
Dif
ES
Gen
Age
FS
AL
CE
1
AA
.422**
1
PPS
.074
.064
1
SPS
.109
.294**
.546**
1
Dif
-.093
-.300**
.045
-.807**
1
ES
-.080
-.138
-.263**
-.174
.024
1
Gen
.044
.151
.028
.340**
-.385**
-.069
1
Age
.041
.032
-.095
.073
-.147
.102
-.127
1
FS
-.103
-.129
-.056
-.075
.055
-.185
.000
-.204*
1
AL
-.135
-.008
.050
-.013
.049
-.079
.229*
-.123
.229*
1
*p<.05;**p<.01
CE-Creative Experience , AA-Academic Achievement, PPS-Personally Perceived Self , SPS- Socially Perceived Self , Dif-Difference of Personally Perceived Self and Socially Perceived Self, ES-Emotional Stability, Gen-Gender, FS-F^mily System, AL-Area of Living.
Table 3 describes positive significant corre ation between creative
experience and academic achievement (r=.422) at .01 level. Creative
experience is not significantly correlated with personally perceived self
(r=.074), socially perceived self (r=.109), difference (r=-.093), emotional
stability (r=-.080), gender (r=.044), age (r=.041), family system (r=-.103) and
area of living (r=-.135) of sighted students.
99
It is being noticed from table 3 that positive significant correlation
have been found between academic achievement and socially perceived self
(r=.294) at .01 level. Academic achievement is negatively but significantly
correlated with difference (r=-.300) at .01 level. Academic achievement is not
significantly associated with personally perceived self (r=.064), emotional
stability (r=-.138), gender (r=.151), age (r=.032), family system (r=-.129) and
area of living (r=-.008) of sighted students.
The table displays that personally perceived self is positively and
significantly associated with socially perceived self (r=.546) at .01 level.
Negative significant correlation is being found between personally perceived
self and emotional stability (r=-.263) at .01 level. Personally perceived self is
not significantly correlated with Difference (r=.045), gender (r=.028), age (r=-
.095), family system (r=-.056) and area of living (r=.050) of sighted students.
The table describes that socially perceived self is significantly
correlated with gender (r=.340) at .01 level. Negative significant correlation
have been found between socially perceived self and difference (r=-.807) at
.01 level. Socially perceived self is not significantly correlated with emotional
stability (r=-.174), age (r=.073), family system (r=-.075) and area of living
(r=-.013) of sighted students.
It can also be drawn from table that difference is negatively but
significantly associated with gender (r=-.385) at .01 level. Difference is not
significantly correlated with emotional stability (r=.024), age (r=-.147),
family system (r=.055) and area of living (r=.049) of sighted students.
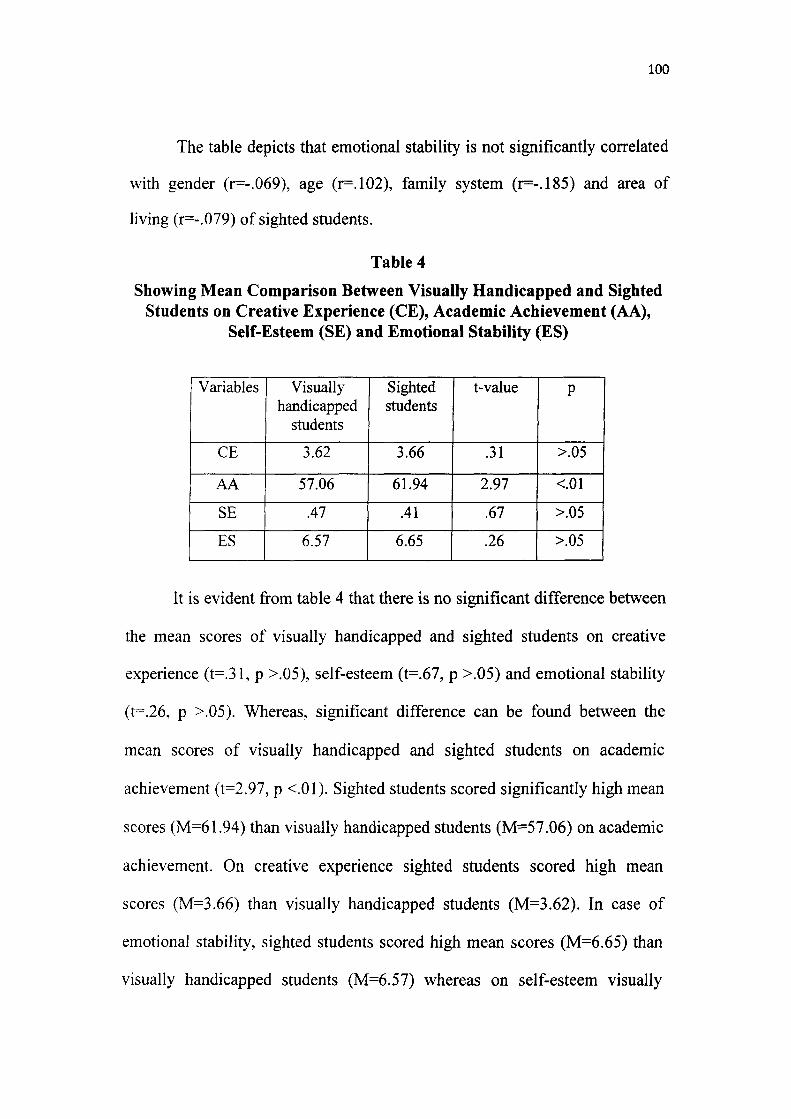
100
The table depicts that emotional stability is not significantly correlated
with gender (r=-.069), age (r=.102), family system (r=-.185) and area of
living (r=-.079) of sighted students.
Table 4
Showing Mean Comparison Between Visually Handicapped and Sighted Students on Creative Experience (CE), Academic Achievement (AA),
Self-Esteem (SE) and Emotional Stability (ES)
Variables
CE
AA
SE
ES
Visually handicapped
students
3.62
57.06
.47
6.57
Sighted students
3.66
61.94
.41
6.65
t-value
.31
2.97
.67
.26
P
>.05
<.01
>.05
>.05
It is evident from table 4 that there is no significant difference between
the mean scores of visually handicapped and sighted students on creative
experience (t=.31, p >.05), self-esteem (t=.67, p >.05) and emotional stability
(t=.26, p >.05). Whereas, significant difference can be found between the
mean scores of visually handicapped and sighted students on academic
achievement (t=2.97, p <.01). Sighted students scored significantly high mean
scores (M=61.94) than visually handicapped students (M=57.06) on academic
achievement. On creative experience sighted students scored high mean
scores (M=3.66) than visually handicapped students (M=3.62). In case of
emotional stability, sighted students scored high mean scores (M=6.65) than
visually handicapped students (M=6.57) whereas on self-esteem visually
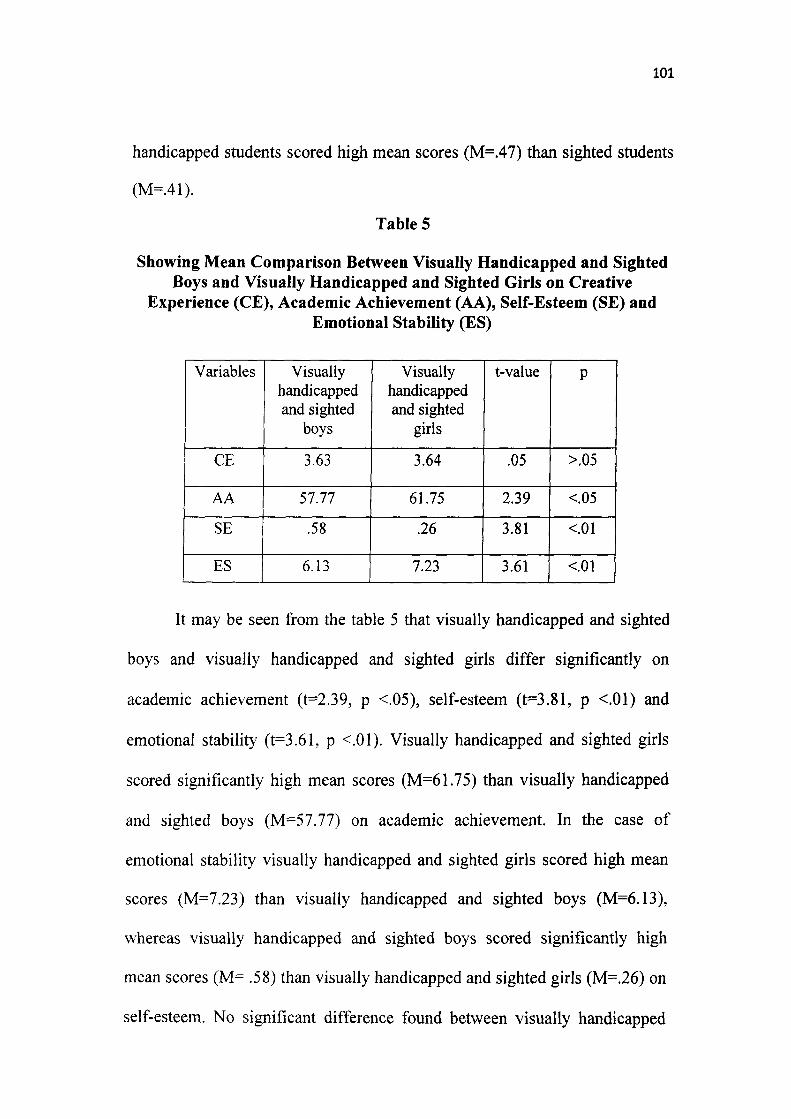
101
handicapped students scored high mean scores (M=.47) than sighted students
(M=41).
Table 5
Showing Mean Comparison Between VisuaUy Handicapped and Sighted Boys and Visually Handicapped and Sighted Girls on Creative
Experience (CE), Academic Achievement (AA), Self-Esteem (SE) and Emotional Stability (ES)
Variables
CE
AA
SE
ES
Visually handicapped and sighted
boys
3.63
57.77
.58
6.13
Visually handicapped and sighted
girls
3.64
61.75
.26
7.23
t-value
.05
2.39
3.81
3.61
P
>.05
<.05
<.01
<.01
It may be seen from the table 5 that visually handicapped and sighted
boys and visually handicapped and sighted girls differ significantly on
academic achievement (t=2.39, p <.05), self-esteem (t=3.81, p <.01) and
emotional stability (t=3.61, p <.01). Visually handicapped and sighted girls
scored significantly high mean scores (M=61.75) than visually handicapped
and sighted boys (M=57.77) on academic achievement. In the case of
emotional stability visually handicapped and sighted girls scored high mean
scores (M=7.23) than visually handicapped and sighted boys (M=6.13),
whereas visually handicapped and sighted boys scored significantly high
mean scores (M= .58) than visually handicapped and sighted girls (M=.26) on
self-esteem. No significant difference found between visually handicapped
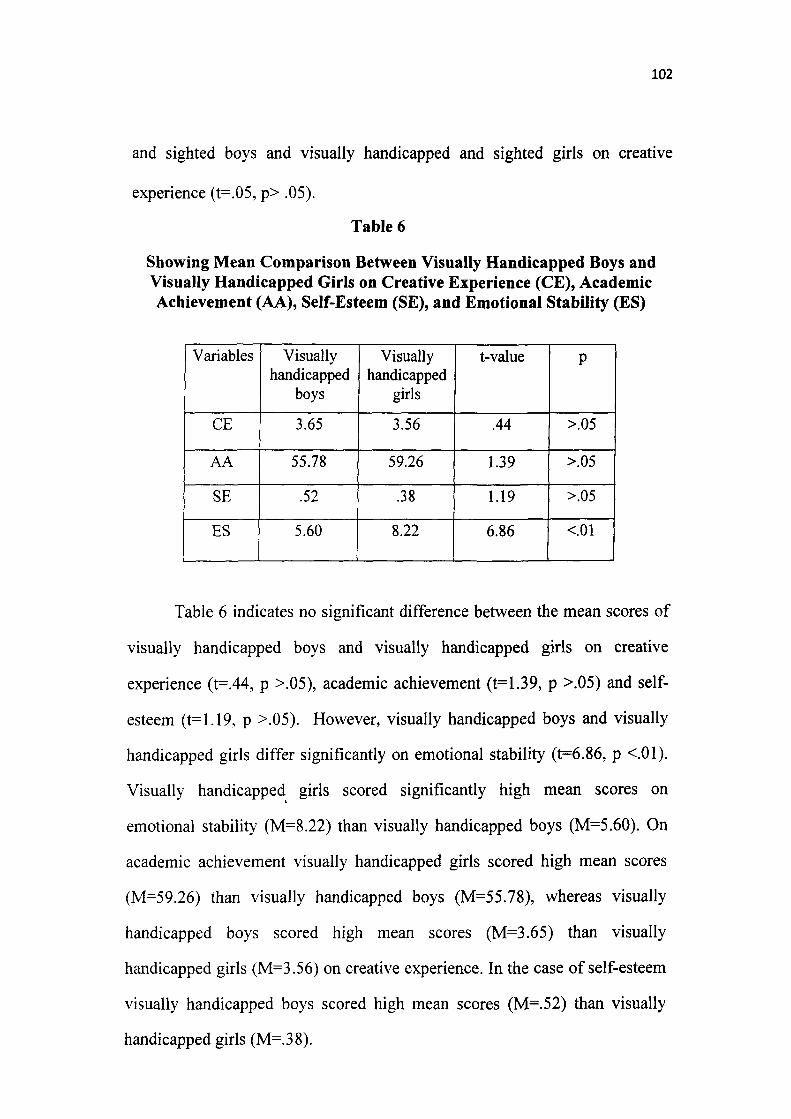
102
and sighted boys and visually handicapped and sighted girls on creative
experience (t=.05, p> .05).
Table 6
Showing Mean Comparison Between Visually Handicapped Boys and Visually Handicapped Girls on Creative Experience (C£), Academic Achievement (AA), Self-Esteem (SE), and Emotional Stability (ES)
Variables
CE
AA
SE
ES
Visually handicapped
boys
3.65
55.78
.52
5.60
Visually handicapped
girls
3.56
59.26
.38
8.22
t-value
.44
1.39
1.19
6.86
P
>.05
>.05
>.05
<.01
Table 6 indicates no significant difference between the mean scores of
visually handicapped boys and visually handicapped girls on creative
experience (t=.44, p >.05), academic achievement (t=1.39, p >.05) and self-
esteem (t=1.19, p >.05). However, visually handicapped boys and visually
handicapped girls differ significantly on emotional stability (t=6.86, p <.01).
Visually handicapped girls scored significantly high mean scores on
emotional stability (M=8.22) than visually handicapped boys (M=5.60). On
academic achievement visually handicapped girls scored high mean scores
(M=59.26) than visually handicapped boys (M=55.78), whereas visually
handicapped boys scored high mean scores (M=3.65) than visually
handicapped girls (M==3.56) on creative experience. In the case of self-esteem
visually handicapped boys scored high mean scores (M=.52) than visually
handicapped girls (M=.38).
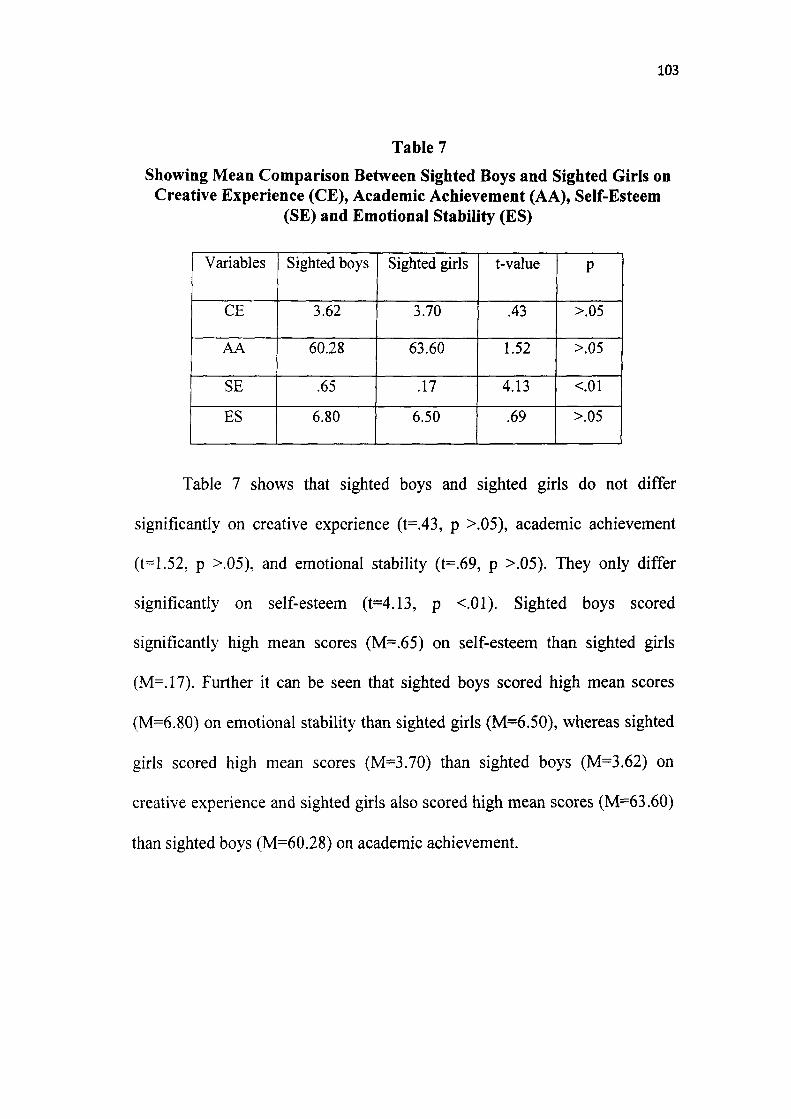
103
Table 7
Showing Mean Comparison Between Sighted Boys and Sighted Girls on Creative Experience (CE), Academic Achievement (AA), Self-Esteem
(SE) and Emotional Stability (ES)
Variables
CE
AA
SE
ES
Sighted boys
3.62
60.28
.65
6.80
Sighted giris
3.70
63.60
.17
6.50
t-value
.43
1.52
4.13
.69
P
>.05
>.05
<.01
>.05
Table 7 shows that sighted boys and sighted girls do not differ
significantly on creative experience (t=.43, p >.05), academic achievement
(t-1.52, p >.05), and emotional stability (t=.69, p >.05). They only differ
significantly on self-esteem (t=4.13, p <.01). Sighted boys scored
significantly high mean scores (M=.65) on self-esteem than sighted girls
(M=.17). Further it can be seen that sighted boys scored high mean scores
(M=6.80) on emotional stability than sighted girls (M=6.50), whereas sighted
girls scored high mean scores (M=3.70) than sighted boys (M=3.62) on
creative experience and sighted girls also scored high mean scores (M=63.60)
than sighted boys (M=60.28) on academic achievement.
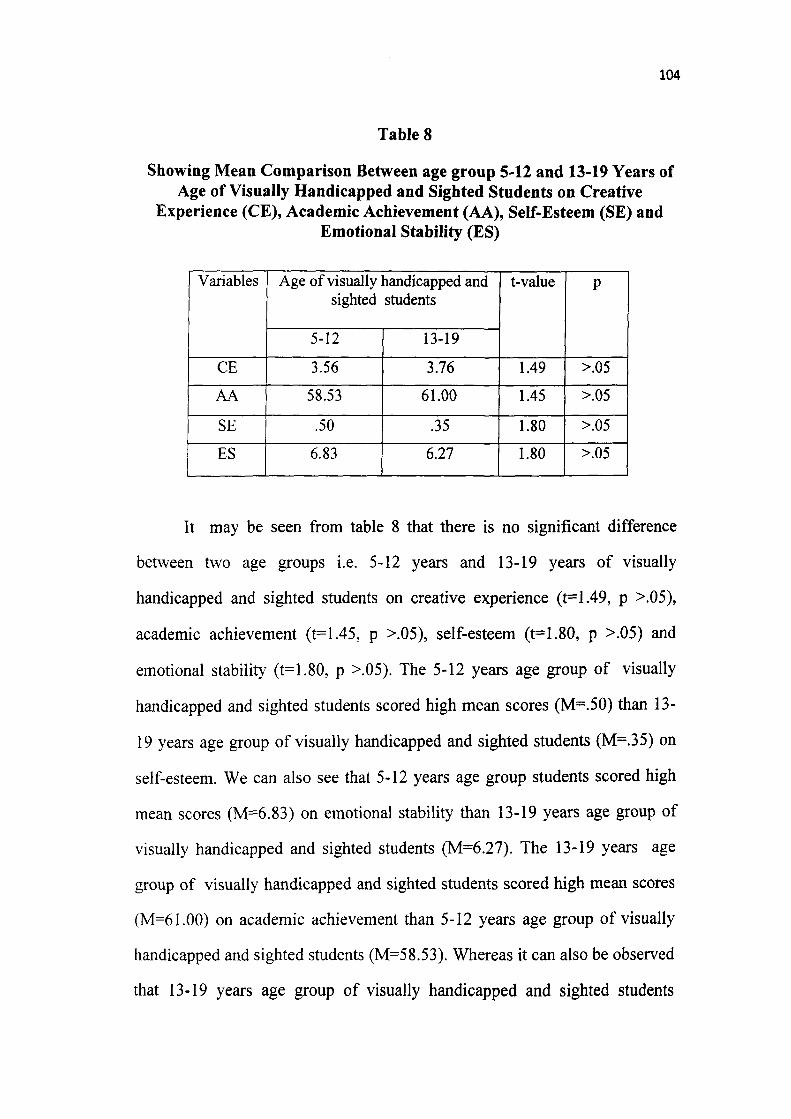
104
Table 8
Showing Mean Comparison Between age group 5-12 and 13-19 Years of Age of Visually Handicapped and Sighted Students on Creative
Experience (CE), Academic Achievement (AA), Self-Esteem (SE) and Emotional Stability (ES)
Variables
CE
AA
SE
ES
Age of visually handicapped and sighted students
5-12
3.56
58.53
.50
6.83
13-19
3.76
61.00
.35
6.27
t-value
1.49
1.45
1.80
1.80
P
>.05
>.05
>.05
>.05
It may be seen from table 8 that there is no significant difference
between two age groups i.e. 5-12 years and 13-19 years of visually
handicapped and sighted students on creative experience (t=1.49, p >.05),
academic achievement (t=1.45, p >.05), self-esteem (t=1.80, p >.05) and
emotional stability (t=1.80, p >.05). The 5-12 years age group of visually
handicapped and sighted students scored high mean scores (M=.50) than 13-
19 years age group of visually handicapped and sighted students (M=.35) on
self-esteem. We can also see that 5-12 years age group students scored high
mean scores (M=6.83) on emotional stability than 13-19 years age group of
visually handicapped and sighted students (M=6.27). The 13-19 years age
group of visually handicapped and sighted students scored high mean scores
(M=61.00) on academic achievement than 5-12 years age group of visually
handicapped and sighted students (M=58.53). Whereas it can also be observed
that 13-19 years age group of visually handicapped and sighted students
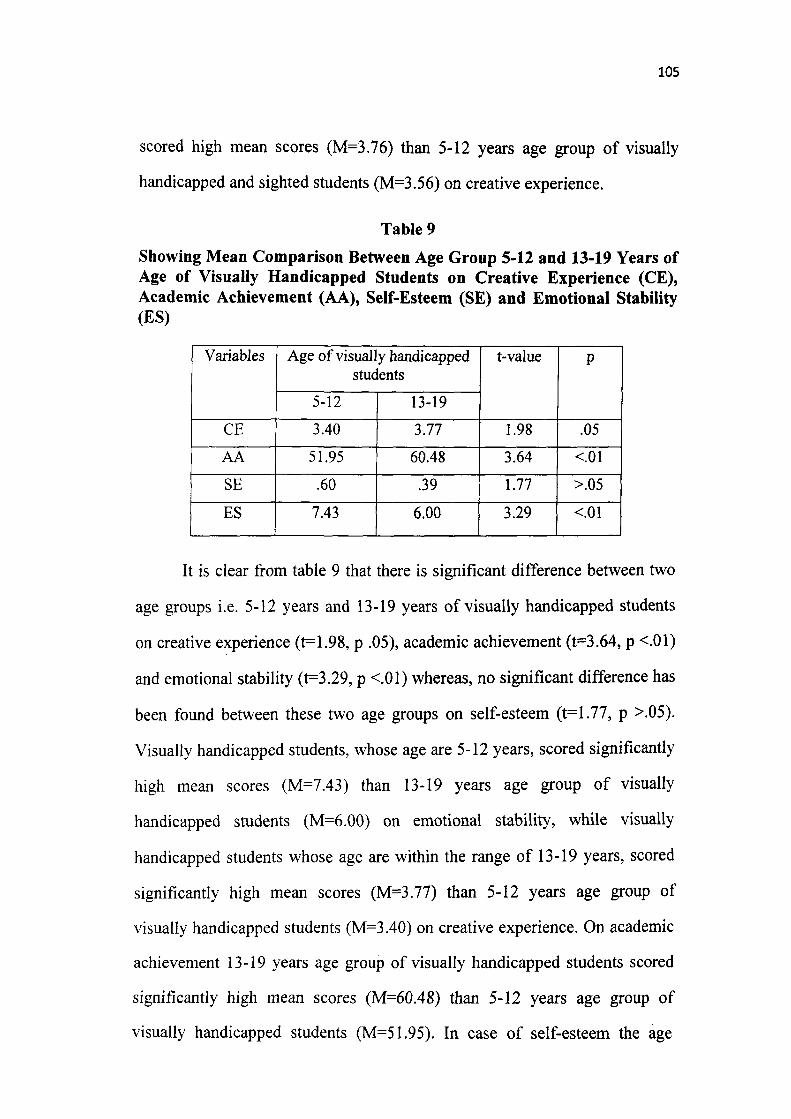
105
scored high mean scores (M=3.76) than 5-12 years age group of visually
handicapped and sighted students (M=3.56) on creative experience.
Table 9
Showing Mean Comparison Between Age Group 5-12 and 13-19 Years of Age of Visually Handicapped Students on Creative Experience (CE), Academic Achievement (AA), Self-Esteem (SE) and Emotional Stability (ES)
Variables
CE
AA
SE
ES
Age of visually handicapped students
5-12
3.40
51.95
.60
7.43
13-19
3.77
60.48
.39
6.00
t-value
1.98
3.64
1.77
3.29
P
.05
<.01
>.05
<.01
It is clear from table 9 that there is significant difference between two
age groups i.e. 5-12 years and 13-19 years of visually handicapped students
on creative experience (t=1.98, p .05), academic achievement (t=3.64, p <.01)
and emotional stability (t=3.29, p <.01) whereas, no significant difference has
been found between these two age groups on self-esteem (t=1.77, p >.05).
Visually handicapped students, whose age are 5-12 years, scored significantly
high mean scores (M=7.43) than 13-19 years age group of visually
handicapped students (M=6.00) on emotional stability, while visually
handicapped students whose age are within the range of 13-19 years, scored
significantly high mean scores (M=3.77) than 5-12 years age group of
visually handicapped students (M=3.40) on creative experience. On academic
achievement 13-19 years age group of visually handicapped students scored
significantly high mean scores (M=60.48) than 5-12 years age group of
visually handicapped students (M=51.95). In case of self-esteem the age
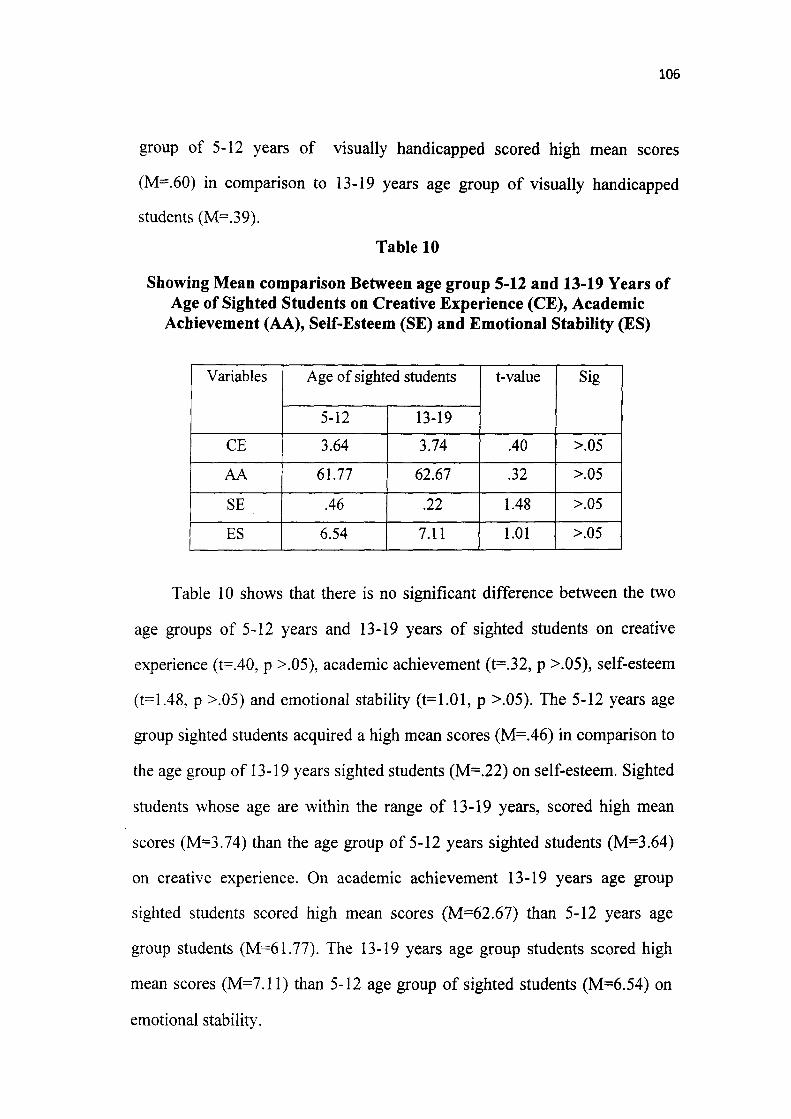
106
group of 5-12 years of visually handicapped scored high mean scores
(M=.60) in comparison to 13-19 years age group of visually handicapped
students (M=.39).
Table 10
Showing Mean comparison Between age group 5-12 and 13-19 Years of Age of Sighted Students on Creative Experience (CE), Academic
Achievement (AA), Self-Esteem (SE) and Emotional Stability (ES)
Variables
CE
AA
SE
ES
Age of sighted students
5-12
3.64
61.77
.46
6.54
13-19
3.74
62.67
.22
7.11
t-value
.40
.32
1.48
1.01
Sig
>.05
>.05
>.05
>.05
Table 10 shows that there is no significant difference between the two
age groups of 5-12 years and 13-19 years of sighted students on creative
experience (t=.40, p >.05), academic achievement (t=.32, p >.05), self-esteem
(t=1.48, p >.05) and emotional stability (t=1.01, p >.05). The 5-12 years age
group sighted students acquired a high mean scores (M=.46) in comparison to
the age group of 13-19 years sighted students (M=.22) on self-esteem. Sighted
students whose age are within the range of 13-19 years, scored high mean
scores (M=3.74) than the age group of 5-12 years sighted students (M=3.64)
on creative experience. On academic achievement 13-19 years age group
sighted students scored high mean scores (M=62.67) than 5-12 years age
group students (M=61.77). The 13-19 years age group students scored high
mean scores (M=7.11) than 5-12 age group of sighted students (M=6.54) on
emotional stability.
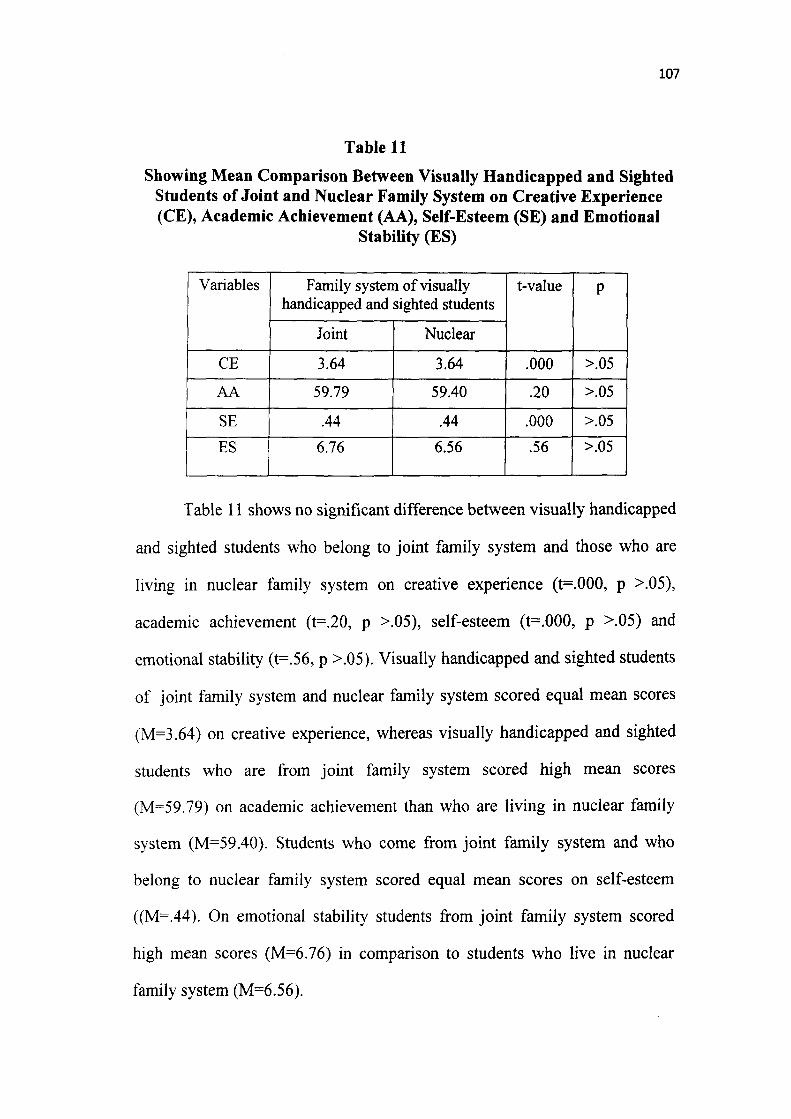
107
Table 11
Showing Mean Comparison Between Visually Handicapped and Sighted Students of Joint and Nuclear Family System on Creative Experience (CE), Academic Achievement (AA), Self-Esteem (SE) and Emotional
Stability (ES)
Variables
CE
AA
SE
ES
Family system of visually handicapped and sighted students
Joint
3.64
59.79
.44
6.76
Nuclear
3.64
59.40
.44
6.56
t-value
.000
.20
.000
.56
P
>.05
>.05
>.05
>.05
Table 11 shows no significant difference between visually handicapped
and sighted students who belong to joint family system and those who are
living in nuclear family system on creative experience (t=.000, p >.05),
academic achievement (t=.20, p >.05), self-esteem (t=.000, p >.05) and
emotional stability (t=.56, p >.05). Visually handicapped and sighted students
of joint family system and nuclear family system scored equal mean scores
(M=3.64) on creative experience, whereas visually handicapped and sighted
students who are from joint family system scored high mean scores
(M=59.79) on academic achievement than who are living in nuclear family
system (M=59.40). Students who come from joint family system and who
belong to nuclear family system scored equal mean scores on self-esteem
((M=.44). On emotional stability students from joint family system scored
high mean scores (M=6.76) in comparison to students who live in nuclear
family system (M=6.56).
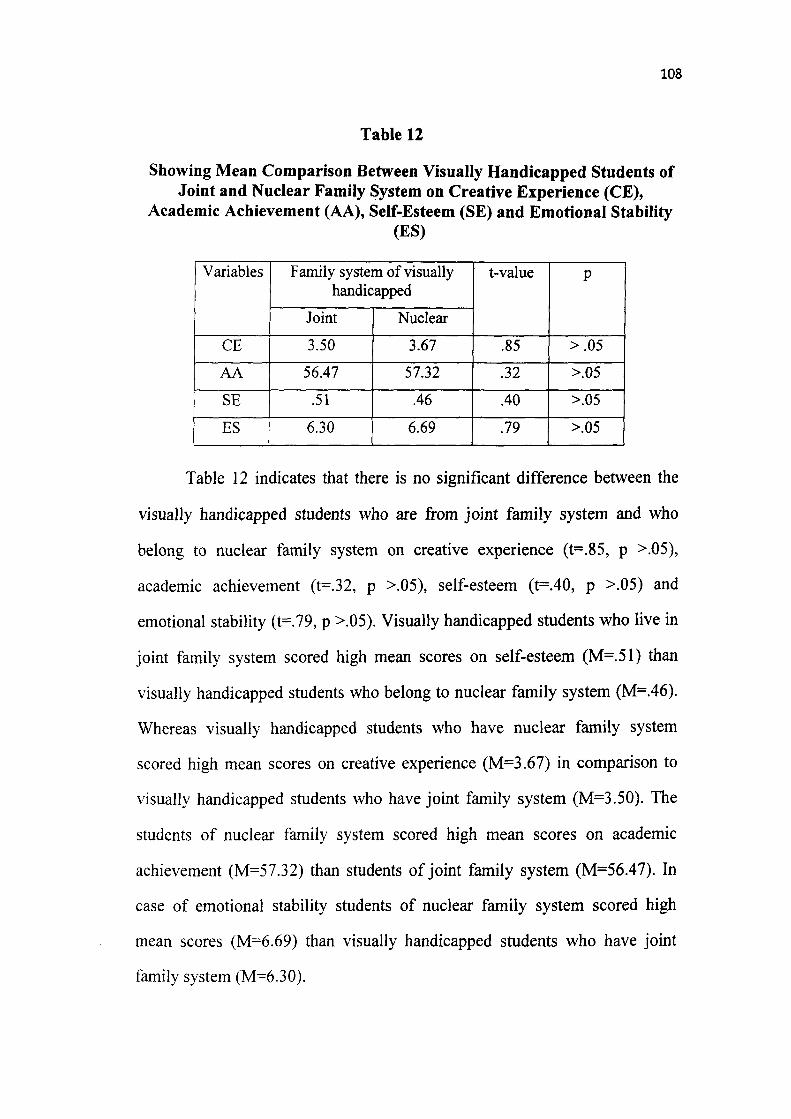
108
Table 12
Showing Mean Comparison Between Visually Handicapped Students of Joint and Nuclear Family System on Creative Experience (CE),
Academic Achievement (AA), Self-Esteem (SE) and Emotional Stability (ES)
Variables
CE
AA
SE
ES
Family system of visually handicapped
Joint
3.50
56.47
.51
6.30
Nuclear
3.67
57.32
.46
6.69
t-value
.85
.32
.40
.79
P
>.05
>.05
>.05
>.05
Table 12 indicates that there is no significant difference between the
visually handicapped students who are from joint family system and who
belong to nuclear family system on creative experience (t=.85, p >.05),
academic achievement (t=.32, p >.05), self-esteem (t=.40, p >.05) and
emotional stability (t=.79, p >.05). Visually handicapped students who live in
joint family system scored high mean scores on self-esteem (M=.51) than
visually handicapped students who belong to nuclear family system (M=.46).
Whereas visually handicapped students who have nuclear family system
scored high mean scores on creative experience (M=3.67) in comparison to
visually handicapped students who have joint family system (M=3.50). The
students of nuclear family system scored high mean scores on academic
achievement (M=57.32) than students of joint family system (M=56.47). In
case of emotional stability students of nuclear family system scored high
mean scores (M=6.69) than visually handicapped students who have joint
family system (M=6.30).
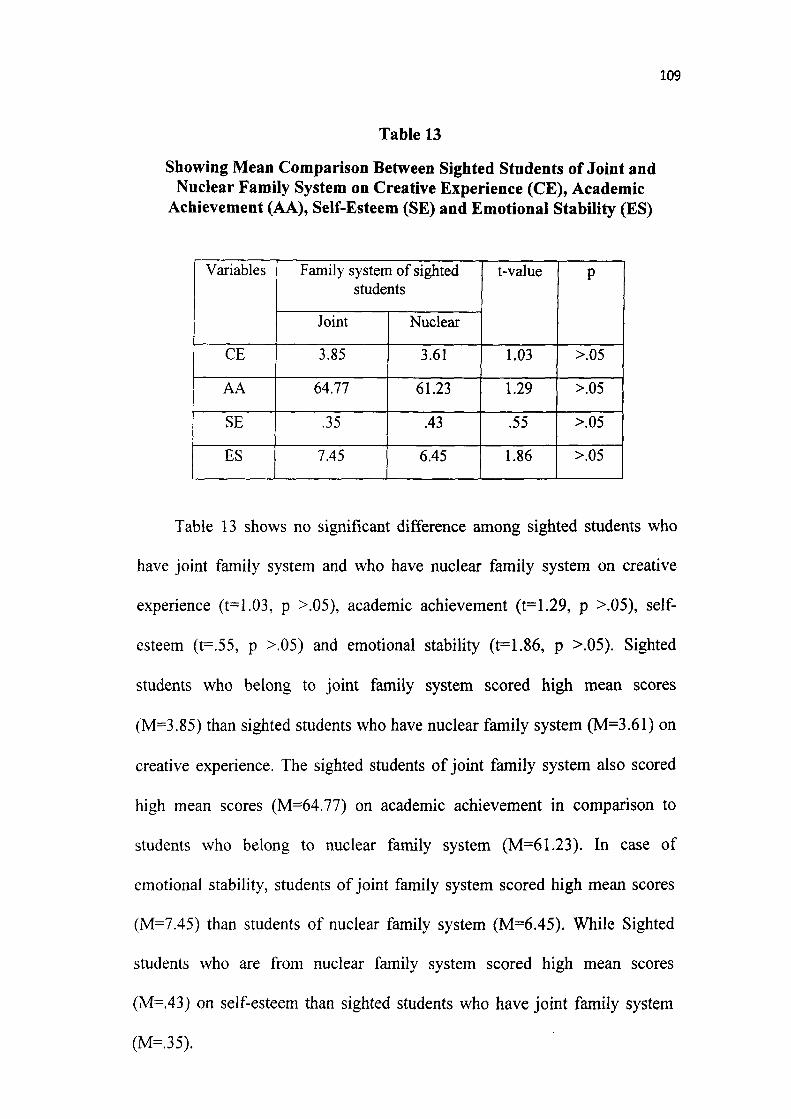
109
Table 13
Showing Mean Comparison Between Sighted Students of Joint and Nuclear Family System on Creative Experience (CE), Academic
Achievement (AA), Self-Esteem (SE) and Emotional Stability (ES)
Variables
CE
AA
SE
ES
Family system of sighted students
Joint
3.85
64.77
.35
7.45
Nuclear
3.61
61.23
.43
6.45
t-value
1.03
1.29
.55
1.86
P
>.05
>.05
>.05
>.05
Table 13 shows no significant difference among sighted students who
have joint family system and who have nuclear family system on creative
experience (t=1.03, p >.05), academic achievement (t=1.29, p >.05), self-
esteem (t=.55, p >.05) and emotional stability (t=1.86, p >.05). Sighted
students who belong to joint family system scored high mean scores
(M=3.85) than sighted students who have nuclear family system (M=3.61) on
creative experience. The sighted students of joint family system also scored
high mean scores (M=64.77) on academic achievement in comparison to
students who belong to nuclear family system (M=61.23). In case of
emotional stability, students of joint family system scored high mean scores
(M=7.45) than students of nuclear family system (M=6.45). While Sighted
students who are from nuclear family system scored high mean scores
(M=.43) on self-esteem than sighted students who have joint family system
(M=.35).
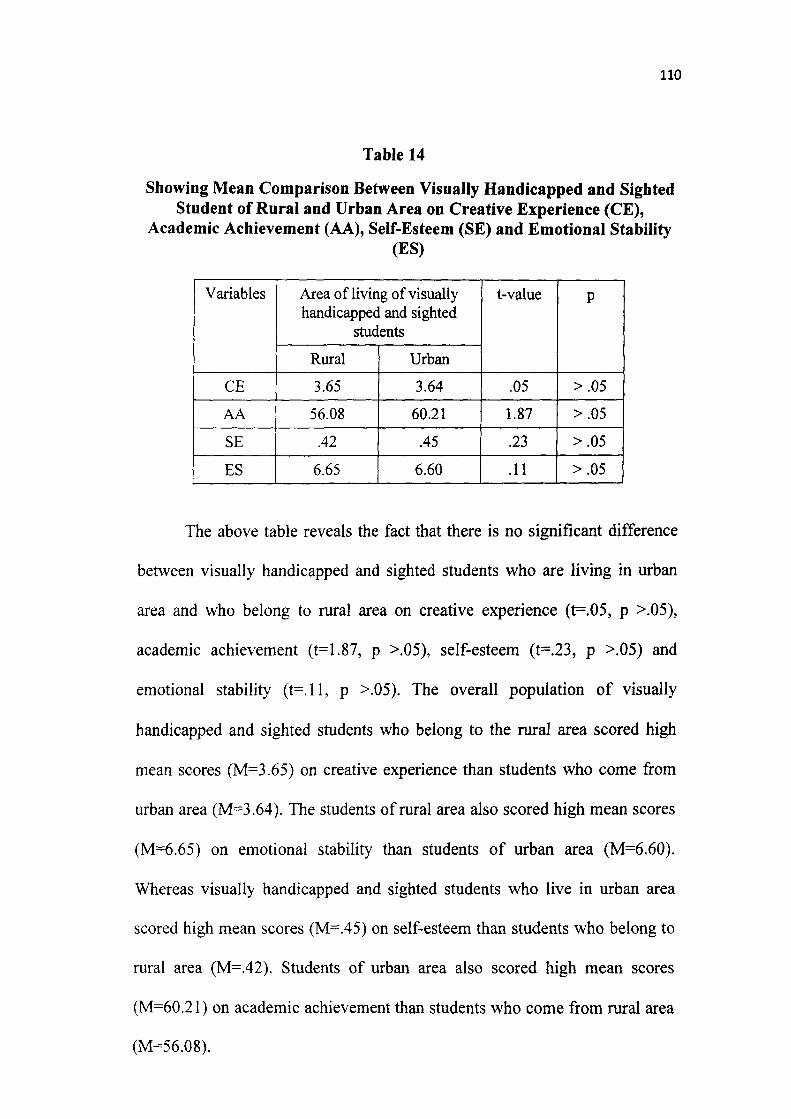
110
Table 14
Showing Mean Comparison Between Visually Handicapped and Sighted Student of Rural and Urban Area on Creative Experience (CE),
Academic Achievement (AA), Self-Esteem (SE) and Emotional Stability (ES)
Variables
CE
AA
SE
ES
Area of living of visually handicapped and sighted
students
Rural
3.65
56.08
.42
6.65
Urban
3.64
60.21
.45
6.60
t-value
.05
1.87
.23
.11
P
>.05
>.05
>.05
>.05
The above table reveals the fact that there is no significant difference
between visually handicapped and sighted students who are living in urban
area and who belong to rural area on creative experience (t=.05, p >.05),
academic achievement (t=1.87, p >.05), self-esteem (t=.23, p >.05) and
emotional stability (t=.ll, p >.05). The overall population of visually
handicapped and sighted students who belong to the rural area scored high
mean scores (M=3.65) on creative experience than students who come from
urban area (M=3.64). The students of rural area also scored high mean scores
(M=6.65) on emotional stability than students of urban area (M=6.60).
Whereas visually handicapped and sighted students who live in urban area
scored high mean scores (M=.45) on self-esteem than students who belong to
rural area (M=.42). Students of urban area also scored high mean scores
(M=60.21) on academic achievement than students who come from rural area
(M=56.08).
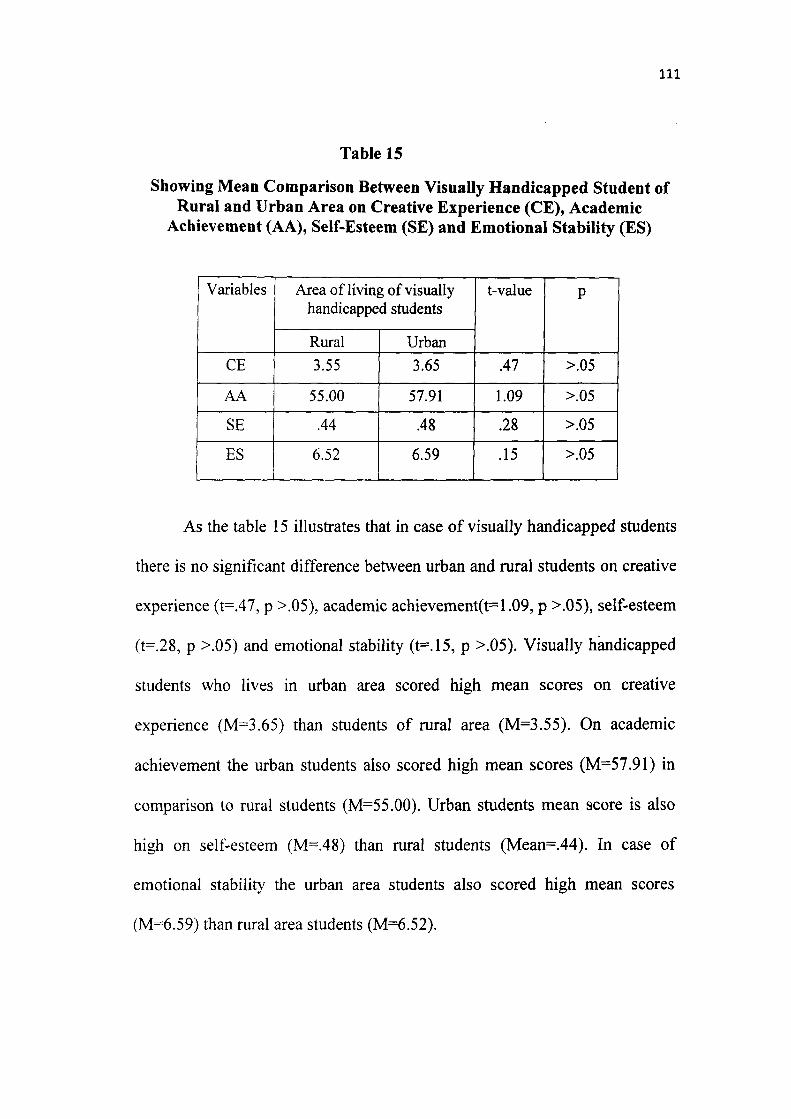
I l l
Table 15
Showing Mean Comparison Between Visually Handicapped Student of Rural and Urban Area on Creative Experience (CE), Academic
Achievement (AA), Self-Esteem (SE) and Emotional Stability (ES)
Variables
CE
AA
SE
ES
Area of living of visually handicapped students
Rural 3.55
55.00
.44
6.52
Urban 3.65
57.91
.48
6.59
t-value
.47
1.09
.28
.15
P
>.05
>.05
>.05
>.05
As the table 15 illustrates that in case of visually handicapped students
there is no significant difference between urban and rural students on creative
experience (t=.47, p >.05), academic achievement(t=1.09, p >.05), self-esteem
(t=.28, p >.05) and emotional stability (t=.15, p >.05). Visually handicapped
students who lives in urban area scored high mean scores on creative
experience (M=3.65) than students of rural area (M=3.55). On academic
achievement the urban students also scored high mean scores (M=57.91) in
comparison to rural students (M=55.00). Urban students mean score is also
high on self-esteem (M=.48) than rural students (Mean=.44). In case of
emotional stability the urban area students also scored high mean scores
(M=6.59) than rural area students (M=6.52).
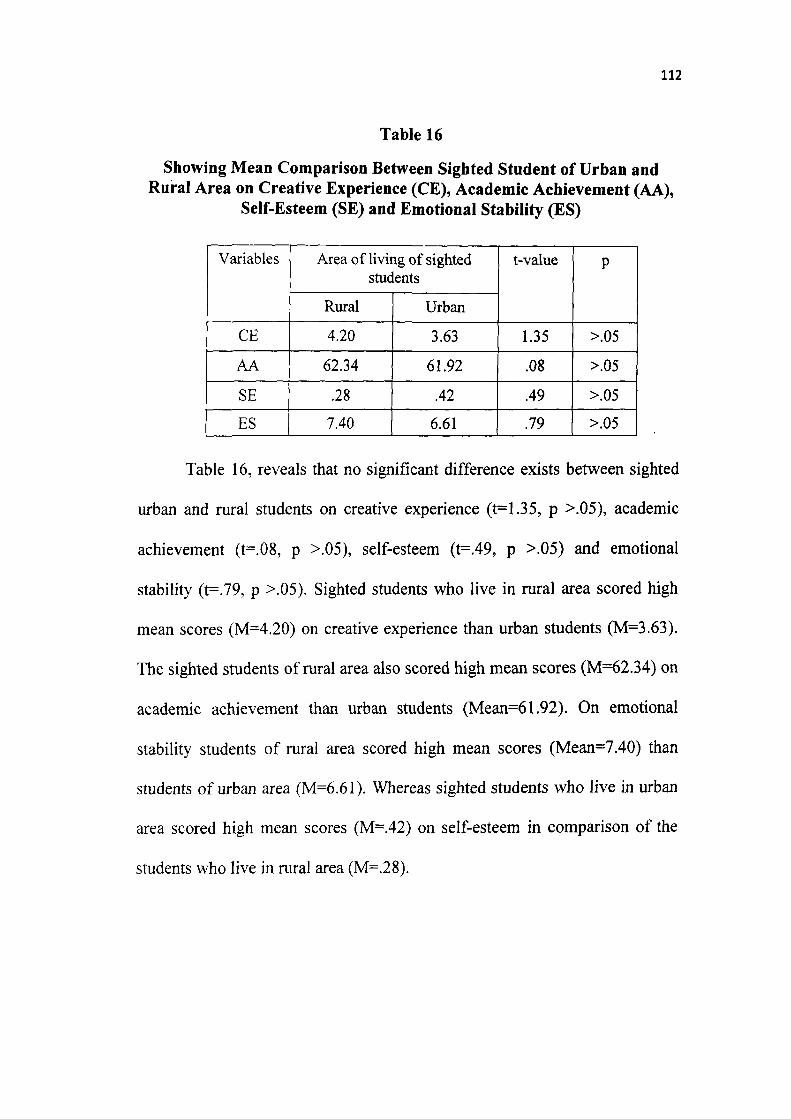
112
Table 16
Showing Mean Comparison Between Sighted Student of Urban and Rural Area on Creative Experience (CE), Academic Achievement (AA),
Self-Esteem (SE) and Emotional Stability (ES)
Variables
CE
AA
SE
ES
Area of living of sighted students
Rural
4.20
62.34
.28
7.40
Urban
3.63
61.92
.42
6.61
t-value
1.35
.08
.49
.79
P
>.05
>.05
>.05
>.05
Table 16, reveals that no significant difference exists between sighted
urban and rural students on creative experience (t=1.35, p >.05), academic
achievement (t=.08, p >.05), self-esteem (t=.49, p >.05) and emotional
stability (t=.79, p >.05). Sighted students who live in rural area scored high
mean scores (M=4.20) on creative experience than urban students (M=3.63).
The sighted students of rural area also scored high mean scores (M=62.34) on
academic achievement than urban students (Mean=61.92). On emotional
stability students of rural area scored high mean scores (Mean=7.40) than
students of urban area (M=6.61). Whereas sighted students who live in urban
area scored high mean scores (M=.42) on self-esteem in comparison of the
students who live in rural area (M=.28).
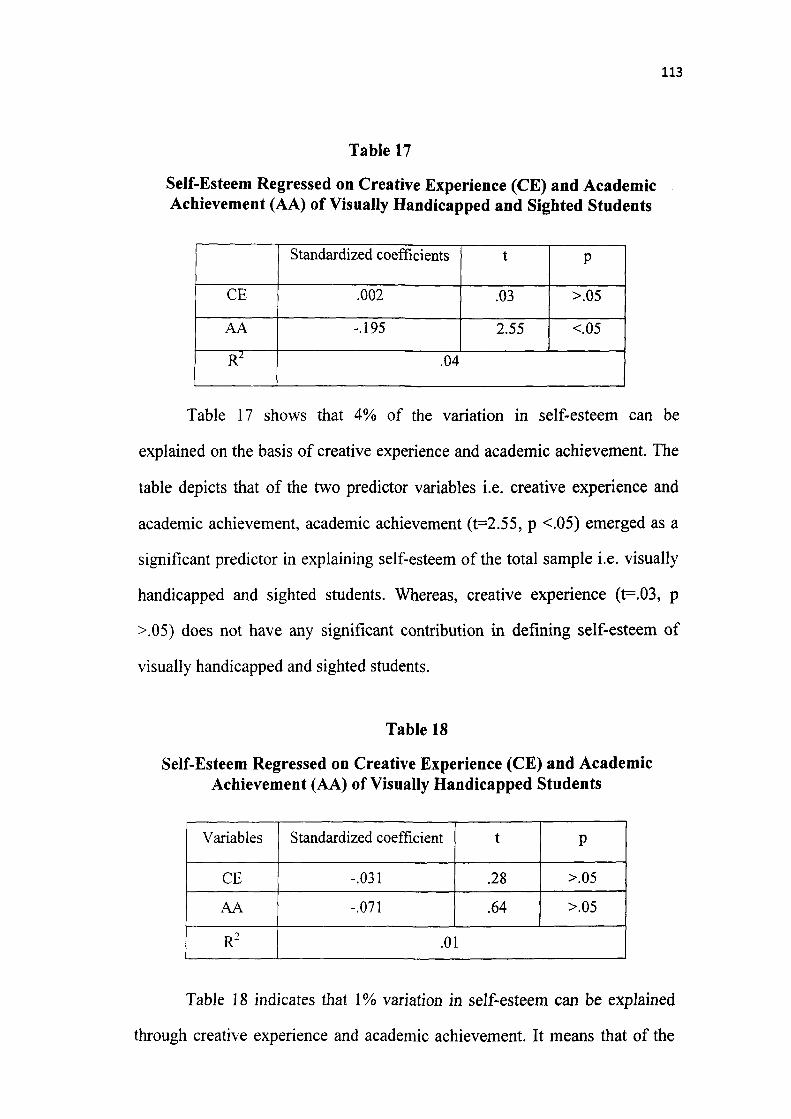
113
Table 17
Self-Esteem Regressed on Creative Experience (CE) and Academic Achievement (AA) of Visually Handicapped and Sighted Students
CE
AA
R^
Standardized coefficients
.002
-.195
t
.03
2.55
P
>.05
<.05
.04
Table 17 shows that 4% of the variation in self-esteem can be
explained on the basis of creative experience and academic achievement. The
table depicts that of the two predictor variables i.e. creative experience and
academic achievement, academic achievement (t=2.55, p <.05) emerged as a
significant predictor in explaining self-esteem of the total sample i.e. visually
handicapped and sighted students. Whereas, creative experience (t=.03, p
>.05) does not have any significant contribution in defining self-esteem of
visually handicapped and sighted students.
Table 18
Self-Esteem Regressed on Creative Experience (CE) and Academic Achievement (AA) of Visually Handicapped Students
Variables
CE
AA
R
Standardized coefficient
-.031
-.071
t
.28
.64
P
>.05
>.05
.01
Table 18 indicates that 1% variation in self-esteem can be explained
through creative experience and academic achievement. It means that of the
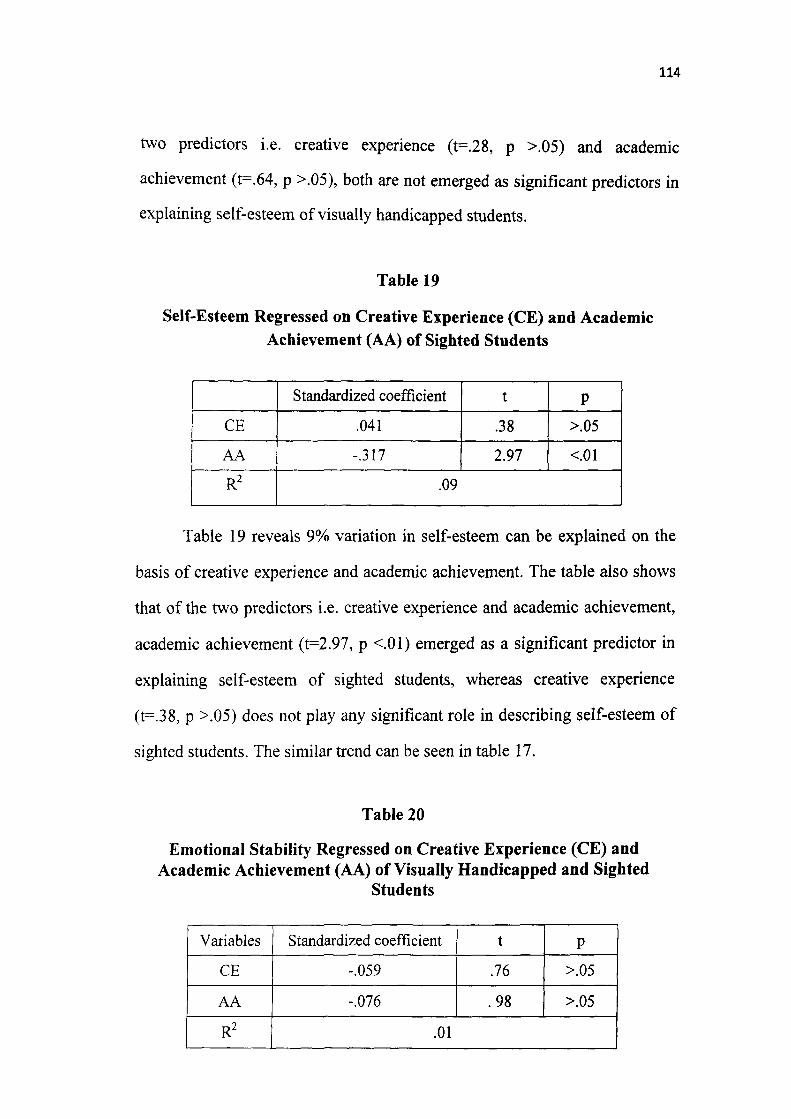
114
two predictors i.e. creative experience (t=.28, p >.05) and academic
achievement (t=.64, p >.05), both are not emerged as significant predictors in
explaining self-esteem of visually handicapped students.
Table 19
Self-Esteem Regressed on Creative Experience (CE) and Academic Acliievement (AA) of Sighted Students
CE
AA
R2
Standardized coefficient
.041
-.317
t
.38
2.97
P
>.05
<.01
.09
Table 19 reveals 9% variation in self-esteem can be explained on the
basis of creative experience and academic achievement. The table also shows
that of the two predictors i.e. creative experience and academic achievement,
academic achievement (t=2.97, p <.01) emerged as a significant predictor in
explaining self-esteem of sighted students, whereas creative experience
(t=.38, p >.05) does not play any significant role in describing self-esteem of
sighted students. The similar trend can be seen in table 17.
Table 20
Emotional Stability Regressed on Creative Experience (CE) and Academic Achievement (AA) of Visually Handicapped and Sighted
Students
Variables
CE
AA
R'
Standardized coefficient
-.059
-.076
t
.76
.98
P
>.05
>.05
.01
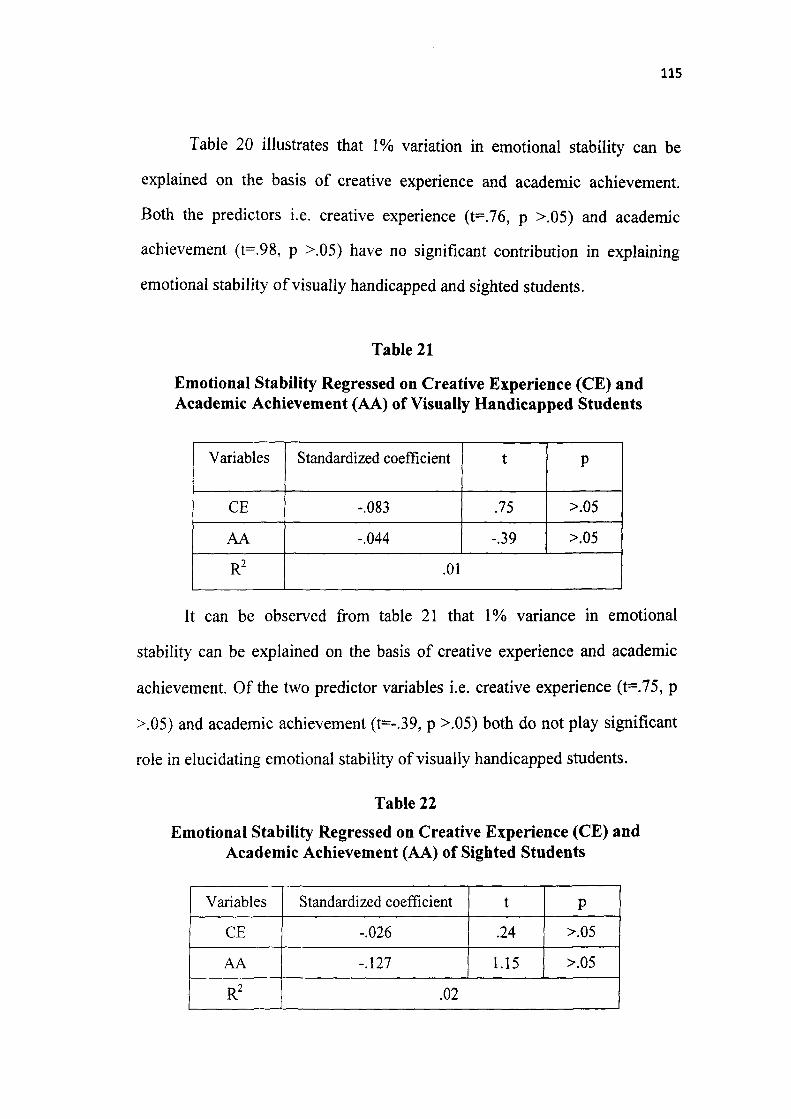
115
Table 20 illustrates that 1% variation in emotional stability can be
explained on the basis of creative experience and academic achievement.
Both the predictors i.e. creative experience (t=.76, p >.05) and academic
achievement (t=.98, p >.05) have no significant contribution in explaining
emotional stability of visually handicapped and sighted students.
Table 21
Emotional Stability Regressed on Creative Experience (CE) and Academic Achievement (AA) of Visually Handicapped Students
Variables
CE
AA
R^
Standardized coefficient
-.083
-.044
t
.75
-.39
P
>.05
>.05
.01
It can be observed from table 21 that 1% variance in emotional
stability can be explained on the basis of creative experience and academic
achievement. Of the two predictor variables i.e. creative experience (t=.75, p
>.05) and academic achievement (t=-.39, p >.05) both do not play significant
role in elucidating emotional stability of visually handicapped students.
Table 22
Emotional Stability Regressed on Creative Experience (CE) and Academic Achievement (AA) of Sighted Students
Variables
CE
AA
R
Standardized coefficient
-.026
-.127
t
.24
1.15
P
>.05
>.05
.02
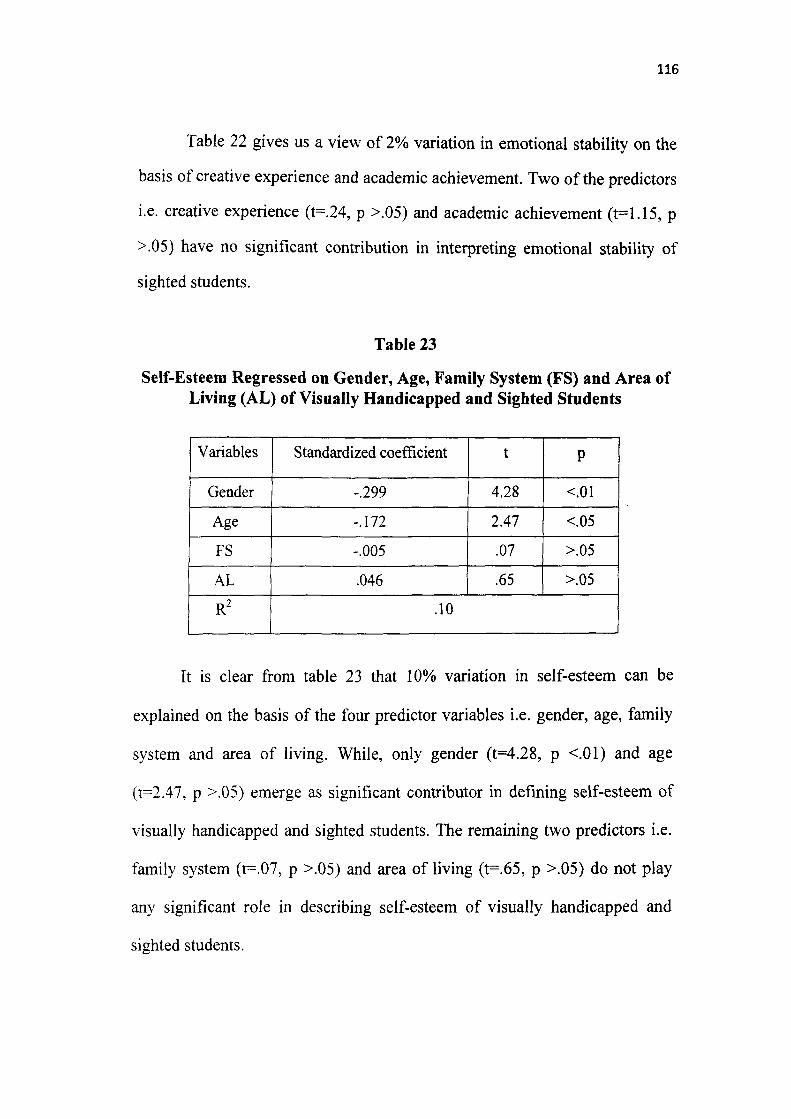
116
Table 22 gives us a view of 2% variation in emotional stability on the
basis of creative experience and academic achievement. Two of the predictors
i.e. creative experience (t=.24, p >.05) and academic achievement (t=1.15, p
>.05) have no significant contribution in interpreting emotional stability of
sighted students.
Table 23
Self-Esteera Regressed on Gender, Age, Family System (FS) and Area of Living (AL) of Visually Handicapped and Sighted Students
Variables
Gender
Age
FS
AL
R2
Standardized coefficient
-.299
-.172
-.005
.046
t
4.28
2.47
.07
.65
P
<.01
<.05
>.05
>.05
.10
It is clear from table 23 that 10% variation in self-esteem can be
explained on the basis of the four predictor variables i.e. gender, age, family
system and area of living. While, only gender (t=4.28, p <.01) and age
(t=2.47, p >.05) emerge as significant contributor in defining self-esteem of
visually handicapped and sighted students. The remaining two predictors i.e.
family system (t=.07, p >.05) and area of living (t=.65, p >.05) do not play
any significant role in describing self-esteem of visually handicapped and
sighted students.
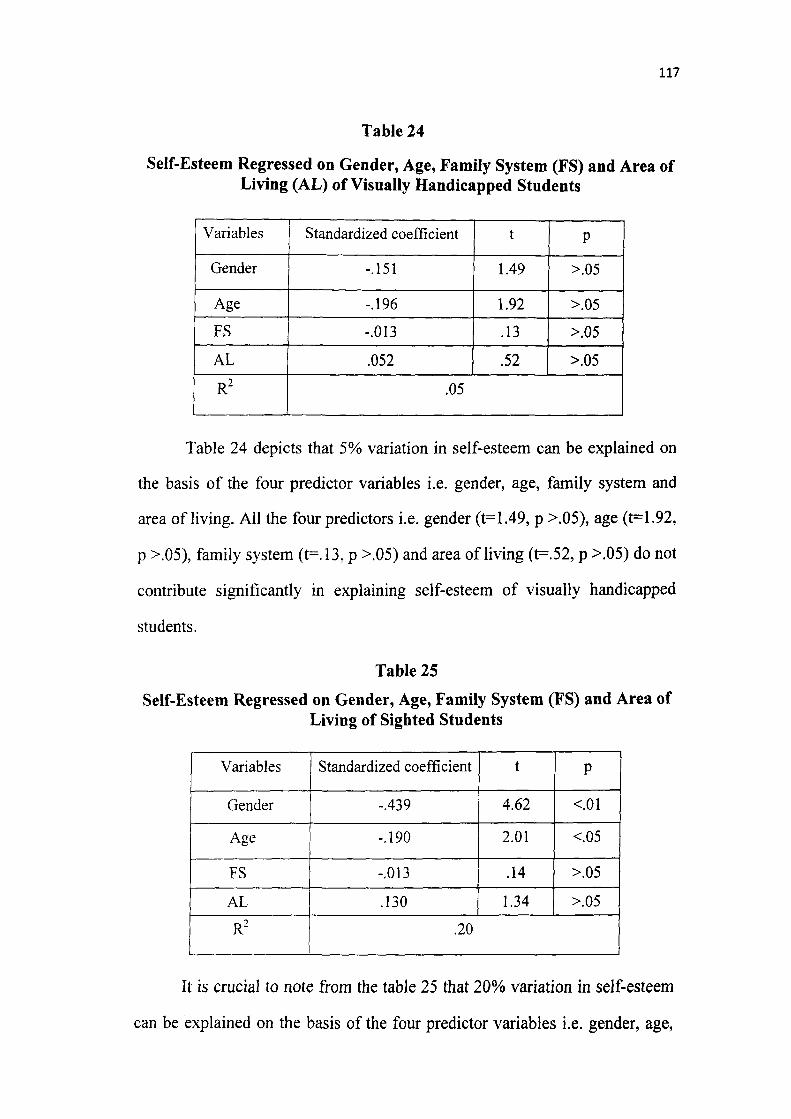
117
Table 24
Self-Esteem Regressed on Gender, Age, Family System (FS) and Area of Living (AL) of Visually Handicapped Students
Variables
Gender
Age
FS
AL
R'
Standardized coefficient
-.151
-.196
-.013
.052
t
1.49
1.92
.13
.52
P
>.05
>.05
>.05
>.05
.05
Table 24 depicts that 5% variation in self-esteem can be explained on
the basis of the four predictor variables i.e. gender, age, family system and
area of living. All the four predictors i.e. gender (t=1.49, p >.05), age (t=1.92,
p >.05), family system (t=.13, p >.05) and area of living (t=.52, p >.05) do not
contribute significantly in explaining self-esteem of visually handicapped
students.
Table 25
Self-Esteem Regressed on Gender, Age, Family System (FS) and Area of Living of Sighted Students
Variables
Gender
Age
FS
AL
R
Standardized coefficient
-.439
-.190
-.013
.130
t
4.62
2.01
.14
1.34
P
<.01
<.05
>.05
>.05
.20
It is crucial to note from the table 25 that 20% variation in self-esteem
can be explained on the basis of the four predictor variables i.e. gender, age,
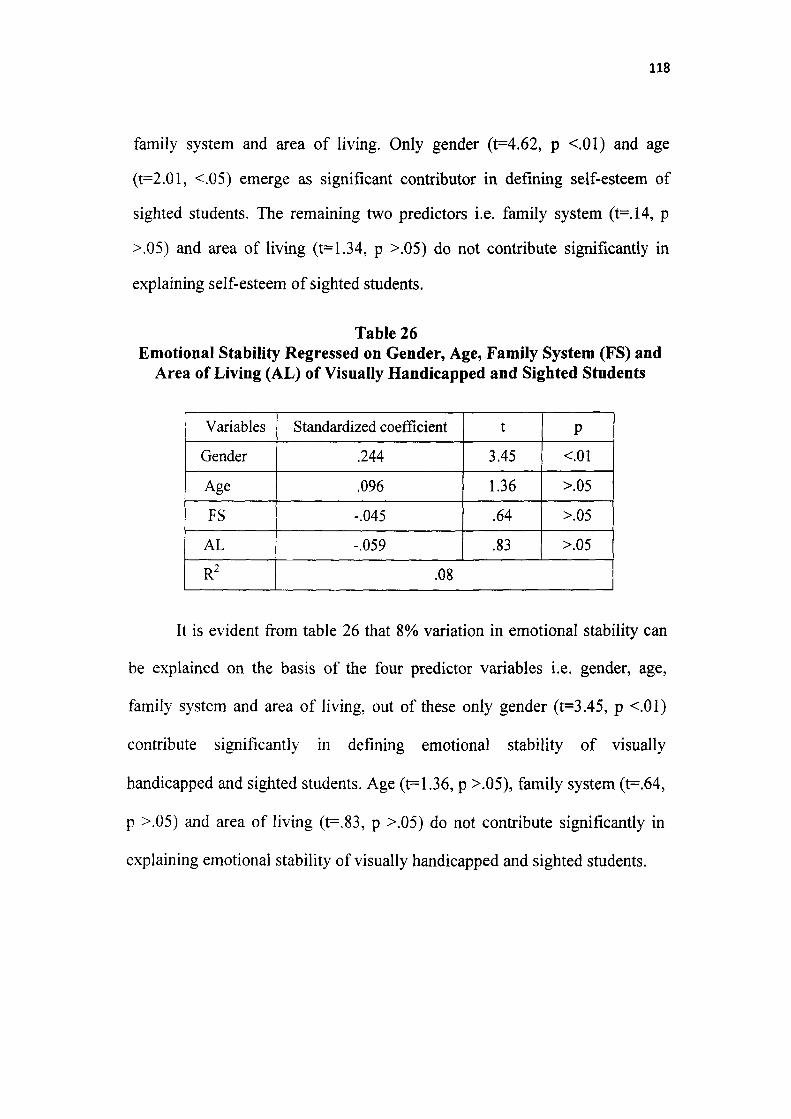
118
family system and area of living. Only gender (t=4.62, p <.01) and age
(t=2.01, <.05) emerge as significant contributor in defining self-esteem of
sighted students. The remaining two predictors i.e. family system (t=.14, p
>.05) and area of living (t=1.34, p >.05) do not contribute significantly in
explaining self-esteem of sighted students.
Table 26 Emotional Stability Regressed on Gender, Age, Family System (FS) and
Area of Living (AL) of Visually Handicapped and Sighted Students
Variables
Gender
Age
FS
AL
R
Standardized coefficient
.244
.096
-.045
-.059
t
3.45
1.36
.64
.83
P
<.01
>.05
>.05
>.05
.08
It is evident from table 26 that 8% variation in emotional stability can
be explained on the basis of the four predictor variables i.e. gender, age,
family system and area of living, out of these only gender (t=3.45, p <.01)
contribute significantly in defining emotional stability of visually
handicapped and sighted students. Age (t=1.36, p >.05), family system (t=.64,
p >.05) and area of living (t=.83, p >.05) do not contribute significantly in
explaining emotional stability of visually handicapped and sighted students.
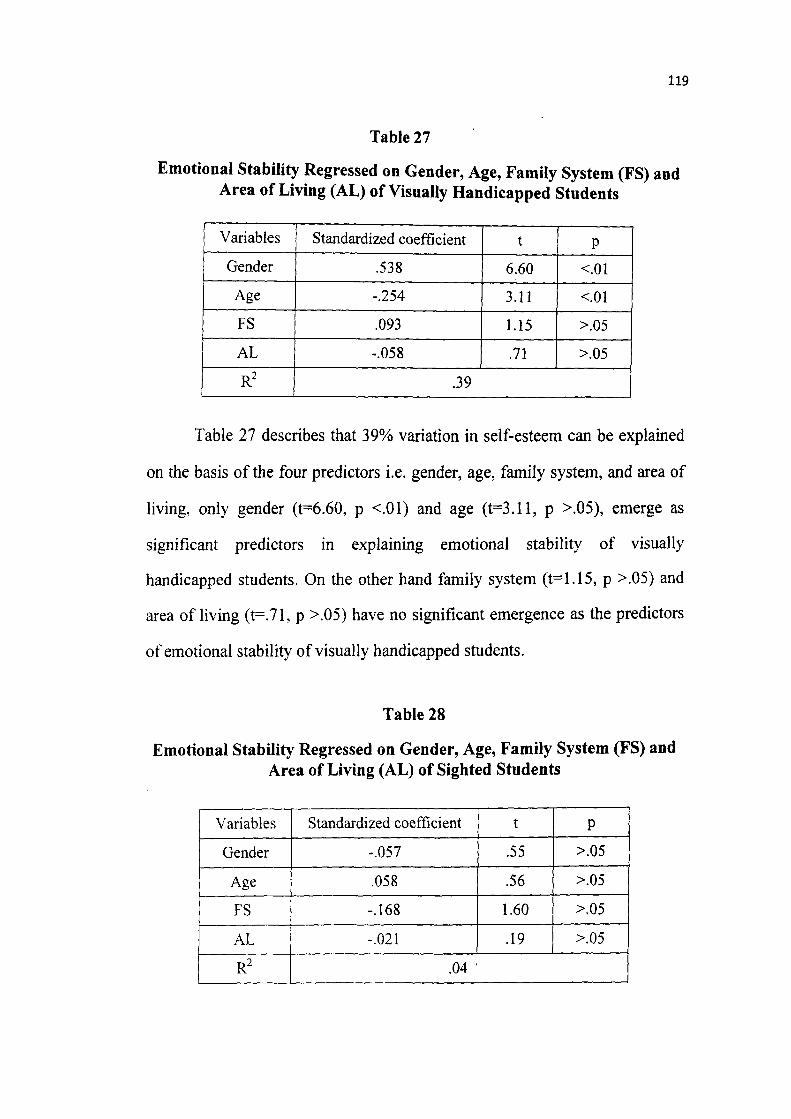
119
Table 27
Emotional Stability Regressed on Gender, Age, Family System (FS) and Area of Living (AL) of Visually Handicapped Students
Vairiables
Gender
Age
FS
AL
R'
Standardized coefficient
.538
-.254
.093
-.058
t
6.60
3.11
1.15
.71
P
<.01
<.01
>.05
>.05
.39
Table 27 describes that 39% variation in self-esteem can be explained
on the basis of the four predictors i.e. gender, age, family system, and area of
living, only gender (t=6.60, p <.01) and age (t=3.11, p >.05), emerge as
significant predictors in explaining emotional stability of visually
handicapped students. On the other hand family system (t=1.15, p >.05) and
area of living (t=.71, p >.05) have no significant emergence as the predictors
of emotional stability of visually handicapped students.
Table 28
Emotional Stability Regressed on Gender, Age, Family System (FS) and Area of Living (AL) of Sighted Students
Variables
Gender
Age
FS
AL
R
Standardized coefficient
-.057
.058
-.168
-.021
t
.55
.56
1.60
.19
P
>.05
>.05
>.05
>.05
.04
120
Table 28 explains that 4% variation in emotional stability can be
defined on the basis of the four predictor variables i.e. gender, age, family
system and area of living. However, all the four predictors i.e. gender (t=.55,
p >.05), age (t=.56, p >.05), family system (t=1.60, p >.05), and area of living
(t==.19, p >.05) do not have any significant contribution as the predictors of
emotional stability of sighted students.
The focus of the present investigation is on studying Creative
Experience and Academic Achievement as Determinants of Self-esteem and
Emotional Stability of Visually Handicapped Students. Results indicate that
creative experience does not have any significant contribution in defining
self-esteem of visually handicapped and sighted students (Table 17). Table 18
clearly shows that creative experience does not emerge as a significant
predictor in explaining self-esteem of visually handicapped students. Creative
experience also has no significant role in describing self-esteem of sighted
students (Table 19). Thus on the basis of the above results we can conclude
that creative experience has no significant influence on self-esteem.
Some earlier studies support this finding like Wright and Noppe (1975)
found no significant relationship between creativity and self-esteem.
Williams, Poole, and Lett (1977) found that there were no significant
differences between the self-esteem scores of high and low creative
individuals. Rampoul, Singh and Didyk (1998) found correlation between
self-concept and creativity, were generally low or negative. Copper (1977)
suggests no significant relationship between self-concept and creativity.
Jaquish and Ripple (1981) found no relationship between measure of
divergent thinking and self-esteem across different age groups.
On the other hand, Felker and Trefinger (1971) found that fourth grade
students having high self-concept, scored significantly higher than low self-
concept students on self-evaluation of creative abilities and verbal fluency,
flexibility and originality. Nabi (1979) argued that the creative person possess
self-acceptance to a greater extent than less creative people. Kristen and Giri
(1996) also found positive relation between self-esteem and creativity.
122
Coopersmith (1967) found that persons with high self-esteem are likely to be
more creative, assertive, and independent than persons with low self-esteem.
Curva (1983) found a significant correlation between the self-concept and
subtest fluency of the creative thinking test.
It is clear from above studies that some studies found positive
relationship between creativity and self-esteem whereas, others found
negative relationship. Many of the discrepancies may be due to the use of
different measures of creativity and of self-esteem or self-concept. The
concept of self-esteem and self-concept are not precisely the same, and some
of the differences in the results may be due to using the term interchangeably.
In addition, inconsistencies in the result may be due to that people of different
age groups were used as subjects in different studies. It may not be
appropriate to compare studies using people of different age groups because
the relationship between creativity and self-esteem/self-concept may vary
over the life span. In any instance it is not at all clear that creativity
necessarily related to a good self-concept. Therefore, it is probably best to say
that creativity and self-concept are moderately positively related.
Results also highlight that academic achievement emerged as
significant predictor in explaining self-esteem of overall sampled population
i.e. visually handicapped and sighted students (Table 17). However, academic
achievement does not emerge as significant predictor of self-esteem of
visually handicapped students (Table 18). Academic achievement has been
emerged as a significant predictor in describing the self-esteem of sighted
students (Table 19).
123
A number of studies supported the finding that academic achievement
is a significant predictor of self-esteem. Some studies have shown that
academic achievement and self-esteem have a positive relationship. Purky
(1970) found that self-esteem is related to some components of success either
academic or verbal. He concluded that there is continuous interaction between
self-esteem and academic achievement. Low self-esteem is believed to cause
countless diverse problems such as academic underachievement, academic
overachievement, drug addiction, violent behaviour, teenage pregnancy and
criminal behaviour (Adler, Cohen, Honston, Manly, Wingert & Wright,
1992). Beck (1984) supported the contention that positive self-concept and
academic achievement are closely related. Rosenberg (1965) suggests that
the key to self-esteem is that the amount of difference between what a person
desires and what that person considers he/she achieved and the general sense
of support that persons feels from people around him/her.
High self-esteem has many positive effects and benefits, especially
among college students. Students who feel positive about themselves have
fewer sleepless nights, succumb, less easily to pressure of conformity by
peers, are less likely to use drugs and alcohol, are more persistent at difficult
task, are happier and more sociable, and most pertinent to this study is that
they tend to perform better academically. On the other hand, college students
who have low self-esteem tend to be unhappy, less sociable, more likely to
use drugs and alcohol, and are vulnerable to depression, which are all related
with lower academic achievement (Wiggins, 1994). Marsh (1992) found very
specific relationship between self-concept and school achievement.
124
Hamachak (1995) also stated that self-concept and school achievement
are related. The major issue is the direction of the relationship: does self-
concept produce achievement, does achievement produce self-concept. Gage
and Berliner (1992) state, "the evidence is accumulating, however, to indicate
that level of school success, particularly over many years, predicts level of
regard of self and one's own ability (Bridgeman & Shipman,1978:
Kifer,1975) whereas level of self-esteem does not predict level of school
achievement. The implication is that teachers need to concentrate on the
academic success and failures of their students. It is the students' history of
success and failure that gives them the information with which to assess
themselves".
There is general agreement that there is a close relationship between
self-esteem and academic achievement. However, there is considerable
disagreement as to the specific nature of this relationship. It has been argued
that students have to do well in school in order to have positive self-esteem or
self-concept, another position is that a positive self-esteem is necessary
prerequisite for doing well in school.
Covington (1989) reported that as the level of self-esteem increases,
academic achievement also increases; as self-esteem decreases, achievements
decline. Holly (1987) compiled a summary of some 50 studies, and indicated
that most supported the idea that self-esteem was more likely the result than
the cause of academic achievement. However, he acknowledged that certain
level of self- esteem is needed in order to achieve academic success for a
student and that self-esteem and achievement go hand in hand. They feed
each other.
125
However, the debate about which comes first- a positive self-concept
or academic achievement-is more academic than practical. The most essential
thing is to appreciate the interaction and the reciprocal dynamics between
self-concept and achievement. They are mutually reinforcing. While there
may be little justification for embarking on a programme to raise the level of
self-esteem with the aim of raising academic achievement. There are many
other justifications for raising self-esteem of students.
Research on the effects of self-esteem on educational levels has shown
that those with a higher level of self-concept tend to do better in school and
receive more education. This further specifies, those with more education
have a higher level of self-concept. Various studies have shown that people
with low self- esteem try to avoid exposing their unfavourable characteristics.
In order to do this, they avoid any thing that may risk revealing their mistakes.
Due to this, they do not take on any challenges that may also bring rewards,
such as furthering their education (Wood et al, 1994).
Different studies reached the conclusion ihat academic achievement
and self-esteem are positively related (Bankston & Zhou, 2002; Lockett &
Barrel, 2003; Verkuyten & Brug, 2002; Wong & Watkins, 2001). Educational
achievement and self-esteem seem to be highly interrelated and influences
each other; nonetheless, the foundation for academic achievement seems to be
positive self-esteem, which has to be cultivated early in life. Low self-esteem
is often cited as the eventual source of poor academic achievement and self
destructive behaviour (Haggerty et al, 1996). Maikhuri (1997) found in his
study that there is no significant correlation between academic achievement
and self-concept.
126
The present investigation reveals that academic achievement is a
significant predictor of self-esteem of sighted students however; it is not a
significant predictor of self-esteem of visually handicapped students. Results
also depicts that creative experience does not predict self-esteem of sighted as
well as visually handicapped students. Reasons behind this are that in
academic achievement a student is able to get his/her academic performance
in the form of examination report card. This visual report card is helpful to
enhance self-esteem of sighted students. Whereas visually handicapped
students do not perceive it in the similar manner, the visually handicapped
students greatly differ from the sighted students in terms of self-esteem and
academic achievement.
Contrary to this, creative experience is not a predictor of sighted or
visually handicapped students. The creativity is the inner ability of an
individual. Although the students are being applauded for their creativity, but
it encourages them for the time being and does not have any impact on their
report card. That is why it is not a significant predictor of self-esteem.
Results indicate that creative experience does not contribute
significantly in explaining emotional stability of visually handicapped and
sighted students (Table 20). Table 21 shows that creative experience has no
significant role in defining emotional stability of visually handicapped
students. In Table 22 we can see that creative experience does not emerge as a
significant predictor in elucidating emotional stability of sighted students. On
the basis of this result we can say that creative experience is not a significant
predictor of emotional stability.
127
There have been many studies which support these findings like Cattell
and Drevdahi (1955) compared the scores of 140 famous scientists in
American universities, with those of university teachers and administrators
and also with average score of the general population. The research scientists
were found to be more withdrawn and unsociable, less emotionally stable,
more intellectually self-sufficient and more radical. The same differences
were found when Drevdhal (1956) compared creative and non creative
students in science and arts subjects. Creative individuals have been observed
to be gloomy, bitter, cool, unstable, pessimist and pleasure seeking (Barron
1969). Comparative studies are also available on artists-non artists, and
scientists-non scientists. Personality factor like stability, anxiety, neuroticism
and emotional stability, dominance, independence of emotional behaviour,
sensitivity towards others, unconventionality and flexibility, originality, ego
involvement and ego strength, control over the impulses, early interest in
intellectual activities and hobbies and emotional responsiveness have been
comparatively observed to be present in creative individuals. (Roger & Mc
Guire, 1967; Cattele 1963; Eiduson, 1962; Taylor & Barron 1963; Cattel
1958; Butcher, 1970).
Cattell and John (1964) found creativity to be much more associated
with emotional stability. Goyal (1974), while studying creative science
students found that they were characterized by higher level of intelligence,
emotional stability and better adjustment. Singh (1975) indicated in his
findings that various components of creativity showed positive and significant
relationship with emotional adjustment as well as with social adjustment.
Gupta et al (1976) found creativity to have positive and significant relation
128
with social, emotional and educational adjustment of the individual. Singh
(1980) reported creativity to have positive and significant relation with social,
educational and overall adjustment, but not with the emotional adjustment.
As far as non significant contribution of emotional adjustment to
creativity is concerned, it has already been remarked that even emotionally
disturbed people like neurotics or psychotics can produce something novel
and original, depending upon their inner conflicts and inner urges. Of course
the analysis of their creative works may reveal something different from that
of emotionally stable person. However, it is to be remarked that the greater
number of the empirical findings are in favour of positive influence of
emotional stability, independence and maturity on the creative behaviour.
Results of this study also show that academic achievement has no
significant contribution in explaining emotional stability of visually
handicapped and sighted students (Table 20). Academic achievement do not
play significant role in defining emotional stability of visually handicapped
students (Table 21). In case of sighted students academic achievement also
have no significant contribution in interpreting emotional stability (Table 22).
Lounsbury (2004) studied general intelligence, big five personality
traits and construct work drive in relation to two measures of collegiate
academic performance a single course grade, and self reported grade point
average. Emotional stability was significantly related to course grade but not
with grade point average (GPA).
Schnciderjan et al (2005) found strong correlation between emotional
stability and academic success. Significant correlation between big five traits
and academic performance have been demonstrated in a number of studies
129
(e.g., Busato, Prins, Elshout & Hamaker, 2000; Chamorro-Premuzic &
Fumham, 2003; De Fruyt & Mervielde, 1996; Furnham «fe Camrro-Premuzic
in press; Fumham et al Lounsbury, Sundstron, Loveland, & Gibson, 2003;
Paunonen & Ashton, 2001; Paunonen & Nicol 2001). Emotional stability has
been identified as factor, contributing to academic success within higher
education (Wankowski, 1991). Dhaliwal (1971) attempted to investigate the
relationship of certain personality factors with over and underachievement.
The findings revealed that over achievement goes with reservedness, high
verbal ability, emotional stability, obedience and sobriety while
underachievement goes with opposite tendencies of outgoing traits, low
verbal ability, emotional instability and happy go lucky dispositions.
Suri (1973) investigated the relationship between personality traits of
intellectually superior, average and below average students under matched
socioeconomic conditions. The findings revealed that superior students
differed from the average and below average and were found to be more
intelligent, emotionally stable, assertive, venturesome, tough mindedness, and
controlled and relaxed while the average and below average students were
found to be less intelligent, affected by feelings, obedient, assertive expedient,
shy, tender minded apprehensive, in-disciplined, self-conflicted and tense.
Sharma (2006) found in her study that children with high emotional stability
have better study habits than their counterparts with low emotional stability.
As the results represent that creative experience and academic
achievement of both the visually handicapped and sighted students do not
predict emotional stability. It is not necessary that a creative person will also
be emotionally stable perhaps the person may be less emotionally stable, as
130
most of the studies have shown this finding. Similarly, in case of academic
achievement the investigator does not find any significant impact of academic
achievement on emotional stability of both visually handicapped and sighted
students.
The fmding clearly reveals that emotional stability which is a
personality trait has been governed by various other factors. The factors,
which influence emotional stability of a person, are the behaviour and nature
of the family members, relatives, friends, and surroundings of that particular
person. All these factors make a person emotionally stable or unstable.
However, it may be possible that an emotionally stable person is able to
acquire a higher degree of achievements as most of the studies have found
similar results.
Table 4 shows that there is no significant difference between the mean
scores of visually handicapped and sighted students on creative experience.
Some studies support this fmding, Tisdal and Hurst (1971) conducted study
on divergent thinking and found that blind and sighted did not differ on
divergent thinking. Madsen and Darrow (1989) compared scores of 32 sight-
impaired students on the musical aptitude profile with their performance on a
test devised by Walker (1981) to pair visual imagery with musical stimuli.
Results indicated that subjects mean scores on the musical aptitude profile
were almost identical to the composite mean for similar age matched sighted
students. Walker test yields a lower mean.
Lister, Leach, and Walsh (1989) examined the extent to which the
development of conversation concepts in 24 visually handicapped children is
similar to that in 50 sighted children. Results strongly support for similarity in
131
order of acquisition of conversation concepts by visually handicapped
students and sighted students. Wyver and Markham (1999) compared the
scores of 19 children with severe congenital visual impairment (aged 4-12yrs)
and 82 children of same age and gender with full vision on divergent thinking.
Result shows that there is no significant difference in comparison of the mean
scores of children with severe visual impairment and students with full vision.
Halpin, Halpin, and Torrance (1973) compared scores of verbal fluency,
verbal flexibility and verbal originality on the Torrance Tests of Creative
Thinking for 81 blind and 81 sighted 6-12 yrs olds. Blind subjects were more
verbally fluent, flexible and original. Scores did not vary significantly by age,
sex or race.
Arora (2002) compared blind and normal children on creative potential
and found that blind children show poor creative potential than normal
children. Kamila (1986) compared the creative thinking of blind and normal
children. The findings of the study revealed that the normal children tend to
score significantly higher than the blind children on all the three creative
abilities viz fluency, flexibility and originality.
As the result shows that the visually handicapped and sighted students
do not differ significantly on creative experience. The major cause of this
result is that creativity is an innate human phenomenon. Almost every person
has this inborn tendency. That is why both the visually handicapped and
sighted students have no difference in case of creativity as most of the studies
support this finding. However, in the long run if a person has the exposure to
express creativity, may be more creative than the person who does not have
the exposure for it. As another set of studies shows that normal children are
132
more creative than visually handicapped. It is just because they have more
exposure in comparison to their counterparts.
Significant difference found between the mean scores of visually
handicapped and sighted students on academic achievement (Table 4).
Sighted students scored significantly high mean score on academic
achievement than visually handicapped students. Bhatnagar (1996) studied 50
blind and 50 sighted, studying in middle and high special school. Sighted
children were higher than the blind children on achievement. Visually
handicapped were poorly adjusted in emotional, social and educational
ground, they were also poor in their total adjustment (Sarita & Sharma 1987).
Venderlock (1982) observed that blind does better on arithmetic than
general population. Beaty (1994) conducted a study on assessment of
psychological and academic adjustment of 30 undergraduates with visual
impairments and 43 nondisabled undergraduates. Result revealed no
intergroup differences on psychosocial adjustment. The mean grade point
average of subjects with visual impairments was higher than that of
nondisabled subjects. Blind/low vision students scored higher than sighted
students on self-esteem. It is very interesting to note that a recent study
discovered an edge in achievement for the blind as compared to the sighted.
The achievement of blind children in Hindi, English and Social Sciences was
higher than the sighted peer in an integrated educational setting (Singh, 1984).
Okoro (1993) compared the academic achievement of sighted and visually
impaired pupils, when expose to two different teaching methods in science.
He found that visually impaired pupil performed better than the sighted
pupils.
133
Odetokun (1999) compared the academic achievement of the blind and
low vision pupils. Findings revealed that the low vision subjects had higher
academic achievement than the blind students. Martinez and Sewell (1996)
found no significant difference in the GPA score and IQ scores of the students
with and without visual impairment. Klinkosz, Sekowsk, and Brambring
(2006) compared academic achievement of sighted and visually handicapped
students. They found no main effect of visual status on academic
achievement.
The result explains that there is significant difference in the scores of
academic achievement of both visually handicapped and sighted students. It is
an acceptable general fact that vision plays an important role in every aspect
of human life. Hence, sighted students perform better than visually
handicapped students. Secondly, more accessories are available for the
sighted students in the form of books, audio, video and day to day
observations, whereas visually handicapped students have lesser number of
usefiil accessories. All these accessories are helpful to enhance the knowledge
of a person which led to better performance. That is why sighted students
have higher academic achievement in comparison to visually handicapped
students.
Table 4 also shows that there is no significant difference between the
mean scores of visually handicapped and sighed students on self-esteem.
Martinez and Sewell (1996) investigated the self-concept of students with and
without visual impairment. There was no significant difference between the
self-concept of visually impaired and sighted students. Sherrill et al (1990)
compared the self-esteem of blind and sighted disabled young people aged
134
from 9-18 years. No self-esteem differences were found between those
categorized as blind and disabled sighted youth. Griffm-Shirley and Nes
(2005) studied self-esteem and empathy among 71 students with visual
impairment and 88 sighted students. They found no significant differences
between the two groups of students in their level of self-esteem, empathy
towards others and bonding with pets. Hen, Weisse, and Lifshitz (2007)
conducted a study on self-concept and quality of friendship of 40 adolescents
with visual impairments (20 in public schools and 20 in a residential school)
were compared to those of 41 sighted adolescents. The findings indicate a
similar self-concept profile for sighted adolescents and adolescents with
visual impairment. Huurre, Komulainen and Aro (1999) found in their study
that the self-esteem of the sighted and visually impaired adolescents did not
differ significantly.
Beaty (1991) suggested that young people with visual impairment,
including with low vision has a lower self-concept in several dimensions than
their peers without impairment. Harter et al (1997) found that blind people
showed extreme values, they either had a very low self-concept overrated
their personal attributes compared to sighted people. Three studies of Spanish
students with low vision, aged 4-7, 8-11, and 12-17 years found overall, the
participant's score for some dimensions of self-concept were lower than those
of comparison groups of sighted students of same ages (Amezeua, Fernandez,
Lopez-Justicia, & Pichardo 2001). Lopez-Justicia, Martinez, and Medina
(2005) examined differences in self-concept between children with congenital
low vision and their sighted peers. The findings revealed that children with
low vision scored lower than those with normal vision.
135
Obikar and Stile (1990) compared the self-concept of visually impaired
and normally sighted students. They found that visually impaired subjects
scored high than normally sighted subjects on Student Self-Assessment
Inventory subscales. Another sample of blind and sighted 10-13 years old
school children showed higher self-esteem among blind children compared to
sighted children (Muller, Lamed, Leonetti & Muller 1984).
The result highlights an important finding in case of self-esteem. The
self-esteem of both the visually handicapped and sighted students does not
differ significantly. As we know that self-esteem is an internal tendency of a
person to value his/her self It is an inner feeling of one's self that how much
one favours his/her self In this world every human being valued
himself/herself, whether he/she may be normal or disabled. That is why there
is no significant difference between the two groups.
Result also shows no significant differences between the mean scores
of visually handicapped and sighted students on emotional stability (Table 4).
Zehran (1965) found that blind children possess the same personality
characteristics as that of the sighted one. Kapoor and Sen (1984) made a
comparative study of the congenitally and adventitiously blind and their
sighted peers on some personality variables. The results indicated that the
congenitally and adventhiously blind group do not differ significantly fi-om
each other or from their sighted peers on the personality variables, emotional
stability, perceptual rigidity and social responsibility.
Bhargava and Lavania (1981) compared the personality factors of
sensory disabled and normal children having same age and sex. The result
showed that the sensory disabled were more reserved, emotionally unstable,
136
shy, dependent, sentimental, secure and relaxed than their counterparts i.e. the
normal children. Goel and Sen (1985) reported few studies which were
carried out recently in the context of personality dimension of the visually
handicapped. The result showed that a large number of the subjects have poor
self-concept and emotional stability, below average intelligence and physical
dependence. Rath (1988) compared the personality dynamics of blind and
sighted students. The result showed that the blind subjects were less adjusted
on the dimensions of family relationship, emotional stability, adjustment to
reality, mood and conformity in comparison to sighted students.
The results show no significant difference between visually
handicapped students and sighted students on emotional stability. In general
terms, we consider emotions as an internal tendency. Every person has this
tendency. However, the personal experiences make a person emotionally
stable or unstable. Hence, it is the circumstances which play a crucial role in
the stability and instability of emotions. It means if a normal person faces the
bad circumstances and experiences, he/she may become emotionally unstable,
similarly can be happened in case of disabled. Contrary to this if a person
experiences good things in life; he/she may be emotionally stable, irrespective
of normality and abnormality. It may be occurred just opposite, e.g. if a
person has strong control over his or her emotion, can be stable in the bad
circumstances irrespective of sights and blindness. That is why there is no
significant difference in the emotional stability of visually handicapped and
sighted students.
Table 6 shows no significant difference between the creative
experience of visually handicapped boys and girls. Siddique (1989) found in
137
his study that blind boys were found much more creative than the blind girls.
Arora (2000) made a study on creative potential of congenitally impaired
boys and girls. Findings of the study revealed that boys of congenitally blind
group are more superior on creative potential and its components like fluency,
flexibility and originality.
Table 6 also shows that visually handicapped boys and girls differ
insignificantly on mean scores of academic achievement. Singh and Kumar
(1981) concluded that males and females do not differ in intelligence and
females have slightly greater aspiration than males. They further state that an
intelligent student achieves more and that higher expectations lead to higher
achievement. Haider (1998) found in his study that school performance of
boys differs from that of girls. Boys perform a shade better than girls.
Table 6 also shows no significant difference between the mean scores
of visually handicapped boys and visually handicapped girls on self-esteem.
Munford (1994) conducted a study and found no significant gender
differences in levels of self-esteem. The majority of studies have found that
during adolescence, females report lower self-esteem (Cairns et al., 1990;
Chubb et al., 1997; Martinez & Dukes, 1991; Quatman & Watson, 2001) and
greater depressive mood (Marcotte, Fortin, Potvin, & Papillon, 2002) in
comparison to males. Some researchers have also shown that not only
adolescent females report lower self-esteem, but their self-esteem decreases
and depressive symptoms increase over time when compared with males (e.g.,
Robins et al., 2002).
Peterson, Sarigiani and Kennedy (1991) indicated that blind men had
more positive and realistic self-concept than blind women. Rothemburg
138
(1997) also noted these differences and found that women scored higher on
personal identity, physical, family and social self-concept and men scored
higher on self satisfaction and moral self-concept. Alfered-Liro (1998) found
that male college students fare better in the transition between secondary and
tertiary education in terms of their self-concept. Male and female students
start with same level of self-concept, and female decline over the first 18
months of studies before starting to catch up with their male coimterpart.
Marsh (1990) suggests that it is possible that the female students will exhibit
lower levels of self-concept than their male peers.
Table 6 also shows that visually handicapped boys and visually
handicapped girls differ significantly on emotional stability. Visually
handicapped girls scored significantly high mean score on emotional stability
than visually handicapped boys. Arora (2002) found in his study that visually
handicapped girls are emotionally less stable than boys. Gramer and Imaike
(2002) proposed that females are less emotionally stable than males.
Table 7 shows that sighted boys and sighted girls do not differ
significantly on creative experience. Kelgeri, Khadi, and Phadnis (1989)
found in his study that there is no association between sex and creativity.
Kogan (1974) and Tegano and Moran (1989) found a tendency for
girls to score higher than the boys. However, boys scored higher on
originality in grade three. Coon (1969) and Warren and Luria (1972) found
higher scores for girls in early adolescents on figural creativity. Sajid (1984)
found female respondents had higher scores on creativity as compared to male
subjects.
139
Kelley (1965) found that boys were significantly more creative than
girls' respondents. Strauss and Strauss (1968) found male respondents to be
significantly high on creativity in comparison to their counterparts. Prakash
(1966) studied boys and girls on creativity and found that boys were
significantly higher on creativity as compared to the girls. Raina (1971) has
also shown the boys to be superior to the girls in respect of their creative
performance. Torrance (1962, 1965); Torrance and Aliotti (1969) in their
study found male respondents to be significantly higher on the measure of
verbal originality. Further there are studies which have reported no significant
difference between members of the two sexes with regard to their creative
performance. These suggest that sex and creativity are independent of each
other.
Table 7 also shows that sighted boys and girls do not differ
significantly on academic achievement. Various researchers found in their
studies that males score higher on average than females on tests of
mathematical abilities (Maccoby and Jacklin, 1974; Hyde, Fennema and
Lamen, 1990; Halpem, 1992; stumpf; 1995; Halpem 1996). Owens and
Barnes (1982) investigated how the gender differed in their learning
preferences in the subjects of English and Mathematics. Results indicated that
males have higher preferences for competition in Mathematics; however
females have higher preferences for competition in English.
Robert, Sarmistha and Sloane (2002) found in their study that although
women students perform better on average than their male counterparts, they
are significantly less likely to obtain a first class degree. Johnson (1993)
140
suggests in his study that females were more prone to report higher grade
point averages than males.
Table 7 also shows that sighted boys and sighted girls differ
significantly on self-esteem. Sighted boys scored significantly higher mean
scores on self-esteem than sighted girls. Kling et al (1999) conducted a study
to examine gender differences in global self-esteem. Result indicated that
males score higher on standard measure of global self-esteem than females
but the difference is small. A study has done by Seifert and Miller (1988)
stated that males are judged less harshly than females, which in turn causes
females' performance and behaviour to be evaluated negatively which
decreases their self-esteem. Marjoribanks and Mboya (2001) found in their
study that male participants had significantly higher score on perceptions of
their physical, emotional stability and relations with their peers, whereas the
female participants had significantly higher scores on perceptions of their
music abilities. Kaminski et al (2005) found in their study that boys reported
higher self-concept than girls on the physical ability and physical appearance
subscales, but girls had higher self-concept than boys on the reading subscale.
Cheng and Puge (1989) found in their study that male tended to have higher
self-esteem than the female.
Maehr and Nicholls (1980) suggested that some gender differences in
self-esteem might be due to a response bias, in that girls have been found to
be more modest in self-report measures than boys. Furthermore, some
researchers have shown that gender differences in adolescent self-esteem may
be linked to gender differences in the perception of physical appearance. For
example, a longitudinal study of students in the 3rd through 11th grades
141
indicated that in elementary school, boys and girls viewed their physical
appearance equally, but at the end of high school, girls' views of their physical
appearance was significantly lower than those of boys (Harter, 2000). Connor
et al (2004) found in his study that age is not significantly correlated with
self-esteem.
Table 7 also shows no significant difference between sighted boys and
sighted girls on emotional stability. Budaev (1999) found that females have
higher agreeableness and lower emotional stability than males. Gramer and
Imaike (2002) also report that men's emotions are stable than women.
Brabner (2003) indicated that females tend towards affection and sadness, and
males incline to pride. Affection and sadness are categorized negative
emotions (low emotional stability); pride is classified low agreeableness
(Gomez, 2006). In addition, Wolfradt and Dalbert (2003) found that females
tend to neuroticism (low emotional stability). Aleem (2005) conducted a
study and found that the male students are more emotionally stable than
female students.
Table 8 shows no significant difference between two age groups that is
5-12 years and 13-19 years visually handicapped and sighted students on
creative experience, academic achievement, self-esteem and emotional
stability.
It is clear from table 9 that there is significant difference between two
age groups i.e. 5-12 years and 13-19 years of visually handicapped students
on creative experience, academic achievement and emotional stability
whereas, no significant differences found between these two age groups on
self-esteem. Visually handicapped students, whose age are 5-12 years, scored
142
significantly high mean scores than 13-19 years age group of visually
handicapped students on emotional stability, while visually handicapped
students whose age are within the range of 13-19 years, scored significantly
high mean scores than 5-12 years age group of visually handicapped students
on creative experience. On academic achievement 13-19 years age group of
visually handicapped students scored significantly high mean scores than 5-12
years age group of visually handicapped students.
Table 10 shows no significant difference between two age groups that
is 5-12 yrs old and 13-19 yrs old sighted students on creative experience,
academic achievement, self-esteem and emotional stability.
Mumford, Olsen and James (1989) studied the influence of age on
creativity and argued that the creation of new understandings is most likely to
occur in the earlier phases of people's careers. Daccy (1989) examined the
evidence in support of the theory that there are certain critical periods in life
during which creative ability can be cultivated most effectively. These 6
periods are 0-5 yrs, 10-14 yrs, 18-20 yrs, 28-30 yrs, 40-45 yrs and 60-65 yrs.
Read (2005) investigated self-perceived changes in creativity over the life
span. Findings indicated that participants do not perceive a decline in
creativity with age.
Environmental influences may explain in part, why childhood
creativity seems to be a poor predictor of adult creativity (Albert, 1996).
Although most young children are very creative, it is estimated that creativity
diminished by 40% between the ages 5 and 7 (Grupas, 1990; McCormick &
Plugge, 1997). At these ages formal schooling begins, and there is some
agreement that education inhibits the transformation of early talent into adult
creativity (Albert, 1996; Amabile, 1996).
143
Haider (1998) found in his study that the classroom performance of
younger subjects were better than the older subjects.
Findings on age as a predictor of self-esteem have been inconsistent.
Various longitudinal studies (Bergman & Scott, 2001; Block & Robins, 1993;
Chubb et al., 1997; Wade, Thompson, Tashakkori, & Valente, 1989) and a
cross-sectional study (MuUis «fe Chapman, 2000) found that self-esteem levels
remained constant with increased age, and therefore increased age was not a
significant predictor of self-esteem. Other longitudinal researches indicated a
gradual increase in self-esteem across adolescence (Hirsch & Rapkin, 1987;
Jones & Meredith, 1996; O'Malley & Bachman, 1983; Wigfield et al., 1991).
Conversely, Robins and colleagues (2002) provided a comprehensive picture
of age differences in self-esteem from age 9-90 years. Self-esteem levels were
high in childhood, dropped during adolescent, rose gradually throughout
adulthood, and decline sharply in old age. Hoppe (1995) showed in his study
that the correlation between self- esteem and age was 0.6. He found that age
determines self-esteem. Old people tend to have higher level of self-esteem
than do younger people. As per table 8 depicts. Some researches indicated
that self-concept remains stable over the life span. Others indicate that it can
increase with experience. It is therefore possible that older students will
exhibit higher level of self-concept than the younger students (Marsh, 1990).
When children were younger they never thought about self-esteem and
what it meant or even how it could possibly shape them as a person. As they
got older, self-esteem started to become of some importance on how they
viewed themselves especially when their peers started to have an influence or
impact on their life.
144
Table 14 reveals the fact that area of living has no significant
influences on creative experience, academic achievement, self-esteem and
emotional stability of overall population i.e. visually handicapped and sighted
students. As the table 15 illustrates that in case of visually handicapped
students the area of living, either it is urban or rural does not play any
significant role in explaining the creative experience, academic achievement,
self-esteem and emotional stability. Table 16 reveals that area of living plays
no significant role in determining creative experience, academic achievement,
self-esteem and emotional stability of sighted students. Bansan and Agarwal
(1997) examined the differences in creative thinking ability among young
children. No significant difference was noted between rural and urban
children on creative thinking.
Siddique (1989) found in his study that children coming from urban
area have more creative potential in comparison to children coming from rural
area. Kelgeri, Khadi, and Phadnis (1989) found in their study that creative
performance of urban subjects was significantly better than that of rural
subjects. Srivastava (1981) found in his study that high achievement and high
self-concept are found frequently among urban students. Daftuar, Sinha and
Daftuar (2000) examined the relationship of risk taking with academic
achievement in students coming from different habitual backgrounds. It was
found that rural students showed greater risk taking than urban students.

The objective of the present endeavour was aimed to study the
"Creative Experience and Academic Achievement as determinants of Self-
esteem and Emotional Stability of Visually Handicapped Students. Keeping in
view the objective of the study, an empirical investigation was undertaken and
thereafter data were tabulated and analysed with the help of Product-moment
coefficient of correlation, t-test and Regression analysis for obtaining results.
The thesis comprises of six chapters. Chapter-I emphasises on the
present scenario of the visually handicapped students vis-a-vis independent
variable i.e. creative experience and academic achievement and dependent
variable self-esteem and emotional stability as a part of the introduction of
Ph.D. thesis.
In the past, handicapped children were excluded from the purview
of nominal experience. They have been treated as defective beings and
believed that these children will not profit from regular schools and their
facilities. In the early nineteenth century as the idea of democracy, individual
freedom and egalitarianism swept in west, and advancement in learning
theory and technology contributed to the emergence of optimistic attitude
towards handicapped pupils. UNESCO envisaged the most positive response
to this section of population in the year 1946. The Wamock committee (1978)
reviewed a report on the educational provisions for the handicapped children
and youth in England under the Act of Education for all handicapped children
(U.S. Public Law, 94-142). In India educational provisions for handicapped
children has become a priority as a result of the National Policy on Education
1986. All these attempts brought the galore of publicity on the needs of the
blind in the world and in India as well.
146
In 2002 there were 161 million visually impaired people in the world,
of whoml24 million had low vision and 37 million were blind. The disabled
population in India is approximately over 90 million, of these 40.5 million are
visually handicap in which 12 million are blind and 28.5 million are with low
vision. Hence, blindness is a severe handicap. A handicap is a disadvantage
for a given individual, resulting from impairment or disability, that limits or
prevents the fulfilment of a role that is considered normal depending on age,
sex, social and cultural factors for that individual. Individual whose normal
learning and development is impaired by visual conditions and who therefore,
need specific conditions and related services in order to develop their abilities
can be identified as visually handicapped.
Visual handicap includes-
One, who after the best possible adjustments and ocular corrections
uses remaining vision for learning is called partially sighted. A WHO
consultation has suggested "a person with low vision is one who has
impairment of visual functioning even after treatment and/or refractive
correction, and has a visual acuity of less than 6/18 to light perception, or a
visual field of less than 10 from the point of view of fixation, but who uses, or
is potentially able to use, vision for the planning and/or execution of task". In
order to decide which people may require special education and assistance
because of their visual disabilities, various governmental jurisdictions
developed more complex definitions referred to as legal blindness. Total
blindness refers to the complete lack of form and light perception and is
clinically recorded as "NLP" an abbreviation for no light perception.
147
Creativity is a highly complex cognitive ability that involves the
generation of new concept or ideas, or new associations between existing
concepts or ideas. Scientifically, the products of creative thought are usually
considered to have both originality and appropriateness. In other words, the
ability to make something original, to imagine things that do not exist, and to
come up with new ideas is called creativity. Creativity can make common
things special and special things common! Creativity is essentially a form of
problem solving that involves problems for which there are no easy answers:
that is problem for which popular or conventional responses do not work.
Creativity is a process through which a creative individual manifests
sensitivity to the problem, deficiencies, missing elements and irregularities.
The individual is very much anxious for the correct solution by way of
formulating hypothesis about deficiencies, testing and retesting in the light of
various modifications and ultimately achieves solution of the problem. In
view of this it is speculated that creativity will have an impact on the
personality of the visually handicapped in general and the emotional stability
and self esteem in particular. Hence, creativity is thought to predict self-
esteem and emotional stability of visually handicapped students.
Academic achievement has great importance in the present socio
economic and cultural context. Obviously in schools great emphasis is placed
on formal education. The effectiveness of any educational system is gauged to
the extent of the student achievement whether be it in cognitive, affective or
psychomotor domain. These objectives are socially established based on the
age, prior learning and capacity of individuals with regard to education,
socialization and qualification. Studies conducted on academic achievement
148
notably focus on student progress and individual, institutional and
organizational factors of achievement, along with social relationship
interactions that determine, facilitate or hinder academic achievement.
Academic achievement is the knowledge attained or skills developed
in the school subjects, are usually designed by test scores or by marks
assigned by teachers or by both. Students academic achievement can be
influenced by his intelligence, interest, aptitude, hard labour, method of
learning, socioeconomic status, family inference, home environment, parental
aspiration and reward, personality characteristics, sex differences, quality of
teaching, school environment and peer influence. Therefore, it can influence
the self-esteem and emotional stability of the individuals particularly the
visually handicapped.
Over the past few decades, self-esteem has been the theme of
numerous conferences and the subject of many books. The topic has huge
exposure, and parents and teachers have been endlessly instructed about how
important it is to build a child's self-esteem. Self-esteem is a widely used
concept both in popular language and in psychology. It refers to an
individual's sense of his or her value or worth, or the extent to which a person
values, approves of, appreciates, prizes, or likes himself or herself.
Emotional stability is considered as one of the important aspect of
human life. It is one of the effective determinants of the personality patterns.
An emotionally stable individual has the capacity to withstand delay in
satisfaction of needs, capability to tolerate a reasonable amount of frustration,
belief in long term planning and is able of delaying or revising his
expectations in terms of demands of the situations.
149
Chapter II has been devoted to review of literature. A perusal of
readily available literature on creativity the researcher reviewed that in certain
studies visually handicapped were more creative than the sighted students. In
a large number of studies the sighted students were more creative in
comparison to visually handicapped students. Whereas, a few studies
concluded that there is no significant difference between the visually
handicapped and sighted students on creativity. The reviewed literature shows
that creativity influences self-esteem. The studies concluded creativity
develops self-esteem. A number of studies assessed the effect of sex on
creativity. Amongst them some studies found that gender did not significantly
influence creative thinking. While other studies shows that boys are much
more creative than girls. A few studies found opposite results. Existing
literature compares the academic achievement of visually handicapped and
sighted students. Several studies found that visually handicapped students
were academically better than sighted smdents. Visual status has no main
effect on academic achievement. Some studies revealed the result that sighted
students do academically better than visually handicapped students. A number
of studies indicated significant relationship between self-esteem and academic
achievement. A few studies depicted that there is no significant correlation
between self-esteem and academic achievement.
Many researchers found similar self-concept profile for sighted
adolescents and adolescents with visual impairment. Whereas a few studies
concluded that visually handicapped students scored high on self-concept than
sighted students. Various scholars examined gender differences in global self-
esteem and concluded that male scored high on self-esteem than female.
150
Reviewed studies showed that visually handicapped were less emotionally
stable than sighted students. Many scholars concluded in their studies that
male students are more emotionally stable than female students. Several
investigations revealed that children with high emotional stability have better
study habits than their counterparts with low emotional stability.
Chapter III deals with the method and procedure opted for
investigation. The study was conducted on 200 students. Of these, 100 were
visually handicapped aftid 100 were sighted students. The sample of visually
handicapped students were selected from Ahmadi School for Blinds, Aligarh
Muslim University, Aligarh and the sample of sighted students were drawn
from Union School of Aligarh Muslim University, Aligarh. The sample of
visually handicapped students consisted of 63 boys and 37 girls and in the
sample of sighted students there were 50 boys and 50 girls. The upper age
limit of the sample is 19 years.
The general information or the family background of the visually
handicapped sample is that 70% of them belong to nuclear family system
while 30% students have joint family system. In case of sighted students as
high as 80% students live in the nuclear family system and only 20% belong
to the joint family system. In case of area of living 29%) visually handicapped
students belong to rural area and 71% belong to urban area whereas 5%
sighted students belong to rural area and 95%) belong to urban area. The
educational profile of visually handicapped students' parents shows that
12.5% parents have primary education while a higher percentage of secondary
level education can be seen that is 39%. The college/university educated
parents' percentage is 26%. A total of 22.5% parents are uneducated. On the
151
Other hand the 16.5% parents of the sighted students have primary education.
The secondary and college/university levels education is 31.5% and 25.5%
respectively. A formidable 26.5% parents are uneducated in the sighted
students' sample. The employment structure of the sampled visually
handicapped students' parents showed that out of total employed parents
30.9% are employed in the public sector/government services and 69.1% have
the private sector employment. Whereas the sighted students' parents have
24.5% public sector employment and as high as 75.5% private sector
employment. The average monthly income of the visually handicapped
students' parents 5,351 Rs per month. In case of the sighted students' parents
the average monthly income is only 4,260 Rs per month. The data was
collected individually. The investigator explained the items of the
questionnaire to each participant and recorded the responses accordingly.
In the present study the researcher used the following tools to
measure the academic achievement, creative experience, self-esteem and
emotional stability of visually handicapped and sighted students. The creative
experience of students is measured by ratings of their concerned teachers on a
five-point scale. For measuring academic achievement, the researcher had
used the annual examination marks of the students obtained from the office
records of the institution. Self-esteem of students is measured through Self-
esteem Inventory, developed by Prasad and Thakur (1977). It consists of 30
items. Of the thirty items, seventeen were socially desirable and thirteen were
socially undesirable. The scale was developed with a view to assess
personally perceived self and socially perceived self. Split-half reliability
coefficient of both sets of the inventory is .82 and .78 for personally perceived
152
self and socially perceived self respectively. Retest reliability coefficient
found for both the tests were.69 and .66 respectively for personally perceived
self and socially perceived self. Emotional stability of children is measured
through Emotional Stability Test for Children, developed by Sengupta and
Singh (1985). This scale contains 15 items for testing emotional stability of
children. The maximum possible score of this test is 15. Test-retest reliability
was .70 which was significant beyond .01 level. The split-half reliability was
.55. The data collected were analysed statistically by using SPSS package
15.0. Tests of Correlation, t-test, and Regression analysis are used.
Chapter IV and V are devoted to result and discussion. The results
conclude that creative experience did not predict self-esteem. Some earlier
studies support this fmding. They found no significant relationship between
creativity and self-esteem. On the other hand several studies found positive
relationship between self-esteem and creativity.
Results also showed that academic achievement did not emerge as
significant predictor of self-esteem of visually handicapped students. Sighted
students' academic achievement predicts their self-esteem. A number of
studies supported the finding that academic achievement is a significant
predictor of self-esteem. These studies also concluded that there is continuous
interaction between self-esteem and academic achievement. Results also
conclude that creative experience is not a significant predictor of emotional
stability. There have been many researchers who found in their study that
creative individuals are less emotionally stable, more intellectually self-
sufficient and more radical. But on the other side some researcher found
creativity to be much more associated with emotional stability.
153
Results also show that academic achievement has no significant
contribution in explaining emotional stability. Some scholars concluded in
their studies that emotional stability was significantly related to course grade
but not with grade point average.
The results depict that there is no significant difference between the
mean scores of visually handicapped and sighted students on creative
experience. Some studies support this finding. Studies conducted on divergent
thinking found that blind and sighted did not differ on divergent thinking.
Some studies have shown significant difference between the mean scores of
visually handicapped and sighted students on creative experience. These
studies conclude that sighted students scored significantly higher score on
academic achievement than visually handicapped students. A few studies
compared academic achievement of sighted and visually handicapped
students. They found no main effect of visual status on academic
achievement.
Result also shows that there is no significant difference between the
mean scores of visually handicapped and sighed students on self-esteem.
Some researchers investigated the self-concept of students with and without
visual impairment. They found no significant difference between the self-
concept of visually impaired and sighted students. Other studies suggested
that young people with visual impairment, including with low vision has a
lower self-concept in several dimensions than their peers without impairment.
Results reveal no significant differences between the mean scores of visually
handicapped and sighted students on emotional stability. Studies found that
blind children posses the same personality characteristics as that of the
sighted ones.
154
In the light of the research experience it is suggested that further
research is required for assessing other factors which influence academic
achievement of visually challenged students. Personality of blind and normal
children can be studied in more detail by taking a large sample to draw more
fruitful generalization.
Suggestions for Further Research
In social science no research work is perfect due to certam restrictions
and limitations faced by the researcher. So conducting research is a learning
process in which many issues gradually come to light and the total perspective
becomes clear. It is not possible to study all the variables in one single study.
Therefore, the investigator has some suggestions for further researches in the
field.
1. The academic achievement is effected by a large number of factors.
Besides self-esteem and emotional stability the other factor is
socioeconomic status which may be taken in to consideration by the
researchers to analyse their determining value for the achievement of
visually challenged.
2. Personality of blind and normal children can be studied in more detail
by taking a large sample to draw more fruitful generalization.
3. The visually challenged students may be compared with sighted
counterparts on different psychological and social factors. However,
comparison may be made on the basis of school ambience, i.e.,
integrated and segregated school settings.
155
4. The self-esteem differences between the blind students of the two
environments i.e. special and integrated school may also be quite
interesting for further researches.
5. A study of rehabilitation programme, welfare programme can be
undertaken through various institutions, organizations, voluntary and
non voluntary agencies.
6. The teaching method used for these children in our country can be
analyzed and compared with teaching practices used in other countries.
Suggestions can be made solicited and modifications made in the
existing prevalent methods in our country.
7. A study of status of literate and illiterate blind people in India can be
conducted.
Aberson, C. L., Healy, M., & Romero, V. (2000). In group bias and self-
esteem: A meta analysis. Personality and Social Psychology Review, 4,
157-173.
Accordino, D. B., Accordion, M. P., & Slaney, R. B. (2000). An investigation
of perfectionism, mental health, achievement and achievement
motivation in adolescents. Psychology in the Schools, 3>1, 535-545.
Adler, J., Cohen, A. D., Houston P., Manly, H., Winger & Wright, L. (1992).
Self-esteem: Tell me I'm terrific. Newsweek, 119, 46-51.
Albert, R. S. (1998). Some reasons why creativity often fails to make it past
puberty and into the real world. New Directions in Child Development,
72, 43-56.
Aleem, S. (2005). Emotional stability among college youth. Journal of the
Indian Academy of Applied Psychology, 31, 100-102.
Alfered-Liro, C, & Sigelman, C. K (1998). Sex differences in self-concept
and symptoms of depression during the transition to college. Journal of
Youth and Adolescence, 27, 219-244.
Ali, M. (1998). Personal values, career aspirations, academic achievement and
socioeconomic status as determinant of educational choice at senior
secondary level. Unpublished Thesis, Department of Education, AMU,
Aligarh.
Alves-Martin, M., Piexoto, F., Gouveia-Pareira, M., Amaral, V et al. (2002).
Self-esteem and academic achievement among adolescents.
Educational Psychology, 22, 51-62.
Amabile, T. M. (1996). Creativity in Context. Boulder, CO: Westview Press.
Amezcua, J. A., Fernandez, E., Lopez-Justicia, M. D., & Pichardo, M. C.
(2001). The self-concept of Spanish children and adolescents with low
vision and their sighted peers. Journal of Visual Impairment and
Blindness.
157
Arenu, A. 0. (2004). Psychological and sociological determinants of
academic achievement of Nigerian adolescents. IFE Psychologia:
InternationalJournal, 12, 116-124.
Arora, S. (2000). A study of creative potential of congenitally visually
impaired children. Recent Researches in Education and Psychology, 5.
Arora, S. (2002). Personality and Creativity of Blind. Anmol Publications,
New Delhi.
Asha, C. B. (1997). Creativity of learning impaired and normal children.
Disabilities and Impairments, 11,81-85.
Astin, A. W. (1992). Minorities in American Higher Education: Recent
Trends, Current Prospects, and Recommendations. San Francisco:
Jossey-Boss.
Auh, M. (1997). Prediction of musical creativity in composition among
selected variables for upper elementary. Bulletin of the Council for
Research in Music, 133, 1-8.
Aunola, K., Stattin, H., & Nurmi, J. (2000). Adolescents achievement
strategies, school adjustment and externalizing and internalizing
problem behaviors. Journal of Youth and Adolescence, 29, 289-306.
Bacete, F. G., & Ramirez, J. R. (2001). Family and personal correlates of
academic achievement. Psychological Reports, 88, 533-547.
Badura, A. S., Millard, M., Peluso, E. A. & Ortman, N. (2000). Effects of
peer education training on peer educators: Leadership, self-esteem,
health-knowledge, and behaviors. Journal of College Students
Development, 41, 471-478.
Baer, M., Oldham, G. R., Hollings-Head, A. B & Jacobsohn, G. C. (2005).
Revisiting the birth order-creativity connection: The role sibling
constellation. Creativity Research Journal, 17, 61-11.
158
Bailey, J. A. (2003). The foundation of Self-esteem. Journal of the National
Medical Association, 95, 388-393.
Baldwin, A. Y. (2001). Understanding the challenge of creativity among
African Americans. Journal of Secondary Gifted Education, 12, 121-
125.
Bankston, C. L. Ill, & Zhou, M. (2002). Being well vs. doing well: Self-
esteem and school performance among immigrant and non-immigrant
racial and ethnic groups. International Migration Review, 36, 389-415.
Bansal, I., & Agarwal, S. (1997). Role of computers in the enhancement of
creativity among young children. Psycholingua, 27, 111-114.
Barbotte, E., Guillemin, F., Chau, N., & the Lorhandicap Group (2001).
Prevalence of impairments, disabilities, handicaps and quality of life in
the general population: A review of recent literature. Bulletin of the
World Health Organization, 19.
Barron, F. (1961). Psychological Validity and Creative Freedom. New York,
Wiley.
Barthelemy, J. (2006). Aggression and the big five personality factors of
grades and attendance. Dissertation Abstracts International Section A:
Humanities and Social Sciences, 66, 2721.
Beaty, L. A. (1991). The effects of visual impairment on adolescent SQM-
conc&pi. Journal of Visual Impairment and Blindness, 83, 129-130.
Beaty, L. A. (1994). Psychological factors and academic success of visually
impaired college students. RE: view, 26, 131-139.
Belote, L. (2006). Low vision education and training: Defining the boundaries
of low vision patients. A personal guide to the VA Visual Impairment
Services Program.
159
Bergman, M. M., & Scott, J. (2001). Young adolescents' well-being and
health-risk behaviors: Gender and socioeconomic differences. Journal
ofAdolescence, 24, 1^3-197.
Blanty, M., Jalinck, M., Blizkovska, J., & Klimusova, H. (2004). Personality
correlates of self-esteem and life satisfaction. Studia Psychologica, 46,
97-104.
Blascovich, J., & Tomaka, J. (1991). Measures of self-esteem. In J. P.
Robinson, P. R. Shaver, & L. S. Wrightsman (Eds.) Measures of
Personality and Social Psychological Attitudes, Volume 1. San Diego,
CA: Academic Press.
Borilla, P., Bargellini, A., Rovesti, S., Pinelli, M et al. (1999). Emotional
stability, anxiety, and natural killer activity under examination stress,
Psychoneuroendocrinology, 24, 613-627.
Brambring, M. (2007). Divergent development of manual skills in children
who are blind or sighted. Journal of Visual Impairment & Blindness,
101,212-225.
Brambring, M. (2007). Divergent development of verbal skills in children
who are blind or sighted. Journal of Visual Impairment & Blindness,
101, 749-762.
Brase, G. L. & Guy, E. C. (2004). The demographics of mate value and self-
esteem. Personality and Individual Differences, 36,471-484.
Bratko, D., Chamorro-Premuzic, T., & Saks, Z. (2005). Personality and
school performance: Incremental validity of self- and peer-ratings over
intelligence. Personality and Individual Differences, 41, 131 -142.
Brebner, J. (2003). Gender and emotions. Personality and Individual
Differences, 34, 387-394.
Brunelle, E. A. (1970). Creative intelligence and freshmen English problem.
Journal of Genetic Psychology, 118,3-12.
160
Bruners, J. S. (1962). The conditions of creativity. In H. E Gruber, G. Terrell
and M. Wortheimer (eds.), Contemporary Approaches to Creative
Thinking. New York: Atherton Press, 1-30.
Budaev, S. V. (1999). Sex differences in the big five personality factors:
Testing an evolutionary hypothesis. Personality and Individual
Differences, 26, ^Ol-Sl3.
Busato, V. v., Prins, F. J., Elshout, J. J. & Hamaker, C. (2000). Intellectual
ability, learning style, personality, achievement motivation and
academic success of psychology students in higher education.
Personality and Individual Differences, 29, 1057-1068.
Butcher, H. J. (1970). Human Intelligence: Its Nature and Assessment. Great
Britain, Bulter and Tanner.
Cairns, E., McWhirter, L., Duffy, U., & Barry, R. (1990). The stability of
self-concept in late adolescence: Gender and situational effects.
Personality and Individual Differences, 11, 937-944.
Campos, A., Lopez, A., Gonzalez, M. A., & Perez-Fabello, M. J. (2000).
Aspects of creativity affected by imaging capacity. North America
Journal of Psychology, 2, 313-321.
Cassandro, V. J., & Simonton, D. K. (2003). Creativity and genius. (In: (PA
vol 90:9821) Flourishing: Positive Psychology and the Life Well-
Lived. Keyes, Corey, L. M. & Haidt, Jonathon (Eds). American
Psychological Association: Washington.
Cassidy, S., & Eachus, P. (2000). Learning style, academic belief system,
self-report student proficiency and academic achievement in higher
education. Education Psychology, 20, 307-322.
Cattell, R. B & Drevdahal, J. E. (1955). A comparison of the personality
profiles of eminent researchers with that of eminent teachers and
administrators and of the general population. British Journal of
Psychology, 44, 42S-261.
161
Cattell, R. B. (1958). Personality and Motivation Structure and Measurement.
New York, World Book Co.
Cattell, R. B. (1963). The interaction of hereditary and environmental
influences. British Journal of Statistical Psychology, 16, 191-210.
Chamorro-Premuzic, T., & Fumham, A. (2003). Personality traits and
academic examination performance. European Journal of Personality,
17,237-250.
Chandha, N. K. (1989). Causal antecedent of self-concept, locus of control
and academic achievement: A path analysis. Psychologia: An
International Journal of Psychology in the Orient, 32, 264-268.
Cheng, Hsiao-Ping., & Puge, R. C. (1989). The relationship among sex,
academic performance, anxiety and self-esteem of junior high school
in Taiwan. Journal of Multicultural Counseling and Development, 17,
123-133.
Chowdhury, M. (2006). Students personality traits and academic
performance: A five factor model perspective. College Quarterly, 9.
Christy, B., Shanimole., & Nuthetie, R. (2002). Self-perceptions of visually
impaired children aged 3-10 in India. Journal of Visual Impairment
and Blindness, 96, 596-598.
Chubb, N. H., Fertman, C. L., & Ross, J. L. (1997). Adolescent self-esteem
and locus of control: A longitudinal study of gender and age
diiiQv^ncQS. Adolescence, 32, 113-129.
Claxton, A. F., Panells, T. C, & Rhoads, P. A. (2005). Developmental trends
in the creativity of school- age children. Creativity Research Journal,
17,327-335.
Colbert, A. E., Mount, M. K., Harter J. K., Witt, L. et al. (2004). Interactive
effect of personality and perceptions of the work situations on work
place. Journal of Applied Psychology, 89, 599-609.
162
Cole, D. G., Sugioka, H. L., & Yamagata-Lynch, L. C. (1994). Supportive
classroom environment for creativity in higher education. Journal of
Creative Behavior, 33,111-193.
Connor, J. M., Poyrazli, S., Ferrer-Wreder, L., & Grahame, K. M. (2004). The
relation of age, gender, ethnicity, and risk behaviors to self-esteem
among students in nonmainstream schools. Adolescence, 39.
Coon, J. G. (1969). A cross-cultural study of sex differences in the
development of selected creative thinking abilities. Dissertation
Abstracts International, 29, 4828B.
Coopersmith, S. (1967). The Antecedents of Self-Esteem. San Francisco, CA.
W.H. Freeman.
Cornell, D. G., Delcourt, M. A. B., Goldberg, M. D., & Bland, L. C. (1995).
Achievement and self-concept of minority students in elementary
school gifted programs. Journal for the Education of the Gifted, 18,
189-209.
Cosbey, S. (2001). Clothing interest, clothing satisfaction and self-perceptions
of sociability, emotional stability and dominance. Social Behavior and
Personality, 29, 145-152.
Costa-Giomi, E. (2004). Effects of three years of piano instruction on
children's academic achievement, school performance and self-esteem.
Psychology of Music, 32, 139-152.
Covington, M. (1989). Self-esteem and failure in school. The Social
Importance of Self- Esteem. U.C. Press, Berkeley, CA.
Cropper, D. A. (1977). The relationship of creativity and self-concept to
counsellor effectiveness. Dissertation Abstract International, 37, 4978.
Curva, F. R (1983). Self-concept and creative thinking of Asian American
kindergarten children. Dissertation Abstract International, 44, 418-A.
163
Daccy, J. (1989). Peak period of creative growth across the life span. Journal
of Creative Behaviour, 23, 224-247.
Daftuar, C.N., Sinha, C, & Daftuar, L. C. (2000). Academic achievement and
risk- taking among tribal and non-tribal students of rural and urban
areas. Psychological Studies, 45, 103-105.
Dandona, L. & Dandona, R. (2006). Revision of visual impairment definitions
in the international statistical classical of diseases. BMC Med.4:7.
DeFruyt & Mervielde, I. (1996). Personality and interests as predictors of
educational streaming and achievement. European Journal of
Personality, 10,405-425.
Drevdahl, J. E. (1956). Factors of importance of creativity. Journal of Clinical
Psychology, 21-26.
Dummer, G. M., Lieberman, L., Moffett, A., & Shapiro, D. R. (2008).
Domain-specific ratings of importance and global self-worth of
children with visual impairments. Journal of Visual Impairment &
Blindness, 1.
Durbrow, E. H., Schaefer, B. A., & Jimerson, S. R. (2000). Learning
behaviors, attention and anxiety in Caribbean children: Beyond the
'usual suspects, in explaining academic performance. Social
Psychology International, 21, 242-251.
Dyck, M. J., Farrugia, C, Shochet, I. M., & Holmes-Brown, M. (2004).
Emotion recognition, understanding ability in hearing or vision-
impaired children: Do sounds, slight or words make the difference?
Journal of Child Psychology and Psychiatry, 45, 789-800.
Eiduson, B. T. (1962). Scientists; Their Psychological World. N. Y. Basic
Books.
El-Murad, J., & West, D. C. (2004). The definition and measurement of
creativity what do we know? Journal of Advertising Research, 44, 188-
201.
164
Einar, M. S., & Knut A. H. (1990). Academic achievement and self-concept:
An analysis of causal predominance in a developmental perspective.
Journal of Personality and Social Psychology, 58, 292-307.
EI-Anzi, F. O. (2005). Academic achievement and its relationship with
anxiety, self-esteem, optimism, and pessimism in Kuwaiti students.
Social Behavior and Personality, 33, 95-104.
Emmi, I., & Marja, K. (2005). How the big five personality traits explain trust
and self-esteem. Psykologia, 40,133-144.
English, H. B., & English A. C. (1958). A Comprehensive Dictionary of
Psychological and Psycho-Analytical Terms. New York, Mekey.
Erkut, S., Szalacha, L. A., Coll, C. G., & Alarcon, 0. (2000). Puerto Rican
early adolescents' self-esteem patterns. Journal of Research on
Adolescence, 10, 339-364.
Evans, S., & Douglas, G. (2008). E-Leaming and Blindness: A Comparative
Study of the Quality of an E-Leaming Experience. Journal of Visual
Impairment & Blindness, 102, 77-88.
Fasco, D. (2001). Education and creativity. Creativity Research Journal, 13,
317-327.
Feather, N. T. (1998). Attitude toward high achievers, self-esteem, and value
priorities for Australian, American and Canadian students. Journal of
CrOSS-Cultural Psychology, 29, 749-756.
Fellenius, K. (1999). Reading environment at home and at school of Swedish
students with visual impairments. Journal of Visual Impairment and
Blindness, 93,211-224.
Fickova, E. (1999). Personality dimensions and self-esteem indicators
relationship. Studia Psychologica, 41, 323-328.
Frandsen, A. N. (1961). Educational Psychology. The Principles of Learning
in Teaching. McGraw-Hill Book Company, Inc.
165
Freeman, S. F. N., & Alkin, M. C. (2000). Academic and social attainment of
children with mental retardation in general education and special
education settings. Remedial and Special Education, 21, 3-18.
Fromm, E. (1959). The creative attitude. Reffered in H. H. Anderson,
Creativity and its Cultivation. M. Y. Harper and Row, 44-54.
Gage, N., & Berliner, D. (1992). Educational Psychology (5th ed.). Boston:
Houghton Mifflin.
Garzarelli, P., Everhart, B., & Laster, D. (1993). Self-concept and academic
performance in gifted and academically weak students.
Geldoph, A. K. (1998). Parental Descriptions of Child Personality
Developmental Antecedents of the Big-Five? (eds.). Charles F.
Halverson, Ivan Mervielde and Valerie L. Havill, Lawrence Erlbaum
Associates.
Gerken, K. (1983). Self-Concept and Locus of Control as Related to
Achievement of Junior High Students. Journal of Psycho-Educational
Assessment, 1, 367-375.
Getzels, J. W., & Jackson, P. W. (1962). Creativity and Intelligence. N. Y.,
John Wiley and Sons.
Ginter, E. J. & Dwinell, P. L. (1994). The importance of perceived duration:
Loneliness and its relationship to self-esteem and academic
performance. Journal of College Student Development, 35, 456-460.
Gluck, J., Ernst, R., & Unger, F. (2002). How creative's define creativity:
Definitions reflect different types of creativity. Creativity Research
Journal, 14, 55-67.
Goel, S. K. (1985). Blindness and Visual Impairment. Socio-Psychic
Scientific Information Bureau, Delhi.
166
Goldner, B.B. (1962). The Strategy of Creative Thinking. Englewood Cliffs,
N.J., Prentice Hall.
Gompel, M., Van Ban., & Schreuder, R. (2003). Visual input and
orthographic knowledge in word reading of children with low vision.
Journal of Visual Impairment and Blindness.91, 273-284.
Good, C. V. (1973). Dictionary of Education. New York. McGraw Hill
Company.
Goyal, R. P. (1974). A study of some personality correlates of creativity in
secondary school teachers under training. Ph. D. Thesis, Education,
Punjab University.
Gramer, K. M., & Imaike, E. (2002). Personality, blood type, and the five-
factor model. Personality and Individual Differences, 32, 621-626.
Grenier, D., & Giroux, N. (1997). A comparative study of spelling
performance of sighted and blind students in senior high school.
Journal of Visual Impairment and Blindness, 91, 393-400
Griffin-Shirley, N., & Nes, S. L. (2005). Self-esteem and empathy in sighted
and visually impaired preadolescents. Journal of Visual Impairment
and Blindness, 99, 276-285.
Grover J., Ronning, R., & Reynolds J. (1989). Handbook of Creativity. New
York, N.Y: Plenum.
Grupas, A. (1990). Creative problem-solving. Paper presented at the Annual
Meeting of the Missouri Association of Community and Junior
Colleges, 15-17, (ED 343 81S).
Guay, F., Larose, S., & Boivin, M. (2004). Academic self-concept and
educational attainment level: A ten-year longitudinal study. Self and
Identity, 3, 53-68.
Guilford, J. P. (1968). Intelligence, Creativity and their Educational
Implications. Sen Diego, Calif R. R. Knapp.
167
Gumora, G., & Arsenio, W. F. (2002), Emotionality, emotion regulation and
school performance in middle school children. Journal of School
Psychology, 4Q,395-iU.
Gupta, K. B., Nisha, B., & Singh R. P. (1976). Creative thinking abilities and
creative personality- A study of relationship of verbal creative thinking
abilities and creative personality. Psycho-lingua, 6, 15-18.
Haggerty, S. et al. (1996). Educating Pupils with Special Needs in the
Ordinary school. Windsor NFErNelson.
Haider, S. 1. (1998). Visually Handicapped Children. New Delhi, Rawat
Publications.
Halpem, D. F. (1996). A process-oriented model of cognitive sex differences.
Learning and Individual Differences, 8, 3-24.
Halpin, G., Halpin, G., & Torrance, E. P. (1973). Effects of blindness on
creative thinking abilities of children. Developmental Psychology. 9,
268-274.
Hamachek, D. (1995). Self-concept and school achievement: Interaction
dynamics and a tool for assessing the self-concept component. Journal
of Counseling & Development, 12), 419-425.
Harber, K. D. (2005). Self-esteem and affect as information. Personality and
Social Psychology Bulletin, 31, 276-288.
Harter, S. (2000). Is self-esteem only skin-deep? Reclaiming Children and
Youth, 9, 133-138.
Harter, S., Bresnick, S., Bouchey, H. A., & Whitesell, N. R. (1997). The
development of multiple role relation selves during adolescence. Dev
Psychopath, 4, 835-853.
Hay, I., & Ashman. A. F. (2003). The development of adolescents' emotional
stability and general self-concept: The interplay of parents, peers and
gender. International Journal of Disability, Development & Education,
50,77-91.
168
Healey, J. (2002). Self-Esteem: Issues in Society. The Spinney Press.
Hen, I., Weisse, I., & Lifshitz, H. (2007). Self-concept, adjustment to
blindness, and quality of friendship among adolescents with visual
impainnents. Journal of Visual Impairment and Blindness, 101, 96-
107.
Hills, P., & Argyle, M. (2001). Emotional stability as a major dimension of
happiness. Personality and Individual Differences, 31, 1357-1364.
Holly, W. (1987). Self-Esteem: Does It Contribute to Students' Academic
Success? Eugene, OR: Oregon School Study Council, University of
Oregon.
Hoppe, H. M. (1995). The Effects of Self-Esteem on Education. Missouri
Western State College.
Huitt, W. (2004). Self Concept and Self-Esteem. Educational Psychology
Interactive. Valdosta, GA: Valdosta State University.
Hussain, S. (1988). Creativity: Concept and Findings. Delhi, Motilal
Banarsidass.
Hussain, S., & Sajid, S. M. (1990). Creativity in a familial perspective. Indian
Journal of Behavior, 14,28-37.
Huurre, T. M., Komulainen, E. J., & Aro, H. M. (1999). Social support and
self-esteem among adolescents with visual impairment. Journal of
Visual Impairment and Blindness, 93, 26-37.
Hyde, J. S., Fennema, E., & Lamon, S. J. (1990). Gender differences in
mathematics performance: A meta-analysis. Psychological Bulletin,
107, 139-153.
International Council of Ophthalmology. (2002). International standards:
Visual standards-aspects and ranges of vision loss with emphasis on
population surveys.
169
Jain, N. (1996). Personality profiles of parents of handicapped children.
Unpublished Thesis, Department of Psychology, A.M.U, Aligarh.
Jaquish, G. A., & Ripple, R. E. (1981). Cognitive creative abilities and self-
esteem across the adult life-span. Human Development. 24, 110-119.
Jenson- Reid, M., Davis, L., Saunder, J., & Williams, T. (2005) Academic
self-efficacy among African American youths: Implications for school
social work practice. Children and Schools, 27, 5-14.
Johnson, C. (1993). Influences of gender and academic achievement on
learning preferences of middle grade students. Paper Presented at the
Annual Meeting of the Mid South Educational Research Association.
Joseph, J. M. {\99A).The Resilient Child: Preparing Today's Youth for
Tomorrow's World. New York, Insight Books.
Judge, T. A., Vau Vianen, A. E. M., & De Peter, I. E (2004). Emotional
stability, core self-evaluations, and job outcomes: A review of the
evidence and an agenda for future research. Human Performance, 17,
325-346.
Jurcova, M., & Stubnova, L .U. (1999). Creativity and social competence of
adolescents. Studio Psychologica, 41, 193-202.
Justice, E. M., Lindsey, L. L., & Marrow, S. F. (1999). The relationship of
self-perceptions to achievements to achievement among African
American preschoolers. Journal of Black Psychology, 25, 48-60.
Kalliopuska, M. (1989). Empathy self-esteem and creativity among junior
ballet dancers. (ERIC Document Reproduction Service No. ED 311
026)
Kaminski, P. L., Shafer, M. E., Neumann, C. S., & Romos, V. (2005). Self-
concept in Mexican American girls and boys: Validating the self-
description. Questionnaire-I. Cultural Diversity and Ethnic Minority
Psychology, 11,321-338.
170
Kapoor, P., & Sen, A. (1989). A Comparative Study of the Congenitally and
Adventitiously Blind with their Sighted Peers on some Psychological
Variables. New Delhi, Atlantic Publisher and Distributer.
Kamis, M. H., Paradise, A. W., Whitker, D. J., Wheatman, S. R. et al. (2000).
Master of one's self-esteem is unstable. Personality and Social
Psychology Bulletin, 26, 1297-1305.
Kaufman, J. C. & Baer, J. (2004). Sure, I 'm creative -but not in
mathematics! Self-reported creativity in diverse domains. Empirical
Studies of the Arts, 22, 143-155.
Kavussanu, M., & Hamisch, D. L. (2000). Self-esteem in children: Do goal
orientations matter? British Journal of Psychology, 70, 229-242.
Kazmi, Z. (1990). Personality of high and low achievers at different levels of
intelligence. Unpublished Dissertation, Department of Education,
A.M.U, Aligarh.
Kelgeri., Khadi, P. B., & Phadnis (1989). Creativity among urban and rural
boys and girls. Indian Journal of Behavior, 13, 10-14.
Kelley, G. R. (1965). Creativity, school attitude and intelligence relationships
in grades four, six and eight. Dissertation Abstract, 25, 6390.
Kemple, K. M., & David, G. M. (1996). Preschoolers creativity, shyness, and
self-esteem. Creativity Research Journal, 9, 317-326.
Kerka, S. (1999). Creativity in adulthood. ERIC Clearinghouse on Adult
Career and Vocational Education Columbus OH.
Khalid, R. (1988). Self-esteem of minority children: A study of Pakistanis in
Scotland. Pakistan Journal of Psychological Research, 3, 23-32.
Khare, S., & Grewal, A. (1997). Relationship among speed of information
processing ability, creativity and academic achievement. Psycholingua,
25, 53-56.
171
Kiarie, M. W. (2004). Education of students with visual impairments in
Kenya: Trends and issues. International Journal of Special Education,
19.
Kilinkosz, W., Sekowski, A., & Brambring, M. (2006). Academic
achievement and personahty in university students who are visually
impaired. Journal of Visual Impairment and Blindness, 100, 666-675.
Kling, K. C, Hyde, J. S., Showers, C. J., & Buswell, B. N. (1999). Gender
differences in self-esteem: A meta analysis. Psychological Bulletin,
125,470-500.
Kobal, D., & Musek, J. (2001). Self-concept and academic achievement:
Slovenia and France. Personality and Individual Differences, 30, 887-
899.
Kogan, N. (1974). Creativity and sex difference. Journal of Creative
Behavior, 8, 1-4.
Koutsoulis, M. K., & Campbell, J. R. (2001). Family processes affect
students' motivation, and science and math achievement in Cypriot
high schools. Structural Equation Modeling. 8, 108-127.
Kristen, M. K., & Giri, M. D. (1996). Preschoolers creativity, shyness, and
self-esteem. Creativity Research Journal, 9, 317-326.
Kumar, A., & Sharma, A. K. (1993). Study of creativity among normal,
problem and handicapped children in relation to some familial
background factors. Indian Journal of Behavior, 17, 27-34.
Kurtzberg, T. R. (2005). Feeling creative, being creative: An empirical study
of diversity and creative teams. Creative Research Journal, 17, 51-65.
Lan, Chiu-Hui. (2005). Relationships among socio-economic status,
parenting, academic achievement, and self-esteem in early and middle
adolescence: A longitudinal study. Dissertation Abstract International
Section a: Humanities and Social Sciences, 65, 4591.
172
Lane, J., Lane, A. M., & Kyprianou A. (2004). Self-efficacy, self-esteem and
their impact on academic performance. Social Behavior and
Personality, 32, 247-256.
Lea-Wood, S. S., & Clunies-Ross, G. (1995). Self-esteem of gifted adolescent
girls in Australian schools. Special issue: The psychology of the gifted.
Roeper-Review, 17, 195-197.
Lee, Kyung-Hye. (2002). Creative thinking in real world situations in relation
to gender and education of late adolescents. Korean Journal of
Thinking and Problem Solving, 12, 59-70.
Legun, H. L & Hoare, C. H. (2004). Impact of a career intervention on at risk
middle school students' career maturity levels, academic achievement,
and self-esteem. Professional School Counseling, 8, 148-155.
Lister, C , Leach, C, & Walsh, M. (1989). The development of conservation
concepts in children with visual impairment. British Journal of
Educational Psychology, 59, 211 -219.
Lockett, C. T., & Harrell, J. P. (2003). Racial identity, self-esteem, and
academic achievement: Too much interpretation, too little supporting
data. Journal of Black Psychology, 29, 325-336.
Lopez-Justicia, M. D., Martinez, M. C. P., & Medina, A. C. (2005). Self-
concepts in low vision children and their peers without visual
problems. Self and Identity, 4, 305-309.
Lorenzo, M. K., Frost, A. K & Reinherz, H. Z. (2000). Social and emotional
functioning of older Asian American adolescents. Child and
Adolescent Social Work Journal, 17, 289-304.
Loska, J., Loksava, I., & Korcova, N. (2000). Analysis of the effect of socio-
psychological factors on creative performance. Studia Psychologica,
42,209-216.
173
Lounsbury, J. W. (2004). Predicting academic success: general intelligence,"
Big Five" personality traits and work drive. College Students Journal.
Lounsbury, J. W., Huffstetler, B. C, Leong, F. T., & Gibson, L. W. (2005).
Sense of identity and collegiate academic achievement. Journal of
College Student Development.
Lounsbury, J. W., Sundstrom, E., Loveland, J. M., & Gibson, L. W. (2003).
Intelligence, "Big Five" personality traits, and work drive as predictors
of course grade. Personality and Individual Difference, 35, 1231-1239.
Lowenstein, L. F., Meza, M., & Thome P. E. (1983). A study in the
relationship between emotional stability, intellectual ability, academic
attainment, personal contentment and vocational aspirations. Acta
Psychiatrica Scandinavica, 67, 13-20.
Maccoby, E. S., & Jacklin, C. M. (1974). The Psychology of Sex Differences.
Stanford, CA: Stanford University Press.
Madsen, C. K. & Darrow, A. A. (1989). The relationship between music
aptitude and sound conceptualization of the visually impaired. Journal
of Music Therapy, 26, 71-78.
Maehr, M. L., & NichoUs, J. G. (1980). Culture and achievement motivation:
A second look. In N. L. Warren (Ed.), Studies in Cross-Cultural-
Psychology (3, 221-267). San Diego, CA: Academic Press.
Maikhuri, R., & Pande, S. K. (1997). Self-concept of adolescents in relation
to their academic achievement. Psycho-Lingua, 27, 121-124.
Makikangas, A., Kinnunen, U., & Feldt, T. (2004) Self-esteem, dispositional
optimism, and health: Evidence from cross-lagged data on employees.
Journal of Research in Personality, 38, 556-575.
Manoharan, R. J. L., & Doss, I. C. (2007). Emotional maturity of post
graduate students in Pondicherry region. Experiments in Education,
35,8.
174
Marcotte, D., Fortin, L., Potvin, P., & Papillon, M. (2002). Gender differences
in depressive symptoms during adolescence: Role of gender-typed
characteristics, self-esteem, body image, stressful life events, and
pubertal status. Journal of Behavioral and Emotional Disorders, 10,
29-42.
Marjoribanks, K. (2005). Family background, academic achievement, and
educational aspirations as predictors of Australian young adults'
educational attainment. Psychological Reports, 96, 751-754.
Marjoribanks, K., & Mboya, M. M. (2001). Age and gender differences in the
self-concept of South African students. Journal of Social Psychology,
141.
Marsh, H. (1992). The content specificity of relations between academic self-
concept and achievement: An extension of the Marsh/Shavelson model.
ERICNO:ED349315.
Marsh, H. W. (1990). The structure of academic self-concept. The
Marsh/Shavelson model. Journal of Educational Psychology, 82,
623-636.
Martinez, R. & Sewell, K. W. (1996). Self-concept of adults with visual
impairments. The Journal of Rehabilitation, 62.
Martinez, R., & Dukes, R. L. (1991). Ethnic and gender differences in self-
esteem. Youth & Society, 22, 318-338.
Matthews, D. B., & Odom B. L (1989). Anxiety: A component of self-esteem.
Elementary School Guidance and Counseling, 24, 153-159.
Matuga, J. M. (2004). Situated creative activity: The drawings and private
speech of young children. Creativity Research Journal, 16, 267-281.
Mc Cabe, R. E., Blankstein, K. R., & Mills, J. S. (1999). Interpersonal
sensitivity and social problem solving: Relations with academic and
social self-esteem, depressive symptoms and academic performance.
Cognitive Therapy and Research, 23, 587-604.
175
Mc Gee, R., & Williams, S. (2000). Does low self-esteem predict health-
compromising behaviors among adolescents? Journal of Adolescence,
23, 569-582.
McCormick, D. J., & Plugge, C. D. (1997). If I Am an Artist, What's Wrong
with My Picture? In Deeply Rooted, Branching Out, 1972-1997.
Annual AEE International Conference Proceedings. Boulder, CO:
Association for Experiential Education, (ED 414 141).
McNabb, R., Pal, S., & Sloane, P. (2002). Gender differences in education:
The case of university students in England Wales. Economica, 69,
481-503.
Mecca, A. M., Smelser, N. J., & Vasconcellos, J. (1989) (eds.). The Social
Importance of Self-Esteem. Berkeley, CA: University of California
Press.
Mendick, S.A. (1964). Continual association as a function of level of
creativity and types of verbal stimulus. Journal of Abnormal and
Social Psychology, 69, 511-515.
Merek, B., Martin, J., Jaroslava, B., & Helena, K. (2004) Personality
correlates of self-esteem and life satisfaction. Studio Psychological, 46,
97-104.
Midgett, J., Ryan. B. A., Adams, G. R., & Corvill-Smith, J. (2002).
Complicating achievement and self-esteem: Considering the joint
effects of child characteristics and parental child interactions.
Contemporary Educational Psychology, 27, 132-143.
Mioduser, D., Lahav, O., & Nachmias, R. (2000). Using computers to teach
remedial spelling to a student with low vision: A case study. Journal of
Visual Impairment and Blindness, 94, 15-25.
Mishra, P. (1997). Some cognitive and motivational correlates of child rearing
in India. Trends in Social Science Research, 4, 155-162.
176
Mohanty, N. (2000). School type, psychological differentiation and academic
achievement of tribal and non-tribal children. Psychological Studies,
45, 100-102.
MoUer, J., & Koller, O. (2000). Spontaneous and reactive attributions
following academic achievement. Social Psychology of Education, 4,
67-86.
Moneta, G. B. & Sin, C. M. Y. (2002). Trait intrinsic and extrinsic
motivations, academic performance, and creativity in Hong Kong
college students. Journal of College Student Development, 43, 664-
683.
Mukhtar, R. (1992). Locus of control and need pattern of the handicapped -A
pilot study. Unpublished Dissertation, Department of Psychology,
A.M.U, Aligarh.
MuUis, R. L. & Chapman, P. (2000). Age, gender, and self-esteem
differences in adolescent coping style. Journal of Social Psychology,
140,539-541.
Mumford, M. D.. Olsen, K. A., & James, L. R. (1989). Age related changes in
the likelihood of major contributions. International Journal of Aging &
Human Development, 29, 171-194.
Munford, M. B. (1994). Relationship of gender, self-esteem, social class, and
racial identity to depression in Blacks. Journal of Black Psychology,
20, 157-174.
Muqsud, M., & Rouhani, S. (1991). Relationships between socioeconomic
status, locus of control, self-concept, and academic achievement of
Batswana adolescents. Journal of Youth and Adolescence, 20.
Murk, C. (1995). Self-Esteem Research, Theory, & Practice. New York,
Springer Publishing Company.
177
Mustafa, B. (2004). Assessment of academic stress and its impact on
academic performance and adjustment of the students. Unpublished
Thesis, Department of Psychology, A.M.U, Aligarh.
Nabi, K. (1979). Personality and self: The creativity discussion. Indian
Psychological Review, 18, 5-8.
Nabi, S. (1989). A study of personality correlates of creativity among
adolescent students. Unpublished Thesis, Department of Psychology,
AMU, Aligarh.
Niaz, M., Saud de Nunez, G., & Ruiz de Pineda, I. (2000). Academic
performance of high school students as a function of mental capacity,
cognitive style, mobility-fixity dimension and creativity. Journal of
Creative Behavior, 2,A, 18-29.
Norman A. D., Ramsay, S. G., Martray, C. R., & Roberts, J. L. (1999).
Relationship between levels of giftedness and psychosocial adjustment.
Roeper Review, 22, 5-9.
Nowell, A., & Hedges, L. V (1998). Trends in gender differences in academic
achievement from 1960 to 1994: An analysis of differences in
mean/variance and extreme scores. Sex Roles: A Journal of Research.
Oakland, T., Banner, D., & Livingston, R. (2000). Temperament based
learning style of visually impaired students. Journal of Visual
Impairment and Blindness, 94, 26-33.
Obiakar, F. E., & Stile, S, W. (1990). The self-concepts of visually impaired
and normally sighted middle school children. Journal of Psychology,
124, 199-206.
Oka, N. (2003). Educational reforms in the in the Perkins institution and
Massachusetts Asylum for Blind: Music education. Japanese Journal
of Special Education, 40, 689-699.
178
Oldham, G. R. & Cummings, A. (1996). Employee creativity: Personal and
contextual factors. Academy of Management Journal, 39, 607-635.
O'Malley, P. M., & Bachman, J. G. (1983). Self-esteem: Change and stability
between ages 13 and 23. Developmental Psychology, 19, 257-268.
Ophir-Cohen, M., Ashkenazy, E., Chen, A., & Tirosh, E. (2005). Emotional
status and development in children who are visually impaired. Journal
of Visual Impairment and Blindness, 99, 478-485.
Osbom, J. (1997). Identification with academics and academic success among
community college students. Community College Review, 25.
Osboume, J. W. (1995). Academics, self-esteem, and race: A look at the
underlying assumptions of the identification hypothesis. Personality
and Social Psychology Bulletin, 21, 449-455.
Owens, L., & Barnes, T. (1982). The relationship between cooperative,
competitive and individualized learning preferences and students
perceptions of classroom learning atmosphere. American Educational
Research Journal, 19, 182-200.
Pajares, F., & Valiante, G. (2001). Gender differences in writing motivation
and achievement of middle school students: A function of gender
orientation? Contemporary Educational Psychology, 26, 366-381.
Paunonen, S. V., & Nicol, A. A. M. (2001). The personality hierarchy and the
prediction of work behaviors. In B. W. Roberts & R. Hogan (Eds.).
Personality Psychology in the Workplace (pp. 161-191). Washington,
D.C.: American Psychological Association.
Peng, S. S., & Wright, D. A. (1994). Explanation of academic achievement of
Asian American students. Journal of Educational Research, 87, 346-
352.
Pereira, L. M. (1990). Spatial concepts and balance performance: Motor
learning in blind and visually impaired children. Journal of Visual
Impairment and Blindness, 84, 109-111.
179
Perry-Bumey, G. D. & Takyi, B. K. (2002). Self-esteem, academic
achievement and moral development among adolescent girls. Journal
of Human Behavior in the Social Environment, 5, 15-28.
Pesut, D. J. (1990). Creative thinking as a self-regulatory meta- cognitive
process: A model education, training and fiiture research. Journal of
Creative Behaviour, 24, 105-110.
Peterson, A., Sarigiani, P., & Kennedy, R. (1991). Adolescents depression;
why more girls? Youth Adolescent, 20, 247-271.
Pierce, J. W., & Wardle, J. (1996). Body size, parental appraisal, and self-
esteem in blind children. Journal of Child Psychology and Psychiatry
and Allied Disciplines, 37, 205-212.
Plucker, J. A. (2004). Generalization of creativity across domains:
Examination of the method effect hypothesis. Journal of Creative
Behaviour, 38, 1-12.
Plucker, J. A., Beghotto, R. A., & Dow, C. T. (2004).Why isn't creativity
more important to educational psychologist? Potentials, pitfalls, and
future directions in creativity research.. Educational Psychologist, 39,
83-96.
Ponsford, K. R. & Lapadat, J. C. (2001). Academically capable students who
are failing high school: Perceptions about achievement. Canadian
Journal of Counseling, 35 (2), 137-156.
Poulson, J., & Fouts, G. (2001). Facilitating academic achievement through
affect attunement in the classroom. Journal of Educational Research,
94, 185-190.
Prackel, F., Holling, H., & Wiese, M. (2006). Relationship of intelligence and
creativity in gifted and non-gifted students: An investigation of
threshold theory. Personality and Individual Differences, 40, 150-170.
180
Prakash, A. O. (1966). Understanding the fourth grade slump: A study of
creative thinking abilities of Indian children. Master's Dissertation,
University of Minnesota.
Prasad, M. S., «fe Thakur, G. P. (1977). Manual and Directions for Self-
Esteem Inventory. Agra Psychological Research Cell, Agra.
Pufal-Struzik, I. (1998). Self-acceptance and behavior control in creativity
young people. High Ability Studies, 9, 197-205.
Purky, W. (1970). Self-Concept and School Achievement. New Jersey:
Prentice-Hall.
Pyszezynski, T., & Cox, C. (2004). Can we really do without self-esteem?
Comment on Crocker and Park. Psychological Bulletin, 130, (3), 425-
429.
Quatman, T., & Watson, C. M. (2001). Gender differences in adolescent self-
esteem: An exploration of domains. The Journal of Genetic
Psychology, 162,93-117.
Raina, M. K. (1971). Verbal and non-verbal creative thinking ability: A study
in sex differences. Journal of Education and Psychology, 29, 175-179.
Read, I. C. (2005). Creativity: Self-perceptions over time. International
Journal of Aging and Human Development, 60, 1-8.
Remmers, H. H., & Gage. (1955). Educational Measurement and Evaluation.
New York.
Roberts, A., & Cotton, L. (1994). Note on assessing a mentor program.
Psychological Reports, 75, 1369-1370.
Robins, R. W. & Trzesniewiski, K. H. (2005). Self-esteem development
across the life span. Current Directions in Psychological Science, 14,
158-162.
181
Robins, R. W., Tray, J. L., Trzesniewski, K., Potter. J. et al. (2001).
Personality correlates of self-esteem. Journal of Research in
Personality, 35, 463-482.
Robins, R. W., Trzesniewski, K. H., Tracy, J. L., Gosling, S. D. et al. (2002).
Global self-esteem across the life span. Psychology and Aging, 17,
423-434.
Robinson-Awana, P., Kehle, T. J., Bray, M. A., Jenson, W. R. et al. (2001).
Self-esteem, gender-role perception, gender role orientation and
attributional style as a function of academic competence: Smart girls
are different, but a boy is a boy. Canadian Journal of Social
Psychology, 17,47-64.
Roger, C. R., & McGuire (1967). Referred in Psychology for the Classroom.
Turner, J. Methuen, London.
Rosenberg, M. (1965). Society and Adolescent Self-image. Princeton, NJ:
Princeton University Press.
Rothemburg, D. (1997). Supporting girls in early adolescence. Washington,
DC: Office of Educational Research and Improvement.
Saeki, N., Fan, X., & Van D. L. (2001). A comparative study of creative
thinking of American and Japanese college students. Journal of
Creative Behavior, 35, 24-36.
Sajid, S. M. (1984). Creativity and Intelligence. Unpublished Thesis, Patna
University, Patna Bihar.
Sapp, M. (1990). Psycho educational correlates of junior high at risk students.
High School Journal, 13,232-23A.
Sarsani, M. R. (2006). Creativity in Schools. Sarup & Sons, New Delhi.
Satapathy, S., & Singhal, S. (2000). Mental health of visually and hearing
impaired adolescents. Journal of Personality and Clinical Studies, 16,
119-127.
182
Saweyer, R. K. (2006). Group creativity: Musical performance and
collaboration. Psychology of Music, 34, 148-168.
Schniederjan, M. J., & Kim, E. B. (2005). Relationship of student
undergraduate achievement and personality characteristics in a total
web-based environment; An empirical study. Journal of Innovative
Education, 3, 205-221.
Scott, W. A. (1968). Conceptions of normality. In E. E. Borgatta and W. W.
Lambert (eds.). Handbook of Personality Theory and Research.
Chicago: Rand McNally.
Seifert, C, & Miller, C. E. (1988). Subordinates perceptions of leaders in
task-performing dyads: Effects on sex of leader and subordinate,
method of leader selection, and performance feedback. Sex Roles, 19,
13-28.
Sengupta, A., & Singh, A. K. (1985). Manual of the Emotional Stability Test
for Children. National Psychological Corporation, Agra.
Shapiro, D. R., Moffett, A., Lieberman, L., & Dummer, G. M. (2008).
Domain-Specific Ratings of Importance and Global Self-worth of
Children with Visual Impairments. Journal of Visual Impairment &
Blindness, 102,232-244
Sharma, S. (1982). A study of intellectual factors and academic achievement
in Arts, Science and Commerce courses at higher secondary stage.
Unpublished Thesis, Department of Education, A.M.U, Aligarh.
Sharma, S. (2006). Emotional stability of visually disabled in relation to their
study habits. Journal of the Indian Academy of Applied Psychology,
32, 30-32.
Shaw, G. A., & Conway, M. (1990). Individual differences in processing: The
role of creativity. Personality and Individual Differences, 11, 407-418.
Silverstone, P. H. (1992) "Is chronic low self-esteem the cause of eating
disorders?" Medical Hypothesis, 39, 311-315.
183
Silvia, P. J. & Phillips, A. G. (2004). Self-awareness, self-evaluation, and
creativity. Personality and Social Psychology Bulletin, 30, 1009-1017.
Singh, D. P. (1984). A comparative study of the achievement of blind and the
sighted children studying in an integrated system. Indian Education
Review, 19, 132-135.
Singh, R. (1975). A study of creativity among tenth class students in relation
to their adjustment and sex. Unpublished M. L. T. Dissertation, Punjab
University.
Singh, R. J. (1980). Personality adjustment of creative and non-creative
student teachers in India. Indian Educational Review. 15, 44-56.
Skaalvik, E. M., & Hagtvet, K. A. (1990). Academic achievement and self-
concept: an analysis of causal predomina in a developmental
perspective. Journal of Personality and Social Psychology, 58, 292-
307.
Skellenger, A. C. & Hill, E. W. (1994). Effects of a shared teacher-child play
intervention on the play skills of three young children who are blind.
Journal of Visual Impairment and Blindness, 88, 433-445.
Smith, E. P., Walker, K., Fields, L., Brookins, C et al. (1999). Ethnic identity
and its relationship to self-esteem, perceived efficacy and prosocial
attitudes in early adolescence. Journal of Adolescence, 22, 867-880.
Smith, G. J. W. (2005). Comments: How should creativity be defmed?
Creativity Research Journal, 17, 293-295.
Song, I., & Hattie, J. (1984). Home environment, self-concept, and academic
achievement: A causal modeling approach. Journal of Educational
Psychology, 16, 1269-1281.
Stalikas, A., & Gavaki, E. (1995). The importance of ethnic identity: self-
esteem and academic achievement of secondary generation Greeks in
secondary school. Canadian Journal of School Psychology, 11, 1-9.
184
Stempelova, J., & Cmaricova, A. (2004). Personality factors of the big five
and self-esteem in existential analysis. Studia Psychological, 46, 137-
143.
Sternberg, R. J. (1999). Handbook of Creativity. Cambridge University Press.
Sternberg, R. J., and Lubert, T. I. (1999). The concept of creativity: Prospects
and paradigm, ed. Sternberg, R.J. Handbook of creativity. Cambridge
University Press.
Stipek, D., & Byler, P. (2001). Academic achievement and social behaviors
associated with age of entry in to kindergarten. Journal of Applied
Developmental Psychology. 22, 175 189.
Strassburger, L. A., Rosen, L. A., Miller, C .D., & Chavez, E. L. (1990).
Hispanic-Anglo differences in academic achievement: The relation of
self-esteem, locus of control and socioeconomic level with grade point
average in USA. School Psychology International, 11, 119-124.
Strauss, M. E., & Strauss, M. A. (1968). Family roles and sex differences in
creativity of children in Bombay and Minneapolis. Journal of
Marriage and Family, 30, 46-53.
Stumpf, H. (1995). Gender differences in performance on tests of cognitive
abilities: Experimental design issues and empirical results. Learning
and Individual Differences, 7, 275-288.
Susan D. R., & Lounsbury, J. W. (2004). Predicting Academic Success:
General Intelligence, "Big Five" Personality Traits, and Work Drive.
College Student Journal, 38.
Tatarkiewicz, W. (1980). A History of Six Ideas: An Essay in Aesthetics.
Translated from the Polish by Christopher Kasparek, The Hague:
Martinus Nijhoff
Taylor, C. W. (1964). Introduction in C. W. Taylor (ed.). Creativity: Progress
and Potential New York: McGraw-Hill, P, 2.
185
Taylor, C. W., & Barron, F. (1963). Scientific Creativity. N. Y. Robert E.
Krieger Publishing Co., Huntington.
Teasley, M. L., & Lee, E. (2006). Examining the association between
academic achievement and self-esteem in African American male
youth in a community-outreach after-school program. School Work
Journal, 30, 64-81.
Tegano, D. W., & Moran, J. D. (1989). Sex differences in the original
thinking of preschool and elementary school children. Creativity
Research Journal, 2, 102-110.
Theresa, S. C. (2006). Self-concepts, academic achievement, and teacher's
rating. Psychology in the Schools, 13, 111-113.
Thompson, L. A. & Kelly-Vance, L. (2001). The impact of mentoring on
academic achievement of at-risk youth. Children and Youth Services
Review, 23, 227-242.
Thompson, P. R. (1974). The severely multiply handicapped; what are the
issue? Proceeding from the regional topical conference. University of
Ulah, state lake city.
Tisdal, W. J., & Hurst, E. B. (1971). Divergent thinking in blind children.
Journal of Educational Psychology, 62, 468-473.
Tolpin, L. H., Gunthert, K. C, Cohen, L. H., & O'Neill, S. C. (2004).
Borderline personality feature and instability of daily negative affect
and self-esteem. Journal of Personality, 72, 111-137.
Torrance, E. P. (1962). Guiding Creative Talent. N. D., Prentice Hall of India
Ltd.
Torrance, E. P. (1962b). Developing creative thinking through school
experiences. In S. J. Pames and H. F. Harding (eds.), A Source Book
for Creative Thinking, New York: Charles Scribner's Sons, 31-47.
186
Torrance, E. P. (1965). Rewarding Creative Behaviour Experiments in
Classroom Creativity. N J: Princeton-Hall, Inc, pp, 6-12.
Torrance, E. P. (1965). Rewarding Creative Behaviour. Englewood Cliffs. N.
J., Prentice-Hall.
Toynbee, A. (1964). Is America neglecting her creative minority? In C. W.
Taylor (Ed.). Widening Horizons in Creativity. The Proceeding of the
fijfth Utah Creativity Research Conference New York: John Wiley and
Sons, 4.
Trautwein, U., Ludtke, 0., Koller, 0., & Baumet, J. (2006). Self-esteem,
academic self-concept, and achievement: How the learning
environment moderates the dynamic of self-concept. Journal of
Personality and Social Psychology, 90, 334-349.
Trusty, J., Peck, H. I. & Mathews, J. (1994). Achievement, socio-economic
status and self-concept of forth-grade students. Child Study Journal,
24,281-298.
Trusty, J., Robins, C. R., Plato, M., & Ng, Kok-Mun (2000). Effects of
gender, socioeconomic status, and early academic performance on
post-secondary educational choice. Journal of Counseling and
Development, 78, 463-472.
Twenge, J. M & Campbell, W. K. (2002). Self-esteem and socioeconomic
status; A meta-analysis review. Personality and Social Psychology
Review, 6, 59-1 \.
Valas, H. (2001). Learned helplessness and psychological adjustment: Effects
of age, gender and academic achievement. Scandinavian Journal of
Educational Research, 45, 71-90.
Vankatesan, S. (2004). Children with Developmental Disability: A Training
Guide for Parents, Teachers and Caregivers. New Delhi, Sage
Publications.
187
Vasuki, R., & Reddy, V. (1997). Self-esteem of single children. Journal of
Community Guidance and Research, 14, 181-188.
VenderArk, S. (1989). Self-esteem, creativity and music: Implications and
directions for research. Suncoast Music Education Forum on
Creativity, 105-121.
Venderlock (1982). A comparison of intelligence test score patterns between
visually impaired subgroups and the sighted. Rehabilitation
Psychology, 27, 115.
Verma, P., & Upadhay. (1981). Some Psychological correlated of school
achievement. Indian Psychological Review, 20, 22-28,
Vinutha, M. A., Rajini, M. R. & Nagalakshmi, S. V. (1989). Self-esteem in
children (ninth standard children). NIMHANS Journal, 7, 33-36.
Vitters, J. (2001). Personality traits and subjective well-being: Emotional
stability, not extraversion is probably the important predictor.
Personality and Individual Differences, 31, 903-914.
Vygotsky, L. S. (1990). Imagination and Creativity in Childhood. Soviet
Psychology, 28, 84-96.
Wade, T. J., Thompson, V., Tashakkori, A., & Valente, E. (1989). A
longitudinal analysis of sex by race differences in predictors of
adolescent self-esteem. Personality and Individual Differences, 10,
717-729.
Wallas, G. (1926). The Art of Thought. N.Y., Harcourt, Brace.
Walz, G. R. (1991). Counselling to Enhance Self-Esteem. Eric Clearinghouse
on Counselling and Personnel Services Ann Arbor MI.
Warren, G. H. & Luria, Z. (1972). Evolutional set and creativity. Perceptual
Motor Skills, 1.
188
Weisberg, R. W. (1986). Creativity: Genius and Other Myths. New York:
Freeman.
White, K. R. (1982). The relation between socioeconomic status and
academic achievement. Psychological Bulletin, 91, 461.
Whitmore, J. R. (1981). Gifted children with handicapping conditions: A new
frontier. Exceptional Children, 48, 106-114.
Whitmore, J. R., & Maker, C. J. (1985). Intellectual Giftedness in Disabled
Persons. Rockville, MD: Aspen Publication.
Whitten, E. B. (1974). The Rehabilitation act of 1973. Journal of
Rehabilitation, 40, 39-40.
Wiggins, J., & Schatz, E. L. (1994). The relationship of self-esteem to grades,
achievement scores, and other factors critical to school success. School
Counsellor, 41, 239.
Williams, A., Poole, M., & Lett, W. (1977). The creativity self-concept
relationship reviewed: An Australian longitudinal perspective.
Australian Psychologist, 12, 313-317.
Willoughby, C, Polatajko, H., Currado, C, Harris, K. et al (2000). Measuring
the self-esteem of adolescents with mental health problems: Theory
meets practice. Canadian Journal of Occupational Therapy, 67, 230-
238.
Wolfradt, U., & Dalbert, C. (2003). Personality, values and belief in a just
world. Personality and Individual Differences, 35, 1991-1981.
Wolfraldt, U., & Pretz, J. E. (2001). Individual differences in creativity:
Personality, story writing, and hobbies. European Journal of
Personality, 15,297-310.
Wood, J. v., Gaus, V., Beech, M. G., Taylor, K. L., & Michela, J. L. (1994).
Strategies of social comparison among people with low self-esteem:
Self-protection and self-enhancement. Journal of Personality and
Social Psychology, 67, 713-731.
189
World Health Organization. (1976). Document A29/INFDOCI/1, Geneva,
Switzerland.
World Health Organization. (1980). International Statistical Classification of
Impairments, Disability and Handicap, Geneva.
World Health Organization. (1992). The management of low vision in
children-Report of a WHO consultation, Bangkok.
Wright, R. J., Fox, M., & Noppe, L. (1975). The interrelationship of
creativity, self-esteem, and creative self-concept. Psychology, 12,
11-15.
Wyver, S. R., & Markham, R. (1999). Divergent thinking of children with
severe visual impairments. Journal of Visual Impairment and
Blindness, 93, 233-236.
Wyver, S. R., Markham, R., & Hlavacek, S. (2000). Inferences and word
associations of children with visual impairments. Journal of Visual
Impairment and Blindness, 94, 204-217.
Yong, L. M. S. (1994). Relations between creativity and intelligence among
Malaysian pupil. Perceptual and Motor Skills, 79, 739-742.
Zaleka, S. (2004). Self-concept of students with learning disabilities and their
normally achieving peers: A review. European Journal of Special
Needs Education, 19, 145-170.
Zehran, H. A. S. (1965). A study of personality differences between blind and
sighted children. The British Journal of Educational Psychology, 35,
329-377.
Zhang, L., & Postiglione, G. A. (2001). Thinking style, self-esteem, and
socio-economic status. Personality and Individual Differences, 31,
1333-1346.
190
Zhang, Li-Fang. (2001). Thinking style, self-esteem and extracurricular
experiences. InternationalJournal of Psychology, 36, 100-107.
Zhou, J., & Oldham, G. R. (2001). Enhancing creative performance: Effects
of expected developmental assessment strategies and creative
personality. Journal of Creative Behavior, 35, 151-167.
Websites
http://en.wikipedia.org/wiki/blindness.
http://en.wikipedia.org/wiki/creativity.
http://en.wikipedia.org/wiki/neuroticism.
http://www.copuig.org/lowesteem/low.htm
http://en.wikipedia.org/wiki/Big-Five-Personality-traits.
http://janus.state.me.us/LEGIS/STATUTES/20-A/title20-Asecl2501-A.html.
http://www.vand6rbilt.edu/AnS/psychology/health_psychology/esteem.htm#
What%20is%20Self-Esteem.
http://ca.answer.yahoo.com/question/index.php?qid=20061204224554AAUv
X21
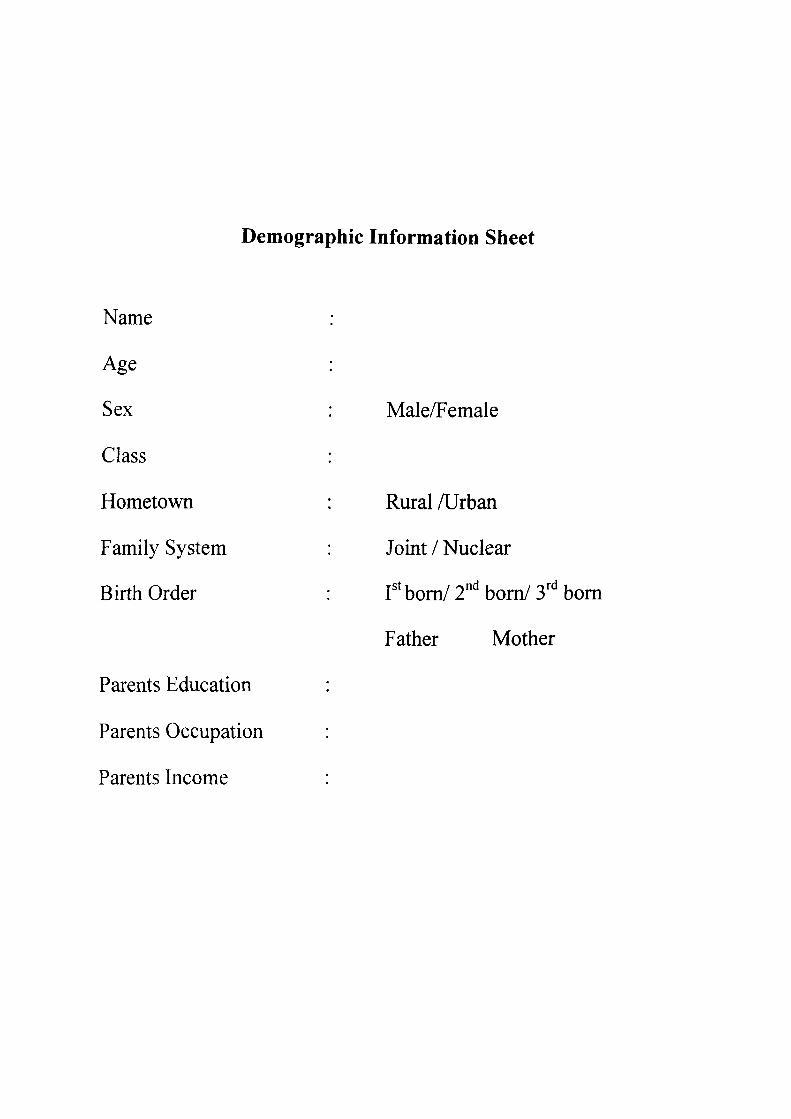
Demographic Information Sheet
Name
Age
Sex
Class
Hometown
Family System
Birth Order
Parents Education
Parents Occupation
Parents Income
•
•
Male/Female
•
: Rural /Urban
: Joint / Nuclear
: r'bom/2"'bor
Father M<
•
•
•
»rd
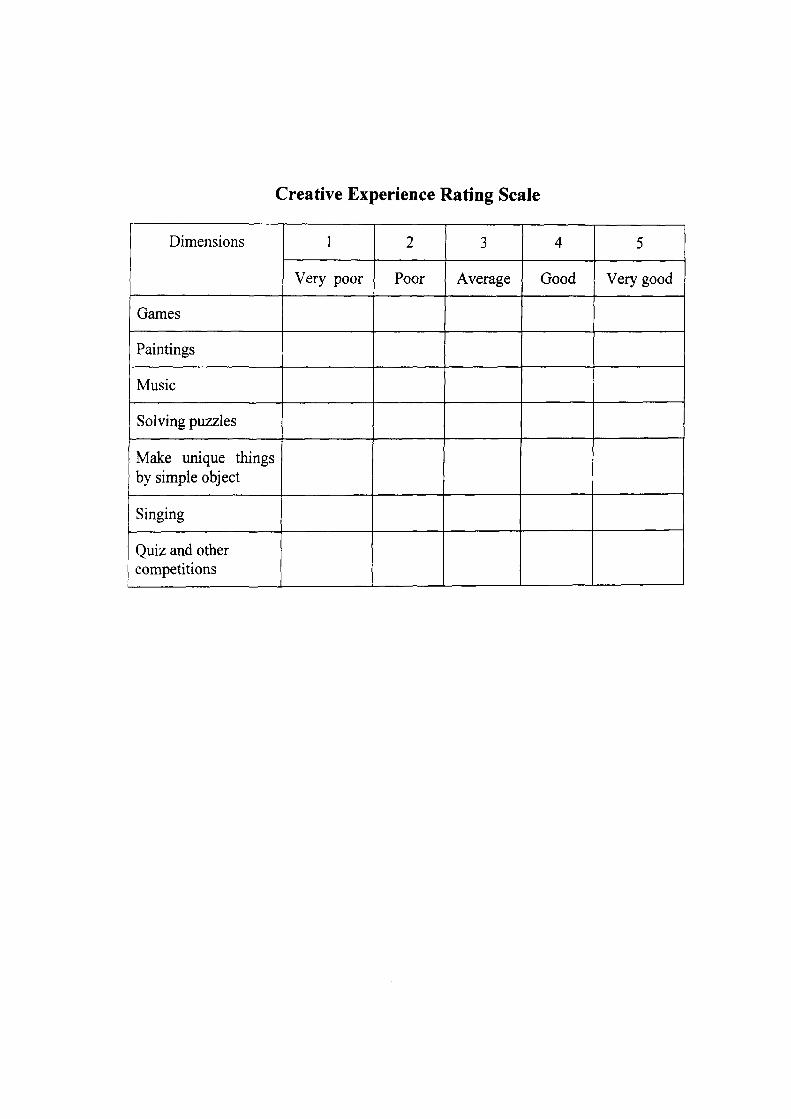
Creative Experience Rating Scale
Dimensions
Games
Paintings
Music
Solving puzzles
Make unique things by simple object
Singing
Quiz and other competitions
1
Very poor
2
Poor
3
Average
4
Good
5
Very good

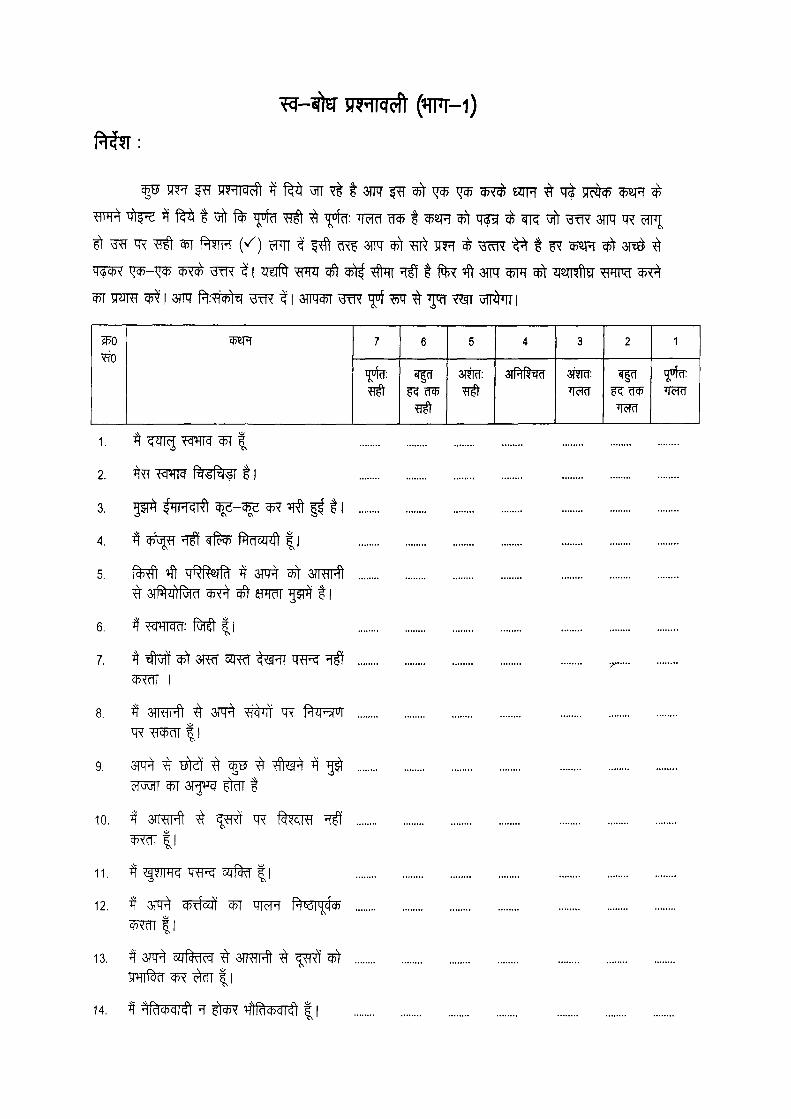
^ - ^ yM^cft (wr-i)
f ^ :
^0
cffSFf 7 6 5
3TM:
4
aiRR^id
3 2 1
1. ^ ^ ^ ^ c T J M ^ I
3. ^ ^HH I'Jl ^ - ^ ^ " ^ f t 11
6. ^ Wrn^: fuT | |
7. ^ #5ff ^ 3f^ oZR?T ^W^ ^W^ ^
8. ^ m^ % m^ tH ^ Rij- ui
11. ^ ^ p r ^ TH^ cZ[% | |
12. ^ 3Tq^ ^^xfsrf ^ ^TcR PlkJIi^cf*
13. ^ 3?q^ ouf^ct! ^ 3TRTFft % ^
14. ^ ^frlct)c||41 ^ ^i^ ^1fe|cf5c||([| 1 1
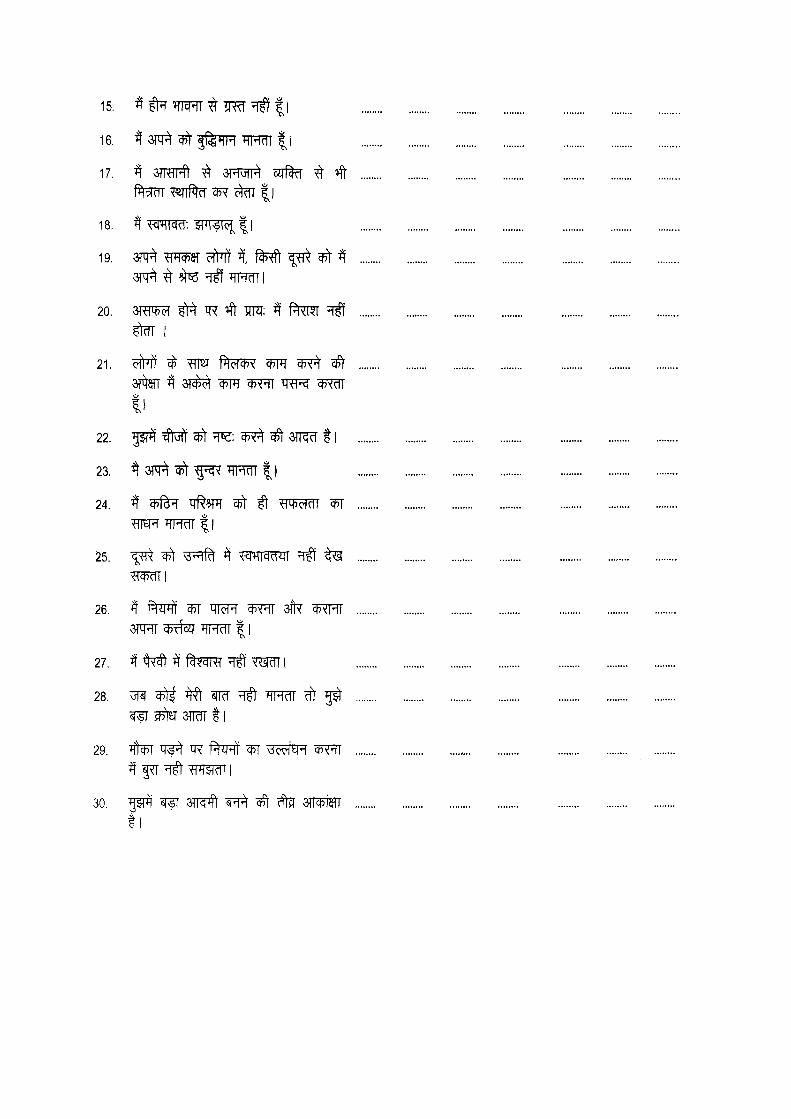
15. ^^TTIW^TT^^Il
16. • 3Tq^^5feTTFT^TRm| |
17. ^ aimpft ^ 3 R ^ cJjf^ ^ ^
18. • WTTcRT; f P T S l ^ f I
19. 37^^ M^8T c M , 1%^ ^ ^ ^ 3 1 ^ ^ ^ ^ THcfTI
20. S{m^ m ^ Wi: ^ f^RRI ^ ^ I
21. c W ^ W2T f feTM cfjpT ^ ^ 3 T ^ ^ 3 ? ^ WT ^ J M W ^ W^
22. g??^ xJtyff ^ ^T^: ^ ^ 3KcT 11
23. ^ 3 1 ^ cf5t^g^TTHcTT||
24. ^ ^{^ ^W ^ ^ mM\ ^
25. • ^ ^ ^ ^ ^ ^^^nrracfm ^ ^
26. ^ f RRf ^ iTTePT ^ J ^ 3lk cRNT 3FHT trefoil TTH?fT|l
27. ^ M ^ f ^ m m J Ic!T I
28. uTW g^l^ ^ WTcf ^ WM ?[t g ^ sf^ pf^ 3TIcTr t l
29. ^ ^ q? ^^mt Wi vicd'kH ^ j ^
30. ^ sf^ 3TRT?f sR^ ciTf rffi 3PJRTT
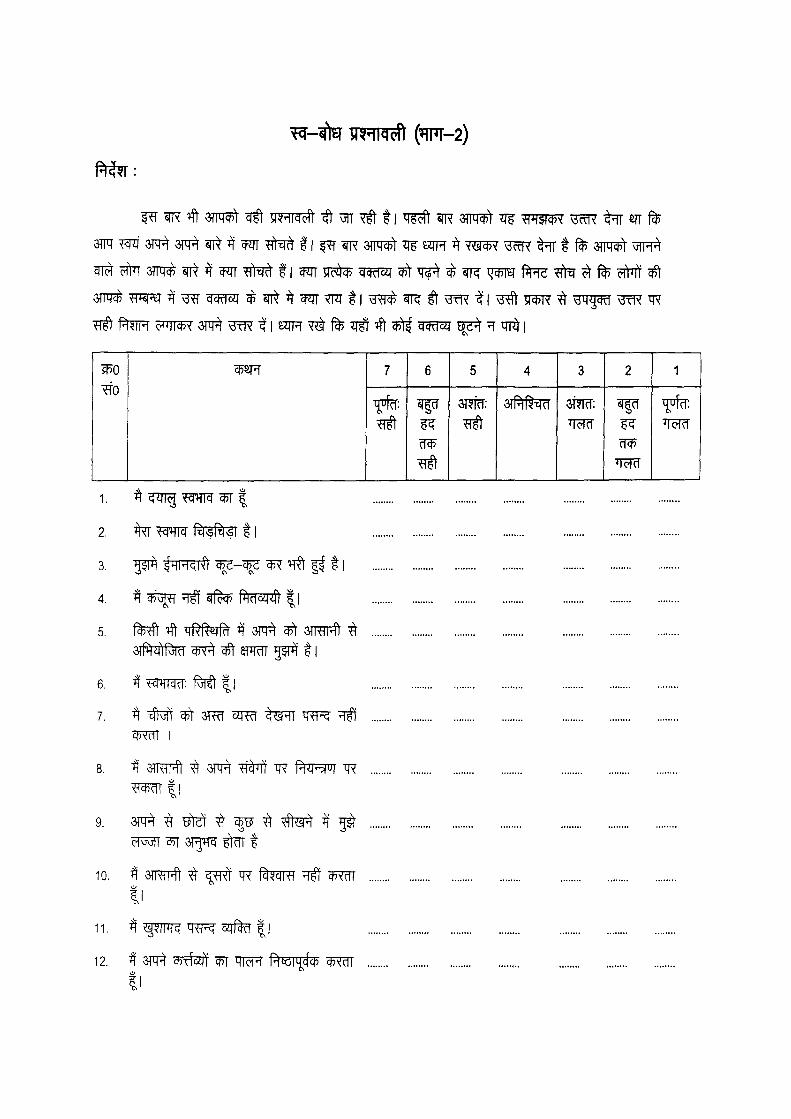
^ - ^ yM^cft (wr-2)
M?T
?P0
^ 0
^5aH 7 6 5 4
cUMR-^d
3 2
ef|(T
1
J|dd
1. A ^ ^ W M W |
3. ^ f ^ T H ^ ' ^ - ^ ^ ^ ^ 11
5. f M ^ qJ^fMr ^ 31 1 g^ aTTHT ^ 3TMfuTcT^ ^ a r i M ^ t l
6. ^ WTIcRT: f ^ | l
7. ^ #5Jt ^ 3RtT SRcT t ^ ^ W ^ ^
8. ^ 3?RTf^ ^ 3 T ^ • ^ ^ ^ PliJ-^ui IR
9. 3PT ^ Ft3f ^ ^ ^ ^!ft^ ^ 5^
10. ^ 3Mpft ^ ^ w f ^ M ^ ^ wm\
V 11. ^ ^ p m q^F^ cZj f^ l l
12. ^ 3W^ cfjtfaff ^ WFT P r W 3 # ^ J M
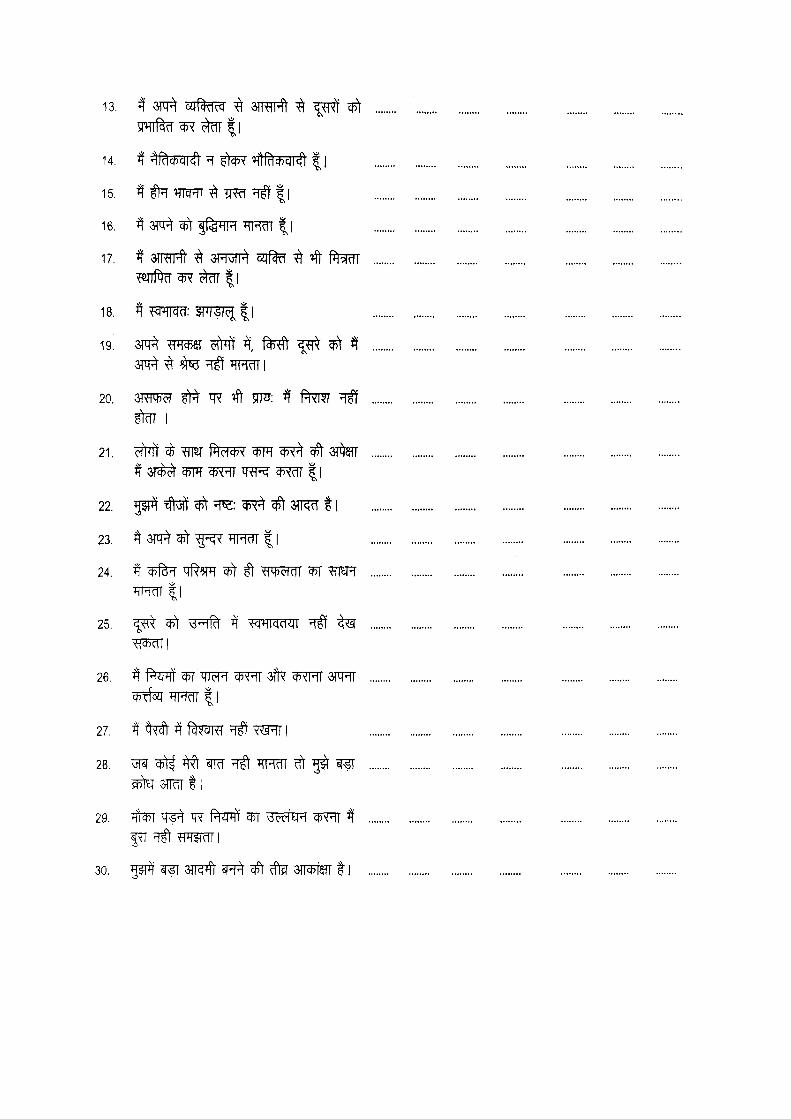
13. ^ m^ cJT%W ^ 3IM1^ ^ ^ ^
14. ^ ^l^cb^lcfl ^ ^ »?]Rlct,c||c{l | |
15. ^ # t ^ W R T ^ T R t T ^ l l
16. ^ OT^ cfit ^(^HH T T R m l l
17. ^ armpft TT anvjir^ s r f ^ ^ %?TT
18. ^ WITcRT: ? F T ^ | |
19. m^ WW^ c M Tf_ f ^ ^ ^ ^
20. 3? 7^M Ft^ ^ ^ m^: ^ f^mj ^
FfcTI I
21. efmt ^ ^ M I^Tcf^ WT ^ c^ 3T a!T
^ 3 T ^ WT g > ^ TO^ g ^ M | |
22. 55?^ ^ ^ ^T^: ^ ^ 3IT^ 11
23. ^ 3?!^ ciTT g ^ HHcTT 11
24. ^ ^#=T ^ W ^ #f fP efcTT ^ ^ 7 1 ^
25. ^ ^ ^ 3 ^ ^ iFcRracM ^ ^
26. ^ f ^ m f ^ W R WR\ 3fh? g^^HT 3TCPTT
^fTffai^TFIcfTll
27. ^ ^ ^ fcfM^ ^ ^?^I^ I
28. ^ ^ ^ sfKT ^ TTRcf[ cfr g?f sTfT
s?Tlg 3 M t l
29. 4cf^ tf;?^ W P m t ^ viedMH ^ ^ ^ ^
30. g?f^ sT^ 3 I K ^ 6R^ cf?f ^ 3?R7f5TT 11
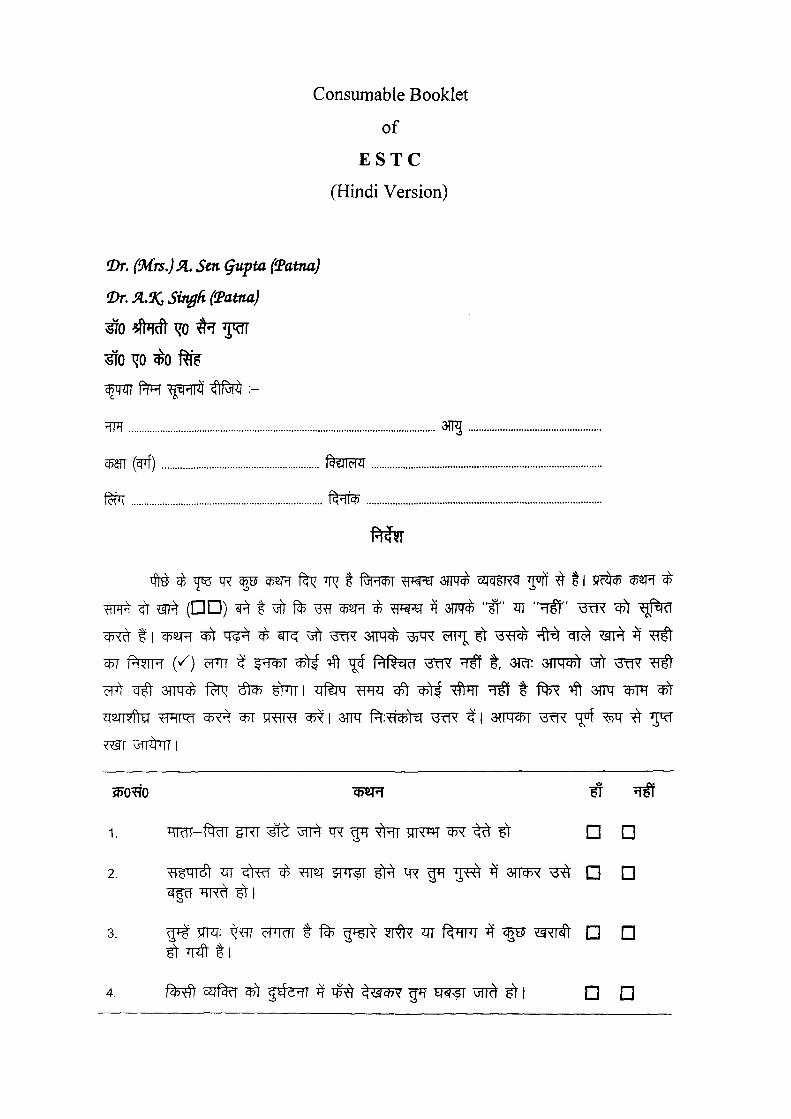
Consumable Booklet
of
E S T C
(Hindi Version)
Dr. (!Mrs.)Sl, Sen gupta (iPatna)
©r. Jl.% SUtgd (Tatna)
^M 3n^..
^an (cpf) %ncw
feFT R'li*
Tfr# c^ ^ W ^ ^PSR f ^ TflT f f ^ f T ^ :^TT«ra' 3 P ^ cijcl^Kcl V ^ ^ t l 5 f C ^ ^0^ ^
cfT^ 11 ci^sj^ cfTt q ^ c irr^ ^ ^3TR W^ W^ W\ ^ ^ 3 ^ ^ cfTcf ^ ^ ^
^ PWH (> ) ePTT ^ 5^T^ cpt# ^ TJ Plf^rjd T3TT? ^ t , 3Tcf: 3TTWt vjfT ^3TR ^
ePt cr^ 3TN^ feP;j ^ t ^ Fmi I q1%N TTfT ^ cf^ #PfT ^ t f ^ ""tf TFf W T ^
1, ^PflTTT-f^ g M ^ 3TT ^ ^ #TT yr?PT ^R ^ Ff D D
3. g [^ W^: - ^ cFTrfT t f% f i ^ ? r ^ ^ f TFT ^ ^ ^ 5 ^ D D
^ ^ tl
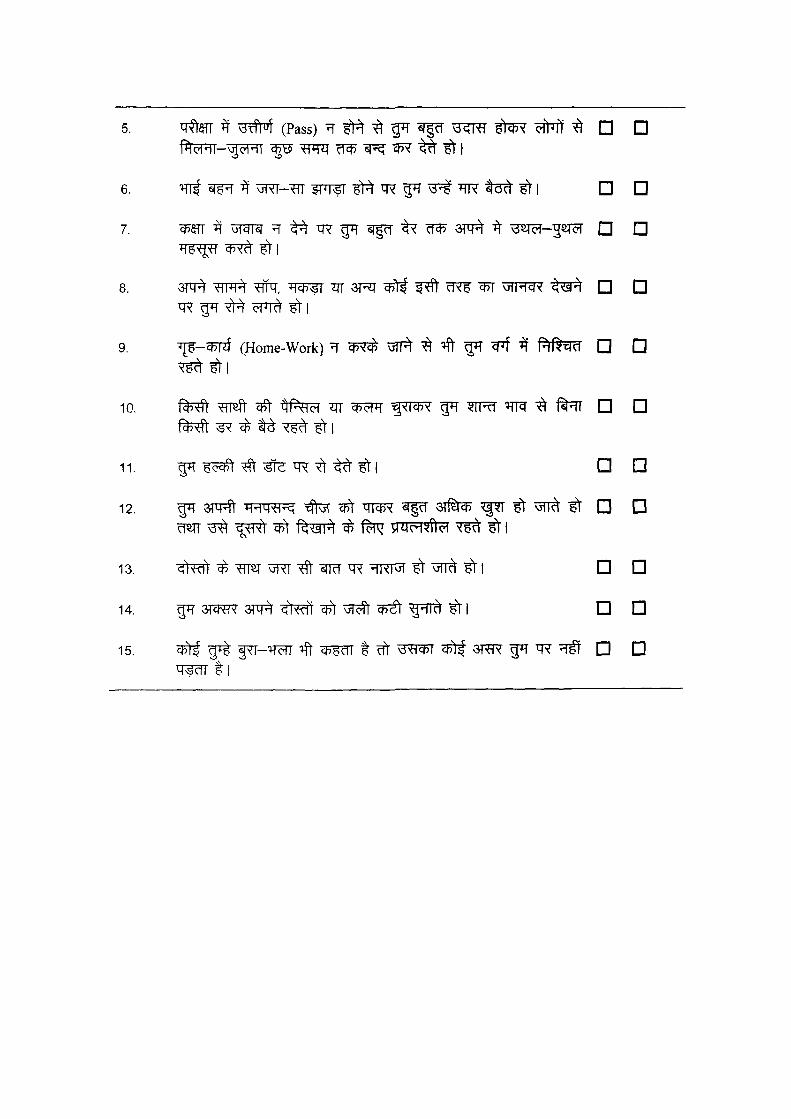
5. ^fran ^ ^ 3 T M (Pass) ^ ^ t ^ ^ g ^ ^ ^3^TfT ?t^fv? c M ^ D D
f^TeRT-^^eHT ^ ^ FT^ cR5 s l ^ gr? f t I
6. ^ sTF^ ^ W ? T - ^ ?FF?T ? t^ ^ ^ ^ ^TR t ^ ^ 1 D D
7. ^arr ^ TTCTR ^ ^ I R g ^ if|cr ^ CTCJ? STTJ^ ^ "^^sTeT-gsier Q D
8. 3Ttpr ^?TR^ W^, ^ffHp^ ^ 3T^ ^ fxfff cR? cf>r vJTRcR ^ v ^ ^ Q D
9. ^-cf5T?^ (Home-Work) ^ cfRc^ vJTT ^ ^ ^ cpf ^ Plf^rJd D D
10. f^Rft TfTsft ^ift i^P^d ^ cf?cFT ^ ? R R ^ ?TFTT 'TFT ^ to D D
11. ^ ?cSf?r # ^ ^ ^ ^ f t l D D
12. ^ 3 W ^ 'FPTO^ ' ^ cf5t ^TcfR sTfcT 3 T f ^ ^ ^ vJTT ^ D D
13. ^Rcfr ^ ^ST uRT ^ sfTcT ^ ^ TRT Ft ^ f t I D D
14. ^ 3TcPFR 3TXFr ^ R ^ cfTT TJR^ cp^ g ^ Bt I D •
15. • ^ gT% f?T- >TcTT 'fi" cfTlTcTT t eft ^?^FF^ cfJtf (ST^ ^ q ^ ^ D D