Embed Size (px)
Citation preview
• Over110billionUSDhavedisappearedthroughmispricingofcrudeoilintheUSandtheEUbetween2000and2010
• Profitshavebeenmovedfromthesourcecountrytotheextractiveindustrycompanies
• InDecember2012,theNetherlandsimportedcrudeoilforthepriceof1,69Europerbbl.whilethespotmarketpriceswerenolowerthan26Euro,resultinginanunderevaluationofaround40millionEurotothesourcecountry
WrittenbySimonJ.Pak,Ph.D.JANUARY2012 pwyp.no
Lost billionsTransfer Pricing in the Extractive Industries
2 LOST BILLIONS – TRANSFER PRICING IN THE EXTRACTIVE INDUSTRIES
LEGAL DISCLAIMER • ACKNOWLEDGEMENTS
This report has received financial support from the Royal Ministry of Foreign Affairs, through ‘The Dialogue Project Capital for Development’. Publish What You Pay Norway takes full responsibility for the content of this report.
Writtenby: Simon J. Pak, Ph.D., Trade Research Institute, Inc. Simon J. Pak is an expert in the analysis of capital movements through over- and under-invoicing in international trade. He is president of Trade Research Institute, Inc. and Associate Professor of Finance at the Pennsylvania State University, School of Graduate Professional Studies. He has taught economics and finance at Penn State University, New York University, and Florida International University. He has a Ph.D. in economics from the University of California, Berkeley, an MS in physics from the University of North Carolina at Chapel Hill, and a BS in physics from Seoul National University.
Print:CopyCat, Oslo
Frontcoverillustration:David Parkins
ArtProductionandLayout: Emily Fishpool
Print:CopyCat
Acknowledgements: The author wishes to thank Messrs. Frian Aarsnes and Håvard Holterud for educating the author about the operation of crude oil trade markets.
Financingfrom:
LEGALDISCLAIMER:
This publication is based on information provided to Publish What You Pay Norway (‘PWYP Norway’) and individuals acting on behalf of PWYP Norway. The conclusions presented herein are based only on information so provided. PWYP Norway and those acting on behalf of PWYP Norway have strived towards acquiring full overview of all relevant information and data to prepare this publication. We do not accept liability whatsoever for any insufficiency or inadequacy of the information and data that this publication is based upon.
While PWYP Norway has taken all reasonable care to ensure that the information contained in this publication is accurate, publicly available information and data has not been verified by the companies or users and neither PWYP Norway nor any person acting on behalf of PWYP Norway in the drafting and preparation of this publication can be held legally responsible for the content or guarantee that it is totally free from errors or inaccuracies.
Any references contained in this publication pertaining to any kind of sources, publications or websites from third parties, are inserted for convenience only and are purely for informative purposes. They do not constitute endorsement of material on those sites, publications or sources. PWYP Norway and those acting on its behalf accept no liability whatsoever for any loss or damage arising from the use of such information.
LOSTBILLIONSTRANSFERPRICINGINTHEEXTRACTIVEINDUSTRIES
Estimates of Mispricing in Crude Oil ImportThe European Union and the United States, 2000-2010
3LOST BILLIONS – TRANSFER PRICING IN THE EXTRACTIVE INDUSTRIES

5LOST BILLIONS – TRANSFER PRICING IN THE EXTRACTIVE INDUSTRIES
CONTENTS
CONTENTSLegal disclaimer • Acknowledgements ................................................................... 2
Preface................................................................................................................6
Executive Summary ...................................................................................................... 3
1. Introduction ............................................................................................................. 8
2. Price filter trade analysis method ................................................................... 10
3. Data description and sources .......................................................................... 12
3.1 Import Data for E.U. .................................................................................... 13
3.2 Import Data for U.S. ..................................................................................... 13
3.3 Estimating insurance and freight cost to adjust the E.U. import value ................................................................. 13
3.4 Crude Oil Price Filter Data .......................................................................... 14
4. Estimates of mispriced amount of crude oil import by E.U. / U.S. .......... 22
4.1 Undervalued amount of the E.U. import............................................... 22
4.2 Undervalued amount of the U.S. import .............................................. 26
4.3 Overvalued amount of the E.U. import ................................................. 28
4.4 Overvalued amount of the U.S. import ................................................. 32
4.5 Tax haven countries and re-invoicing .................................................... 36
5. Summary – Findings and Discussion .............................................................. 38
REFERENCES ................................................................................................................ 40
APPENDIXI: Mispriced Amount Calculation ...................................................... 41
APPENDIXII: List of Data files downloadable .................................................... 42
6 LOST BILLIONS – TRANSFER PRICING IN THE EXTRACTIVE INDUSTRIES
PREFACE
PREFACE
Over 110 billion US dollars seems to have ‘disappeared’ in over and under pricing on import of crude oil in the European Union and the USA between 2000 and 2010. How did that happen?
Transfer pricing is one of the most usual techniques that extractive industries can use to transfer profits from the source country and to the company itself. Today, over 60% of world trade is taking place within transnational companies, such as the extractive industries. The OECD suggests that companies should keep arm’s length prices; as if they traded with a company outside the company structure itself. But do they do this? And does this guiding principle work?
In the Piping Profits report we showed that ten of the world’s most powerful extracive companies operate with at least 6038 subsidiaries, whereof 2038 are incorporated in secrecy jurisdictions1. National tax authorities generally do not have sufficient access to essential information needed to test if the arm’s length principle is properly used and reported by the companies (outside their own jurisdiction). When tax authorities do not have access to vital, sufficient and accurate information to know if the pricing was right, which is crucial to calculate the tax, how can they know that their tax base is right? Tax administrations in developing countries seldom have the capacity or the ability to even try to find out.
Extractive industry generates enormous profits. Transfer pricing in the extractive industry will have a significant impact on a country’s tax base. Transfer-pricing rules are a complex and challenging tax area in international trade and perhaps the most important tax matters in global trade today. Companies often use lawyers to structure their transactions. Lawyers´ legal privilige means that they do not have to disclose what they have done if they have contributed to shifting profits out of a source country. Lawyers are also tasked with presenting complex legal issues to hinder those seeking insight. Secrecy in the extractive industries should not be tolerated when companies hide profits from tax from those they are supposed to manage the resource on behalf of.
Trade with crude oil is one of the most central aspects of extractive industries. In addition to this, companies can also shift profits through complex financial instruments, which are not directly linked to the physical crude oil, such as derivatives2. The value creation from extractive industries should be used to create opportunities for the 2/3 of the poorest people in the world, who paradoxically live in the most resource rich countries in the world. This is particularly harmful for developing countries, but the same mechanisms affect all countries. In a time of financial crisis in Europe and the USA it may be interesting for governments to do something about this.
PWYP Norway has proposed one very simple and effective reporting mechanism called ‘An extended country by country reporting standard for the extractive industries’3. This is a reporting standard in line with how companies themselves are consolidating their accounts. It will not directly target transfer pricing, but it will be the place of choice when investors and other constituencies seek insight into the use of their resources. Investors can follow their money, and governments can then get valuable and standardised information, across all jurisdictions where the companies operate.
MonaThowsenGeneral secretary, PWYP Norway
1 PWYP Norway, ‘Piping Profits’, ISBN 978-82-93212-00-3. Database on our webpage: http://www.publishwhatyoupay.no/pipingprofits
2 PWYP Norway, ‘Protection from Derivative Abuse’, ISBN 978-82-93212-01-03 PWYP Norway, ‘An extended country by country reporting standard for the extractive industry. A policy proposal to the EU’, ISBN978-82-93212-03-4
7LOST BILLIONS – TRANSFER PRICING IN THE EXTRACTIVE INDUSTRIES
EXECUTIVE SUMMARY
EXECUTIVESUMMARY
Trade mispricing facilitates capital flight, tax avoidance, import duty and VAT avoidance, and money laundering. For example, an undervalued import facilitates capital transfer from the exporting country to the importing country by brining into the importing country commodities worth more than the value declared in the exporting country. It also facilitates income shifting to importing country, reducing taxable income in the exporting country. An overvalued import facilitates capital transfer and income shifting to exporting country by paying more than the value of merchandise imported. Abusive transfer pricing with or without re-invoicing, faked customs declaration and fraudulent double invoicing are some of the methods employed in trade mispricing in merchandise trade.
This report estimates the trade mispricing through the crude petroleum import into the European Union (E.U.) and the United States (U.S.) between 2000 and 2010. The mispriced amounts are estimated by comparing the declared import value with a fair market price filter. The most detailed publicly available import data are obtained from EUROSTAT for the E.U. merchandise import data and from the U.S. Census Bureau for the U.S. merchandise import data.
The undervalued amount of each import record is estimated as the deviation of declared import value from a lower bound of price filter range based on the f.o.b. costs of imported crude oil published by the U.S. Energy Information Administration. The overvalued amount is estimated as the deviation of declared import value from an upper bound of the price filter.
During the 11-year period between 2000 and 2010, the import database for the E.U. has a total of 16,360 records and the U.S. 23,454 records. The number of undervalued import records is 24% of the E.U. import records and 15% of the U.S. import records. The undervalued amount is estimated at $28.5 billion for the E.U. import and $22.9 billion for the U.S. import.
During the same period, the number of overvalued import records is 16% of the E.U. import records and 27% of the U.S. import records. The overvalued amount is estimated at $17.3 billion for the E.U. import and $42.1 billion of the U.S. import.
The top 10 oil exporting countries in undervaluation for the E.U. and the U.S. together are: Canada ($11.8 bn), Russia ($8.0 bn), Venezuela ($7.1 bn), Mexico ($6.6 bn), Saudi Arabia ($3.2 bn), Iran ($2.5 bn), Iraq ($1.9 bn), Ukraine ($1.3 bn), Brazil ($1.2 bn), and Norway ($1.1 bn).
The top 10 oil exporting countries in overvaluation for the E.U. and the U.S. together are: Nigeria ($8.3 bn), Canada ($7.2 bn), Mexico ($5.0 bn), Saudi Arabia ($4.3 bn), Norway ($3.9 bn), Algeria ($3.7 bn), Venezuela ($3.6 bn), Libya ($3.4 bn), Russia ($2.6 bn), and Angola ($2.1 bn).
The estimation method used is believed to be conservative in the sense that the estimated mispriced amounts are likely to be understated. However, due to limitations on import data discussed in the main section of this report, the mispriced amounts estimated in this report should be considered as approximations. The customs authority will be able to examine the import documents and determine the exact amount of trade mispricing.
8 LOST BILLIONS – TRANSFER PRICING IN THE EXTRACTIVE INDUSTRIES
1. INTRODUCTION
1.INTRODUCTION
Trade mispricing facilitates capital flight, tax avoidance, import duty and VAT avoidance, and money laundering. For example, an undervalued import facilitates capital transfer from the exporting country to the importing country by brining into the importing country commodities worth more than the value declared in the exporting country. It also facilitates income shifting to importing country, reducing taxable income in the exporting country. An overvalued import facilitates capital transfer and income shifting to exporting country by paying more than the value of merchandise imported. Abusive transfer pricing with or without re-invoicing, faked customs declaration and fraudulent double invoicing are some of the methods employed in trade mispricing in merchandise trade.4
While understanding and assessing the degree of trade mispricing is of significant interest to policy makers, estimating mispricing in merchandise trade is rather challenging because import and export trade data at transaction level is not available publicly and because the arm’s length price relevant to each merchandise transaction is not readily available for most of the commodity classification.
The European Union (E.U.) and the United States (U.S.) publish their import data in greater detail, but many records aggregates more than one transaction. Among all the merchandise imported into the E.U. and the U.S., crude oil is the largest in import value, and the market price data for crude oil is publicly available.
This report estimated the degree of mispricing in crude oil imports declared in the E.U. and the U.S. The mispriced amounts are estimated using a ‘price filter trade analysis method (P-F method)’ applied to the crude oil import data. Under the P-F method, estimating the undervalued or overvalued amount is a simple matter of comparing the declared import transaction with a fair market value, an arm’s length value, of a similar type of transaction. In practice, however, there are three types of related difficulties:
• Each import record often aggregates more than one transaction.
• The crude oil is differentiated depending primarily on the API gravity (heavy or light) and the sulfur content (sweet or sour), but the crude oil classification in the import data includes a wide range of API gravity.
• Given the heterogeneity of the crude oil imported, market price for any particular API gravity cannot be used as the price filter, necessitating the use of a price filter range with a lower bound and an upper bound.
These issues tend to underestimate the mispricing as will be discussed in the sections following.
The estimated amount of mispricing during the 11-year period between 2000 and 2011 is significant in dollar value although small as percent of the total import value. The undervalued amounts estimated are $28.5 billion through the E.U. import and $22.9 billion through the U.S. import. The overvalued amounts estimated are $17.3 billion through the E.U. import and $41.1 billion through the U.S. import.
4 See Bhagwati (1964), Bhagwati, et. al. (1974), Gulati (1987), Ndikumana and Boyce (1998), OECD (2001), Hermes, Niels, et. al. (2003), Baker (2005), Almounsor (2005), Zhu, Li and Epstein (2005), Madinger (2006), and FATF Report (2006), Sikka and Wilmot(2010)
9LOST BILLIONS – TRANSFER PRICING IN THE EXTRACTIVE INDUSTRIES
1. INTRODUCTION
The mispricing of an import declared in the importing country would be same as the mispricing of the corresponding export declared in the exporting partner country provided that the import value declared in the importing country is same as the export value declared in the exporting country for the corresponding transaction. However, it is possible that they can be different from each other when the two counter-parties of a transaction report different amounts to their respective countries through re-invoicing, faked customs declaration, or fraudulent double invoicing.
For example, a crude oil exporter in Nigeria may declare $90,000 for an export transaction to the U.S. when the fair market value is $100,000, perhaps to move capital/wealth out of Nigeria and/or to reduce royalty payment. The corresponding U.S. importer may declare $120,000 for the same transaction, perhaps to reduce taxable income in the U.S. or to move money out of the U.S. In this case, the exporting country, Nigeria, has a $10,000 undervalued export while the partner country, U.S., has $20,000 overvalued import.
The remainder of the report is organized as follows. The section II, the price filter trade analysis method, describes the procedure to estimate the mispricing. The section III, data description and sources, describes the crude oil import data for the E.U. and the U.S. and the crude oil price data. The section IV presents the estimated over-valued and under- valued amounts annually as well as by export country. In addition, the role of tax haven countries is discussed in relation to re-invoicing. The last section V summarizes the findings and discusses the limitations of the study.
10 LOST BILLIONS – TRANSFER PRICING IN THE EXTRACTIVE INDUSTRIES
2. PRICE FILTER TRADE ANALYSIS METHOD
2.PRICEFILTERTRADEANALYSISMETHOD
The price filter trade analysis method used in this study estimates the mispriced amount as the deviation of a declared import value of crude oil from a measure of arm’s length price. The arm’s length prices used in this study is the ‘F.O.B. Costs of Imported Crude Oil by API Gravity’ published by the U.S. Energy Information Administration (EIA)5. The U.S. EIA publishes the costs in seven categories of API gravity: 20 degrees or less, 20.1-25, 25.1-30, 30.1-35, 35.1-40, 40.1-45, and 45.1 or over. Since the import data does not specify the API gravity for each record, the cost for a lower API and the cost for a higher API are selected as an arm’s length price range. This will result in a conservative estimate of mispricing: Any transaction with a declared unit value within the arm’s length price range is treated to be normal. If the declared unit value falls outside the range, then it is treated as mispriced. If the price is lower than the lower bound, the deviation from the lower bound is assumed to be an estimate for the undervalued amount, and if the price is above the upper bound, the deviation from the upper bound is assumed to be an estimate for the overvalued amount. This will have an effect of underestimating mispriced amounts because:
• Any import record with multiple transactions with mispricing in opposite directions will underestimate the amount of mispricing at the record level due to the negating effect eliminating the price dispersion at transaction level
• The amount mispriced measured from the upper or lower bound will be less than amount measured from the actual arm’s length price for the crude oil with the same API gravity
• Some of the mispriced trades with prices within the arm’s length price range will not be detected as mispriced
The effects of the aggregated data and the broader classification of crude oil (heterogeneity) are further explained below and the precise method of calculation employed in the report is defined in Appendix I.
Theeffectofaggregateddata: The data for crude oil imported into the E.U. aggregates transactions by commodity (CN 8 digit level), month, importing E.U. member state, and exporting country (country of origin). Similarly, the most detailed U.S. import data available from the U.S. Census Bureau also groups the import transactions by commodity (HS10 digit level), month, exporting country (country of origin), Customs District of Unlading, and Customs District of Entry. While the E.U. data classifies the crude oil into one category regardless of the API gravity, the U.S. data classifies the crude oil into two categories of gravity, API larger than 25 and API smaller than 25.
The import data allows estimating the difference between the declared import value and a fair market value only at the record level rather than at the transaction level. This has an effect of underestimating mispricing. For example, if one record has two transactions, one $10,000 overvalued and the other $10,000 undervalued, no mispricing will be detected at the record level because the two transactions will cancel out the mispricing in opposite directions.
Theeffectofheterogeneityofcrudeoil: The other complicating factor is that the E.U.
5 http://www.eia.gov/dnav/pet/pet_pri_imc3_k_m.htm
11LOST BILLIONS – TRANSFER PRICING IN THE EXTRACTIVE INDUSTRIES
2. PRICE FILTER TRADE ANALYSIS METHOD
data classifies all crude oil into one category, and the U.S. data into two categories of the API gravity. Since each import record may have transaction(s) with varying quality of crude oil, an arm’s length price for a specific quality of crude oil cannot be used in comparing the prices at the record level. Instead, a range of arm’s length price is used in this study. This will have an additional effect of underestimating the degree of mispricing as explained in the first example below.
The two import examples below illustrate the underestimating effect of i) classifying crude oil into a broader category of quality and ii) grouping multiple transactions into one record.
Example1:The U.S. imported 487,444 barrels of crude oil (API>25) from Azerbaijan in December 2009 at a declared unit price of $42.04 per bbl (c.i.f.). The lower bound of the price filter range in December 2009 was $67.47 (f.o.b.), resulting in $12.4 million estimated undervaluation after adjusting for transportation charge. Since the imported oil is classified in a category with API>25, and the lower bound price used was the price for crude oil with API 20.1to 25, the actual mispriced amount should be larger than $12.4 million since API is greater than 25.
Example 2: The U.S. imported 524,558 barrels of crude oil (API>25) from Equatorial Guinea in August 2005 at a declared unit price of $32.75 per bbl (c.i.f.). The lower bound of the price filter range in August 2005 was $50.67 (f.o.b.), resulting in $9.4 million estimated undervaluation after adjusting for transportation charge. For the same reason on quality explained above, the actual mispriced amount should be larger than the estimated amount. In addition, this particular import record aggregated two transactions. If one of the two transactions is priced above the lower bound price and the other below the lower bound price, then the undervalued amount estimated for the record is smaller than the undervalued amount of the undervalued transaction – another source of underestimating the mispriced amount for the import record.
The two examples illustrate that mispriced amount estimated in this study is likely to underestimate the true mispriced amount because of nature of the import data. Since the two factors, the broader classification of crude oil and the grouped data, are likely to underestimate the true mispricing, the mispriced amount estimated in this study should be treated as an approximate amount, instead of the accurate amount that can be estimated at the transaction level data.
12 LOST BILLIONS – TRANSFER PRICING IN THE EXTRACTIVE INDUSTRIES
3. DATA DESCRIPTION AND SOURCES
3.DATADESCRIPTIONANDSOURCES
3.1.ImportDataforE.U.The crude oil import records are extracted from two sets of databases, one from EUROSTAT for the E.U. countries and another from the U.S. Census Bureau for the U.S. These data sets include the most detailed import records available publicly6.
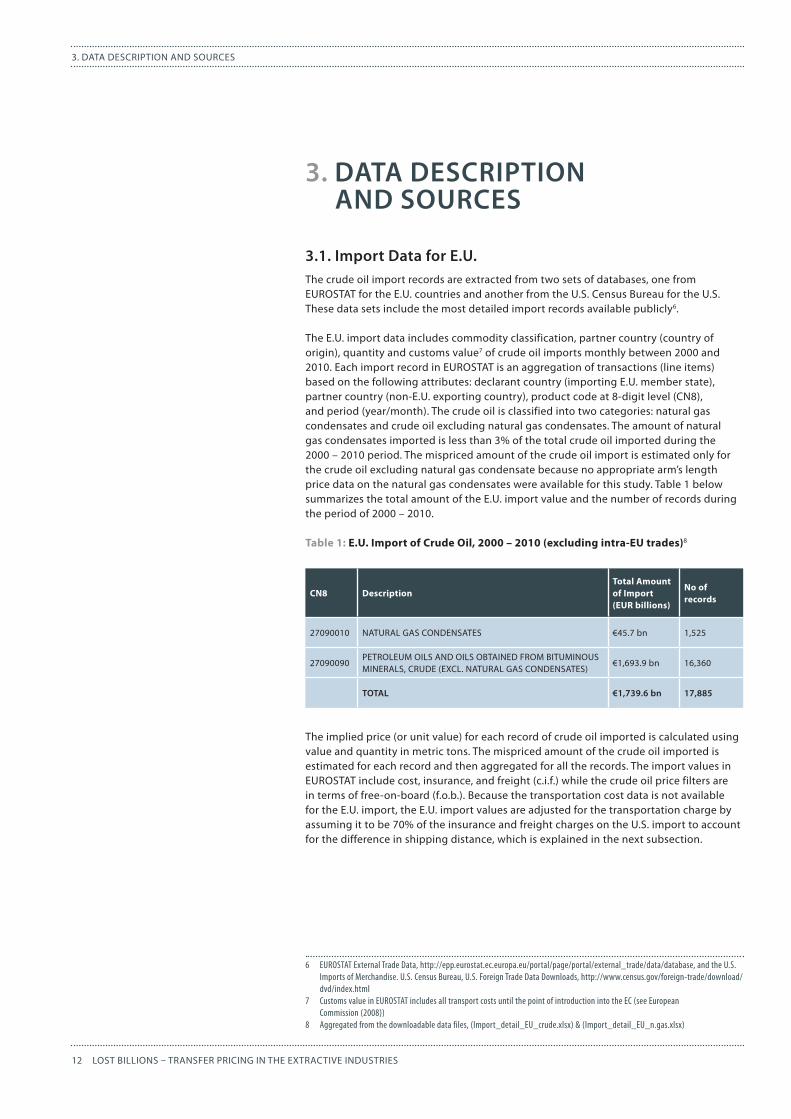
The E.U. import data includes commodity classification, partner country (country of origin), quantity and customs value7 of crude oil imports monthly between 2000 and 2010. Each import record in EUROSTAT is an aggregation of transactions (line items) based on the following attributes: declarant country (importing E.U. member state), partner country (non-E.U. exporting country), product code at 8-digit level (CN8), and period (year/month). The crude oil is classified into two categories: natural gas condensates and crude oil excluding natural gas condensates. The amount of natural gas condensates imported is less than 3% of the total crude oil imported during the 2000 – 2010 period. The mispriced amount of the crude oil import is estimated only for the crude oil excluding natural gas condensate because no appropriate arm’s length price data on the natural gas condensates were available for this study. Table 1 below summarizes the total amount of the E.U. import value and the number of records during the period of 2000 – 2010.
Table 1: E.U. Import of Crude Oil, 2000 – 2010 (excluding intra-EU trades)8
The implied price (or unit value) for each record of crude oil imported is calculated using value and quantity in metric tons. The mispriced amount of the crude oil imported is estimated for each record and then aggregated for all the records. The import values in EUROSTAT include cost, insurance, and freight (c.i.f.) while the crude oil price filters are in terms of free-on-board (f.o.b.). Because the transportation cost data is not available for the E.U. import, the E.U. import values are adjusted for the transportation charge by assuming it to be 70% of the insurance and freight charges on the U.S. import to account for the difference in shipping distance, which is explained in the next subsection.
6 EUROSTAT External Trade Data, http://epp.eurostat.ec.europa.eu/portal/page/portal/external_trade/data/database, and the U.S. Imports of Merchandise. U.S. Census Bureau, U.S. Foreign Trade Data Downloads, http://www.census.gov/foreign-trade/download/dvd/index.html
7 Customs value in EUROSTAT includes all transport costs until the point of introduction into the EC (see European Commission (2008))
8 Aggregated from the downloadable data files, (Import_detail_EU_crude.xlsx) & (Import_detail_EU_n.gas.xlsx)
CN8 DescriptionTotal Amount of Import (EUR billions)
No of records
27090010 NATURAL GAS CONDENSATES €45.7 bn 1,525
27090090PETROLEUM OILS AND OILS OBTAINED FROM BITUMINOUS MINERALS, CRUDE (EXCL. NATURAL GAS CONDENSATES)
€1,693.9 bn 16,360
TOTAL €1,739.6bn 17,885
13LOST BILLIONS – TRANSFER PRICING IN THE EXTRACTIVE INDUSTRIES
3. DATA DESCRIPTION AND SOURCES
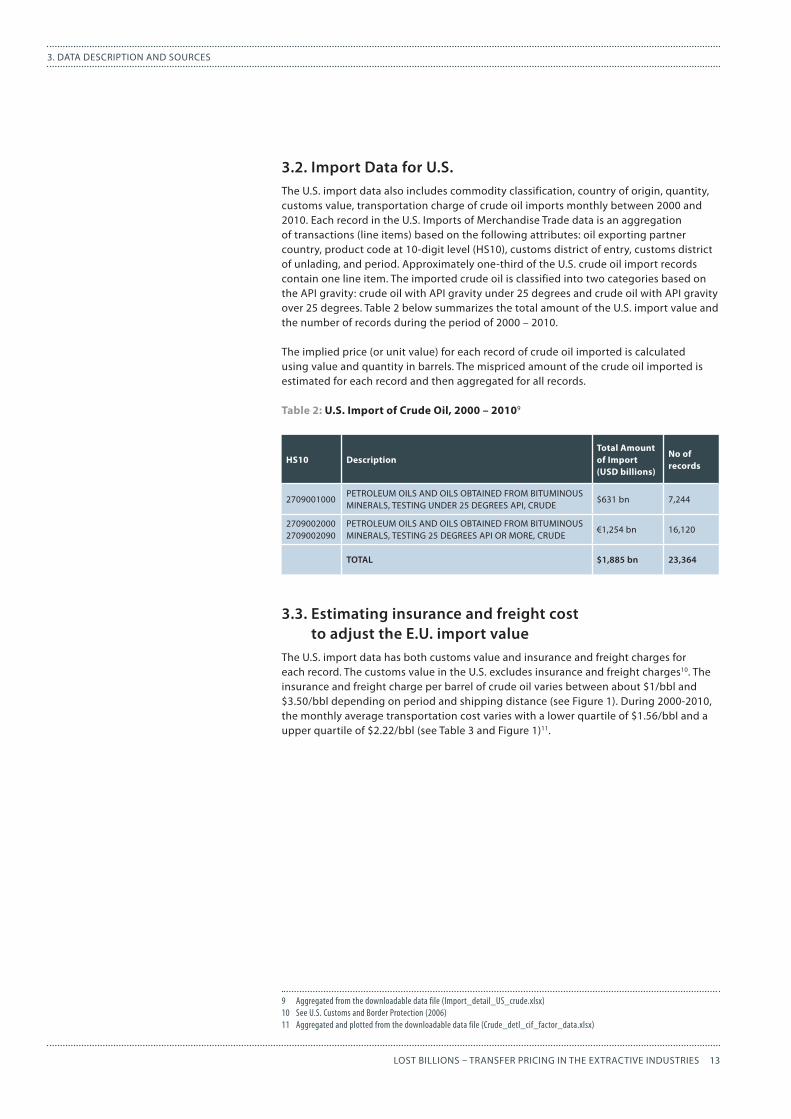
3.2.ImportDataforU.S.The U.S. import data also includes commodity classification, country of origin, quantity, customs value, transportation charge of crude oil imports monthly between 2000 and 2010. Each record in the U.S. Imports of Merchandise Trade data is an aggregation of transactions (line items) based on the following attributes: oil exporting partner country, product code at 10-digit level (HS10), customs district of entry, customs district of unlading, and period. Approximately one-third of the U.S. crude oil import records contain one line item. The imported crude oil is classified into two categories based on the API gravity: crude oil with API gravity under 25 degrees and crude oil with API gravity over 25 degrees. Table 2 below summarizes the total amount of the U.S. import value and the number of records during the period of 2000 – 2010.
The implied price (or unit value) for each record of crude oil imported is calculated using value and quantity in barrels. The mispriced amount of the crude oil imported is estimated for each record and then aggregated for all records.
Table 2: U.S. Import of Crude Oil, 2000 – 20109
3.3.EstimatinginsuranceandfreightcosttoadjusttheE.U.importvalue
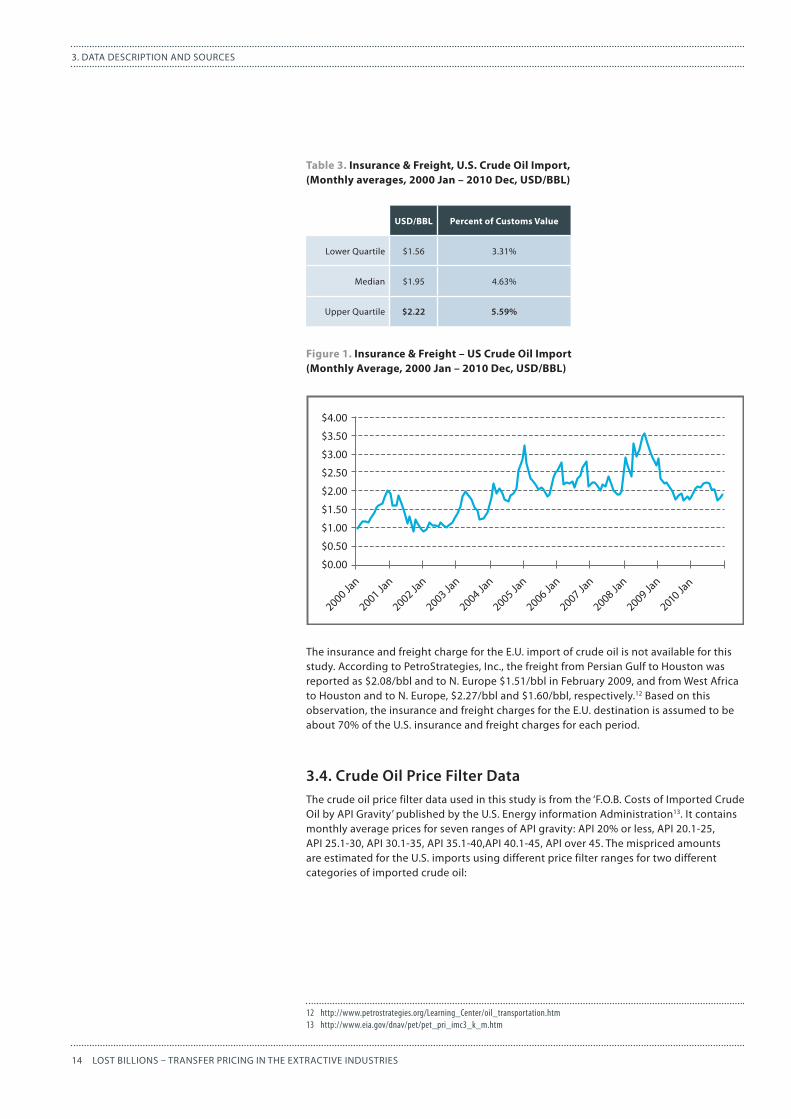
The U.S. import data has both customs value and insurance and freight charges for each record. The customs value in the U.S. excludes insurance and freight charges10. The insurance and freight charge per barrel of crude oil varies between about $1/bbl and $3.50/bbl depending on period and shipping distance (see Figure 1). During 2000-2010, the monthly average transportation cost varies with a lower quartile of $1.56/bbl and a upper quartile of $2.22/bbl (see Table 3 and Figure 1)11.
9 Aggregated from the downloadable data file (Import_detail_US_crude.xlsx)10 See U.S. Customs and Border Protection (2006)11 Aggregated and plotted from the downloadable data file (Crude_detl_cif_factor_data.xlsx)
HS10 DescriptionTotal Amount of Import (USD billions)
No of records
2709001000PETROLEUM OILS AND OILS OBTAINED FROM BITUMINOUS MINERALS, TESTING UNDER 25 DEGREES API, CRUDE
$631 bn 7,244
27090020002709002090
PETROLEUM OILS AND OILS OBTAINED FROM BITUMINOUS MINERALS, TESTING 25 DEGREES API OR MORE, CRUDE
€1,254 bn 16,120
TOTAL $1,885bn 23,364
14 LOST BILLIONS – TRANSFER PRICING IN THE EXTRACTIVE INDUSTRIES
3. DATA DESCRIPTION AND SOURCES
The insurance and freight charge for the E.U. import of crude oil is not available for this study. According to PetroStrategies, Inc., the freight from Persian Gulf to Houston was reported as $2.08/bbl and to N. Europe $1.51/bbl in February 2009, and from West Africa to Houston and to N. Europe, $2.27/bbl and $1.60/bbl, respectively.12 Based on this observation, the insurance and freight charges for the E.U. destination is assumed to be about 70% of the U.S. insurance and freight charges for each period.
3.4.CrudeOilPriceFilterDataThe crude oil price filter data used in this study is from the ‘F.O.B. Costs of Imported Crude Oil by API Gravity’ published by the U.S. Energy information Administration13. It contains monthly average prices for seven ranges of API gravity: API 20% or less, API 20.1-25, API 25.1-30, API 30.1-35, API 35.1-40,API 40.1-45, API over 45. The mispriced amounts are estimated for the U.S. imports using different price filter ranges for two different categories of imported crude oil:
12 http://www.petrostrategies.org/Learning_Center/oil_transportation.htm13 http://www.eia.gov/dnav/pet/pet_pri_imc3_k_m.htm
2000 Jan
2001 Jan
2002 Jan
2003 Jan
2004 Jan
2005 Jan
2006 Jan
2007 Jan
2008 Jan
2009 Jan
2010 Jan
$0.00
$0.50
$1.00
$1.50
$2.00
$2.50
$3.00
$3.50
$4.00
Table 3. Insurance & Freight, U.S. Crude Oil Import, (Monthly averages, 2000 Jan – 2010 Dec, USD/BBL)
Figure 1. Insurance & Freight – US Crude Oil Import(Monthly Average, 2000 Jan – 2010 Dec, USD/BBL)
USD/BBL Percent of Customs Value
Lower Quartile $1.56 3.31%
Median $1.95 4.63%
Upper Quartile $2.22 5.59%
15LOST BILLIONS – TRANSFER PRICING IN THE EXTRACTIVE INDUSTRIES
3. DATA DESCRIPTION AND SOURCES
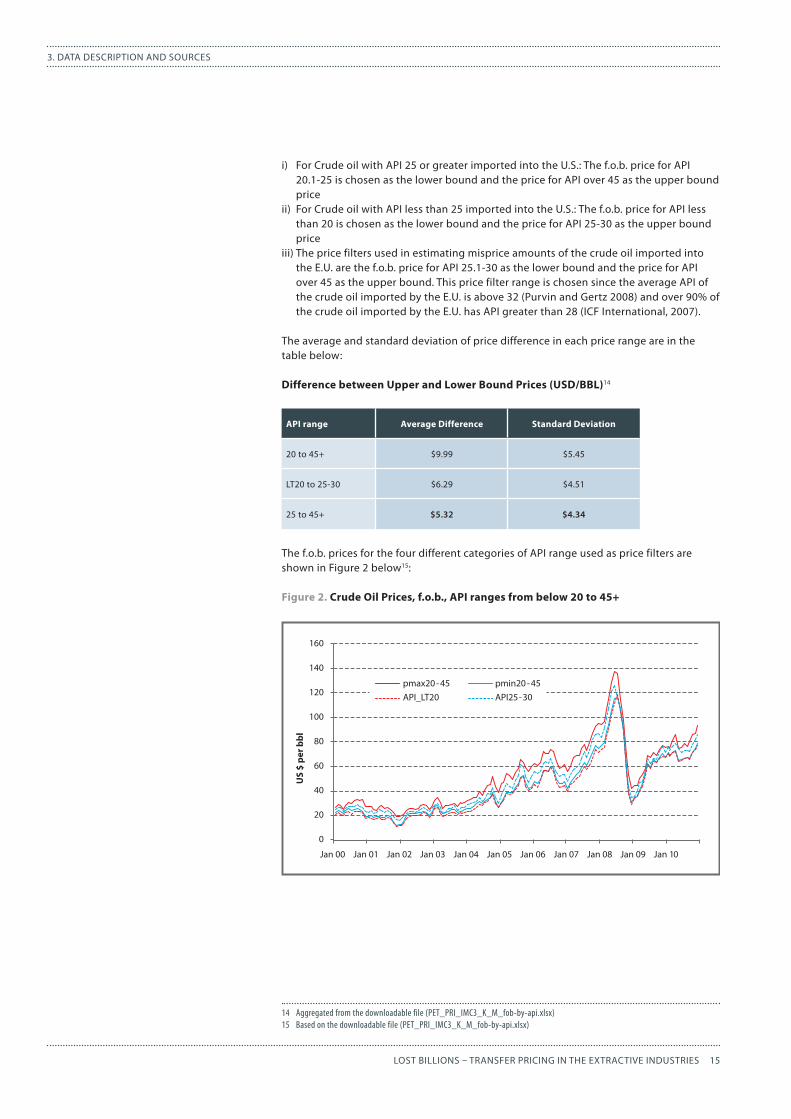
i) For Crude oil with API 25 or greater imported into the U.S.: The f.o.b. price for API 20.1-25 is chosen as the lower bound and the price for API over 45 as the upper bound price
ii) For Crude oil with API less than 25 imported into the U.S.: The f.o.b. price for API less than 20 is chosen as the lower bound and the price for API 25-30 as the upper bound price
iii) The price filters used in estimating misprice amounts of the crude oil imported into the E.U. are the f.o.b. price for API 25.1-30 as the lower bound and the price for API over 45 as the upper bound. This price filter range is chosen since the average API of the crude oil imported by the E.U. is above 32 (Purvin and Gertz 2008) and over 90% of the crude oil imported by the E.U. has API greater than 28 (ICF International, 2007).
The average and standard deviation of price difference in each price range are in the table below:
Difference between Upper and Lower Bound Prices (USD/BBL)14
The f.o.b. prices for the four different categories of API range used as price filters are shown in Figure 2 below15:
Figure 2. Crude Oil Prices, f.o.b., API ranges from below 20 to 45+
14 Aggregated from the downloadable file (PET_PRI_IMC3_K_M_fob-by-api.xlsx)15 Based on the downloadable file (PET_PRI_IMC3_K_M_fob-by-api.xlsx)
Jan 00
US
$ pe
r bbl
0
20
40
60
80
100
120
140
160
Jan 01 Jan 02 Jan 03
pmax20 - 45API_LT20
pmin20 - 45API25 - 30
Jan 04 Jan 05 Jan 06 Jan 07 Jan 08 Jan 09 Jan 10
API range Average Difference Standard Deviation
20 to 45+ $9.99 $5.45
LT20 to 25-30 $6.29 $4.51
25 to 45+ $5.32 $4.34
16 LOST BILLIONS – TRANSFER PRICING IN THE EXTRACTIVE INDUSTRIES
3. DATA DESCRIPTION AND SOURCES
The quantity of crude oil imported into the E.U. is in metric tons and the value in thousand EUROs while the crude oil cost published by the US EIA is in USD per barrel. This requires conversion of values between EURO and USD and conversion of quantity between weight (metric ton) and volume (barrel). The average monthly exchange rate between EUR and USD is used to convert the import value from EUR to USD. The average number of barrels per metric ton of crude oil used in the U.S. is 7.333 barrels16, but the actual number of barrels per metric ton of crude oil varies depending on the API gravity. The conversion factors used in this study are 6.96 barrels per ton (API 25) for the lower bound price and 7.62 barrels per ton (API 40) for upper bound price17.
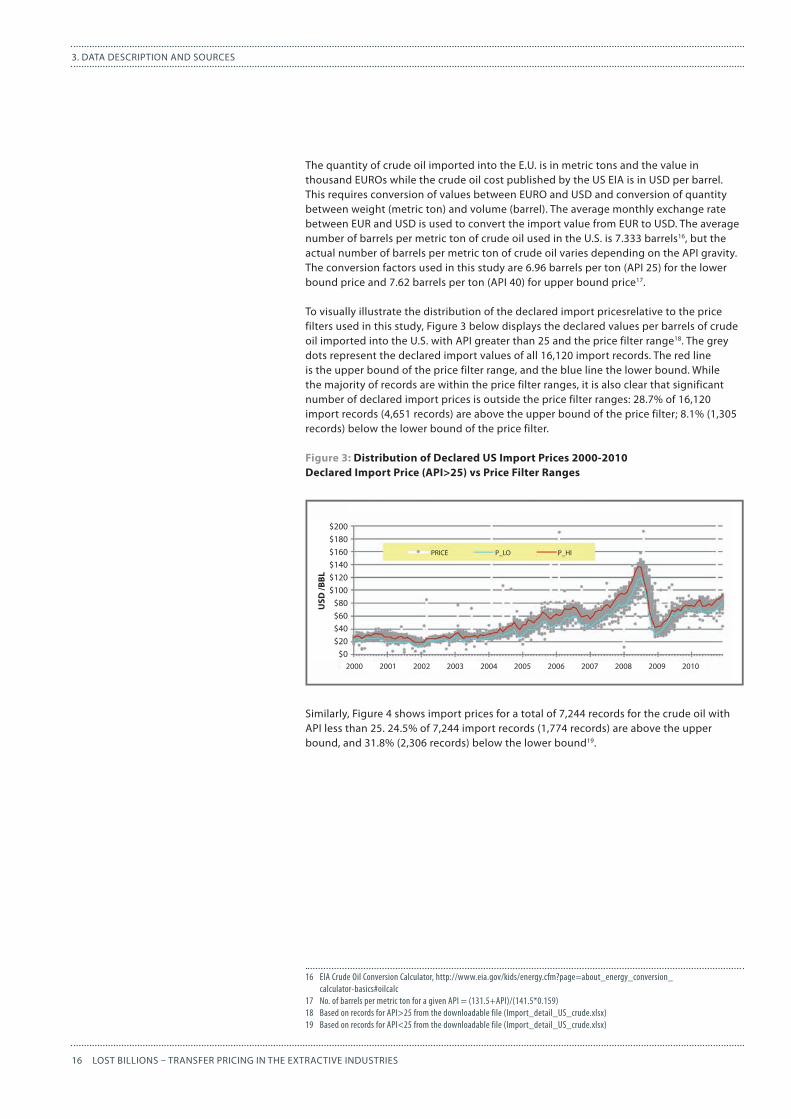
To visually illustrate the distribution of the declared import pricesrelative to the price filters used in this study, Figure 3 below displays the declared values per barrels of crude oil imported into the U.S. with API greater than 25 and the price filter range18. The grey dots represent the declared import values of all 16,120 import records. The red line is the upper bound of the price filter range, and the blue line the lower bound. While the majority of records are within the price filter ranges, it is also clear that significant number of declared import prices is outside the price filter ranges: 28.7% of 16,120 import records (4,651 records) are above the upper bound of the price filter; 8.1% (1,305 records) below the lower bound of the price filter.
Figure 3: Distribution of Declared US Import Prices 2000-2010Declared Import Price (API>25) vs Price Filter Ranges
Similarly, Figure 4 shows import prices for a total of 7,244 records for the crude oil with API less than 25. 24.5% of 7,244 import records (1,774 records) are above the upper bound, and 31.8% (2,306 records) below the lower bound19.
16 EIA Crude Oil Conversion Calculator, http://www.eia.gov/kids/energy.cfm?page=about_energy_conversion_ calculator-basics#oilcalc
17 No. of barrels per metric ton for a given API = (131.5+API)/(141.5*0.159)18 Based on records for API>25 from the downloadable file (Import_detail_US_crude.xlsx)19 Based on records for API<25 from the downloadable file (Import_detail_US_crude.xlsx)
USD
/BBL
$60$40$20
$0
$80$100$120$140$160$180$200
2000 2001 2002 2003 2004 2005 2006 2007 2008 2009 2010
PRICE P_LO P_HI
17LOST BILLIONS – TRANSFER PRICING IN THE EXTRACTIVE INDUSTRIES
3. DATA DESCRIPTION AND SOURCES
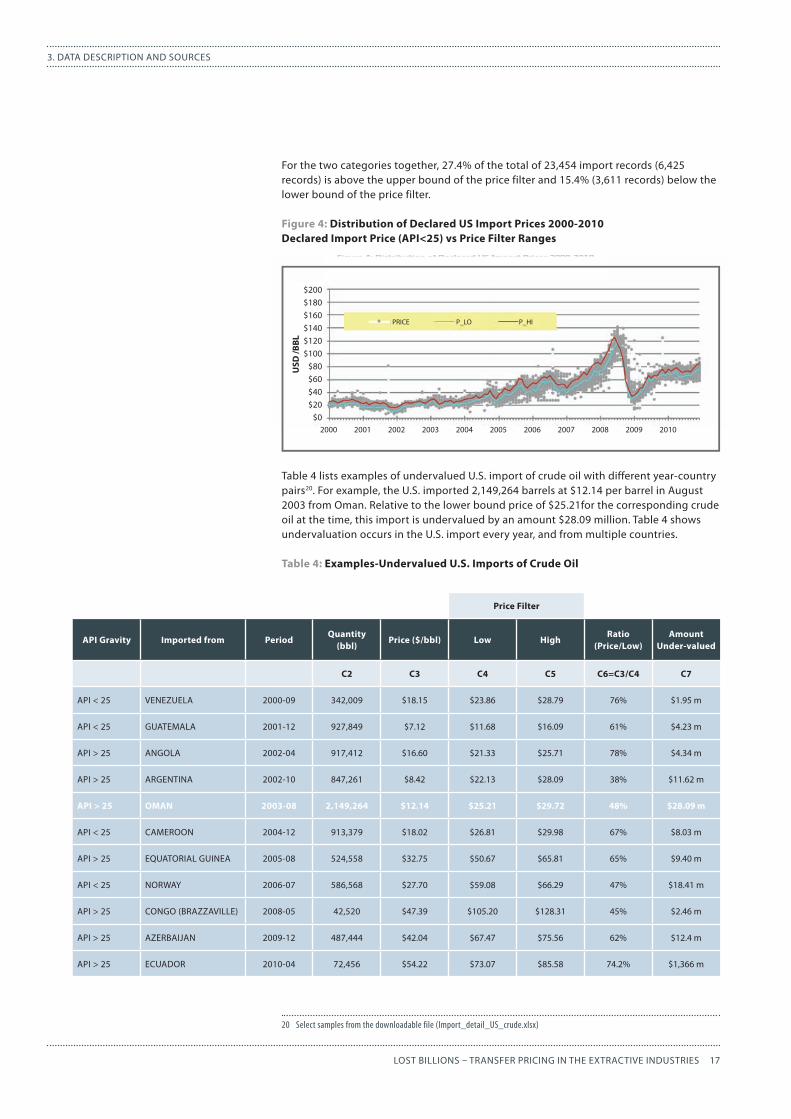
For the two categories together, 27.4% of the total of 23,454 import records (6,425 records) is above the upper bound of the price filter and 15.4% (3,611 records) below the lower bound of the price filter.
Figure 4: Distribution of Declared US Import Prices 2000-2010Declared Import Price (API<25) vs Price Filter Ranges
Table 4 lists examples of undervalued U.S. import of crude oil with different year-country pairs20. For example, the U.S. imported 2,149,264 barrels at $12.14 per barrel in August 2003 from Oman. Relative to the lower bound price of $25.21for the corresponding crude oil at the time, this import is undervalued by an amount $28.09 million. Table 4 shows undervaluation occurs in the U.S. import every year, and from multiple countries.
Table 4: Examples-Undervalued U.S. Imports of Crude Oil
20 Select samples from the downloadable file (Import_detail_US_crude.xlsx)
Price Filter
API Gravity Imported from PeriodQuantity
(bbl)Price ($/bbl) Low High
Ratio (Price/Low)
Amount Under-valued
C2 C3 C4 C5 C6=C3/C4 C7
API < 25 VENEZUELA 2000-09 342,009 $18.15 $23.86 $28.79 76% $1.95 m
API < 25 GUATEMALA 2001-12 927,849 $7.12 $11.68 $16.09 61% $4.23 m
API > 25 ANGOLA 2002-04 917,412 $16.60 $21.33 $25.71 78% $4.34 m
API > 25 ARGENTINA 2002-10 847,261 $8.42 $22.13 $28.09 38% $11.62 m
API > 25 OMAN 2003-08 2,149,264 $12.14 $25.21 $29.72 48% $28.09 m
API < 25 CAMEROON 2004-12 913,379 $18.02 $26.81 $29.98 67% $8.03 m
API > 25 EQUATORIAL GUINEA 2005-08 524,558 $32.75 $50.67 $65.81 65% $9.40 m
API < 25 NORWAY 2006-07 586,568 $27.70 $59.08 $66.29 47% $18.41 m
API > 25 CONGO (BRAZZAVILLE) 2008-05 42,520 $47.39 $105.20 $128.31 45% $2.46 m
API > 25 AZERBAIJAN 2009-12 487,444 $42.04 $67.47 $75.56 62% $12.4 m
API > 25 ECUADOR 2010-04 72,456 $54.22 $73.07 $85.58 74.2% $1,366 m
USD
/BBL
$60$40$20
$0
$80$100$120$140$160$180$200
2000 2001 2002 2003 2004 2005 2006 2007 2008 2009 2010
PRICE P_LO P_HI
18 LOST BILLIONS – TRANSFER PRICING IN THE EXTRACTIVE INDUSTRIES
3. DATA DESCRIPTION AND SOURCES
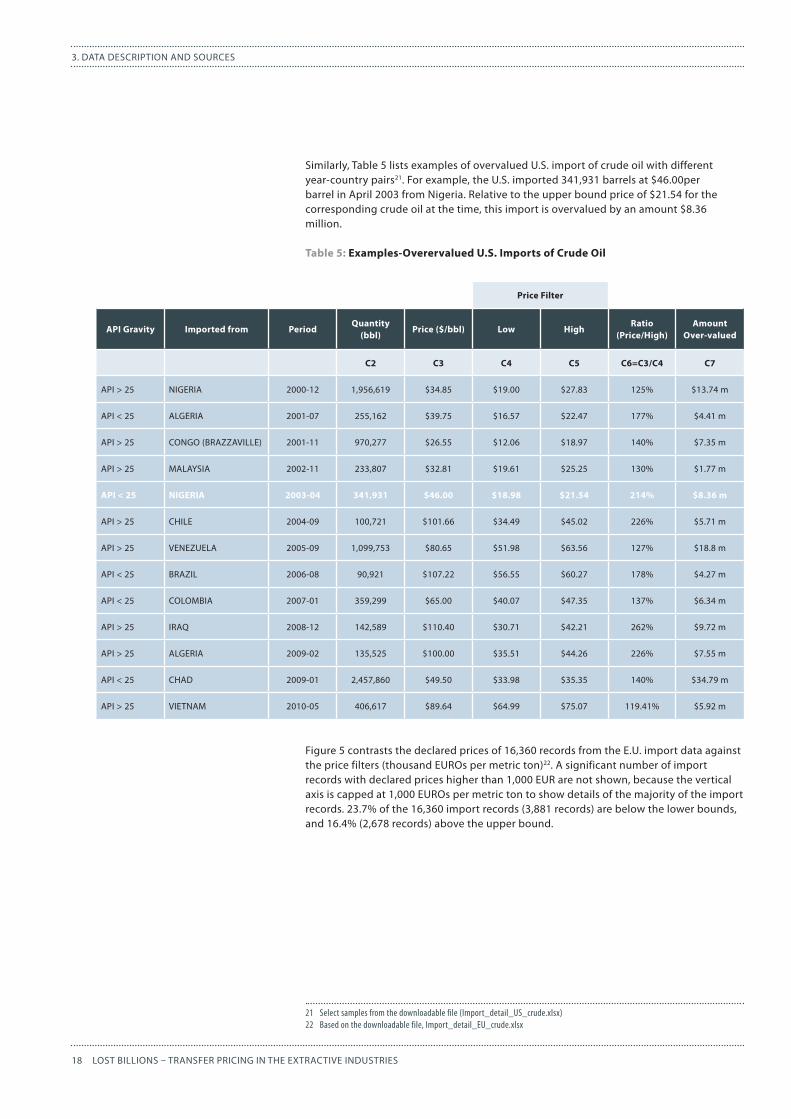
Similarly, Table 5 lists examples of overvalued U.S. import of crude oil with different year-country pairs21. For example, the U.S. imported 341,931 barrels at $46.00per barrel in April 2003 from Nigeria. Relative to the upper bound price of $21.54 for the corresponding crude oil at the time, this import is overvalued by an amount $8.36 million.
Table 5: Examples-Overervalued U.S. Imports of Crude Oil
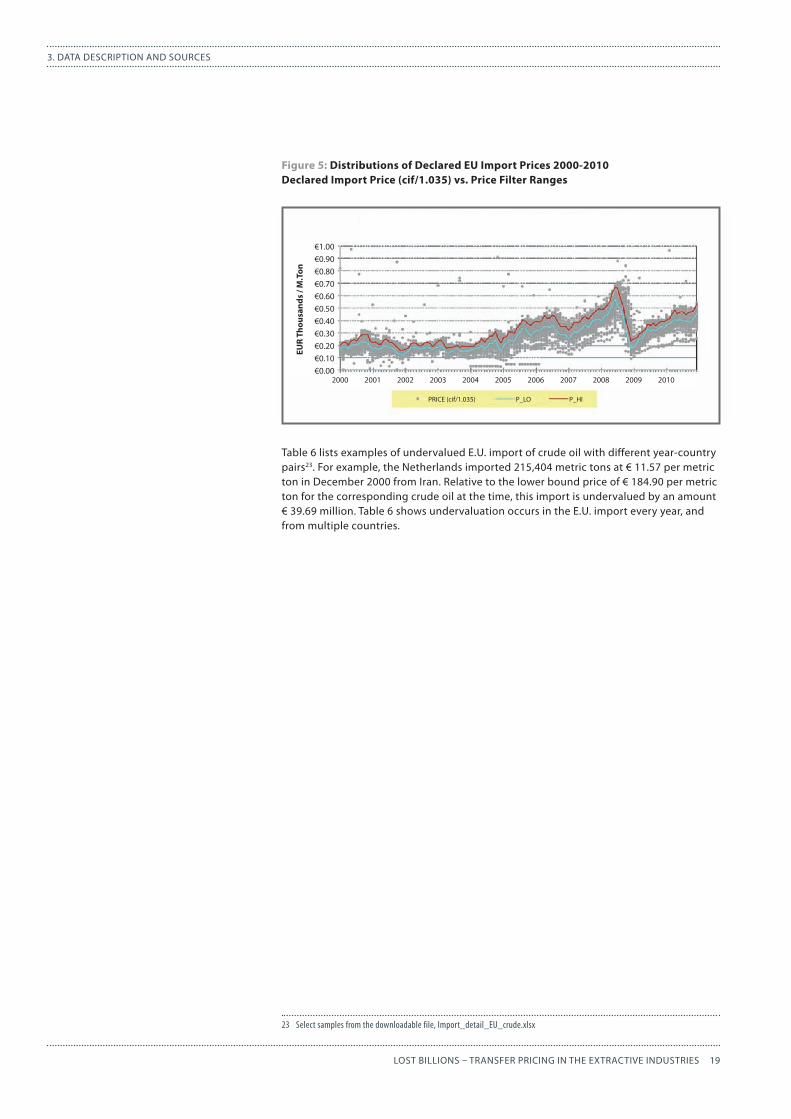
Figure 5 contrasts the declared prices of 16,360 records from the E.U. import data against the price filters (thousand EUROs per metric ton)22. A significant number of import records with declared prices higher than 1,000 EUR are not shown, because the vertical axis is capped at 1,000 EUROs per metric ton to show details of the majority of the import records. 23.7% of the 16,360 import records (3,881 records) are below the lower bounds, and 16.4% (2,678 records) above the upper bound.
21 Select samples from the downloadable file (Import_detail_US_crude.xlsx)22 Based on the downloadable file, Import_detail_EU_crude.xlsx
Price Filter
API Gravity Imported from PeriodQuantity
(bbl)Price ($/bbl) Low High
Ratio (Price/High)
Amount Over-valued
C2 C3 C4 C5 C6=C3/C4 C7
API > 25 NIGERIA 2000-12 1,956,619 $34.85 $19.00 $27.83 125% $13.74 m
API < 25 ALGERIA 2001-07 255,162 $39.75 $16.57 $22.47 177% $4.41 m
API > 25 CONGO (BRAZZAVILLE) 2001-11 970,277 $26.55 $12.06 $18.97 140% $7.35 m
API > 25 MALAYSIA 2002-11 233,807 $32.81 $19.61 $25.25 130% $1.77 m
API < 25 NIGERIA 2003-04 341,931 $46.00 $18.98 $21.54 214% $8.36 m
API > 25 CHILE 2004-09 100,721 $101.66 $34.49 $45.02 226% $5.71 m
API > 25 VENEZUELA 2005-09 1,099,753 $80.65 $51.98 $63.56 127% $18.8 m
API < 25 BRAZIL 2006-08 90,921 $107.22 $56.55 $60.27 178% $4.27 m
API < 25 COLOMBIA 2007-01 359,299 $65.00 $40.07 $47.35 137% $6.34 m
API > 25 IRAQ 2008-12 142,589 $110.40 $30.71 $42.21 262% $9.72 m
API > 25 ALGERIA 2009-02 135,525 $100.00 $35.51 $44.26 226% $7.55 m
API < 25 CHAD 2009-01 2,457,860 $49.50 $33.98 $35.35 140% $34.79 m
API > 25 VIETNAM 2010-05 406,617 $89.64 $64.99 $75.07 119.41% $5.92 m
19LOST BILLIONS – TRANSFER PRICING IN THE EXTRACTIVE INDUSTRIES
3. DATA DESCRIPTION AND SOURCES
Figure 5: Distributions of Declared EU Import Prices 2000-2010Declared Import Price (cif/1.035) vs. Price Filter Ranges
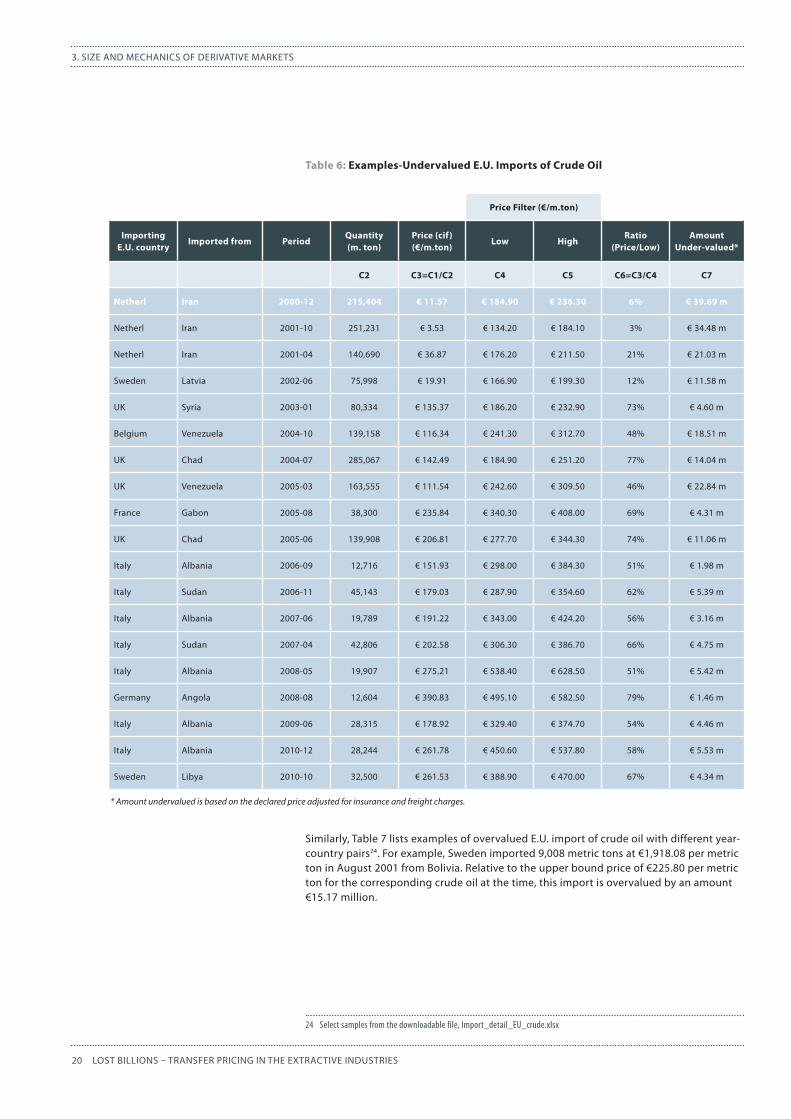
Table 6 lists examples of undervalued E.U. import of crude oil with different year-country pairs23. For example, the Netherlands imported 215,404 metric tons at € 11.57 per metric ton in December 2000 from Iran. Relative to the lower bound price of € 184.90 per metric ton for the corresponding crude oil at the time, this import is undervalued by an amount € 39.69 million. Table 6 shows undervaluation occurs in the E.U. import every year, and from multiple countries.
23 Select samples from the downloadable file, Import_detail_EU_crude.xlsx
EUR
Thou
sand
s / M
.Ton
€0.30€0.20€0.10€0.00
€0.40€0.50€0.60€0.70€0.80€0.90€1.00
2000 2001 2002 2003 2004 2005 2006 2007 2008 2009 2010
PRICE (cif/1.035) P_LO P_HI
20 LOST BILLIONS – TRANSFER PRICING IN THE EXTRACTIVE INDUSTRIES
3. SIZE AND MECHANICS OF DERIVATIVE MARKETS
Table 6: Examples-Undervalued E.U. Imports of Crude Oil
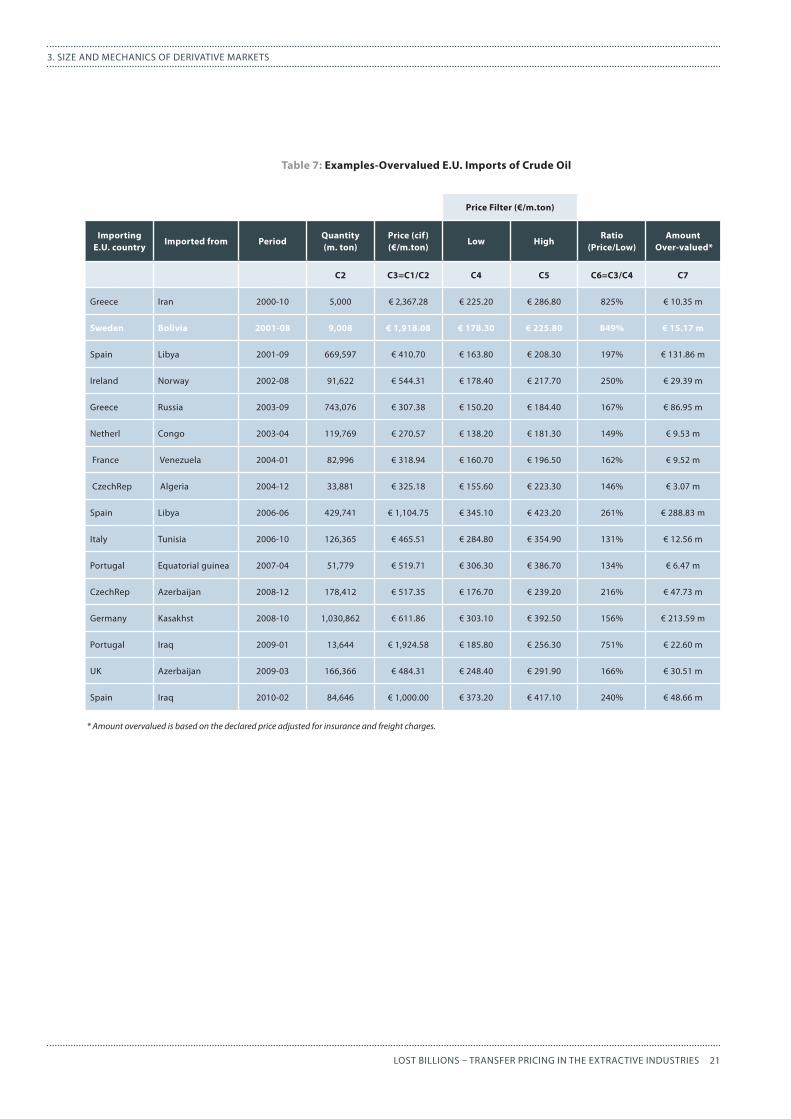
Similarly, Table 7 lists examples of overvalued E.U. import of crude oil with different year-country pairs24. For example, Sweden imported 9,008 metric tons at €1,918.08 per metric ton in August 2001 from Bolivia. Relative to the upper bound price of €225.80 per metric ton for the corresponding crude oil at the time, this import is overvalued by an amount €15.17 million.
24 Select samples from the downloadable file, Import_detail_EU_crude.xlsx
Price Filter (€/m.ton)
Importing E.U. country
Imported from PeriodQuantity (m. ton)
Price (cif) (€/m.ton)
Low HighRatio
(Price/Low)Amount
Under-valued*
C2 C3=C1/C2 C4 C5 C6=C3/C4 C7
Netherl Iran 2000-12 215,404 € 11.57 € 184.90 € 236.30 6% € 39.69 m
Netherl Iran 2001-10 251,231 € 3.53 € 134.20 € 184.10 3% € 34.48 m
Netherl Iran 2001-04 140,690 € 36.87 € 176.20 € 211.50 21% € 21.03 m
Sweden Latvia 2002-06 75,998 € 19.91 € 166.90 € 199.30 12% € 11.58 m
UK Syria 2003-01 80,334 € 135.37 € 186.20 € 232.90 73% € 4.60 m
Belgium Venezuela 2004-10 139,158 € 116.34 € 241.30 € 312.70 48% € 18.51 m
UK Chad 2004-07 285,067 € 142.49 € 184.90 € 251.20 77% € 14.04 m
UK Venezuela 2005-03 163,555 € 111.54 € 242.60 € 309.50 46% € 22.84 m
France Gabon 2005-08 38,300 € 235.84 € 340.30 € 408.00 69% € 4.31 m
UK Chad 2005-06 139,908 € 206.81 € 277.70 € 344.30 74% € 11.06 m
Italy Albania 2006-09 12,716 € 151.93 € 298.00 € 384.30 51% € 1.98 m
Italy Sudan 2006-11 45,143 € 179.03 € 287.90 € 354.60 62% € 5.39 m
Italy Albania 2007-06 19,789 € 191.22 € 343.00 € 424.20 56% € 3.16 m
Italy Sudan 2007-04 42,806 € 202.58 € 306.30 € 386.70 66% € 4.75 m
Italy Albania 2008-05 19,907 € 275.21 € 538.40 € 628.50 51% € 5.42 m
Germany Angola 2008-08 12,604 € 390.83 € 495.10 € 582.50 79% € 1.46 m
Italy Albania 2009-06 28,315 € 178.92 € 329.40 € 374.70 54% € 4.46 m
Italy Albania 2010-12 28,244 € 261.78 € 450.60 € 537.80 58% € 5.53 m
Sweden Libya 2010-10 32,500 € 261.53 € 388.90 € 470.00 67% € 4.34 m
* Amount undervalued is based on the declared price adjusted for insurance and freight charges.
21LOST BILLIONS – TRANSFER PRICING IN THE EXTRACTIVE INDUSTRIES
3. SIZE AND MECHANICS OF DERIVATIVE MARKETS
Table 7: Examples-Overvalued E.U. Imports of Crude Oil
Price Filter (€/m.ton)
Importing E.U. country
Imported from PeriodQuantity (m. ton)
Price (cif) (€/m.ton)
Low HighRatio
(Price/Low)Amount
Over-valued*
C2 C3=C1/C2 C4 C5 C6=C3/C4 C7
Greece Iran 2000-10 5,000 € 2,367.28 € 225.20 € 286.80 825% € 10.35 m
Sweden Bolivia 2001-08 9,008 € 1,918.08 € 178.30 € 225.80 849% € 15.17 m
Spain Libya 2001-09 669,597 € 410.70 € 163.80 € 208.30 197% € 131.86 m
Ireland Norway 2002-08 91,622 € 544.31 € 178.40 € 217.70 250% € 29.39 m
Greece Russia 2003-09 743,076 € 307.38 € 150.20 € 184.40 167% € 86.95 m
Netherl Congo 2003-04 119,769 € 270.57 € 138.20 € 181.30 149% € 9.53 m
France Venezuela 2004-01 82,996 € 318.94 € 160.70 € 196.50 162% € 9.52 m
CzechRep Algeria 2004-12 33,881 € 325.18 € 155.60 € 223.30 146% € 3.07 m
Spain Libya 2006-06 429,741 € 1,104.75 € 345.10 € 423.20 261% € 288.83 m
Italy Tunisia 2006-10 126,365 € 465.51 € 284.80 € 354.90 131% € 12.56 m
Portugal Equatorial guinea 2007-04 51,779 € 519.71 € 306.30 € 386.70 134% € 6.47 m
CzechRep Azerbaijan 2008-12 178,412 € 517.35 € 176.70 € 239.20 216% € 47.73 m
Germany Kasakhst 2008-10 1,030,862 € 611.86 € 303.10 € 392.50 156% € 213.59 m
Portugal Iraq 2009-01 13,644 € 1,924.58 € 185.80 € 256.30 751% € 22.60 m
UK Azerbaijan 2009-03 166,366 € 484.31 € 248.40 € 291.90 166% € 30.51 m
Spain Iraq 2010-02 84,646 € 1,000.00 € 373.20 € 417.10 240% € 48.66 m
* Amount overvalued is based on the declared price adjusted for insurance and freight charges.
22 LOST BILLIONS – TRANSFER PRICING IN THE EXTRACTIVE INDUSTRIES
4. ESTIMATES OF MISPRICED AMOUNT OF CRUDE OIL IMPORT BY E.U./U.S.
4.ESTIMATESOFMISPRICEDAMOUNTOFCRUDEOILIMPORTBYE.U./U.S.
The undervalued and overvalued amounts are estimated for every E.U. and U.S. import record. The results presented in this section include undervalued amount and overvalued amount aggregated by year and by exporting country.
4.1.UndervaluedamountoftheE.U.importAnnualtrend
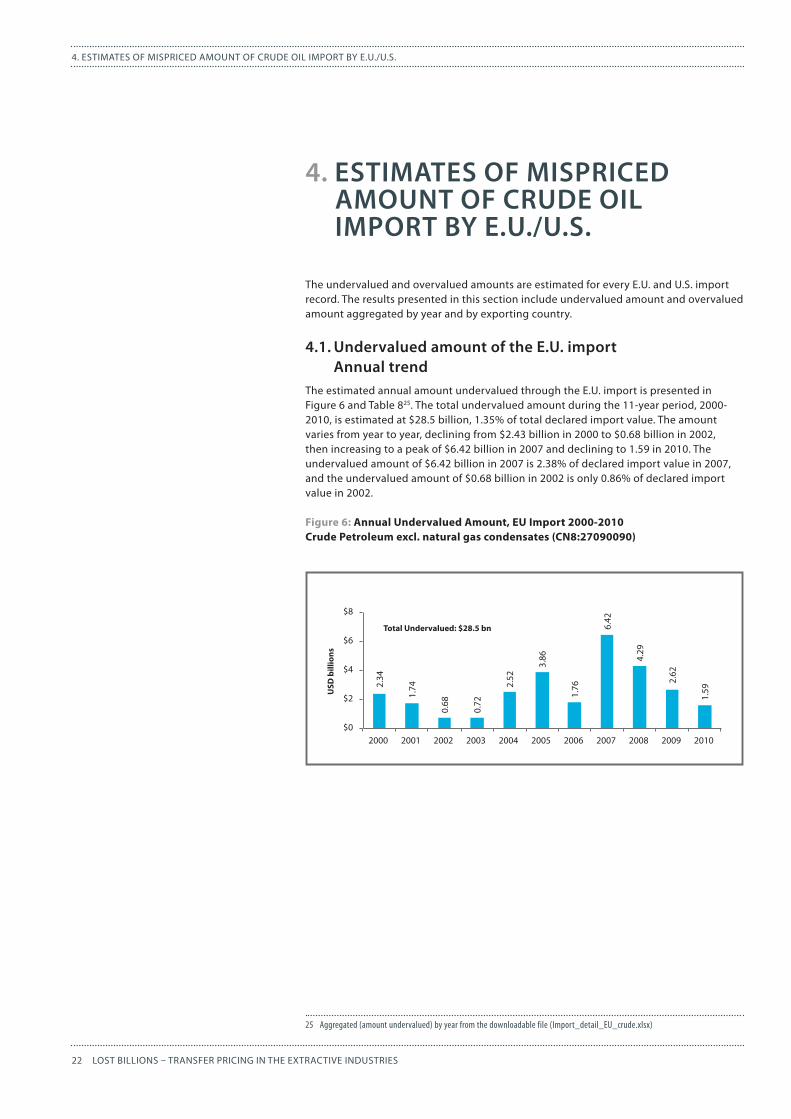
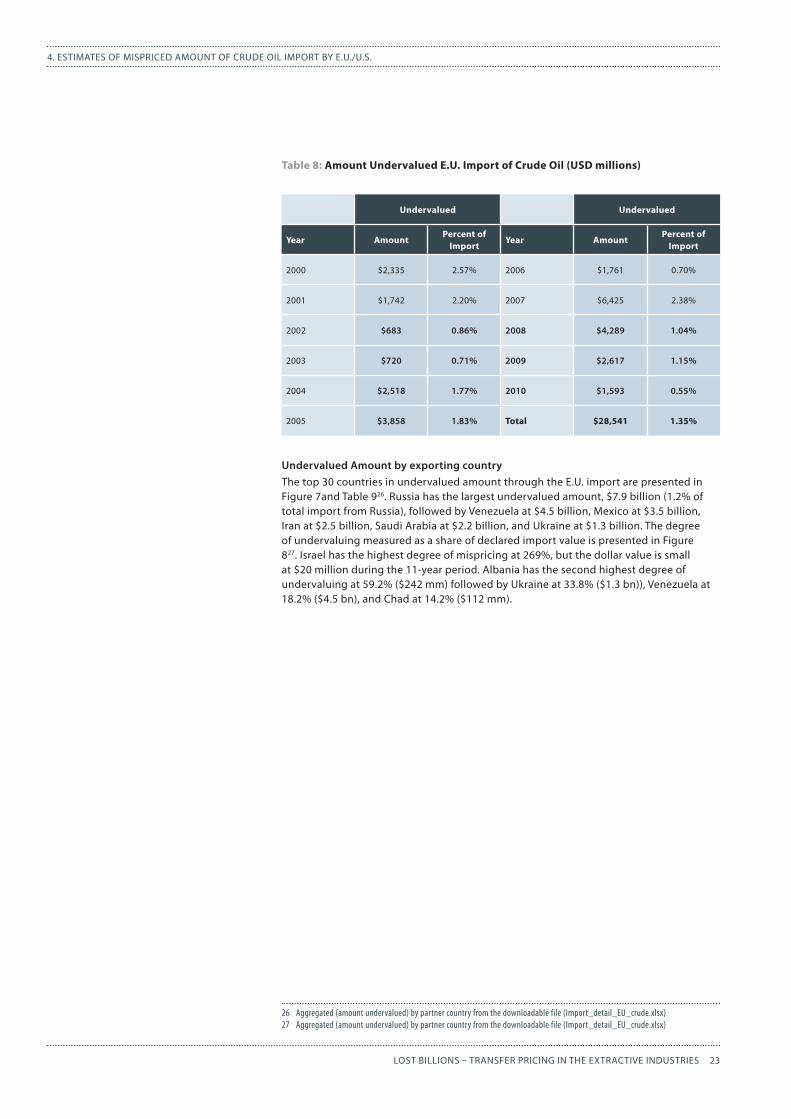
The estimated annual amount undervalued through the E.U. import is presented in Figure 6 and Table 825. The total undervalued amount during the 11-year period, 2000-2010, is estimated at $28.5 billion, 1.35% of total declared import value. The amount varies from year to year, declining from $2.43 billion in 2000 to $0.68 billion in 2002, then increasing to a peak of $6.42 billion in 2007 and declining to 1.59 in 2010. The undervalued amount of $6.42 billion in 2007 is 2.38% of declared import value in 2007, and the undervalued amount of $0.68 billion in 2002 is only 0.86% of declared import value in 2002.
Figure 6: Annual Undervalued Amount, EU Import 2000-2010Crude Petroleum excl. natural gas condensates (CN8:27090090)
25 Aggregated (amount undervalued) by year from the downloadable file (Import_detail_EU_crude.xlsx)
Total Undervalued: $28.5 bn
USD
bill
ions
$0
$2
$4
$6
$8
2000
2.34
1.74
0.68
0.72
2.52
3.86
1.76
6.42
4.29
2.62
1.59
2001 2002 2003 2004 2005 2006 2007 2008 2009 2010
23LOST BILLIONS – TRANSFER PRICING IN THE EXTRACTIVE INDUSTRIES
4. ESTIMATES OF MISPRICED AMOUNT OF CRUDE OIL IMPORT BY E.U./U.S.
Table 8: Amount Undervalued E.U. Import of Crude Oil (USD millions)
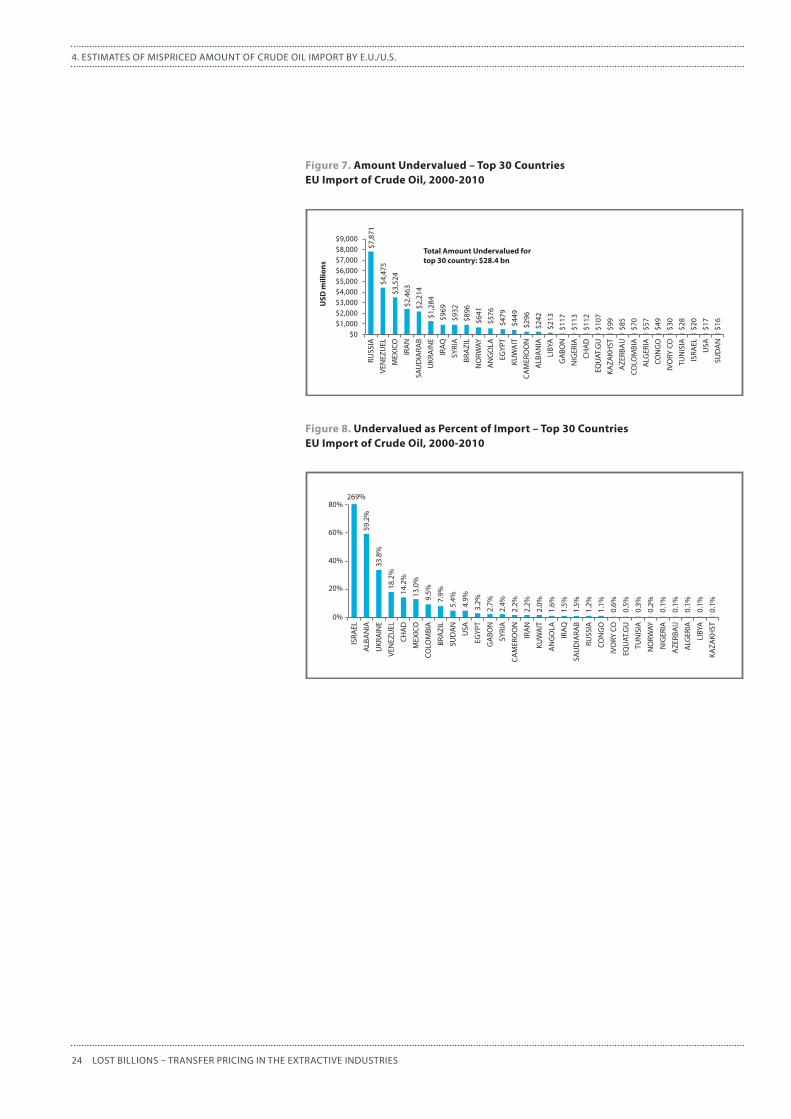
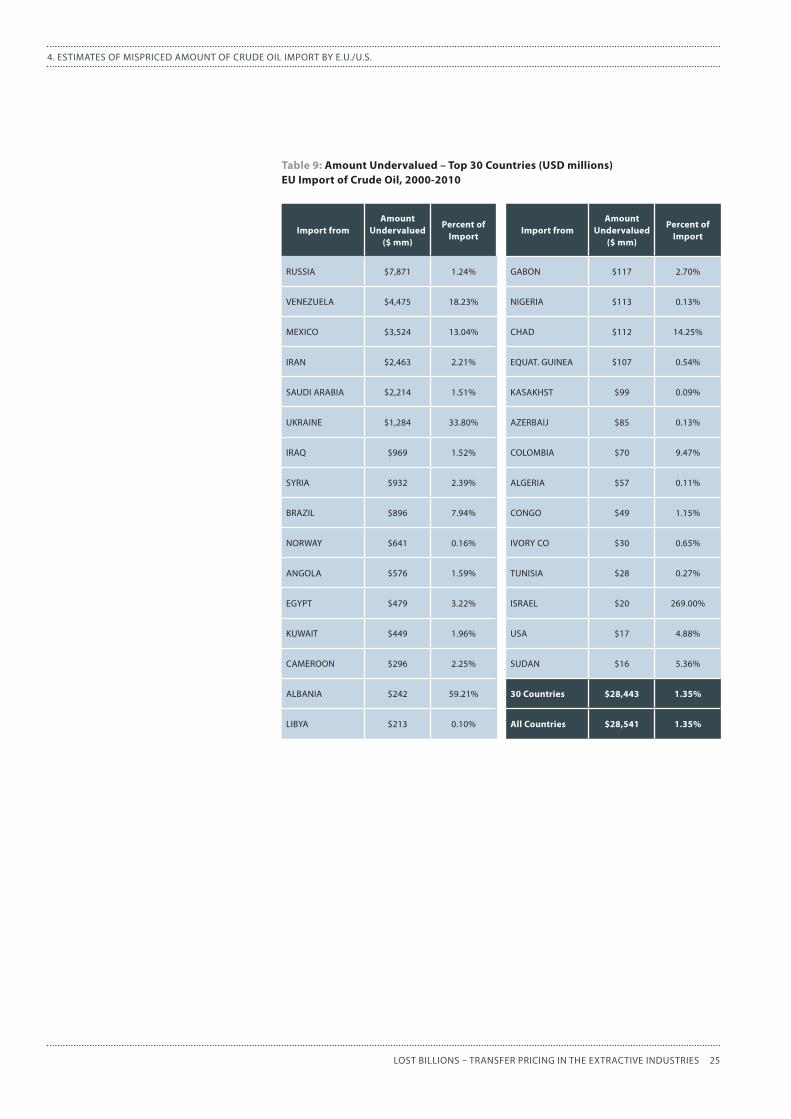
UndervaluedAmountbyexportingcountryThe top 30 countries in undervalued amount through the E.U. import are presented in Figure 7and Table 926. Russia has the largest undervalued amount, $7.9 billion (1.2% of total import from Russia), followed by Venezuela at $4.5 billion, Mexico at $3.5 billion, Iran at $2.5 billion, Saudi Arabia at $2.2 billion, and Ukraine at $1.3 billion. The degree of undervaluing measured as a share of declared import value is presented in Figure 827. Israel has the highest degree of mispricing at 269%, but the dollar value is small at $20 million during the 11-year period. Albania has the second highest degree of undervaluing at 59.2% ($242 mm) followed by Ukraine at 33.8% ($1.3 bn)), Venezuela at 18.2% ($4.5 bn), and Chad at 14.2% ($112 mm).
26 Aggregated (amount undervalued) by partner country from the downloadable file (Import_detail_EU_crude.xlsx)27 Aggregated (amount undervalued) by partner country from the downloadable file (Import_detail_EU_crude.xlsx)
Undervalued Undervalued
Year AmountPercent of
ImportYear Amount
Percent of Import
2000 $2,335 2.57% 2006 $1,761 0.70%
2001 $1,742 2.20% 2007 $6,425 2.38%
2002 $683 0.86% 2008 $4,289 1.04%
2003 $720 0.71% 2009 $2,617 1.15%
2004 $2,518 1.77% 2010 $1,593 0.55%
2005 $3,858 1.83% Total $28,541 1.35%
24 LOST BILLIONS – TRANSFER PRICING IN THE EXTRACTIVE INDUSTRIES
4. ESTIMATES OF MISPRICED AMOUNT OF CRUDE OIL IMPORT BY E.U./U.S.
Figure 7. Amount Undervalued – Top 30 CountriesEU Import of Crude Oil, 2000-2010
Figure 8. Undervalued as Percent of Import – Top 30 CountriesEU Import of Crude Oil, 2000-2010
Total Amount Undervalued fortop 30 country: $28.4 bn
USD
mill
ions
$0$1,000
RUSS
IA
VEN
EZU
EL
MEX
ICO
IRA
N
SAU
DIA
RAB
UKR
AIN
E
IRAQ
SYRI
A
BRA
ZIL
NO
RWAY
AN
GO
LA
EGYP
T
KUW
AIT
CAM
ERO
ON
ALB
AN
IA
LIBY
A
GA
BON
NIG
ERIA
CHA
D
EQU
AT.G
U
KAZA
KHST
AZE
RBA
IJ
COLO
MBI
A
ALG
ERIA
CON
GO
IVO
RY C
O
TUN
ISIA
ISRA
EL
USA
SUD
AN
$2,000$3,000$4,000$5,000$6,000$7,000$8,000$9,000
$7,8
71
$4,4
75
$3,5
24
$2,4
63
$2,2
14
$1,2
84
$969
$932
$896
$641
$576
$479
$449
$296
$242
$213
$117
$113
$112
$107
$99
$85
$70
$57
$49
$30
$28
$20
$17
$16
ISRA
EL
ALB
AN
IA
UKR
AIN
E
VEN
EZU
EL
CHA
D
MEX
ICO
COLO
MBI
A
BRA
ZIL
SUD
AN
USA
EGYP
T
GA
BON
SYRI
A
CAM
ERO
ON
IRA
N
KUW
AIT
IRAQ
AN
GO
LA
SAU
DIA
RAB
RUSS
IA
CON
GO
IVO
RY C
O
EQU
AT.G
U
TUN
ISIA
NO
RWAY
AZE
RBA
IJ
NIG
ERIA
ALG
ERIA
LIBY
A
KAZA
KHST
33.8
%
18.2
%
14.2
%
13.0
%
9.5%
7.9%
5.4%
4.9%
3.2%
2.7%
2.4%
2.2%
2.2%
2.0%
1.5%
1.6%
1.5%
1.2%
1.1%
0.6%
0.5%
0.3%
0.2%
0.1%
0.1%
0.1%
0.1%
0.1%
0%
20%
40%
60%
80%269%
59.2
%
25LOST BILLIONS – TRANSFER PRICING IN THE EXTRACTIVE INDUSTRIES
4. ESTIMATES OF MISPRICED AMOUNT OF CRUDE OIL IMPORT BY E.U./U.S.
Import fromAmount
Undervalued ($ mm)
Percent of Import
Import fromAmount
Undervalued ($ mm)
Percent of Import
RUSSIA $7,871 1.24% GABON $117 2.70%
VENEZUELA $4,475 18.23% NIGERIA $113 0.13%
MEXICO $3,524 13.04% CHAD $112 14.25%
IRAN $2,463 2.21% EQUAT. GUINEA $107 0.54%
SAUDI ARABIA $2,214 1.51% KASAKHST $99 0.09%
UKRAINE $1,284 33.80% AZERBAIJ $85 0.13%
IRAQ $969 1.52% COLOMBIA $70 9.47%
SYRIA $932 2.39% ALGERIA $57 0.11%
BRAZIL $896 7.94% CONGO $49 1.15%
NORWAY $641 0.16% IVORY CO $30 0.65%
ANGOLA $576 1.59% TUNISIA $28 0.27%
EGYPT $479 3.22% ISRAEL $20 269.00%
KUWAIT $449 1.96% USA $17 4.88%
CAMEROON $296 2.25% SUDAN $16 5.36%
ALBANIA $242 59.21% 30 Countries $28,443 1.35%
LIBYA $213 0.10% All Countries $28,541 1.35%
Table 9: Amount Undervalued – Top 30 Countries (USD millions)EU Import of Crude Oil, 2000-2010
26 LOST BILLIONS – TRANSFER PRICING IN THE EXTRACTIVE INDUSTRIES
4. ESTIMATES OF MISPRICED AMOUNT OF CRUDE OIL IMPORT BY E.U./U.S.
4.2.UndervaluedamountoftheU.S.ImportAnnualtrend
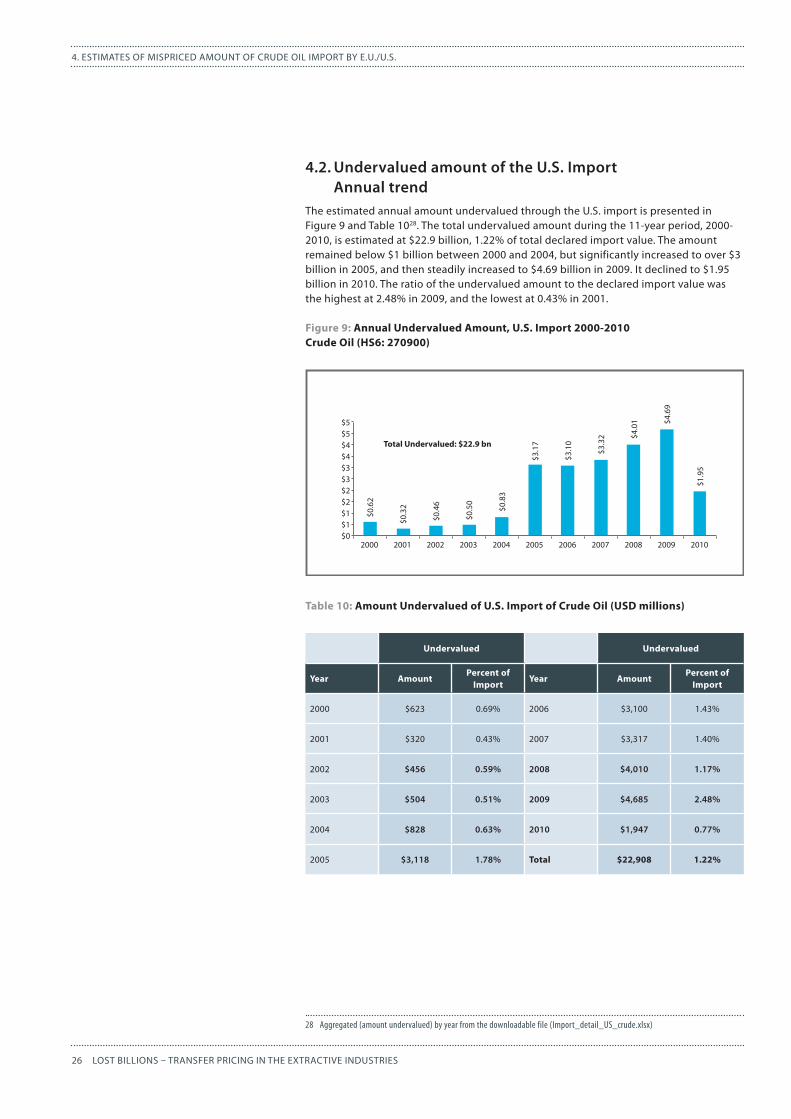
The estimated annual amount undervalued through the U.S. import is presented in Figure 9 and Table 1028. The total undervalued amount during the 11-year period, 2000-2010, is estimated at $22.9 billion, 1.22% of total declared import value. The amount remained below $1 billion between 2000 and 2004, but significantly increased to over $3 billion in 2005, and then steadily increased to $4.69 billion in 2009. It declined to $1.95 billion in 2010. The ratio of the undervalued amount to the declared import value was the highest at 2.48% in 2009, and the lowest at 0.43% in 2001.
Figure 9: Annual Undervalued Amount, U.S. Import 2000-2010Crude Oil (HS6: 270900)
Table 10: Amount Undervalued of U.S. Import of Crude Oil (USD millions)
28 Aggregated (amount undervalued) by year from the downloadable file (Import_detail_US_crude.xlsx)
Undervalued Undervalued
Year AmountPercent of
ImportYear Amount
Percent of Import
2000 $623 0.69% 2006 $3,100 1.43%
2001 $320 0.43% 2007 $3,317 1.40%
2002 $456 0.59% 2008 $4,010 1.17%
2003 $504 0.51% 2009 $4,685 2.48%
2004 $828 0.63% 2010 $1,947 0.77%
2005 $3,118 1.78% Total $22,908 1.22%
2000 2001 2002 2003 2004 2005 2006 2007 2008 2009 2010
$0.6
2
$0.3
2
$0.4
6
$0.5
0
$0.8
3
$3.1
7
$3.1
0
$3.3
2 $4.0
1 $4.6
9
$1.9
5
$0
$1$1
$2$2$3$3$4$4$5$5
Total Undervalued: $22.9 bn
27LOST BILLIONS – TRANSFER PRICING IN THE EXTRACTIVE INDUSTRIES
4. ESTIMATES OF MISPRICED AMOUNT OF CRUDE OIL IMPORT BY E.U./U.S.
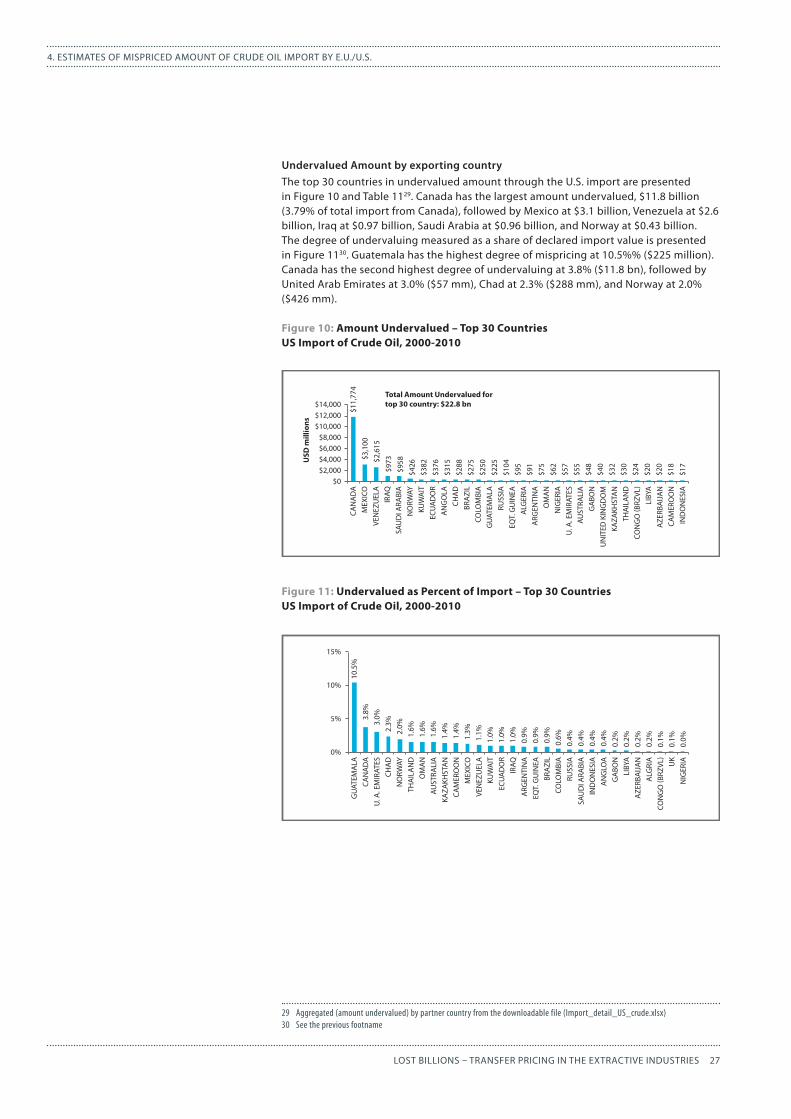
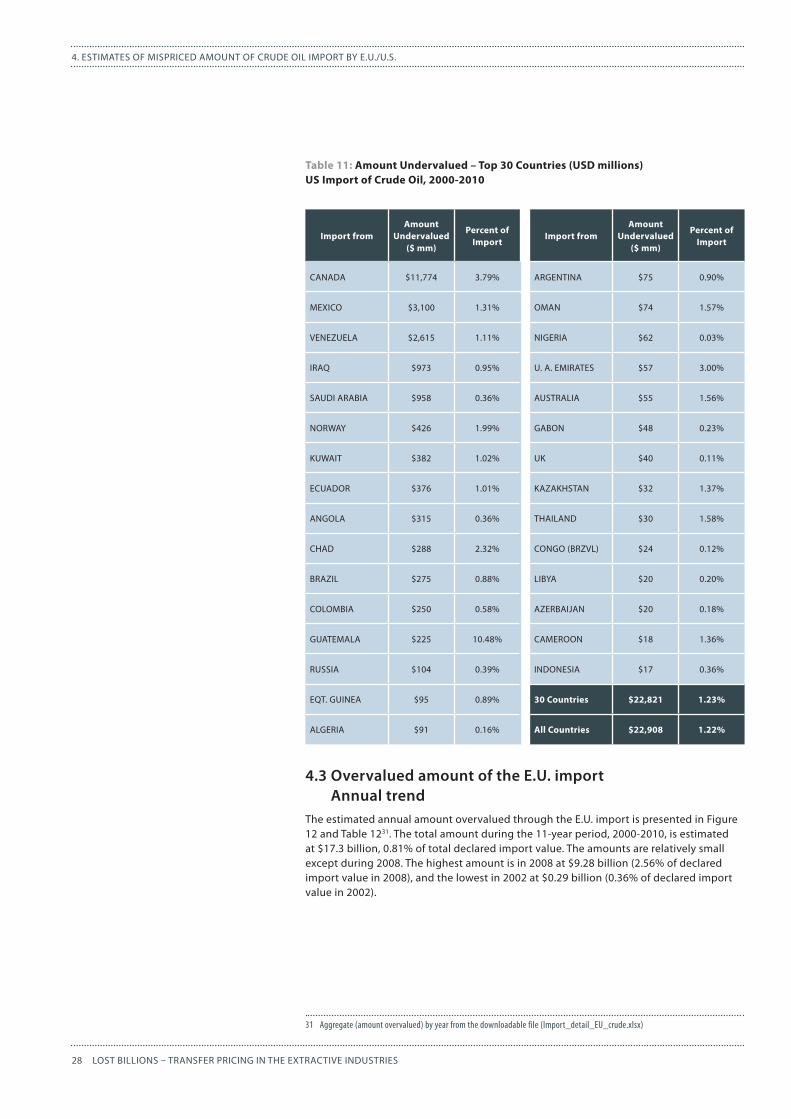
UndervaluedAmountbyexportingcountryThe top 30 countries in undervalued amount through the U.S. import are presented in Figure 10 and Table 1129. Canada has the largest amount undervalued, $11.8 billion (3.79% of total import from Canada), followed by Mexico at $3.1 billion, Venezuela at $2.6 billion, Iraq at $0.97 billion, Saudi Arabia at $0.96 billion, and Norway at $0.43 billion. The degree of undervaluing measured as a share of declared import value is presented in Figure 1130. Guatemala has the highest degree of mispricing at 10.5%% ($225 million). Canada has the second highest degree of undervaluing at 3.8% ($11.8 bn), followed by United Arab Emirates at 3.0% ($57 mm), Chad at 2.3% ($288 mm), and Norway at 2.0% ($426 mm).
Figure 10: Amount Undervalued – Top 30 CountriesUS Import of Crude Oil, 2000-2010
Figure 11: Undervalued as Percent of Import – Top 30 CountriesUS Import of Crude Oil, 2000-2010
29 Aggregated (amount undervalued) by partner country from the downloadable file (Import_detail_US_crude.xlsx)30 See the previous footname
CAN
AD
AM
EXIC
OVE
NEZ
UEL
AIR
AQSA
UD
I ARA
BIA
NO
RWAY
KUW
AIT
ECU
AD
OR
AN
GO
LACH
AD
BRA
ZIL
COLO
MBI
AG
UAT
EMA
LARU
SSIA
EQT.
GU
INEA
ALG
ERIA
ARG
ENTI
NA
OM
AN
NIG
ERIA
U. A
. EM
IRAT
ESAU
STRA
LIA
GA
BON
UN
ITED
KIN
GD
OM
KAZA
KHST
AN
THA
ILA
ND
CON
GO
(BRZ
VL)
AZE
RBA
IJA
NLI
BYA
CAM
ERO
ON
IND
ON
ESIA
$0$2,000$4,000$6,000$8,000
$10,000$12,000$14,000
Total Amount Undervalued fortop 30 country: $22.8 bn
USD
mill
ions
$11,
774
$3,1
00$2
,615
$973
$958
$426
$382
$376
$315
$288
$275
$250
$225
$104
$95
$91
$75
$62
$57
$55
$48
$40
$32
$30
$24
$20
$20
$18
$17
GU
ATEM
ALA
CAN
AD
AU
. A. E
MIR
ATES
CHA
DN
ORW
AYTH
AIL
AN
DO
MA
NAU
STRA
LIA
KAZA
KHST
AN
CAM
ERO
ON
MEX
ICO
VEN
EZU
ELA
KUW
AIT
ECU
AD
OR
IRAQ
ARG
ENTI
NA
EQT.
GU
INEA
BRA
ZIL
COLO
MBI
ARU
SSIA
SAU
DI A
RABI
AIN
DO
NES
IA
GA
BON
LIBY
AA
ZERB
AIJ
AN
ALG
RIA UK
CON
GO
(BRZ
VL)
NIG
ERIA
AN
GLO
A
0%
5%
10%
15%
10.5
%3.
8%3.
0%2.
3%2.
0%1.
6%1.
6%1.
6%1.
4%1.
4%1.
3%1.
1%1.
0%1.
0%1.
0%0.
9%0.
9%0.
9%0.
6%0.
4%0.
4%0.
4%0.
4%0.
2%0.
2%0.
2%0.
2%0.
1%0.
1%0.
0%
28 LOST BILLIONS – TRANSFER PRICING IN THE EXTRACTIVE INDUSTRIES
4. ESTIMATES OF MISPRICED AMOUNT OF CRUDE OIL IMPORT BY E.U./U.S.
Table 11: Amount Undervalued – Top 30 Countries (USD millions)US Import of Crude Oil, 2000-2010
4.3OvervaluedamountoftheE.U.importAnnualtrend
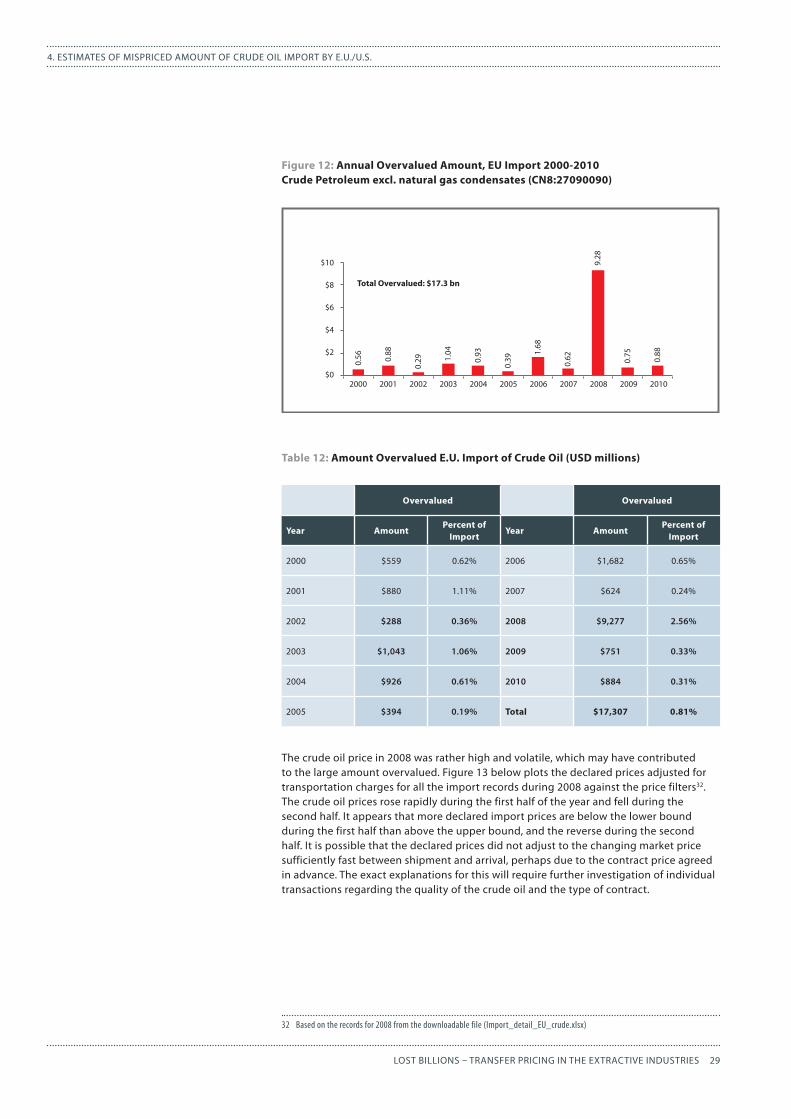
The estimated annual amount overvalued through the E.U. import is presented in Figure 12 and Table 1231. The total amount during the 11-year period, 2000-2010, is estimated at $17.3 billion, 0.81% of total declared import value. The amounts are relatively small except during 2008. The highest amount is in 2008 at $9.28 billion (2.56% of declared import value in 2008), and the lowest in 2002 at $0.29 billion (0.36% of declared import value in 2002).
31 Aggregate (amount overvalued) by year from the downloadable file (Import_detail_EU_crude.xlsx)
Import fromAmount
Undervalued ($ mm)
Percent of Import
Import fromAmount
Undervalued ($ mm)
Percent of Import
CANADA $11,774 3.79% ARGENTINA $75 0.90%
MEXICO $3,100 1.31% OMAN $74 1.57%
VENEZUELA $2,615 1.11% NIGERIA $62 0.03%
IRAQ $973 0.95% U. A. EMIRATES $57 3.00%
SAUDI ARABIA $958 0.36% AUSTRALIA $55 1.56%
NORWAY $426 1.99% GABON $48 0.23%
KUWAIT $382 1.02% UK $40 0.11%
ECUADOR $376 1.01% KAZAKHSTAN $32 1.37%
ANGOLA $315 0.36% THAILAND $30 1.58%
CHAD $288 2.32% CONGO (BRZVL) $24 0.12%
BRAZIL $275 0.88% LIBYA $20 0.20%
COLOMBIA $250 0.58% AZERBAIJAN $20 0.18%
GUATEMALA $225 10.48% CAMEROON $18 1.36%
RUSSIA $104 0.39% INDONESIA $17 0.36%
EQT. GUINEA $95 0.89% 30 Countries $22,821 1.23%
ALGERIA $91 0.16% All Countries $22,908 1.22%
29LOST BILLIONS – TRANSFER PRICING IN THE EXTRACTIVE INDUSTRIES
4. ESTIMATES OF MISPRICED AMOUNT OF CRUDE OIL IMPORT BY E.U./U.S.
Table 12: Amount Overvalued E.U. Import of Crude Oil (USD millions)
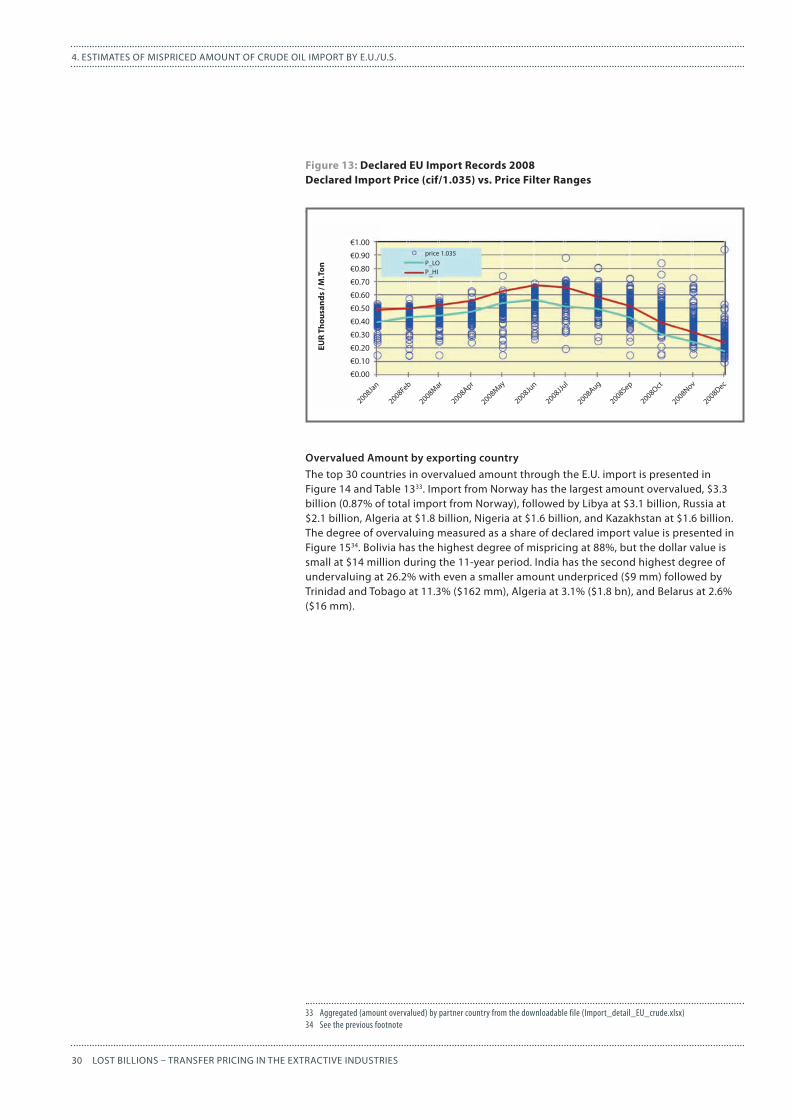
The crude oil price in 2008 was rather high and volatile, which may have contributed to the large amount overvalued. Figure 13 below plots the declared prices adjusted for transportation charges for all the import records during 2008 against the price filters32. The crude oil prices rose rapidly during the first half of the year and fell during the second half. It appears that more declared import prices are below the lower bound during the first half than above the upper bound, and the reverse during the second half. It is possible that the declared prices did not adjust to the changing market price sufficiently fast between shipment and arrival, perhaps due to the contract price agreed in advance. The exact explanations for this will require further investigation of individual transactions regarding the quality of the crude oil and the type of contract.
32 Based on the records for 2008 from the downloadable file (Import_detail_EU_crude.xlsx)
Figure 12: Annual Overvalued Amount, EU Import 2000-2010Crude Petroleum excl. natural gas condensates (CN8:27090090)
Overvalued Overvalued
Year AmountPercent of
ImportYear Amount
Percent of Import
2000 $559 0.62% 2006 $1,682 0.65%
2001 $880 1.11% 2007 $624 0.24%
2002 $288 0.36% 2008 $9,277 2.56%
2003 $1,043 1.06% 2009 $751 0.33%
2004 $926 0.61% 2010 $884 0.31%
2005 $394 0.19% Total $17,307 0.81%
2000 2001 2002 2003 2004 2005 2006 2007 2008 2009 2010
0.56 0.
88
0.29 1.
04
0.93
0.39
1.68
0.62 0.75
0.88
$0
$4
$2
$6
$8
$10
Total Overvalued: $17.3 bn
9.28
30 LOST BILLIONS – TRANSFER PRICING IN THE EXTRACTIVE INDUSTRIES
Figure 13: Declared EU Import Records 2008Declared Import Price (cif/1.035) vs. Price Filter Ranges
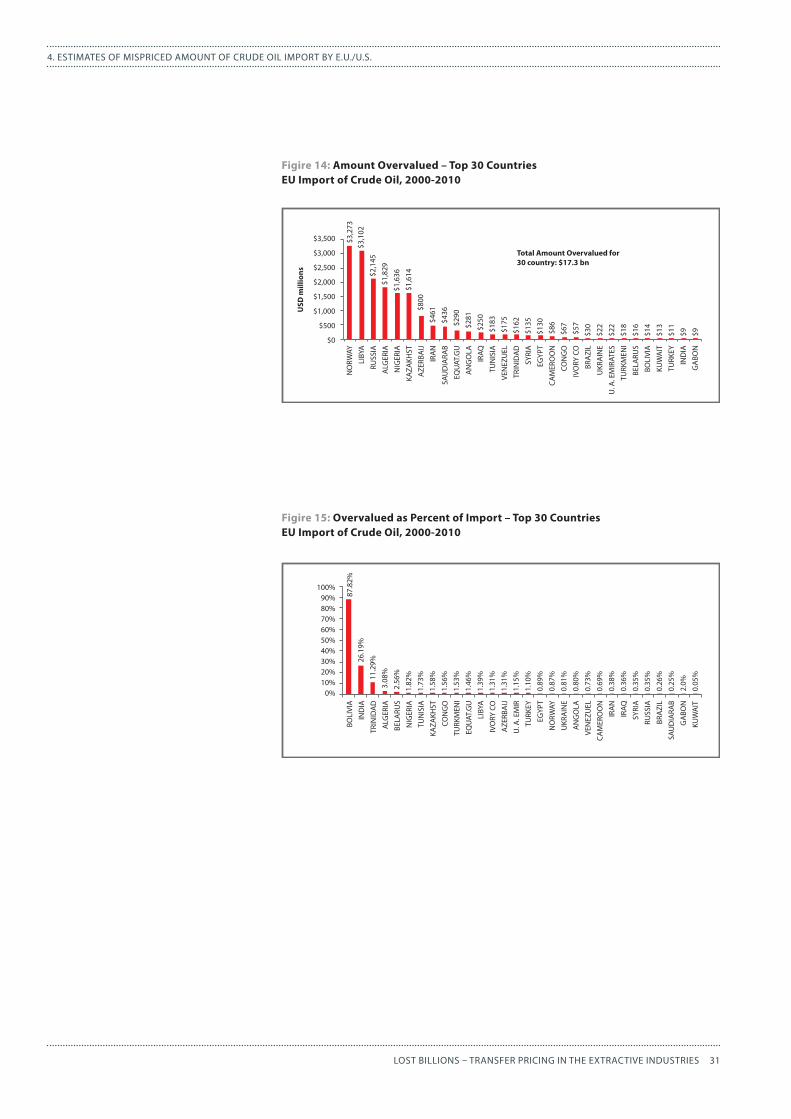
OvervaluedAmountbyexportingcountryThe top 30 countries in overvalued amount through the E.U. import is presented in Figure 14 and Table 1333. Import from Norway has the largest amount overvalued, $3.3 billion (0.87% of total import from Norway), followed by Libya at $3.1 billion, Russia at $2.1 billion, Algeria at $1.8 billion, Nigeria at $1.6 billion, and Kazakhstan at $1.6 billion. The degree of overvaluing measured as a share of declared import value is presented in Figure 1534. Bolivia has the highest degree of mispricing at 88%, but the dollar value is small at $14 million during the 11-year period. India has the second highest degree of undervaluing at 26.2% with even a smaller amount underpriced ($9 mm) followed by Trinidad and Tobago at 11.3% ($162 mm), Algeria at 3.1% ($1.8 bn), and Belarus at 2.6% ($16 mm).
33 Aggregated (amount overvalued) by partner country from the downloadable file (Import_detail_EU_crude.xlsx)34 See the previous footnote
4. ESTIMATES OF MISPRICED AMOUNT OF CRUDE OIL IMPORT BY E.U./U.S.
EUR
Thou
sand
s / M
.Ton
€0.30
€0.20
€0.10
€0.00
€0.40
€0.50
€0.60
€0.70
€0.80
€0.90
€1.00
2008Jan
2008Feb
2008Mar
2008Apr
2008May
2008Jun
2008JJul
2008Aug
2008Sep
2008Oct
2008Nov
2008Dec
price 1.035P_LOP_HI
31LOST BILLIONS – TRANSFER PRICING IN THE EXTRACTIVE INDUSTRIES
4. ESTIMATES OF MISPRICED AMOUNT OF CRUDE OIL IMPORT BY E.U./U.S.
EUR
Thou
sand
s / M
.Ton
€0.30
€0.20
€0.10
€0.00
€0.40
€0.50
€0.60
€0.70
€0.80
€0.90
€1.00
2008Jan
2008Feb
2008Mar
2008Apr
2008May
2008Jun
2008JJul
2008Aug
2008Sep
2008Oct
2008Nov
2008Dec
price 1.035P_LOP_HI
Figire 14: Amount Overvalued – Top 30 CountriesEU Import of Crude Oil, 2000-2010
Figire 15: Overvalued as Percent of Import – Top 30 CountriesEU Import of Crude Oil, 2000-2010
Total Amount Overvalued for30 country: $17.3 bn
USD
mill
ions
$0
$500
$1,000
$1,500
$2,000
$2,500
$3,000
$3,500 $3,2
73$3
,102
$2,1
45
$1,8
29
$1,6
36
$1,6
14
$800
$461
$436
$290
$281
$250
$183
$175
$162
$135
$130
$86
$67
$57
$30
$22
$22
$18
$16
$14
$13
$11
$9 $9
RUSS
IA
VEN
EZU
ELTR
INID
AD
IRA
NSA
UD
IARA
B
UKR
AIN
EU
. A. E
MIR
ATES
TURK
MEN
IBE
LARU
SBO
LIVI
A
IRAQ
SYRI
A
BRA
ZIL
NO
RWAY
AN
GO
LA
EGYP
T
KUW
AIT
TURK
EYIN
DIA
CAM
ERO
ON
LIBY
A
GA
BON
NIG
ERIA
EQU
AT.G
U
KAZA
KHST
AZE
RBA
IJ
ALG
ERIA
CON
GO
IVO
RY C
O
TUN
ISIA
0%10%20%30%40%50%60%70%80%90%
100%
87.8
2%26
.19%
11.2
9%
3.08
%
2.56
%
1.82
%
1.73
%
1.58
%
1.56
%
1.53
%
1.46
%
1.39
%
1.31
%
1.31
%
1.15
%
1.10
%
0.89
%
0.87
%
0.81
%
0.80
%
0.73
%
0.69
%
0.38
%
0.36
%
0.35
%
0.35
%
0.26
%
0.25
%
2.0%
0.05
%
RUSS
IA
VEN
EZU
EL
TRIN
IDA
D
IRA
N
SAU
DIA
RAB
UKR
AIN
E
U. A
. EM
IR
TURK
MEN
I
BELA
RUS
BOLI
VIA
IRAQ
SYRI
A
BRA
ZIL
NO
RWAY
AN
GO
LA
EGYP
T
KUW
AIT
TURK
EY
IND
IA
CAM
ERO
ON
LIBY
A
GA
BON
NIG
ERIA
EQU
AT.G
U
KAZA
KHST
AZE
RBA
IJ
ALG
ERIA
CON
GO
IVO
RY C
O
TUN
ISIA
32 LOST BILLIONS – TRANSFER PRICING IN THE EXTRACTIVE INDUSTRIES
4. ESTIMATES OF MISPRICED AMOUNT OF CRUDE OIL IMPORT BY E.U./U.S.
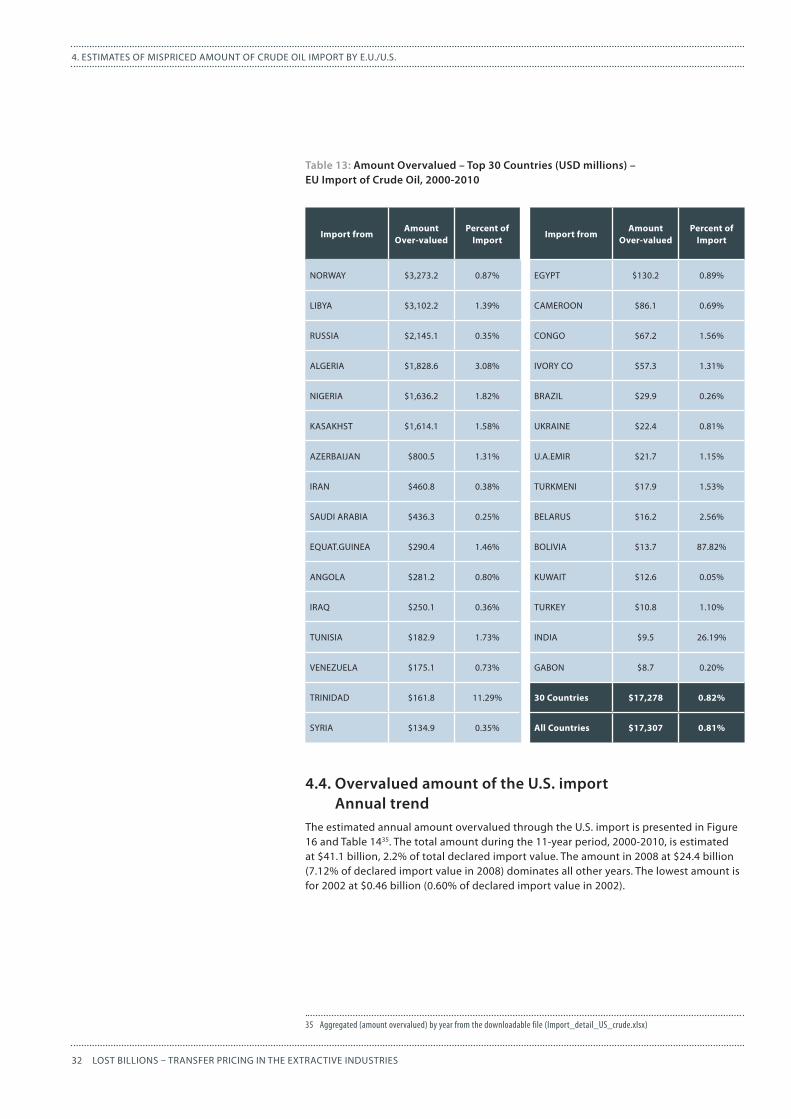
Table13:AmountOvervalued–Top30Countries(USDmillions)–EUImportofCrudeOil,2000-2010
4.4.OvervaluedamountoftheU.S.importAnnualtrend
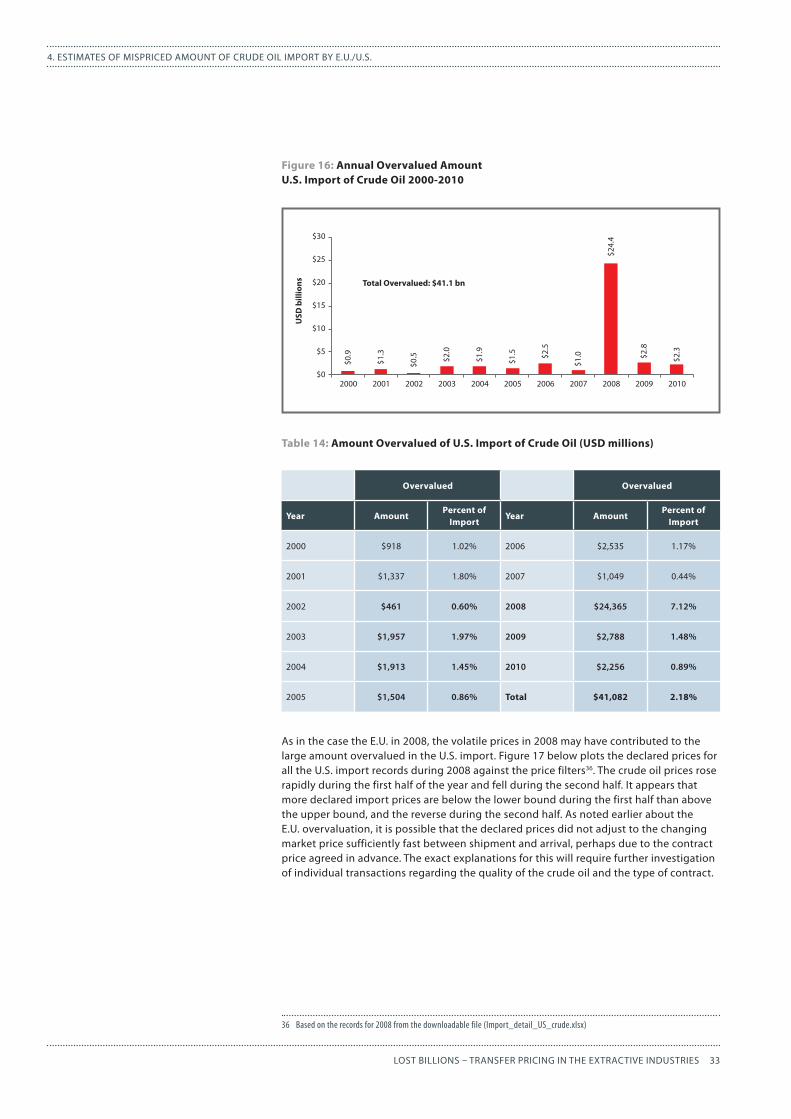
The estimated annual amount overvalued through the U.S. import is presented in Figure 16 and Table 1435. The total amount during the 11-year period, 2000-2010, is estimated at $41.1 billion, 2.2% of total declared import value. The amount in 2008 at $24.4 billion (7.12% of declared import value in 2008) dominates all other years. The lowest amount is for 2002 at $0.46 billion (0.60% of declared import value in 2002).
35 Aggregated (amount overvalued) by year from the downloadable file (Import_detail_US_crude.xlsx)
Import fromAmount
Over-valuedPercent of
ImportImport from
Amount Over-valued
Percent of Import
NORWAY $3,273.2 0.87% EGYPT $130.2 0.89%
LIBYA $3,102.2 1.39% CAMEROON $86.1 0.69%
RUSSIA $2,145.1 0.35% CONGO $67.2 1.56%
ALGERIA $1,828.6 3.08% IVORY CO $57.3 1.31%
NIGERIA $1,636.2 1.82% BRAZIL $29.9 0.26%
KASAKHST $1,614.1 1.58% UKRAINE $22.4 0.81%
AZERBAIJAN $800.5 1.31% U.A.EMIR $21.7 1.15%
IRAN $460.8 0.38% TURKMENI $17.9 1.53%
SAUDI ARABIA $436.3 0.25% BELARUS $16.2 2.56%
EQUAT.GUINEA $290.4 1.46% BOLIVIA $13.7 87.82%
ANGOLA $281.2 0.80% KUWAIT $12.6 0.05%
IRAQ $250.1 0.36% TURKEY $10.8 1.10%
TUNISIA $182.9 1.73% INDIA $9.5 26.19%
VENEZUELA $175.1 0.73% GABON $8.7 0.20%
TRINIDAD $161.8 11.29% 30 Countries $17,278 0.82%
SYRIA $134.9 0.35% All Countries $17,307 0.81%
33LOST BILLIONS – TRANSFER PRICING IN THE EXTRACTIVE INDUSTRIES
4. ESTIMATES OF MISPRICED AMOUNT OF CRUDE OIL IMPORT BY E.U./U.S.
Figure 16: Annual Overvalued Amount U.S. Import of Crude Oil 2000-2010
Table 14: Amount Overvalued of U.S. Import of Crude Oil (USD millions)
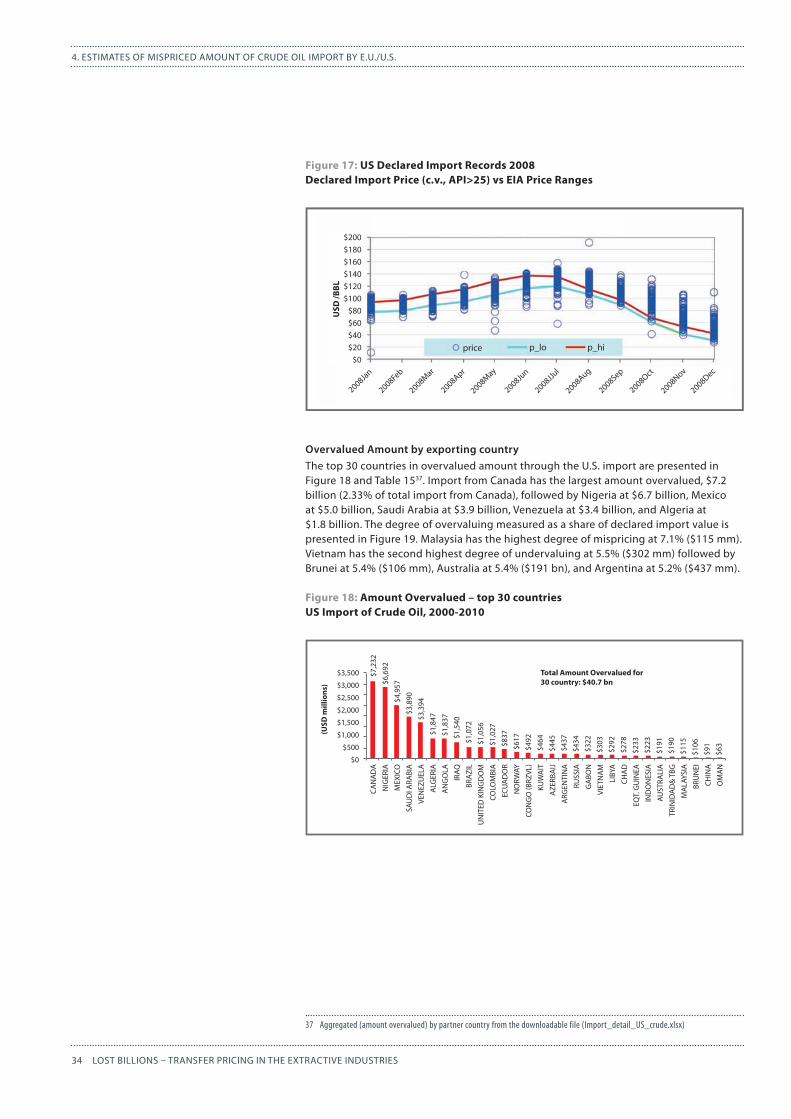
As in the case the E.U. in 2008, the volatile prices in 2008 may have contributed to the large amount overvalued in the U.S. import. Figure 17 below plots the declared prices for all the U.S. import records during 2008 against the price filters36. The crude oil prices rose rapidly during the first half of the year and fell during the second half. It appears that more declared import prices are below the lower bound during the first half than above the upper bound, and the reverse during the second half. As noted earlier about the E.U. overvaluation, it is possible that the declared prices did not adjust to the changing market price sufficiently fast between shipment and arrival, perhaps due to the contract price agreed in advance. The exact explanations for this will require further investigation of individual transactions regarding the quality of the crude oil and the type of contract.
36 Based on the records for 2008 from the downloadable file (Import_detail_US_crude.xlsx)
Overvalued Overvalued
Year AmountPercent of
ImportYear Amount
Percent of Import
2000 $918 1.02% 2006 $2,535 1.17%
2001 $1,337 1.80% 2007 $1,049 0.44%
2002 $461 0.60% 2008 $24,365 7.12%
2003 $1,957 1.97% 2009 $2,788 1.48%
2004 $1,913 1.45% 2010 $2,256 0.89%
2005 $1,504 0.86% Total $41,082 2.18%
2000 2001 2002 2003 2004 2005 2006 2007 2008 2009 2010
$0.9
$1.3
$0.5 $2
.0
$1.9
$1.5 $2
.5
$1.0 $2
.8
$2.3
$0
$10
$5
$15
$20
$25
$30
Total Overvalued: $41.1 bn
USD
bill
ions
$24.
4
34 LOST BILLIONS – TRANSFER PRICING IN THE EXTRACTIVE INDUSTRIES
4. ESTIMATES OF MISPRICED AMOUNT OF CRUDE OIL IMPORT BY E.U./U.S.
Figure 17: US Declared Import Records 2008Declared Import Price (c.v., API>25) vs EIA Price Ranges
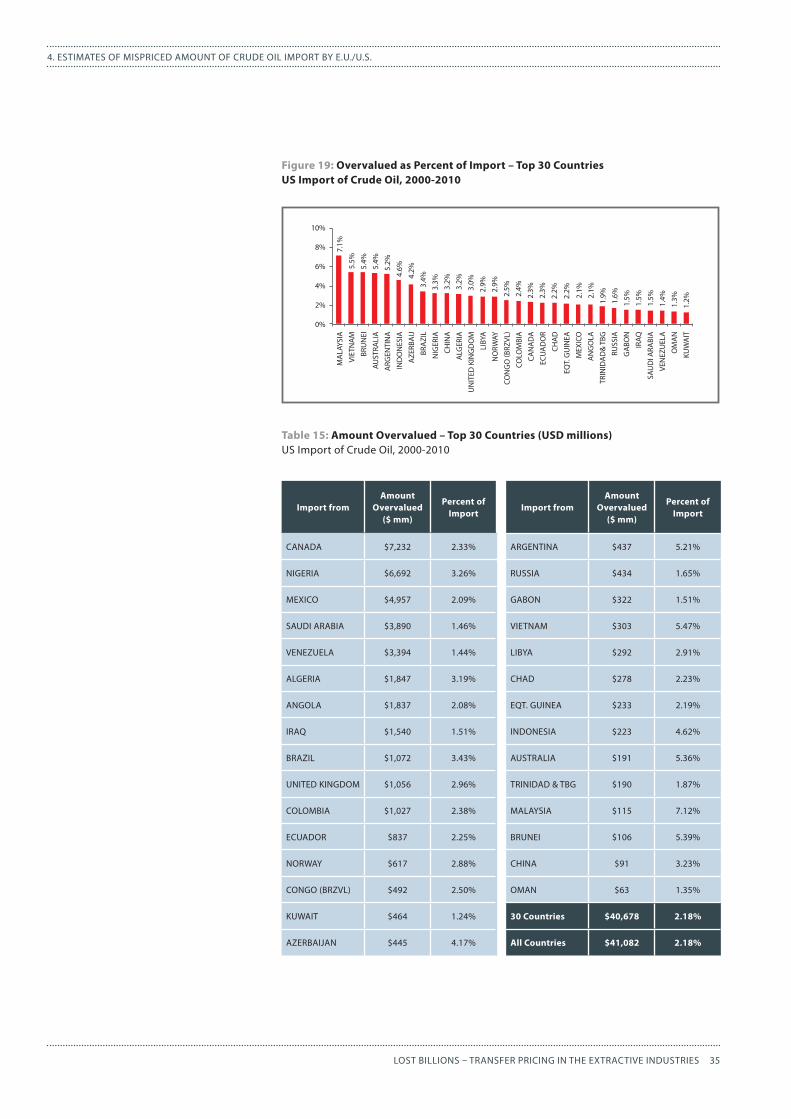
OvervaluedAmountbyexportingcountryThe top 30 countries in overvalued amount through the U.S. import are presented in Figure 18 and Table 1537. Import from Canada has the largest amount overvalued, $7.2 billion (2.33% of total import from Canada), followed by Nigeria at $6.7 billion, Mexico at $5.0 billion, Saudi Arabia at $3.9 billion, Venezuela at $3.4 billion, and Algeria at $1.8 billion. The degree of overvaluing measured as a share of declared import value is presented in Figure 19. Malaysia has the highest degree of mispricing at 7.1% ($115 mm). Vietnam has the second highest degree of undervaluing at 5.5% ($302 mm) followed by Brunei at 5.4% ($106 mm), Australia at 5.4% ($191 bn), and Argentina at 5.2% ($437 mm).
Figure 18: Amount Overvalued – top 30 countriesUS Import of Crude Oil, 2000-2010
37 Aggregated (amount overvalued) by partner country from the downloadable file (Import_detail_US_crude.xlsx)
Total Amount Overvalued for30 country: $40.7 bn
(USD
mill
ions
)
$0
$500
$1,000
$1,500
$2,000
$2,500
$3,000
$3,500 $7,2
32$6
,692
$4,9
57$3
,890
$3,3
94$1
,847
$1,8
37$1
,540
$1,0
72$1
,056
$1,0
27$8
37$6
17$4
92$4
64$4
45$4
37$4
34$3
22$3
03$2
92$2
78$2
33$2
23$1
91$1
90$1
15$1
06$9
1$6
3
RUSS
IA
SAU
DI A
RABI
A
VEN
EZU
ELA
IRAQ
BRA
ZIL
UN
ITED
KIN
GD
OM
COLO
MBI
A
ECU
AD
OR
NO
RWAY
CON
GO
(BRZ
VL)
CAN
AD
A
AN
GO
LA
KUW
AIT
LIBY
A
CHA
D
GA
BON
VIET
NA
M
NIG
ERIA
MEX
ICO
EQT.
GU
INEA
IND
ON
ESIA
AUST
RALI
A
TRIN
IDA
D&
TBG
MA
LAYS
IA
CHIN
A
BRU
NEI
OM
AN
AZE
RBA
IJ
ARG
ENTI
NA
ALG
ERIA
0%
2%
4%
6%
8%
10%
7.1%
5.5%
5.4%
5.4%
5.2%
4.6%
4.2%
3.4%
3.3%
3.2%
3.2%
3.0%
2.9%
2.9%
2.5%
2.4%
2.3%
2.3%
2.2%
2.2%
2.1%
2.1%
1.9%
1.6%
1.5%
1.5%
1.5%
1.4%
1.3%
1.2%
RUSS
IA
SAU
DI A
RABI
A
VEN
EZU
ELA
IRAQ
BRA
ZIL
UN
ITED
KIN
GD
OM
COLO
MBI
A
ECU
AD
OR
NO
RWAY
CON
GO
(BRZ
VL)
CAN
AD
A
AN
GO
LA
KUW
AIT
LIBY
A
CHA
D
GA
BON
VIET
NA
M
NIG
ERIA
MEX
ICO
EQT.
GU
INEA
IND
ON
ESIA
AUST
RALI
A
TRIN
IDA
D&
TBG
MA
LAYS
IA
CHIN
A
BRU
NEI
OM
AN
AZE
RBA
IJ
ARG
ENTI
NA
ALG
ERIA
!
"#!"$#!"%#!"&#!"'#!
"(##!"($#!"(%#!"(&#!"('#!"$##!
$##')*+!
$##',-.!
$##'/*0!
$##'120!
$##'/*3!
$##')4+!
$##')45!
$##'146!
$##'7-2!
$##'89:!
$##';<=!
$##'>-9!
!"#$%
%&'
()*+,-'./0'!"'#-123,-4'5678,9':-18,4;'<==>'#-123,-4'5678,9'?,)1-'@1ABAC'D?5E<FG'B;'H5D'?,)1-':3I*-;'
20?9-! 2@5<! 2@A?!
USD
/BBL
$60$40$20
$0
$80$100$120$140$160$180$200
2008Jan
2008Feb
2008Mar
2008Apr
2008May
2008Jun
2008JJul
2008Aug
2008Sep
2008Oct
2008Nov
2008Dec
price p_lo p_hi
35LOST BILLIONS – TRANSFER PRICING IN THE EXTRACTIVE INDUSTRIES
4. ESTIMATES OF MISPRICED AMOUNT OF CRUDE OIL IMPORT BY E.U./U.S.
Figure 19: Overvalued as Percent of Import – Top 30 CountriesUS Import of Crude Oil, 2000-2010
Table 15: Amount Overvalued – Top 30 Countries (USD millions)US Import of Crude Oil, 2000-2010
Import fromAmount
Overvalued ($ mm)
Percent of Import
Import fromAmount
Overvalued ($ mm)
Percent of Import
CANADA $7,232 2.33% ARGENTINA $437 5.21%
NIGERIA $6,692 3.26% RUSSIA $434 1.65%
MEXICO $4,957 2.09% GABON $322 1.51%
SAUDI ARABIA $3,890 1.46% VIETNAM $303 5.47%
VENEZUELA $3,394 1.44% LIBYA $292 2.91%
ALGERIA $1,847 3.19% CHAD $278 2.23%
ANGOLA $1,837 2.08% EQT. GUINEA $233 2.19%
IRAQ $1,540 1.51% INDONESIA $223 4.62%
BRAZIL $1,072 3.43% AUSTRALIA $191 5.36%
UNITED KINGDOM $1,056 2.96% TRINIDAD & TBG $190 1.87%
COLOMBIA $1,027 2.38% MALAYSIA $115 7.12%
ECUADOR $837 2.25% BRUNEI $106 5.39%
NORWAY $617 2.88% CHINA $91 3.23%
CONGO (BRZVL) $492 2.50% OMAN $63 1.35%
KUWAIT $464 1.24% 30 Countries $40,678 2.18%
AZERBAIJAN $445 4.17% All Countries $41,082 2.18%
0%
2%
4%
6%
8%
10%
7.1%
5.5%
5.4%
5.4%
5.2%
4.6%
4.2%
3.4%
3.3%
3.2%
3.2%
3.0%
2.9%
2.9%
2.5%
2.4%
2.3%
2.3%
2.2%
2.2%
2.1%
2.1%
1.9%
1.6%
1.5%
1.5%
1.5%
1.4%
1.3%
1.2%
RUSS
IA
SAU
DI A
RABI
A
VEN
EZU
ELA
IRAQ
BRA
ZIL
UN
ITED
KIN
GD
OM
COLO
MBI
A
ECU
AD
OR
NO
RWAY
CON
GO
(BRZ
VL)
CAN
AD
A
AN
GO
LA
KUW
AIT
LIBY
A
CHA
D
GA
BON
VIET
NA
M
NIG
ERIA
MEX
ICO
EQT.
GU
INEA
IND
ON
ESIA
AUST
RALI
A
TRIN
IDA
D&
TBG
MA
LAYS
IA
CHIN
A
BRU
NEI
OM
AN
AZE
RBA
IJ
ARG
ENTI
NA
ALG
ERIA
36 LOST BILLIONS – TRANSFER PRICING IN THE EXTRACTIVE INDUSTRIES
4. ESTIMATES OF MISPRICED AMOUNT OF CRUDE OIL IMPORT BY E.U./U.S.
4.5.Taxhavencountriesandre-invoicingIt turns out that the tax haven countries are mostly absent in the mispricing analysis of the import data declared in the E.U. and the U.S. Table 16 shows that only 17 records from a total of 16,360 E.U. import records are from tax haven countries, and 15 of the 17 import records have no or negligible mispricing. Only two records have significant amount of undervaluation: an import from Cook Islands into Sweden in 2002 shows an undervalued amount of € 3.6 million and an import from St. Lucia into Spain in 2009 shows an undervalued amount of € 7.7 million. The U.S. import data shows only one import record from St. Lucia, but without any mispricing.
When a non-oil producing tax haven country exports crude oil, the tax haven country acts as an intermediate country to facilitate re-invoicing of crude oil by importing crude oil from an oil producing country and re-exporting the crude oil to the country of ultimate destination. The published import data shows only the country of origin except when the country of origin is unknown. Therefore it is not surprising that the tax haven countries are mostly invisible in the import data since they do not likely produce crude oil.
If a re-invoicing scheme is such that the underpricing is embedded on the side of the import into the tax haven country from the oil producing country, the export from the tax haven country to the U.S. or an E.U. country may show no mispricing, which may explain why most of import from tax haven countries in Table 16 have no or negligible mispricing except the imports from Cooks Island and St. Lucia38.
38 Extracted records for tax-haven countries from the downloadable file (Import_detail_EU_crude.xlsx)
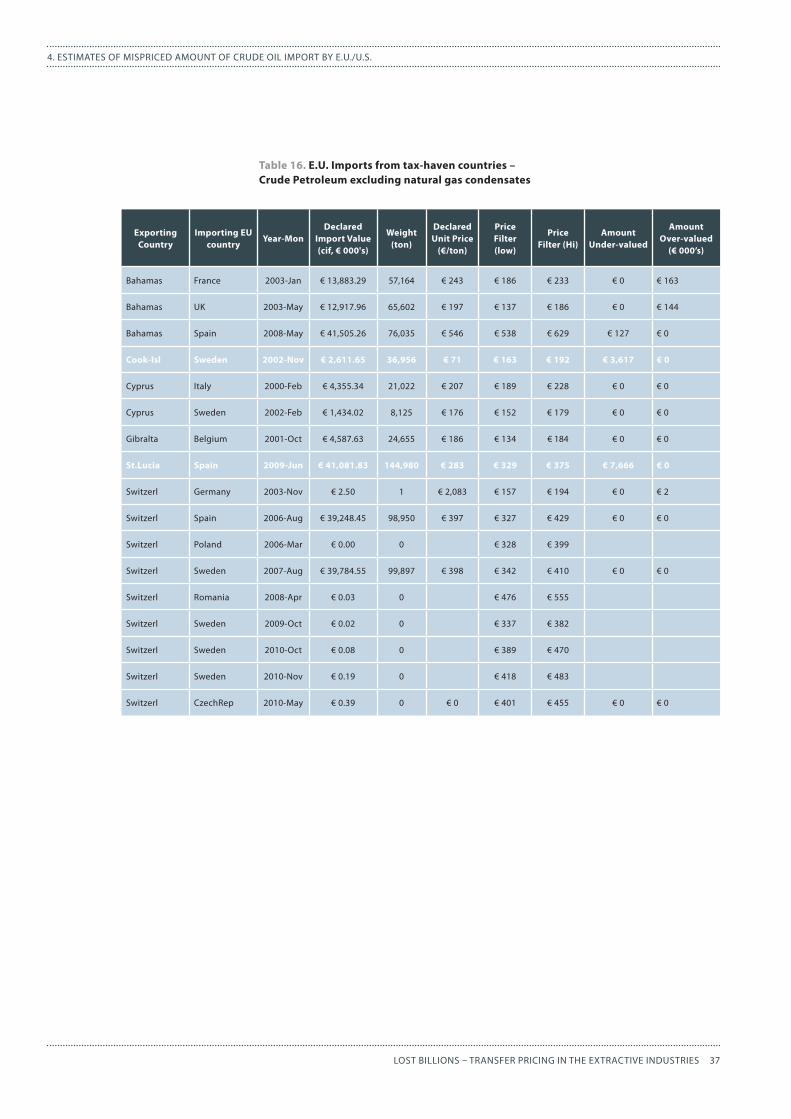
37LOST BILLIONS – TRANSFER PRICING IN THE EXTRACTIVE INDUSTRIES
4. ESTIMATES OF MISPRICED AMOUNT OF CRUDE OIL IMPORT BY E.U./U.S.
Table 16. E.U. Imports from tax-haven countries – Crude Petroleum excluding natural gas condensates
Exporting Country
Importing EU country
Year-MonDeclared
Import Value (cif, € 000's)
Weight (ton)
Declared Unit Price
(€/ton)
Price Filter (low)
Price Filter (Hi)
Amount Under-valued
Amount Over-valued
(€ 000’s)
Bahamas France 2003-Jan € 13,883.29 57,164 € 243 € 186 € 233 € 0 € 163
Bahamas UK 2003-May € 12,917.96 65,602 € 197 € 137 € 186 € 0 € 144
Bahamas Spain 2008-May € 41,505.26 76,035 € 546 € 538 € 629 € 127 € 0
Cook-Isl Sweden 2002-Nov € 2,611.65 36,956 € 71 € 163 € 192 € 3,617 € 0
Cyprus Italy 2000-Feb € 4,355.34 21,022 € 207 € 189 € 228 € 0 € 0
Cyprus Sweden 2002-Feb € 1,434.02 8,125 € 176 € 152 € 179 € 0 € 0
Gibralta Belgium 2001-Oct € 4,587.63 24,655 € 186 € 134 € 184 € 0 € 0
St.Lucia Spain 2009-Jun € 41,081.83 144,980 € 283 € 329 € 375 € 7,666 € 0
Switzerl Germany 2003-Nov € 2.50 1 € 2,083 € 157 € 194 € 0 € 2
Switzerl Spain 2006-Aug € 39,248.45 98,950 € 397 € 327 € 429 € 0 € 0
Switzerl Poland 2006-Mar € 0.00 0 € 328 € 399
Switzerl Sweden 2007-Aug € 39,784.55 99,897 € 398 € 342 € 410 € 0 € 0
Switzerl Romania 2008-Apr € 0.03 0 € 476 € 555
Switzerl Sweden 2009-Oct € 0.02 0 € 337 € 382
Switzerl Sweden 2010-Oct € 0.08 0 € 389 € 470
Switzerl Sweden 2010-Nov € 0.19 0 € 418 € 483
Switzerl CzechRep 2010-May € 0.39 0 € 0 € 401 € 455 € 0 € 0
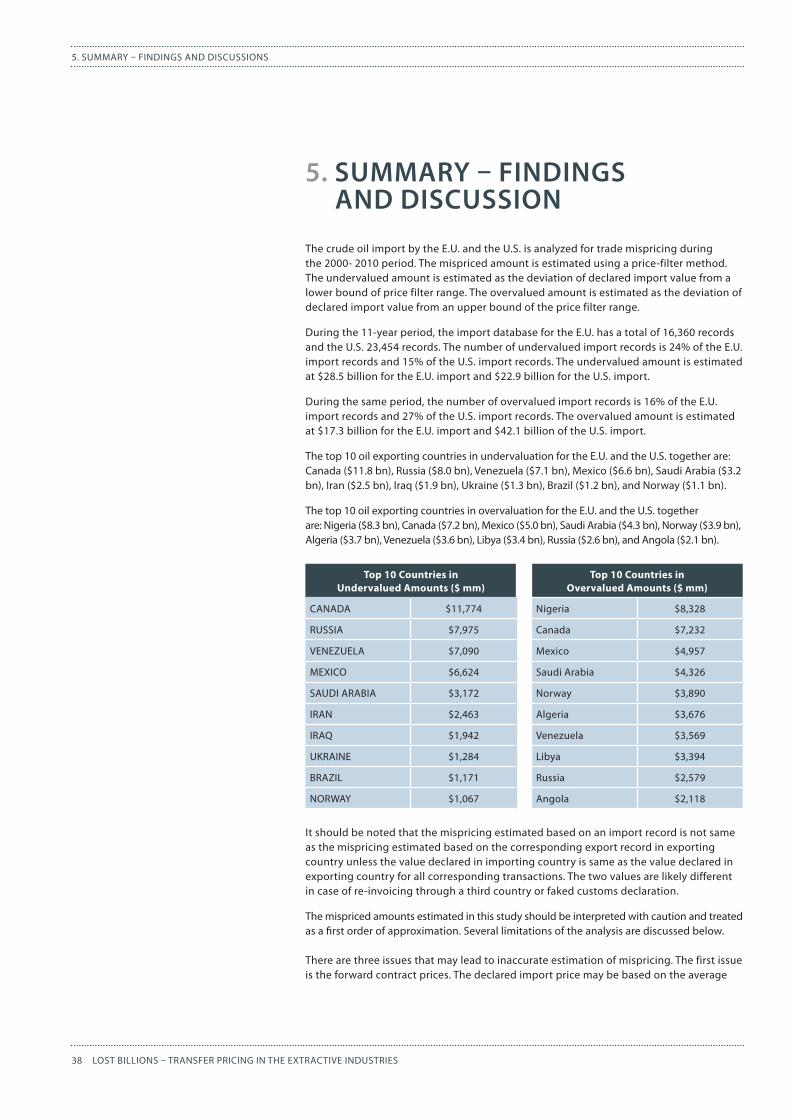
38 LOST BILLIONS – TRANSFER PRICING IN THE EXTRACTIVE INDUSTRIES
5. SUMMARY – FINDINGS AND DISCUSSIONS
5.SUMMARY–FINDINGSANDDISCUSSION
The crude oil import by the E.U. and the U.S. is analyzed for trade mispricing during the 2000- 2010 period. The mispriced amount is estimated using a price-filter method. The undervalued amount is estimated as the deviation of declared import value from a lower bound of price filter range. The overvalued amount is estimated as the deviation of declared import value from an upper bound of the price filter range.
During the 11-year period, the import database for the E.U. has a total of 16,360 records and the U.S. 23,454 records. The number of undervalued import records is 24% of the E.U. import records and 15% of the U.S. import records. The undervalued amount is estimated at $28.5 billion for the E.U. import and $22.9 billion for the U.S. import.
During the same period, the number of overvalued import records is 16% of the E.U. import records and 27% of the U.S. import records. The overvalued amount is estimated at $17.3 billion for the E.U. import and $42.1 billion of the U.S. import.
The top 10 oil exporting countries in undervaluation for the E.U. and the U.S. together are: Canada ($11.8 bn), Russia ($8.0 bn), Venezuela ($7.1 bn), Mexico ($6.6 bn), Saudi Arabia ($3.2 bn), Iran ($2.5 bn), Iraq ($1.9 bn), Ukraine ($1.3 bn), Brazil ($1.2 bn), and Norway ($1.1 bn).
The top 10 oil exporting countries in overvaluation for the E.U. and the U.S. together are: Nigeria ($8.3 bn), Canada ($7.2 bn), Mexico ($5.0 bn), Saudi Arabia ($4.3 bn), Norway ($3.9 bn), Algeria ($3.7 bn), Venezuela ($3.6 bn), Libya ($3.4 bn), Russia ($2.6 bn), and Angola ($2.1 bn).
It should be noted that the mispricing estimated based on an import record is not same as the mispricing estimated based on the corresponding export record in exporting country unless the value declared in importing country is same as the value declared in exporting country for all corresponding transactions. The two values are likely different in case of re-invoicing through a third country or faked customs declaration.
The mispriced amounts estimated in this study should be interpreted with caution and treated as a first order of approximation. Several limitations of the analysis are discussed below.
There are three issues that may lead to inaccurate estimation of mispricing. The first issue is the forward contract prices. The declared import price may be based on the average
Top 10 Countries in Undervalued Amounts ($ mm)
Top 10 Countries in Overvalued Amounts ($ mm)
CANADA $11,774 Nigeria $8,328
RUSSIA $7,975 Canada $7,232
VENEZUELA $7,090 Mexico $4,957
MEXICO $6,624 Saudi Arabia $4,326
SAUDI ARABIA $3,172 Norway $3,890
IRAN $2,463 Algeria $3,676
IRAQ $1,942 Venezuela $3,569
UKRAINE $1,284 Libya $3,394
BRAZIL $1,171 Russia $2,579
NORWAY $1,067 Angola $2,118
39LOST BILLIONS – TRANSFER PRICING IN THE EXTRACTIVE INDUSTRIES
5. SUMMARY – FINDINGS AND DISCUSSIONS
spot price at delivery or on forward price set in advance. The forward price set in advance will naturally be out of sync with the spot price at delivery and therefore the mispriced amount estimated for an import record with forward price will be misleading. More than half of all overpriced amount estimated for the E.U. and the U.S. was during 2008 when the crude oil price was highly volatile. It is conceivable that the observed overvaluations may be due to forward contracts. There is no information whether or not the declared price is based on a forward contract. The Customs authorities may be able to identify the nature of the contract by examining import documents of each transaction.
The second issue is conversion of crude oil prices from weight (metric tons) to volume (barrels) for the E.U.’s import record. Inaccuracy is introduced to a certain degree because the relationship between weight and volume varies depending on the API gravity, but the API gravity data is not available from the E.U. import data, although the import declaration form should indicate the API gravity. The conversion factors are adopted in this study to create the price filter range as wide as practically possible so the estimated mispricing may not be overstated. Nevertheless the possibility of erroneous estimations exists.
The third issue is the exchange rate between EUR and USD. While the crude oil spot prices are in terms of USD per barrel, the E.U. import values are in EURs. The exchange rates used in this study are the monthly averages, but the spot exchange rate on the actual settlement date will likely be different from the monthly average. The import declaration forms should have the actual date of import, but the import records in the E.U. database indicate only the month of import, not the date.
These three issues can be addressed and corrected if the transaction level data is available.
Two particular characteristics of the import data used in this study lead to underestimating the degree of mispricing: grouping multiple transactions into a record and classifying crude oil with a range of API gravity into one category. When an import record aggregates more than one transaction, the estimated mispricing for the record will be calculated based on the average price of all the transactions aggregated in the record, which will underestimate the mispricing except when all the included transactions are mispriced in the same direction, i.e., all undervalued or all overvalued. This is because the grouping eliminates the within-group dispersion.
The fact that the crude oil classification does not distinguish the quality of crude oil makes it impossible to compare the declared price against the fair market price of comparable quality. The approach adopted in this study is to build a price filter with an upper bound and a lower bound to cover all the qualities included in the classification and estimate mispricing of each record as the deviation of declared price from the upper or lower bound of the price filter range. This method underestimates the amount of mispricing in two ways. First, the amount mispriced measured from the upper or lower bound will be smaller than amount measured from the actual arm’s length price for the crude oil with the same API gravity. Secondly, mispriced trades with declared price within the price filter range will not be detected as mispriced. In particular, transactions in large quantity with declared prices different from arm’s length prices only by a small margin but within in the price filter range will not be detected, although the total mispriced amounts may be substantial.
Again, these issues can be addressed and corrected provided that the transaction level data is available.
Given the limitations mostly due to data aggregation and heterogeneity of the crude oil classification,the mispriced amounts estimated in this report should be treated, with caution, as approximations that require verification by the customs authority using more detailed import records.
40 LOST BILLIONS – TRANSFER PRICING IN THE EXTRACTIVE INDUSTRIES
REFERENCES
REFERENCES
Almounsor, Abdullah (2005), ‘A Development Comparative Approach to Capital Flight: The Case of the Middle East and North Africa, 1970-2002,’ in Gerald Epstein, ed., Capital Flight and Capital Controls in Developing Countries, Edward Elgar, Spring 2005.
Baker, Raymond, (2005). Capitalism’s Achilles Heel: Dirty Money and How to Renew the Free-Market System. John Wiley and Sons
Bhagwati, Jagdish (1964). On the Under Invoicing of Imports. Bulletin of the Oxford University, Institute of Economics and Statistics 26: 389-397.
Bhagwati, Jagdish (1974). ‘Fiscal Policies, The Faking Foreign Trade Declarations, and the Balance of Payments’ in 1974 J. N. Bhagwati, ed., Illegal Transactions in International Trade. North Holland: Amsterdam.
Bhagwati, Jagdish, Ann Krueger, and Chaiyawat Wibulswasdi (1974). Capital Flight from LDCs: A Statistical Analysis. 1974 J. N. Bhagwati, ed., Illegal Transactions in International Trade. North Holland: Amsterdam.
European Commission (2008). Compendium of Customs Valuation – Texts of the Customs Code Committee, Customs Valuation Section.
FATF Report (2006). Trade Based Money Laundering, Financial Action Task Force, 23 June 2006
Gulati, S. K. (1987). A Note on Trade Misinvoicing. In Donald R. Lessard and John Williamson, eds. Capital Flight and Third World Debt. Institute for International Economics: Washington, DC. 68-78.
Hermes, Niels, Robert Lensink, and Victor Murinde (2003). ‘Capital flight: the key issues’ in Mullineux, Andrew, and Victor Murinde eds. Handbook of International Banking, Edward Edgar Publishing, Cheltenham, UK
ICF International (2007). Analysis of the economic impact of energy product prices on competitiveness of the energy and manufacturing sectors in the EU: comparison between EU and U.S. – FINAL July 2007. Submitted to: European Commission, DG Transport and Energy, Brussels, Belgium.
Madinger, John (2006). Money Laundering: A Guide for Criminal Investigators, CRC Press
Ndikumana, Léonce and James K. Boyce (1998), ‘Congo’s Odious Debt: External Borrowing and Capital Flight in Zaire,’ Development and Change, 29, pp. 195-217.
OECD (2001), Behind the Corporate Veil: Using Corporate Entities for Illicit Purposes, OECD Publishing
Purvin and Gertz, Inc. (2008). Study on Oil Refining and Oil Markets. Prepared for European Commission
Sikka, P. and H. Willmott. 2010. The Dark Side of Transfer Pricing: Its Role in Tax Avoidance and Wealth Retentiveness. Critical Perspectives on Accounting 21: 342-356.
U.S. Customs and Border Protection (2006). What Every Member of the Trade Community Should Know About Customs Value
Zhu, Andong, Li, Chunxiang, and Epstein, Gerald (2005). ‘Capital Flight from China 1982 – 2001’ 2005 Epstein, G. ed., Capital Flight and Capital Controls in Developing Countries, Edward Edgar Publishing
41LOST BILLIONS – TRANSFER PRICING IN THE EXTRACTIVE INDUSTRIES
APPENDIX I: MISPRICED AMOUNT CALCULATION
APPENDIXI:MISPRICEDAMOUNTCALCULATION
The mispriced amounts of crude oil imported by the U.S. and E.U. are estimated using the price filter trade analysis method as follows:
Define:
P(hi,t)=the upper bound of the arm’s length price range in time period t (USD /BBL)
P(lo,t)=the lower bound of the arm’s length price range in time period t
VM(i,t)=declared value of the ith import in time period t, import data from oil importing countries (E.U. and U.S.)
Q(i,t)=declared quantity (BBLs) of the ith import in time period t, import data from oil importing countries (E.U. and U.S.)
The amount undervalued of the ith import record in time period t is defined as:
VM_un(i,t)=MAX[0,{P(lo,t)*Q(i,t)–VM(i,t)}] (1a)
The total amount undervalued for all import records in time period t is then obtained by adding for all import records:
∑i=1,nVM_un(i,t)=∑i=1,nMAX[0,{P(lo,t)*Q(i,t)–VM(i,t)}] (1b)
Similarly, the amount overvalued of the ith import record in time period t is defined as:
VM_ov(i,t)=MAX[0,{VM(i,t)-P(hi,t)*Q(i,t)}] (2a)
The total amount overvalued for all import records in time period t is then obtained by adding for all import records:
∑i=1,nVM_ov(i,t)=∑i=1,nMAX[0,{VM(i,t)-P(hi,t)*Q(i,t)}] (2b)
The mispriced amounts for crude oil imports by E.U. and U.S. are estimated using equations (1) and (2) based on the P-F method directly applied to the import records of the U.S. and the E.U.
42 LOST BILLIONS – TRANSFER PRICING IN THE EXTRACTIVE INDUSTRIES
APPENDIX II: LIST OF DATA FILES DOWNLOADABLE
APPENDIXII:LISTOFDATAFILESDOWNLOADABLE
1. Import_detail_EU_crude.xlsx: Detailed records of EU import of PETROLEUM OILS AND OILS OBTAINED FROM BITUMINOUS MINERALS, CRUDE (EXCL. NATURAL GAS CONDENSATES), 2000-2010 (NC8=27090090). EUROSTAT External Trade Data, http://epp.eurostat.ec.europa.eu/portal/page/portal/external_trade/data/database
2. Import_detail_EU_n.gas.xlsx: Detailed records of EU import of NATURAL GAS CONDENSATES, 2000-2010 (NC8=27090010). EUROSTAT External Trade Data, http://epp.eurostat.ec.europa.eu/portal/page/portal/external_trade/data/database
3. Import_detail_US_crude.xlsx: Detailed records of US Import of Crude Petroleum, 2000 – 2010: two HS10 codes for API >25 (HS10: 2709002000 & 2709002090) and HS10 code for API<25 (HS10: 2709001000) from the U.S. Imports of Merchandise. U.S. Census Bureau, U.S. Foreign Trade Data Downloads, http://www.census.gov/foreign-trade/download/dvd/index.html
4. crude_detl_cif_factor_data.xlsx: Insurance-freight cost of crude oil (USD per bbl, monthly average) from the U.S. Imports of Merchandise, U.S. Census Bureau, U.S. Foreign Trade Data Downloads, http://www.census.gov/foreign-trade/download/dvd/index.html
5. PET_PRI_IMC3_K_M_fob-by-api.xlsx: F.O.B. Costs of Imported Crude Oil by API Gravity, U.S. Energy Information Administration
6. FX_USD_EUR.xlsx: Euro-USD exchange rates – monthly data from Euro/ECU exchange rates – Monthly data, EUROSTAT, http://epp.eurostat.ec.europa.eu/portal/page/portal/exchange_rates/data/database

Publish What You Pay Norway (PWYP Norway) is the Norwegian chapter of the international PWYP network. The network organise and mobilise over 650 organisations from over 50 countries. We advocate for standardised country-by-country reporting and increased transparency and financial integrity in the extractive industries. The secrecy surrounding trade with natural resources harms those the resources are managed on behalf of. 2/3 of the world’s poorest people live in resource rich countries. It is urgent that citizens, government institutions, politicians, researchers, investors and other users of financial information get access to standardised valuable information so that societies interest can be upheld and governments and companies can be held to account. It is urgent that the economic potential generated from developing countries trade with non-renewable and finite resources is translated into a sustainable development and common good. For more information, please see www.publishwhatyoupay.no
Publish What You Pay Norway Brugata 1 0186 Oslo Norway
[email protected] www.publishwhatyoupay.no
ISBN 978-82-93212-04-1
© Publish What You Pay Norway 2012