Embed Size (px)
Citation preview

Hospitality ReviewVolume 31Issue 2 FIU Hospitality Review v.31 i.2 Article 5
November 2013
Loss of electricity and refrigerated foods: avoidingthe danger zoneJoseph M. ScarcelliNiagara University, [email protected]
Douglas C. NelsonPurdue University, [email protected]
Follow this and additional works at: https://digitalcommons.fiu.edu/hospitalityreview
Part of the Hospitality Administration and Management Commons
This work is brought to you for free and open access by FIU Digital Commons. It has been accepted for inclusion in Hospitality Review by anauthorized administrator of FIU Digital Commons. For more information, please contact [email protected].
Recommended CitationScarcelli, Joseph M. and Nelson, Douglas C. (2013) "Loss of electricity and refrigerated foods: avoiding the danger zone," HospitalityReview: Vol. 31 : Iss. 2 , Article 5.Available at: https://digitalcommons.fiu.edu/hospitalityreview/vol31/iss2/5

Loss of electricity and refrigerated foods: avoiding the danger zone
AbstractRecent events such as Winter Storm [Hurricane] Sandy and Hurricane Katrina have demonstrated that localfood supplies must last as long as possible. Current recommendations are to dispose of all refrigerated foodfour hours after the power is lost. The purpose of this study was to determine if it is possible to safely holdfood longer than four hours without power. The results indicate that the food can be held for up to six hours ifthe door is not opened. If ice is added to the refrigerator, then it will take the food approximately 10 hours toreach 5°C (41°F).
KeywordsRefrigeration, food safety, heat transfer, power loss, loss of electricity, disaster preparedness, temperaturedanger zone
Cover Page FootnoteThe authors would like to thank the Arthur Avery food lab at Purdue University making this study possible.
This article is available in Hospitality Review: https://digitalcommons.fiu.edu/hospitalityreview/vol31/iss2/5

55
Loss of Electricity and Refrigerated Foods: Avoiding the Danger Zone
Joseph M. Scarcelli Niagara University
Douglas C. Nelson Purdue University
Abstract Recent events such as Winter Storm [Hurricane] Sandy and Hurricane Katrina have demonstrated that local food supplies must last as long as possible. Current recommendations are to dispose of all refrigerated food four hours after the power is lost. The purpose of this study was to determine if it is possible to safely hold food longer than four hours without power. The results indicate that the food can be held for up to six hours if the door is not opened. If ice is added to the refrigerator, then it will take the food approximately 10 hours to reach 5°C (41°F). Keywords: refrigerated foods, danger zone, food safety
Introduction
Perhaps nothing reminds us of how vulnerable our food supply is as much as when disaster strikes. On October 29th, 2012 Hurricane Sandy hit New Jersey and much of the East Coast of the United States. Its effects were felt in 17 states, knocking out electrical power to more than 8 million homes and causing an estimated $25 billion in damages (Webley, 2012). Residents in New York and New Jersey were without power for weeks. On August 29th, 2005 Hurricane Katrina hit New Orleans, causing more than $81 billion in damages (Knabb, Rhome, & Brown, 2005). The residents who remained in the city stranded by flood waters were without food, water, or shelter (NOAA-NCDC, 2005). It does not take a disaster of the magnitude of Sandy or Katrina to disrupt an area’s food supply. On August 14, 2003 residents of the northeastern U.S. and parts of Canada experienced a blackout when problems occurred with the power grid. In all, ten million Canadians and 45 million Americans were affected by the blackout. It took utility crews more than 48 hours to fully restore power to parts of New York and Toronto (Kile et al., 2005).
In each of these situations, large numbers of people were without electricity for days, sometimes weeks, on end. In these circumstances, it is not always possible for the government, whether federal, state, or local, to immediately ‘come to the rescue’ of all its citizens. Nor is it reasonable to expect that it should. Residents of any given area should be aware of what potential disasters could befall them, and prepare accordingly. For most, this means keeping a supply of water and food adequate to sustain them for several days or longer. This is, however, becoming increasingly difficult to do as we become more dependent on refrigeration (and its need for electricity) as a means for storing and preserving food.
Owners of foodservice operations face unique challenges during disasters. Foodservice operations typically store significant quantities of perishable food in their

56
refrigerators, which could become a large financial loss if immediate steps are not taken to protect it. Additionally, restaurateurs could potentially use their food as a source of disaster mitigation, provided that they can be sure that the food has been kept safe. When the power goes out without a back-up power source, the food has been effectively removed from temperature control. In accordance with the U. S. Food and Drug Administration (FDA) (2009) Food Code, food removed from temperature control can only be held for four hours. An exception to this rule would be if the food’s temperature was below 5°C (41°F) when the power went out and the temperature never exceeded 21°C (70°F), then it can be held for no more than 6 hours. Neither time constraint will be of much help in the disasters described above. It is very important that temperatures below 5°C (41°F) for cold food storage be maintained as long as possible to provide safe food for those trapped by the disaster until help arrives. The first step to doing this is to understand the holding characteristics of refrigerators. This study looks at a commercial two-door reach-in refrigerator. The goal is to define its holding characteristics and develop guidelines for extending its ability to hold food below 5°C (41°F) for the longest time possible.
Literature review
The first step to safely holding cold food during a disaster is to understanding the need to keep food safe; in other words, what are we trying to protect it from? The short answer is microorganisms, in particular bacteria. Bacteria reproduce through binary fission, or cell division. The rate of reproduction depends in part on the ambient temperature, and at optimum temperatures most will reproduce every twenty minutes, although some can be as quickly as eight minutes (ICMSF 1996). This means that a single bacterial cell dividing every twenty minutes will produce over 4,000 cells in a four hour period, and over a billion after ten hours. It is therefore crucial to maintain temperatures that do not promote bacterial growth. Many of the most common bacteria of concern during a disaster are mesophiles (NRAEF, 2008). While mesophiles prefer a range from 30°C (86°F) to 45°C (113°F), they can grow in temperatures as low as 5°C (41°F) (FDA, 2001). The top seven most commonly identified pathogenic bacteria caused 99.7 percent of all reported foodborne outbreak in 2007 for which the causative agent was confirmed (CDC, 2010). The top seven pathogenic bacteria, in order, were: Salmonella ssp., Clostridium perfringens, Escherichia coli, Campylobacter ssp., Shigella ssp., Staphylococcus aureus, and Bacillus cereus. The minimum growth temperature for this group of bacteria is 5°C (41°F) (FDA, 2001). For example, Salmonella spp does not grow at all at temperatures below 42°F (NRAEF, 2008); however, like most bacteria they do not die at low temperatures, rather they remain preserved and viable for long periods of time (USDA-FSIS, 2008), meaning that when the temperature becomes favorable they will resume the reproduction process. For this reason, the FDA (2009) recommends that food that has been removed from temperature control be disposed of after 4 hours. Therefore, the best way to protect people from foodborne illnesses related to those bacteria would be to maintain the food at temperatures below 5°C (41°F). Properly functioning commercial refrigerators will maintain the proper temperature provided they have electrical power. In most disasters, electricity is not available unless provided by a backup generator. By surveying past disaster victims, Gerald (2005) determined that in Louisiana, hurricanes, which are the most common natural disaster affecting healthcare facilities, generally cause electrical power and natural gas services to be
57
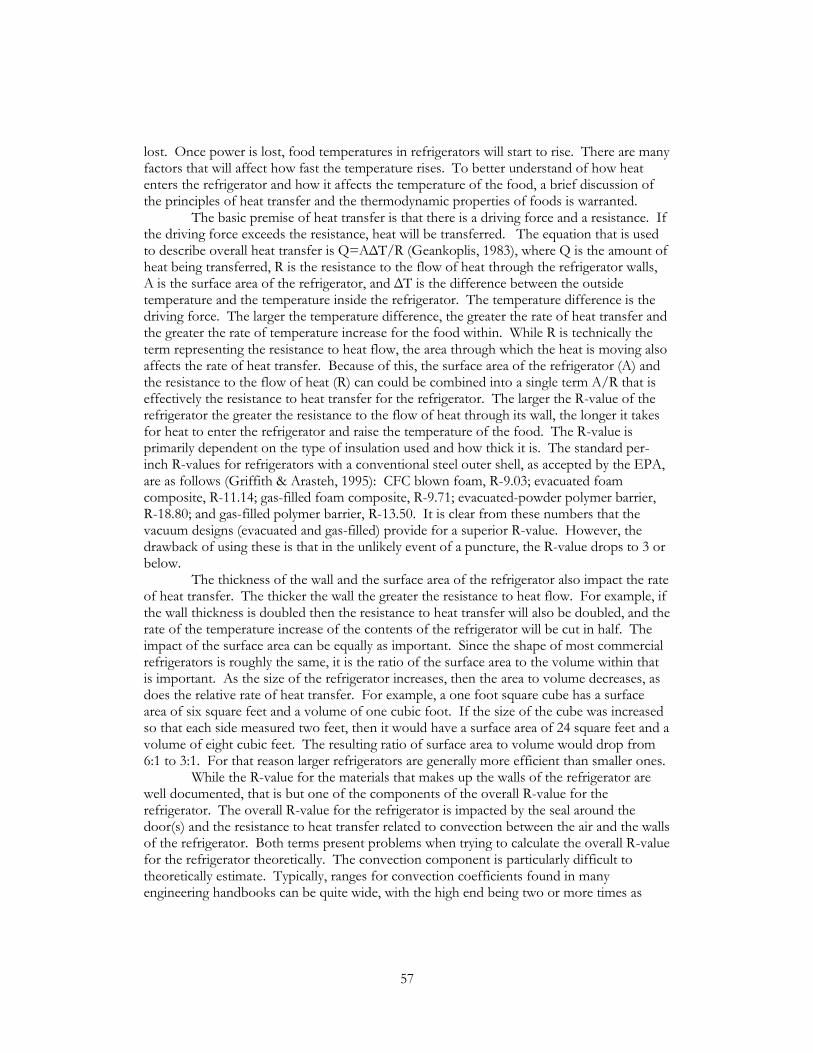
lost. Once power is lost, food temperatures in refrigerators will start to rise. There are many factors that will affect how fast the temperature rises. To better understand of how heat enters the refrigerator and how it affects the temperature of the food, a brief discussion of the principles of heat transfer and the thermodynamic properties of foods is warranted. The basic premise of heat transfer is that there is a driving force and a resistance. If the driving force exceeds the resistance, heat will be transferred. The equation that is used to describe overall heat transfer is Q=AΔT/R (Geankoplis, 1983), where Q is the amount of heat being transferred, R is the resistance to the flow of heat through the refrigerator walls, A is the surface area of the refrigerator, and ΔT is the difference between the outside temperature and the temperature inside the refrigerator. The temperature difference is the driving force. The larger the temperature difference, the greater the rate of heat transfer and the greater the rate of temperature increase for the food within. While R is technically the term representing the resistance to heat flow, the area through which the heat is moving also affects the rate of heat transfer. Because of this, the surface area of the refrigerator (A) and the resistance to the flow of heat (R) can could be combined into a single term A/R that is effectively the resistance to heat transfer for the refrigerator. The larger the R-value of the refrigerator the greater the resistance to the flow of heat through its wall, the longer it takes for heat to enter the refrigerator and raise the temperature of the food. The R-value is primarily dependent on the type of insulation used and how thick it is. The standard per-inch R-values for refrigerators with a conventional steel outer shell, as accepted by the EPA, are as follows (Griffith & Arasteh, 1995): CFC blown foam, R-9.03; evacuated foam composite, R-11.14; gas-filled foam composite, R-9.71; evacuated-powder polymer barrier, R-18.80; and gas-filled polymer barrier, R-13.50. It is clear from these numbers that the vacuum designs (evacuated and gas-filled) provide for a superior R-value. However, the drawback of using these is that in the unlikely event of a puncture, the R-value drops to 3 or below.
The thickness of the wall and the surface area of the refrigerator also impact the rate of heat transfer. The thicker the wall the greater the resistance to heat flow. For example, if the wall thickness is doubled then the resistance to heat transfer will also be doubled, and the rate of the temperature increase of the contents of the refrigerator will be cut in half. The impact of the surface area can be equally as important. Since the shape of most commercial refrigerators is roughly the same, it is the ratio of the surface area to the volume within that is important. As the size of the refrigerator increases, then the area to volume decreases, as does the relative rate of heat transfer. For example, a one foot square cube has a surface area of six square feet and a volume of one cubic foot. If the size of the cube was increased so that each side measured two feet, then it would have a surface area of 24 square feet and a volume of eight cubic feet. The resulting ratio of surface area to volume would drop from 6:1 to 3:1. For that reason larger refrigerators are generally more efficient than smaller ones.
While the R-value for the materials that makes up the walls of the refrigerator are well documented, that is but one of the components of the overall R-value for the refrigerator. The overall R-value for the refrigerator is impacted by the seal around the door(s) and the resistance to heat transfer related to convection between the air and the walls of the refrigerator. Both terms present problems when trying to calculate the overall R-value for the refrigerator theoretically. The convection component is particularly difficult to theoretically estimate. Typically, ranges for convection coefficients found in many engineering handbooks can be quite wide, with the high end being two or more times as

58
large as the low end (Geankoplis, 1983). For that reason, the rate of heat entering a refrigerator is best estimated experimentally.
The rate of heat entering the refrigerator is only one of the factors that impacts the rate food temperatures will increase; the other is the food itself. As heat enters an object such as food in a refrigerator, the rate of temperature increase of that food depends on the heat capacity of the food and the mass of food. The rate of change in temperature of the food can be defined by the following equation: Q = CpM(Tt +Δt – Tt) (Geankoplis, 1983). Just as with the heat transfer equation, Q is the amount of heat moving into the food. The heat moving into all the food in the refrigerator is approximately equal to the amount of heat entering the refrigerator. The heat capacity of the food is represented by Cp. The higher the heat capacity of the food, the more energy (heat) it will take to raise its temperature. Foods are typically compared using specific heat rather than heat capacity. Specific heat refers to the ratio of the heat capacity of a substance to that of water; since it takes one calorie to raise one gram of water one degree Celsius, confusing the two terms does not lead to numerical errors (Harper, 1976). For most food materials, the specific heat of the non-water portion is approximately 0.5. As water is generally the major constituent, little error is caused by using the constant value of 0.5 (Harper, 1976). Examples of the specific heat of foods include: nuts (specific heat 0.28), beef and pork sausage (0.56), beef flank (0.56), and chicken (hens, 0.65) (Singh & Heldman, 2001). M in the previous equation is the mass of the food in the refrigerator; the greater the mass contained in the refrigerator the longer it will take the temperature to rise. When CpM are combined you have the thermal mass of the food in the refrigerator. The final set of terms, (Tt +Δt – Tt) represents the actual increase in the temperature of the food after a set time (Δt).
With a basic understanding of the theory behind why the temperature of food in a refrigerator rises when the power goes out, it is possible to look at ways to delay the temperature rise of the food in the refrigerator. The first thing to look at would be slowing the rate of heat entering the refrigerator. Based on the heat transfer equation, this could be done one of two ways: increase the resistance to heat flow or decrease the driving force. Wrapping the refrigerator with insulating material would increase the resistance, but since most insulation is porous this could create some serious sanitation issues. Decreasing the temperature difference could be accomplished by reducing the temperature of the air in the room containing the refrigerator. Since a loss of power will affect the operator’s ability to keep the kitchen cool, this approach also has problems. For this study, the focus for delaying the temperature increase was instead placed on the thermal mass of the food in the refrigerator. The goal of this study was to develop some guidelines for reducing the rate of temperature increase of the food in a refrigerator during a disaster by adjusting the thermal mass. The thermal mass was adjusted either by increasing the amount of food in the refrigerator or adding ice.
Methodology
This experiment was designed to determine how long after a loss of electrical power it takes for food to enter the ‘temperature danger zone’ (above 5°C, 41°F). Specifically it looked at how the mass of food contained within and the addition of a known amount of ice affects the time it takes for the food to enter the danger zone. For this study, water was

59
used to simulate food. Water was chosen for several reasons: it is cost effective, homogeneous, and its physical and thermal properties are well documented.
The time necessary for food to reach the temperature danger zone could vary by location of the food within the refrigerator. Food located on higher shelves could reach warmer temperatures sooner (warm air rises), and food further away from the door (in back) could remain colder longer (Laguerre et al., 2007). In addition to front-to-back, the distance from the side wall may also impact the rate of temperature rise. Therefore, shelf and location information was collected. The temperature difference between the food and the room is the driving force behind heat transfer, and therefore both temperatures were recorded. The amount of food contained within the refrigerator affects the thermal mass and was also recorded. For example, less energy (heat) is needed to raise the temperature of one cup of water by one degree than is needed to raise the temperature of one gallon of water by one degree. Finally, the starting temperature of the food was recorded for each trial.
Two variables were controllable as to their effect and were the treatments applied to this experiment. The two controllable variables were load level and the addition of ice. Load had three levels: full, 36 (12 per shelf) one-gallon milk jugs with filled with water for a total weight of 132 kg; two-thirds full, 24 (8 per shelf) one-gallon milk jugs with filled with water for a total weight of 88 kg; and one-third full, 12 (4 per shelf) one-gallon milk jugs with filled with water for a total weight of 44 kg. The addition of ice had two levels (ice added or ice not added). When ice was added, it was added in form of 14 (7 each on the top and middle shelves) half-gallon milk jugs each filled with 1.55 kg of ice for a total weight of 21.7 kg. To complete a full-factorial design, six iterations of the experiment were necessary.
The location of the water and ice jugs is shown in Figure 1. For the two-thirds full trials, Jugs 5 – 8 were removed from each shelf. For the one-third full trials, Jugs 2, 4, 5 – 8, 9, and 11 were removed from each shelf. When ice was added the placement was the same for all three loads of water.
Back
1 2 3 4
5 6 7 8
9 1
0
1
1
1
2

60
Figure 1. Placement water and ice containers. The water containers are shown as numbered circles and the ice containers are shown as diamonds.
To measure the water temperatures, three Picolog TC-08 digital thermal recording
devices with k-type PTFE-insulated probes with PTFE coated tips were used. A total of 20 probes were used to measure the water temperature. To measure the air temperature, three general purpose air probes were connected to one of the TC-08 meters. The water probes were attached to the outside surface of the water containers, at the midpoint vertically and horizontally on the side of the containers. Probes were connected to all the jugs in the front and back rows (Jugs 1-4 and 9-12) on the top and bottom shelves and Jugs 1, 3, 10, and 12 on the middle shelf. One air probe was placed outside the refrigerator to measure the room temperature and the other two were placed inside. One was placed in the center of the refrigerator even with the top shelf, and the second was placed in the center of the refrigerator even with the middle shelf. To estimate the rate of heat transfer into the refrigerator, it is important to know the temperature of all jugs in the refrigerator. Because of the number of probes available, it was not possible to measure the temperature of all jugs in the refrigerator for the full load trial. The temperatures of the jugs without probes were estimated based on the temperature of the other jugs on the same shelf.
The refrigeration unit used for this experiment is similar to many used in the foodservice industry. The refrigerator is a seven-foot (84.5 inch exterior height) two-door reach-in with three shelves and an interior capacity of 49 cubic feet. Made by McCall (model 4-4045), the unit’s cabinet body, doors, and evaporator coil housings are insulated with pressure-injected (blown) polyurethane foam.
For all tests, the appropriate numbers of water jugs were place in the refrigerator and allowed to sit for 24 hour with the refrigerator running to equilibrate the jug temperatures. The test started with the unplugging of the refrigerator and continued for 24 hours with temperatures being recorded each minute for all probes. For the trials with no ice added the doors were not opened during the entire testing period. For the trials with ice added, the doors were opened one hour after the refrigerator was unplugged to add the ice; the doors were not opened again for the remainder of the trial.
Data were analyzed using backward stepwise regression and the seven independent variables were analyzed for the full model. They were Shelf (top, middle, or bottom), IceNoIce (whether or not ice was added), Load (132 kg, 88kg, or 44 kg), Row (whether the container was in the front or back row), Side (whether the container was next to one of the side walls or not), TempOut (the ambient room temperature), and StartTemp (the starting surface temperature of the water container). All variables were analyzed as categorical variables with the exception of the starting temperature of the containers, load, and the dependent variable; the number of minutes to reach five degrees Celsius (41°F).
To determine the best set of predictors (load, shelf, position front-to-back, position side-to-side, ambient room temperature, and starting temperature of the water) of the time it takes for food to reach 5°C (41°F), backward stepwise regression was used to analyze the data. The regression analysis was performed using SPSS version 16.0.

61
Results and Discussion
The average temperatures of the different trials are show in Figure 2. The figure clearly shows the impact of the load and the addition of ice. The spike in temperature at the one hour mark for the trials where ice was added was due to opening the door to add the ice. Because the sensors were attached to the outside of the containers, they showed an increase in temperature greater than that experienced by the product as a whole. Both increasing the volume of food and adding ice effectively increase the thermal mass of the contents of the refrigerator. As expected, as the thermal mass increases the rate of temperature rise decreases. Another factor that is clearly evident is the inherent harmonics of the sensing instruments.
Recorded temperatures fluctuated, making an accurate assessment of jug temperature difficult. As the noise recorded (generally about 0.25°C) was within the range of accuracy of the recording devices (1°C), it was decided that the data would be smoothed. The recording harmonic fluctuations cycled approximately every 40 minutes, the smoothing of the data was accomplished by using a moving average; each data point was re-coded as the mean temperature readings from the 20 minutes prior to the point through those 20 minutes after the point. The resulting data was considerably more linear, allowing for a more accurate assessment of temperatures and at what point 5°C (41°F) was reached. If the fluctuations still occurred at the 5°C (41°F) mark after smoothing the data (crossing 5°C, fluctuating lower, then crossing above the temperature a second time), the second data point was selected as the minute that the temperature was reached, because from that point on the temperature stayed at or above 5°C.
Figure 2. Water Container Temperatures After Loss of Power with No Addition of Ice Versus With Addition of Ice at Minute 60
Backward stepwise regression was run to determine the best explanatory model for
this experiment. The dependent variable was the amount of time (in minutes) it took for the
0
2
4
6
8
10
12
14
16
-800 200 1200
Wat
er
Tem
pe
ratu
re
(De
gre
es
Ce
lsiu
s)
Time After Power Loss (Minutes)
Full No Ice
2/3 No Ice
1/3 No Ice
Full AddIce
2/3 AddIce

62
water containers to reach 5°C (41°F). The independent variables were the seven variables described previously. As the outside room temperature and the starting temperature of the containers are both scales, they were treated statistically as continuous variables. The mass of the water contained within the refrigerator was entered in kilograms, and was treated as a continuous variable. The addition of ice, the shelf, positioning front or back, and position in proximity to side walls were all treated as categorical variables. The addition of ice and both positioning variables only had two levels each. Shelf had three levels, and was therefore modified by the creation of two dummy variables (number of levels minus one) during the statistical analyses to account for all three levels.
The results from the backward stepwise regression returned five models. The ANOVA table of the final, reduced model shows that the independent variables reliably predict the dependent variable (F=170.419, Sig.=0.000). The variables in the final model were top shelf (Shelf 3), the middle shelf (Shelf 2), addition of ice (Ice), and the starting temperature (StartTemp). The model was: time to 5°C (41°F) = 802.675 - 127.473(shelf3) + 80.127(shelf2) + 359.151(IceNoIce) - 184.109(Starttemp). As was expected by preliminary examinations of the data, the position side-to-side and front-to-back on a shelf did not impact temperature change when the door was closed. Two variables were mysteriously missing from the model: the room temperature and the amount of food in the refrigerator. Theoretically both variables should have been significant.
The reason why volume of food was not significant was that its effect was masked by the addition of the ice. The thermal mass of the ice was great enough to negate any impact from the varying levels of food in the refrigerator. When the load (amount of water) was regressed against time to 5°C (41°F) in the absence of the other variables it was significant. The same was true when it was run without the ice variable. This demonstrates the importance of adding ice to a refrigerator once the power goes out no matter how much food it contains.
The effect of the room temperature may also have been masked by conditions of the study. The temperature of the room was controlled and did not vary by more than 3°C (5°F). Additionally, the trials with the one-third loads had the lowest room temperatures. This means that the driving force (temperature difference between the room and the inside of the refrigerator) was smaller for those trials than for the other trials. This could have served to lessen the effect of both the room air temperature and the amount of food inside the refrigerator.

63
Conclusion and Implications
It is clear from Figure 2 that for the conditions tested as part of this study that disposing of all food in the refrigerator after fours may not be warranted. Even for the trials with no ice the temperature did not reach 21°C (70°F). Based on FDA (2009) rules for holding food, the food was safe to serve for up to 6 hours. The trials where ice was added maintained temperatures below 5°C (41°F) for approximately 10 hours. Combine this with the previous 6 hour FDA rule, and this could mean at least one, possibly two, additional meal periods could be served from the food before it needs to be discarded.
While not specifically tested as part of this study, it appears that the rate of heat absorbed by the ice changed over time resulting in an increase in the temperature of the food. Twenty-four hours after the power to the refrigerator was turned off there was still ice left in the refrigerator. Clearly, the ice lost its cooling power and needed replacing before it had all melted. It would appear that if the ice is replaced every 4 hours then the temperature would remain below 5°C (41°F) indefinitely. This leads to an important question: Where will the restaurant operator find ice in the middle of a disaster? The answer may be closer than one would think: the walk-in freezer. If there is enough warning the walk-in could be filled with containers of water that will freeze and provide the source of ice for some time. If there is no warning then other things in the freezer could serve basically the same function as ice. Frozen meat and vegetables could be placed in the refrigerator and serve much the same function as ice. As those items thaw, they can be removed, cooked, and served to the victims of the disaster.
It appears that with proper management it is possible to maintain safe food much longer than the recommended four hours (FDA, 2009). This is important to restaurateurs as they could potentially prevent significant financial losses. Additionally, knowing that their food was safe to serve, they could assist in mitigating the disaster by helping to feed the victims, especially if cannot leave the area and fresh supplies cannot be brought in for several days, as was seen in the aftermath of Hurricane Katrina.
To confirm the findings and develop more uniform parameters more studies in this area are needed; in particular, to overcome some of the limitations of this study. It is important to note that this experiment was conducted using one specific refrigerator. The unit was in good working order, and the door seals were in good repair. The results of this study can only apply to refrigerators that identically match the one used for this study, with similar environmental conditions. Limitations of this study included only using one type of refrigerator, having a relatively steady room temperature, and only using ice as the cooling medium. Future studies need to look at other types of refrigerators and environmental conditions. It is unlikely that the temperature of the room housing the refrigerator will remain constant during a power outage. In addition, future studies should look at adding different amounts of ice and at varying intervals. The behavior of other cooling medium such as frozen food and dry ice also needs evaluated. Finally, for this study the door remained closed for the entire time. The impact of opening the door to remove food for serving needs to be evaluated.
Finally, it needs to be emphasized that the point of this study was not to disprove or contradict FDA recommendations for maintaining food safety. Rather the goal was to augment existing information, and determine means for protecting food as long as possible.

64
The results of this study determined measures to extend the safe life of food using the FDA criteria for safety.
References
Center for Disease Control and Prevention, (2007). Surveillance for Foodborne Disease Outbreaks --- United States, 2007, Morbidity and Mortality Weekly Report (MMWR) August 13, 2010. 59(31);973-979 Available from http://www.cdc.gov/mmwr/preview/mmwrhtml/mm5931a1.htm?s_cid=mm5931a1_w
Geankoplis, C.J. (1983). Transport processes and unit operations, 2nd edition. Boston: Allyn and
Bacon, Inc. Gerald, B., (2005). Water safety and disaster management procedures reported by Louisiana
health care food service directors. Journal of Environmental Health, 67, 10, pp. 30-34. Griffith, B., & Arasteh, D. (1995). Advanced insulations for refrigerators/freezers: The
potential for new shell designs incorporating polymer barrier construction. Energy and Buildings, 22, 219-231
Harper, J. (1976). Elements of food engineering. Westport, Connecticut. AVI Publishing Co. International Commission on Microbiological Specification for Foods (ICMSF), (1996).
Microorganisms in foods. Characteristics of microbial pathogens, Volume 5. Roberts TA, Baird-Parker AC, Tompkin RB, editors. London: Blackie Academic & Professional. p 513
Kile, J., Skowronski, S., Miller, Reissman, S., Balaban, V., M., Klomp, R., Reissman, D.,
Mainzer, H., & Dannenberg, A., (2005). Impact of 2003 power outages on public health and emergency response. Prehospital and Disaster Medicine, 20, 2, pp. 93-97. Available from http://pdm.medicine.wisc.edu
Knabb, R., Rhome, J., & Brown, D. (2005). Tropical cyclone report, Hurricane Katrina, 23-
30 August 2005. National Hurricane Center, December 20, 2005, updated August 10, 2006. Available from http://www.nhc.noaa.gov/pdf/TCR-AL122005_Katrina.pdf
National Restaurant Association Educational Foundation (NRAEF), (2008). ServSafe
coursebook, 5th edition. Chicago: National Restaurant Association Solutions. NOAA Satellite Information Service, National Climatic Data Center (NOAA-NCDC)
(2005). Climate of 2005, summary of Hurricane Katrina. Available from http://www.ncdc.noaa.gov/oa/climate/research/2005/katrina.html

65
Singh, R., & Heldman, D. (2001). Introduction to food engineering. (3rd ed.) London: Academic Press.
U.S. Department of Agriculture Food Safety and Inspection Service (USDA-FSIS) (2008).
Disposition/food safety: Overview of food microbiology. Available from http://www.fsis.usda.gov/PDF/PHVt-Food_Microbiology.pdf
U.S. Department of Health and Human Services, Food and Drug Administration (FDA),
(2009). 2009 Food Code. Available from http://www.fda.gov/Food/FoodSafety/RetailFoodProtection/FoodCode/FoodCode2009/
U.S. Department of Health and Human Services, Food and Drug Administration (FDA),
(2001). Chapter 3. Factors that Influence Microbial Growth, December 31, 2001, updated June, 18, 2009. Available from http://www.fda.gov/Food/ScienceResearch/ResearchAreas/SafePracticesforFoodProcesses/ucm094145.htm
Webley, K. (2012). Hurricane Sandy by the numbers: a superstorm’s statistics, one month later. Available from http://nation.time.com/2012/11/26/hurricane-sandy-one-month-later/