Embed Size (px)
Citation preview

March
2016
LOS ANGELES
INTERNATIONAL
AIRPORT

2
GENERAL
This presentation you are about to view is provided as of March 16, 2016. If you are viewing this presentation after March 16, 2016, there may have been events that occurred subsequent to
such date that would have a material adverse effect on the information that is presented in this presentation, and the Department of Airports of the City of Los Angeles (the “Department”) does
not undertake any obligation to update this presentation. The information provided in this presentation is not warranted as to completeness or accuracy and is subject to change without notice. All
numbers contained in this presentation are approximate.
ADDITIONAL INFORMATION
For further information and a more complete description of the Department and the Department’s securities, investors are referred to (i) the Official Statements of the Department related to the
Department’s securities and (ii) the Department’s reports of annual financial information available on the Department’s investor relations website at
http://lawa.aero/InvestorRelations/investors.aspx or http://emma.msrb.org/, all of which speak only as of their respective dates. This presentation is provided for your information and
convenience only. Any investment decisions regarding the Department’s securities should only be made after a careful review of an Official Statement of the Department related to such
securities. Department financings are subject to, among other things, review and approval by the Department’s governing board. The issuance of any securities, and the size and timing of any
transaction are subject to market conditions and the approvals referenced above. The Department is under no obligation to pursue any transaction, any particular structure and reserves the right
to change or modify its plans as it deems appropriate.
NO OFFER OF SECURITIES
This presentation does not constitute a recommendation or an offer or solicitation for the purchase or sale of any security or other financial instrument, including the Department’s securities, or to
adopt any investment strategy. Any offer or solicitation with respect to the Department’s securities will be made solely by means of an Official Statement of the Department related to such
securities, which describes the actual terms of the Department’s securities. In no event shall the Department be liable for any use by any party of, for any decision made or action taken by any
party in reliance upon, or for any inaccuracies or errors in, or omissions from, the information contained in this presentation and such information may not be relied upon by any party in
evaluating the merits of participating in any transaction mentioned in this presentation. Nothing in these materials constitutes a commitment by the Department to enter into any transaction. No
assurance can be given that any transaction mentioned in this presentation could in fact be executed. Past performance is not indicative of future returns, which will vary. Transactions involving the
Department’s securities may not be suitable for all investors. Each investor should consult with his, her or its own advisors as to the suitability of securities or other financial instruments for the
investor’s particular circumstances.
FORWARD-LOOKING STATEMENTS
Certain statements included in this presentation constitute “forward‐looking statements.” Such statements are generally identifiable by the terminology used, such as “plan,” “expect,” “estimate,”
“budget,” or other similar words. The achievement of certain results or other expectations contained in such forward‐looking statements involves known and unknown risks, uncertainties and other
factors which may cause actual results, performance or achievements described to be materially different from any future results, performance or achievements expressed or implied by such
forward‐looking statements. No assurance can be given that any future results discussed in this presentation will be achieved, and actual results may differ materially from the expectations and
forecasts described in this presentation. All projections, forecasts, assumptions, expressions of opinion, estimates and other forward-looking statements are expressly qualified in their entirety by
the cautionary statements set forth in this presentation. The Department does not plan to issue any updates or revisions to those forward‐looking statements if or when the expectations, or events,
conditions or circumstances on which such statements are based, occur. Statements contained in this presentation which involve estimates, forecasts or other matters of opinion, whether or not
expressly so described in this presentation, are intended solely as such and are not to be construed as representations of fact. Further, expressions of opinion contained in this presentation are
subject to change without notice and the delivery of this presentation will not, under any circumstances, create any implication that there has been no change in the affairs of the Department. By
providing the information in this presentation, the Department does not imply or represent (a) that all information provided in this presentation is material to investors’ decisions regarding
investment in the Department’s securities, (b) the completeness or accuracy of any financial, operational or other information not included in this presentation, (c) regarding any other financial,
operating or other information about the Department or its outstanding securities, (d) that no changes, circumstances or events have occurred since the dated date of the information provided this
presentation or (e) that no other circumstances or events have occurred or that no other information exists concerning the Department, its outstanding securities or the contemplated transactions
which may have a bearing on Department financial condition, the security for the Department outstanding securities, or an investor’s decision to buy, sell, or hold Department’s securities.
Disclaimer
3
RESTRICTIONS ON USE
This presentation may not be reproduced, disseminated, quoted or referred to, in whole or in part. By accessing or otherwise accepting this presentation, you agree not to duplicate, copy, screen
capture, electronically store or record this presentation, nor to produce, publish or distribute this presentation in any form whatsoever.
NO RELIANCE ON THE DEPARTMENT
The Department makes no representations as to the legal, tax, credit or accounting treatment of any transactions mentioned in this presentation, or any other effects such transactions may have on
you and your affiliates or any other parties to such transactions and their respective affiliates. You should consult with your own advisors as to such matters and the consequences of the purchase
and ownership of securities or other financial instruments. The Department does not provide tax advice. Any statements contained in this presentation as to tax matters were neither written nor
intended to be used and cannot be used by any taxpayer for the purpose of avoiding tax penalties that may be imposed on such taxpayer.
SUMMARIES NOT COMPREHENSIVE OR DEFINITIVE
This presentation may include brief descriptions of the Department, LAWA, The Department’s Bonds, t and summaries of the Department’s indentures and certain other documents. Such summaries
do not purport to be comprehensive or definitive. All references in this presentation to such documents and to any other documents, statutes, reports or other instruments described in this
presentation are qualified in their entirety by reference to each such document, statute, report or other instrument. Copies of such documents are available from the Department upon written
request.
Disclaimer Continued

4
LAX Core Credit Factors
LAX Core Credit
Factors
LAX has strong financial metrics, stable and experienced management, diverse air
service and dynamic passenger growth
Experienced management team is
successfully implementing the Capital
Program that is expanding and
modernizing LAX for the benefit of
its stakeholders.
Consistent growth of predominantly
O&D traffic that is supported by a
diverse base of carriers.
Large airport serving a region with
favorable demographics and a robust
economic environment.
Conservative financial management and
strong financial metrics that are expected
to persist through the capital program.
Healthy liquidity and robust debt service
coverage that help mitigate investor risk
and preserve financial strength.
International gateway airport serving
numerous markets around the world.
Core Credit Factors

5
Prudent Management Vision
The
Groundwork
The Current Program
Future
Management’s strategic vision has set the foundation for LAX’s ability to meet traffic demand
Terminal leasehold
acquisitions
Critical rehabilitation
and renewal projects
Controlled measures to
efficiently improve
facilities
Landside improvements
to facilitate passenger
access and alleviate
congestion
Adopted new rate-
setting methodology and
10 year (through 2022)
airline agreements to
enable terminal
redevelopment
Reconstruction and
expansion of Tom
Bradley International
Terminal
Airline & concessionaire
supported and managed
terminal improvement
projects
Ongoing program of
facility repair and
maintenance
New concessionaire
agreements in all
terminals
Support facilities –
Central Utility Plant,
utilities connections,
airfield improvements
Balance gate capacity
with passenger demand
(Midfield Terminal)
Maintain efficient
utilization of landside,
terminal and airside
facilities to meet demand
Accomplishments
6
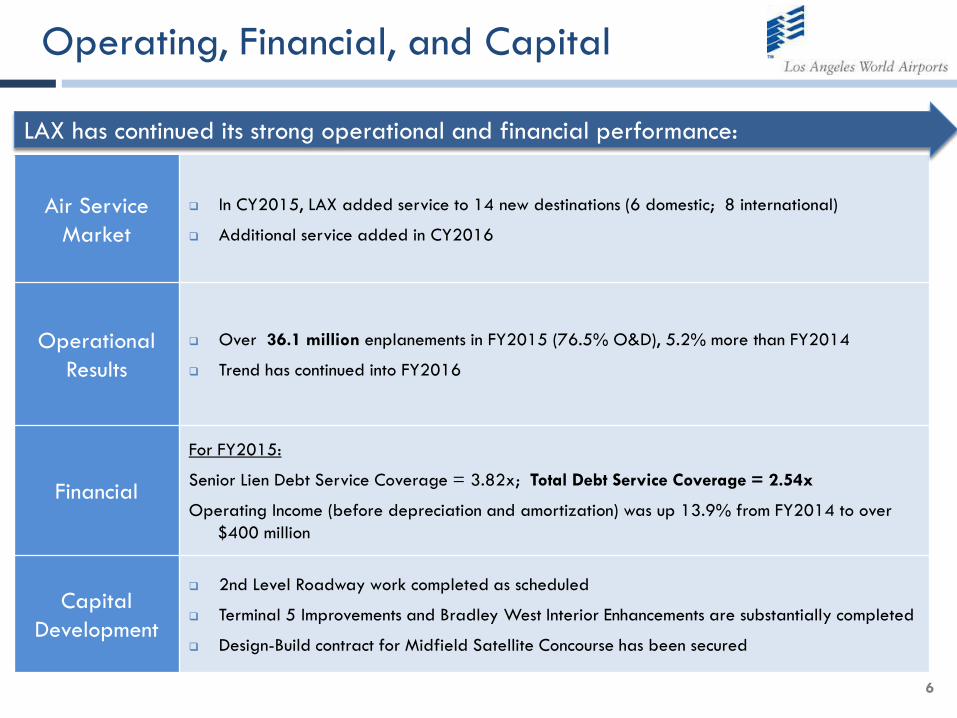
Air Service
Market
In CY2015, LAX added service to 14 new destinations (6 domestic; 8 international)
Additional service added in CY2016
Operational
Results
Over 36.1 million enplanements in FY2015 (76.5% O&D), 5.2% more than FY2014
Trend has continued into FY2016
Financial
For FY2015:
Senior Lien Debt Service Coverage = 3.82x; Total Debt Service Coverage = 2.54x
Operating Income (before depreciation and amortization) was up 13.9% from FY2014 to over
$400 million
Capital
Development
2nd Level Roadway work completed as scheduled
Terminal 5 Improvements and Bradley West Interior Enhancements are substantially completed
Design-Build contract for Midfield Satellite Concourse has been secured
Operating, Financial, and Capital
LAX has continued its strong operational and financial performance:
7
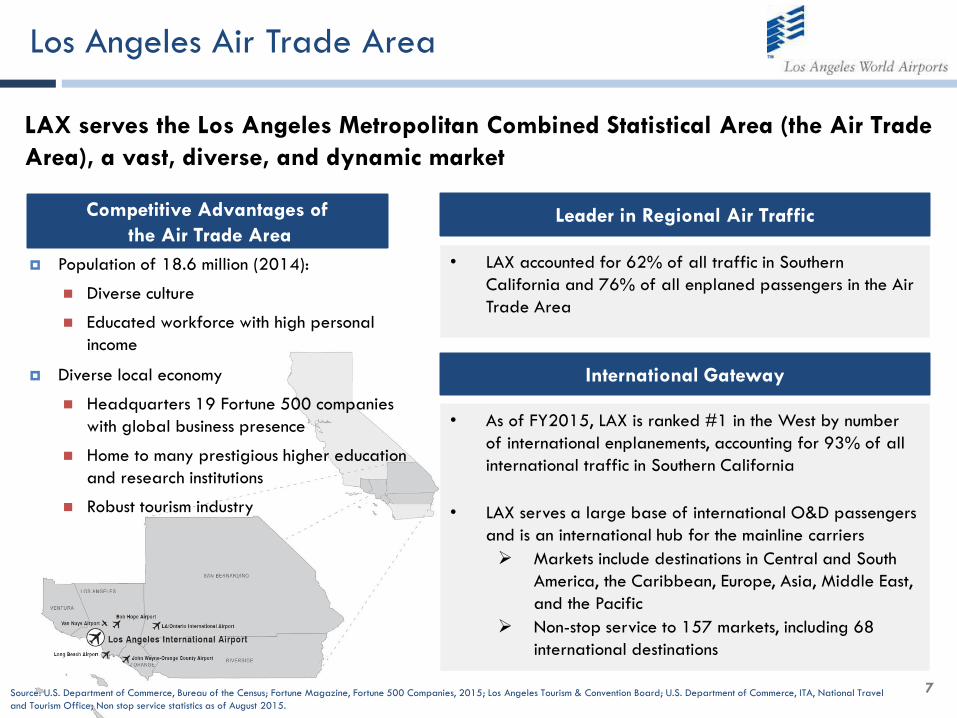
Los Angeles Air Trade Area
LAX serves the Los Angeles Metropolitan Combined Statistical Area (the Air Trade
Area), a vast, diverse, and dynamic market
Competitive Advantages of
the Air Trade Area
Population of 18.6 million (2014):
Diverse culture
Educated workforce with high personal
income
Diverse local economy
Headquarters 19 Fortune 500 companies
with global business presence
Home to many prestigious higher education
and research institutions
Robust tourism industry
Source: U.S. Department of Commerce, Bureau of the Census; Fortune Magazine, Fortune 500 Companies, 2015; Los Angeles Tourism & Convention Board; U.S. Department of Commerce, ITA, National Travel
and Tourism Office; Non stop service statistics as of August 2015.
• LAX accounted for 62% of all traffic in Southern
California and 76% of all enplaned passengers in the Air
Trade Area
Leader in Regional Air Traffic
• International
enplanements grew
6.1% in FY2015 and
have grown 17.6% from
FY2005 to FY2015
International Gateway
• As of FY2015, LAX is ranked #1 in the West by number
of international enplanements, accounting for 93% of all
international traffic in Southern California
• LAX serves a large base of international O&D passengers
and is an international hub for the mainline carriers
Markets include destinations in Central and South
America, the Caribbean, Europe, Asia, Middle East,
and the Pacific
Non-stop service to 157 markets, including 68
international destinations

8
Diverse Carrier Mix and Distribution
LAX has a diverse air carrier mix with 21 domestic and 45 foreign flag carriers*
*As of August 1, 2015
(1) Passengers reported by regional code-sharing affiliates have been grouped with their respective code-sharing
partners. American Airline includes US Airways
Source: Los Angeles International Airport records; LeighFisher
Enplanement Carrier Mix as of FY2015(1)
United 17.2%
American 18.8%
Delta 16.7%
Southwest 11.7%
Alaska 4.6%
Virgin America 4.2%
Other 26.7%
Air Carriers Serving LAX*
Update with Table 6 from OS
Scheduled U.S. Carriers (21)
Alaska Airlines Aeroflot Eva Airw ays
Allegiant Air AeroMexico Iberia
American Airlines Avianca/TACA Japan Airlines
Compass Air Berlin KLM Royal Dutch
Delta Air Lines Air Canada Korean Airlines
Dynamic Airw ays Air China LATAM
Express Jet Air France Lan Peru
Frontier Airlines Air New Zealand LACSA
Great Lakes Aviation Air Pacif ic (Fiji Airw ays) Lufthansa German
Haw aiian Airlines Air Tahiti Nui Norw egian Air Shuttle
JetBlue Airw ays Alitalia OJSC Transaero Airlines
Mesa Airlines All Nippon Philippine Airlines
MN Airlines (Sun Country) Asiana Qantas
Republic British Airw ays Saudi Arabian Airlines
SkyWest Airlines Cathay Pacif ic Singapore Airlines
Southw est Airlines China Airlines SWISS
Spirit Airlines China Eastern Thai Airw ays
Ultimate Jetcharters China Southern Turkish Airlines
United Airlines Copa Virgin Atlantic Airw ays
US Airw ays El Al Israel Virgin Australia
Virgin America Emirates Volaris
Etihad Airw ays Westjet
Ethiopian Airlines
Foreign Flag Carriers (45)
9
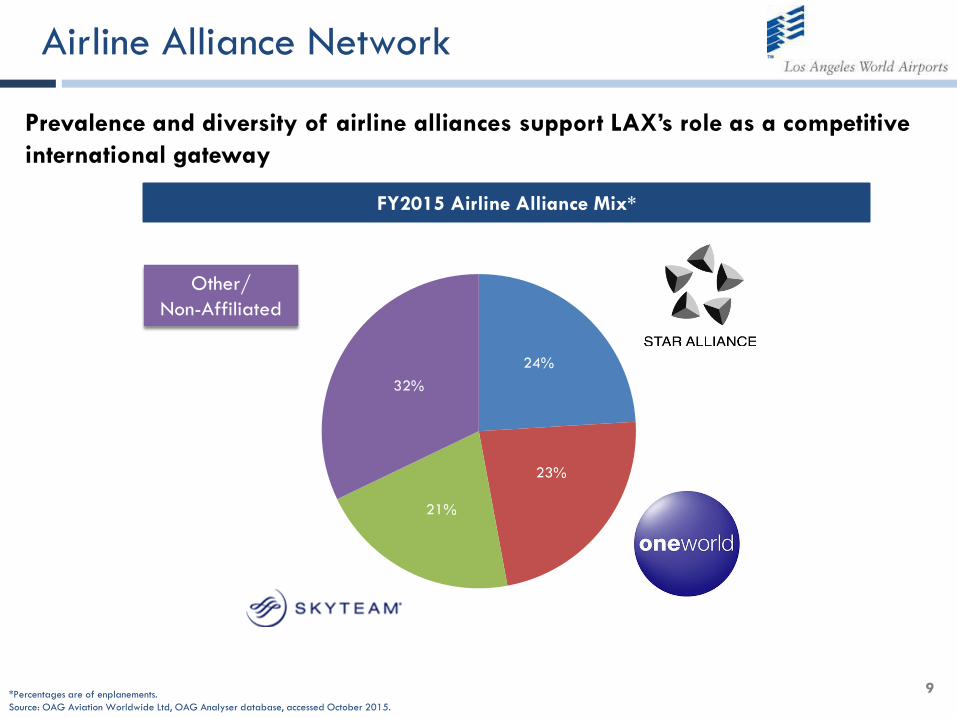
Airline Alliance Network
Prevalence and diversity of airline alliances support LAX’s role as a competitive
international gateway
FY2015 Airline Alliance Mix*
Other/
Non-Affiliated
*Percentages are of enplanements.
Source: OAG Aviation Worldwide Ltd, OAG Analyser database, accessed October 2015.
24%
23%
21%
32%

10
Traffic Growth
There were 36.1 million enplaned passengers (EPAX) in FY2015, an increase of 5.2% over FY2014
In FY2015, LAX continued to experience strong traffic growth and a healthy
passenger mix (76.5% O&D)
Historical Enplanements (FY2000-2015)
CAGR: Compound Annual Growth Rate
Source: Los Angeles International Airport records.
0
5
10
15
20
25
30
35
40
45
200
0
200
1
200
2
200
3
200
4
200
5
200
6
200
7
200
8
200
9
201
0
201
1
201
2
201
3
201
4
201
5
201
6
201
7
201
8
201
9
202
0
202
1
Millions
Domestic International Total
Enplaned
Passengers FY2014 FY2015 % Change
Domestic 25,016,409 26,237,839 4.88%
International 9,316,116 9,883,929 6.09%
Total 34,332,525 36,121,768 5.21%
Enplanements for FY2014 & FY2015
Total EPAX 5-Year CAGR
(2010-2015): 4.5%
11
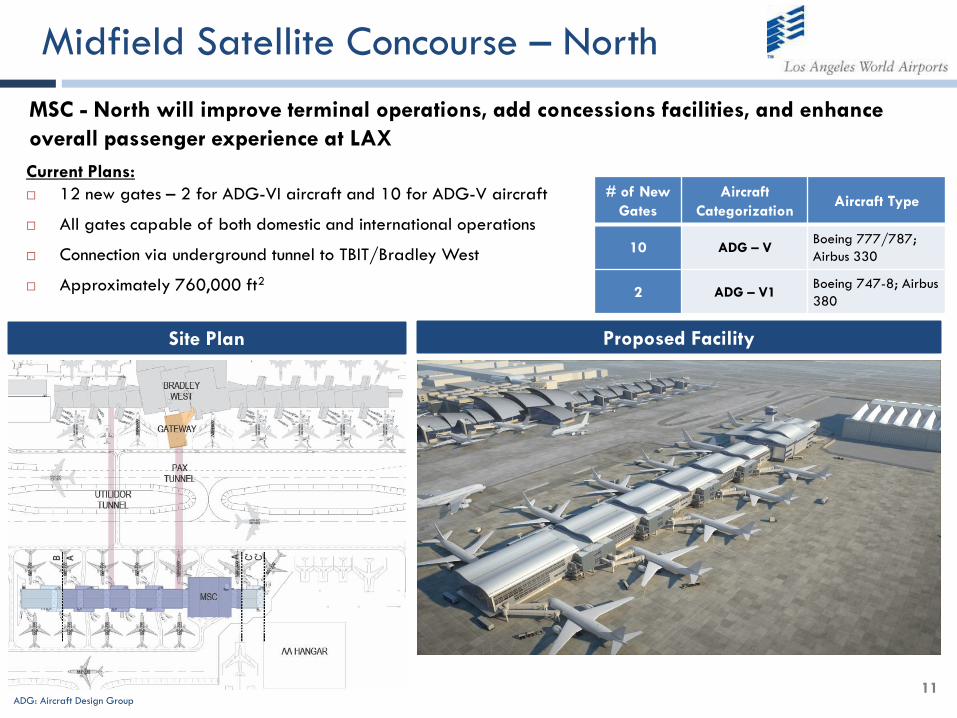
Midfield Satellite Concourse – North
Current Plans:
12 new gates – 2 for ADG-VI aircraft and 10 for ADG-V aircraft
All gates capable of both domestic and international operations
Connection via underground tunnel to TBIT/Bradley West
Approximately 760,000 ft2
MSC - North will improve terminal operations, add concessions facilities, and enhance
overall passenger experience at LAX
Site Plan Proposed Facility
ADG: Aircraft Design Group
ADG – V Boeing 777/787; Airbus 330
ADG – V1 Boeing 747-8; Airbus 380
# of New
Gates
Aircraft
Categorization Aircraft Type
10 ADG – V Boeing 777/787;
Airbus 330
2 ADG – V1 Boeing 747-8; Airbus
380

12
Tenant Managed Projects
The terminal improvement projects will be managed and financed by the airlines
Tenants control design and construction and are focused on improving efficiencies and enhancing the passenger experience
The Department will purchase the improvements at an agreed upon price in phases when they are complete
Certain public area improvements will be funded and managed by Westfield Concessions Management, LLC and purchased by the Department when they are complete. The total cost of these projects is estimated at $145 million
Many of the Terminal Improvement Projects are being managed by the Airlines and Concessionaires
Terminal Manager Total Amount
1 Southwest $526 million
2 LAWA $216 million
TBIT/1/2/3/6 Westfield $145 million
4 American $220 million
5 Delta $201 million
6/7/8 United $538 million
Terminal Improvements in the Capital Plan
Terminal 1
Terminal 7

13
CONRAC, APM and Associated Facilities
The Landside Access Modernization Program (LAMP) seeks to address LAX’s challenge of being the
busiest O&D airport in the world by relieving traffic congestion and improving passenger experience
LAMP is part of the Department’s long-term strategic plan and
will be managed through the same meticulous, conservative
process
Initial estimates of total costs are in the range of $4.5 billion to
$5.5 billion, which includes approximately $1 billion for the
Consolidated Rent-A-Car project (CONRAC).*
The CONRAC project and portions of the Automated People
Mover may be funded through CFC Revenues and CFC Revenue
Bonds.
Status:
In February, 2016, LAWA held
an Industry Forum for various
stakeholder groups including
potential investors and
contractors
Timing:
Projects expected to be
completed after Fiscal Year
2021**
*Scopes, costs, and timing of implementation are subject to substantial revision as project planning and preliminary design proceed.
**Subject to environmental and other approvals . Construction
of some components could begin prior to June 30, 2021
14
Financial Performance
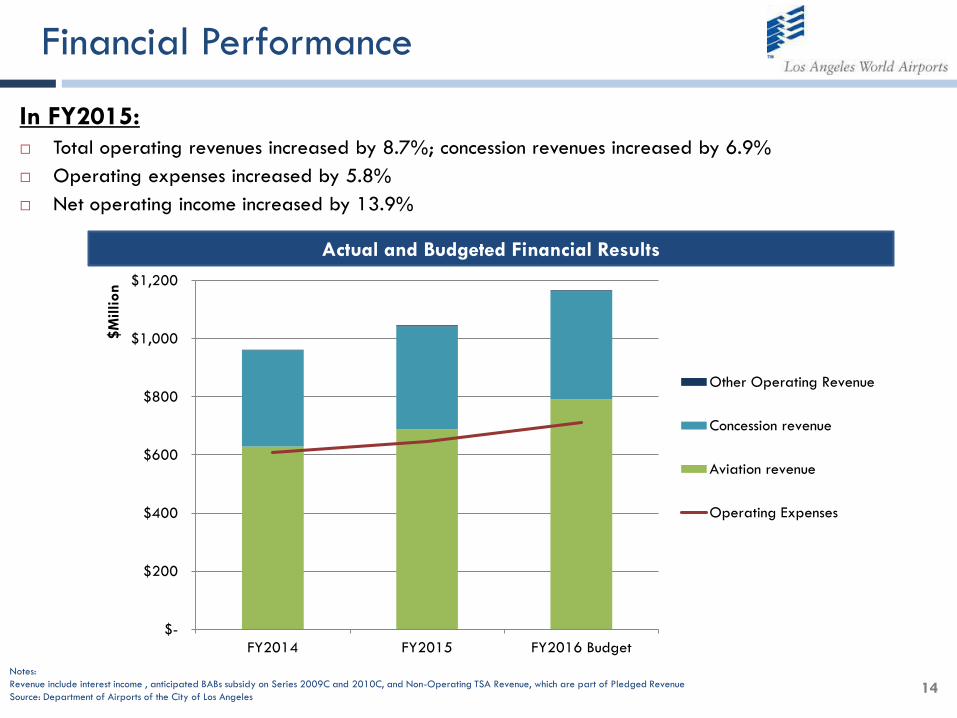
In FY2015:
Total operating revenues increased by 8.7%; concession revenues increased by 6.9%
Operating expenses increased by 5.8%
Net operating income increased by 13.9%
Notes:
Revenue include interest income , anticipated BABs subsidy on Series 2009C and 2010C, and Non-Operating TSA Revenue, which are part of Pledged Revenue
Source: Department of Airports of the City of Los Angeles
Actual and Budgeted Financial Results
$-
$200
$400
$600
$800
$1,000
$1,200
FY2014 FY2015 FY2016 Budget
$M
illion
Other Operating Revenue
Concession revenue
Aviation revenue
Operating Expenses

15
Debt Service Coverage
The Airline Agreements, Terminal Tariff and Airfield Operating Permits, along with robust non-
aeronautical revenue ensure that debt service coverage will remain strong
Debt service coverage has remained strong
Source: City of Los Angeles, Department of Airports
Notes:
(1) As defined in Senior Indenture. Equals Pledged Revenues less LAX Maintenance and Operating Expenses
(2) Net of approximately $19 million, approximately $25.2 million, approximately $34.4 million, approximately $96.5 million and approximately $91.0 million passenger facility charge reimbursements for Fiscal Years
2011, 2012, 2013, 2014 and 2015 debt service payments, respectively, pursuant to the Senior Indenture. Presentations of PFC reimbursements in this table differ from those in the audited financial statements of the
Department due to differences in accounting practices.
(3) Includes actual debt service on Subordinate Commercial Paper Notes
Historical Debt Service Coverage ($000’s)
Amounts in thousands Actual
(except for coverage ratios) FY2011 FY2012 FY2013 FY2014 FY2015
Net Pledged Revenues (1) $256,273 $277,237 $288,143 $375,936 $421,023
Senior Lien Aggregate Annual Debt Service (2) $ 60,095 $ 60,577 $ 45,486 $ 62,560 $110,237
Senior Lien Coverage 4.26x 4.58x 6.33x 6.01x 3.82x
Subordinate Lien Debt Service (3) $ 40,649 $ 45,508 $ 49,904 $ 52,067 $ 55,439
Subordinate Lien Coverage 4.83x 4.76x 4.86x 6.02x 5.61x
Total Debt Service Coverage 2.54x 2.61x 3.02x 3.28x 2.54x
16
Liquidity, Cash on Hand, and DSRF
Liquidity is strong, even during a major capital program
LAX had approximately $729.0 million in available funds on hand to pay operating
expenses at the end of FY2015, representing 412 days cash on hand
LAX’s $500 million Commercial Paper Program has a remaining capacity of $449.8
million with $50.2 million currently outstanding1
LAX had approximately $507.7 million in PFC funds on hand at the end of FY2015
Debt Service Reserve Funds are fully cash funded
The Operating Permits and Terminal Tariff/Airline Rate Agreements are designed to
provide the Department with future funding and discretionary cash
1. As of December 1, 2015
Source: Department of Airports of the City of Los Angeles. Figures are preliminary, unaudited.

17
Debt Overview
100% fixed-rate, with final maturity in 2045
The average life of the bonds is 16.1 years
82% of long-term debt outstanding are on the Senior Lien
In addition, LAX currently has $50.2 million2 of Subordinate Lien Commercial Paper
outstanding
LAX has $4.43 billion of long-term bonds outstanding1
1. As of December 1, 2015; does not include subordinate commercial paper; debt service schedule are net of capitalized interest
2. Outstanding Commercial Paper as of December 1, 2015; the Commercial Paper Program has a total capacity of $500 million
Source: Financial Advisors
S&P Moody’s Fitch
Senior Lien AA Aa3 AA
Subordinate Lien AA- A1 AA-
Current Ratings
$-
$100
$200
$300
$400
$500
$M
illions
Subordinate Lien Debt Service Senior Lien Debt Service
Long Term Bonds Debt Service1 (FY)

18
Calendar 2016 Planned Bond Issuances
The Department is planning to issue Revenue Bonds in Spring and Fall of 2016 to fund capital projects*
*Preliminary, subject to change
Source: Department of Airports of the City of Los Angeles