Embed Size (px)
Citation preview
Los Angeles Basin Stormwater Conservation Study
Task 4 Existing Infrastructure Response & Operations Guidelines Analysis
U.S. Department of the Interior Bureau of Reclamation
County of Los Angeles Department of Public Works
Los Angeles County Flood Control District
U.S. Army Corps of Engineers Los Angeles District
September 2014

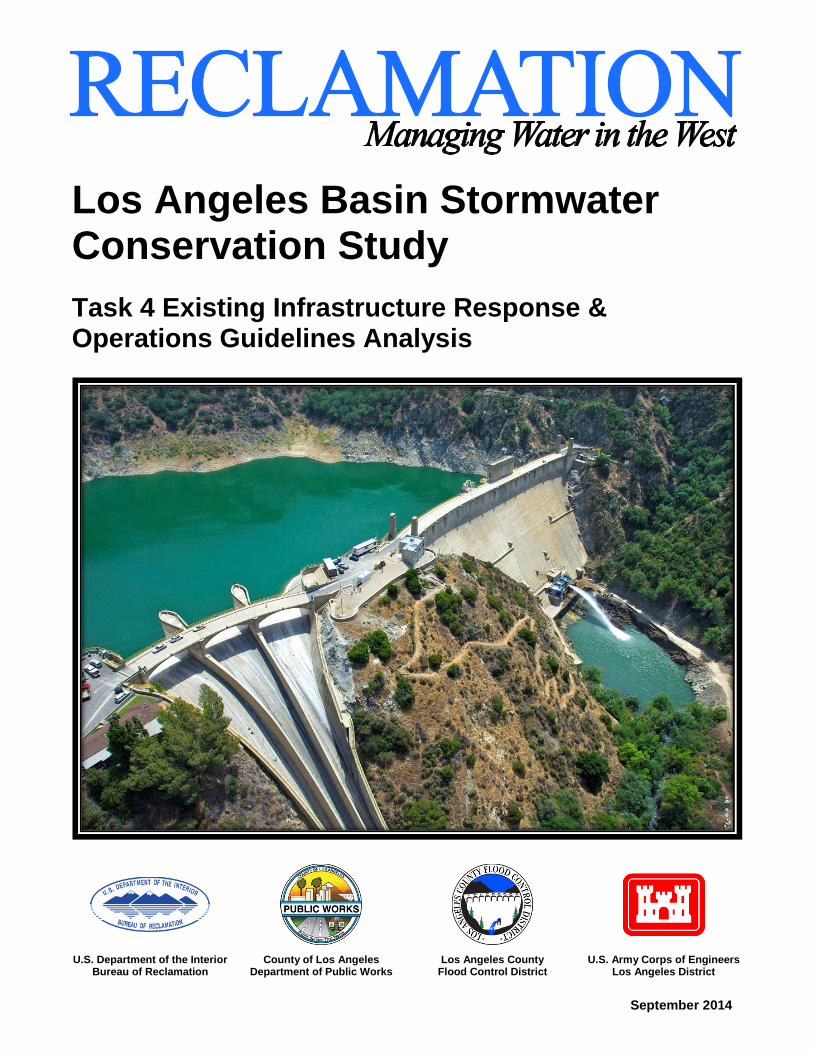
Cover Photo: Morris Dam along the San Gabriel River, Los Angeles County, California.
Mission Statements
The mission of the County of Los Angeles Department of Public
Works is to provide public infrastructure and municipal services to
protect and enrich the daily lives of over 10 million people in Los
Angeles County.
The mission of the Department of the Interior is to protect and
provide access to our Nation’s natural and cultural heritage and
honor our trust responsibilities to Indian Tribes and our
commitments to island communities.
The mission of the Bureau of Reclamation is to manage, develop,
and protect water and related resources in an environmentally and
economically sound manner in the interest of the American public.
Los Angeles Basin Stormwater Conservation Study
Task 4. Existing Infrastructure Response & Operations Guidelines Analysis
September 2014
Prepared by:
County of Los Angeles Department of Public Works Los Angeles County Flood Control District Watershed Management Division
Lee Alexanderson, PE, Associate Civil Engineer Daniel Bradbury, PE, Senior Civil Engineering Assistant
Bureau of Reclamation Lower Colorado Region Engineering Services Office Tom Nichols, PE, Supervisory Civil Engineer (Hydrologic) Robert Owen, EIT, Civil Engineer U.S. Army Corps of Engineers Los Angeles District Hydraulics and Hydrology Branch Alison Lind, Senior Hydraulic Engineer Kerry Casey, Senior Hydraulic Engineer Jason Lee, Hydraulic Engineer
Peer Reviewed by:
William Saunders, PE, Civil Engineer

Acknowledgments
Main San Gabriel Basin Watermaster
Pomona Valley Protective Association
c/o City of Upland
Six Basins Watermaster
Los Angeles Basin Study Task 4 Existing Infrastructure Response Report
i
Contents
Page
EXECUTIVE SUMMARY……………………………………………………………………ES-1
1 INTRODUCTION ........................................................................................................ 1
1.1 STUDY PURPOSE ............................................................................................................... 1 1.2 STUDY BACKGROUND ........................................................................................................ 1 1.3 DESCRIPTION OF STUDY AREA .......................................................................................... 2 1.4 HYDROLOGY MODEL USED FOR STUDY ............................................................................ 4 1.5 FACILITY MODELING .......................................................................................................... 4
1.5.1 Dam/Reservoir Models ......................................................................................... 5 1.5.2 Spreading Ground Update.................................................................................... 6
1.6 SUMMARY OF PROCEDURES.............................................................................................. 6
2 METHODS .................................................................................................................. 8
2.1 BOUNDING FUTURE CLIMATE PROJECTIONS .................................................................... 8 2.2 WMMS INFRASTRUCTURE REMODEL ............................................................................. 15
2.2.1 Dam/Reservoir Remodel .................................................................................... 15 2.2.2 Spreading Ground Remodel .............................................................................. 18
2.3 INFRASTRUCTURE ANALYSIS ........................................................................................... 19 2.3.1 Dams/Reservoirs ................................................................................................. 19 2.3.2 Spreading Grounds ............................................................................................. 22 2.3.3 Major Channel Outlets ........................................................................................ 26
3 RESULTS AND DISCUSSION ................................................................................ 29
3.1 DAMS/RESERVOIRS ......................................................................................................... 32 3.1.1 LACFCD Dams..................................................................................................... 32 3.1.2 USACE Dams ....................................................................................................... 33
3.2 SPREADING GROUNDS .................................................................................................... 33 3.3 CHANNEL OUTLETS ......................................................................................................... 35 3.4 INFRASTRUCTURE BY WATERSHED ................................................................................. 36
4 CONCLUSION ......................................................................................................... 39
4.1 DAMS/RESERVOIRS ......................................................................................................... 39 4.1.1 LACFCD Dams..................................................................................................... 39 4.1.2 USACE Dams ....................................................................................................... 40
4.2 SPREADING GROUNDS .................................................................................................... 41 4.3 CHANNEL OUTLETS ......................................................................................................... 42 4.4 FUTURE CONSIDERATIONS .............................................................................................. 42
5 REFERENCES ......................................................................................................... 44
Los Angeles Basin Study Task 4 Existing Infrastructure Response Report
ii
Figures Page
Figure ES-1. Task 4 Existing Infrastructure Response Results ES-4
Figure 1. Los Angeles Basin Stormwater Conservation Study Watersheds 2
Figure 2. Los Angeles Basin Stormwater Conservation Facilities 3
Figure 3. Los Angeles Basin Major Channel Outlets and their Watersheds 3
Figure 4. Stormwater Conservation Facilities Remodel 5
Figure 5. Bounding Climate Change Scenarios Overview 6
Figure 6. Process to Determine Bounding Climate Projections 8
Figure 7. Projection Spaghetti Plot 9
Figure 8. Projection Percentile Curves 10
Figure 9. Lower, Central, and Upper Bound Curves 10
Figure 10. Future Climate Scenario Subset – Annual Stormwater Runoff 12
Figure 11. Future Climate Scenario Subset – Peak Flow Rates 12
Figure 12. Future Climate Scenario Subset – Average Reservoir Volume 13
Figure 13. Future Climate Scenario Subset – Peak Reservoir Volume 13
Figure 14. Projection Variations 14
Figure 15. WMMS Reservoir F-table Remodel 17
Figure 16. Spreading Ground Remodel Schematic 18
Figure 17. Total Stormwater Recharge vs. Total Potential Stormwater 24
Figure 18. High Efficiency Spreading Ground 25
Figure 19. Low Efficiency Spreading Ground 26
Figure 20. Los Angeles River Watershed Infrastructure Results 37
Figure 21. San Gabriel River Watershed Infrastructure Results 38

Los Angeles Basin Study Task 4 Existing Infrastructure Response Report
iii
Tables Page
Table ES-1. Dam Water Conservation Performance Levels ES-2
Table ES-2. Spreading Ground Water Conservation Performance Levels ES-2
Table ES-3. Major Channel Outlet Assessment Levels ES-3
Table 1. Selected Future Climate Projections 11
Table 2. Performance Levels (Dams & Spreading Grounds) 29
Table 3. Assessment Levels (Channel Outlets) 30
Table 4. LACFCD Dam Analysis Results 32
Table 5. USACE Dam Analysis Results 33
Table 6. Spreading Ground Analysis Results 34
Table 7. Channel Outlet Analysis Results 35
Table 8. Performance Levels by Watershed – LACFCD Dams 40
Table 9. Performance Levels by Watershed – USACE Dams 40
Table 10. Performance Levels by Watershed – Spreading Grounds 41
Table 11. Assessment Levels by Watershed – Major Channel Outlets 42
Appendix Appendix: Existing Infrastructure Ranking Evaluation
Los Angeles Basin Study Task 4 Existing Infrastructure Response Report
iv
Acronyms and Abbreviations
ac-ft acre-foot (1 ac-ft = 43,560 ft3). Variant (af)
CMIP5-BCCA Bias Correction Constructed Analogue Coupled Model
Intercomparision Project, Phase 5
F-Table Hydrologic Function Table
LA Basin Study Los Angeles Basin Stormwater Conservation Study
LACFCD Los Angeles County Flood Control District
LSPC Loading Simulation Program in C++, synonymous with
WMMS in this report
PMF Probable Maximum Flood
RCP2.6 Representative Concentration Pathway representing a future
high mitigation scenario, with a mean radiative forcing value of
2.6 W/m2 in the year 2100
RCP8.5 Representative Concentration Pathway representing a future
“business-as-usual” scenario, with a mean radiative forcing
value of 8.5 W/m2 in the year 2100
Reclamation U.S. Department of the Interior, Bureau of Reclamation
USACE U.S. Army Corps of Engineers
WMMS Watershed Management Modeling System
Los Angeles Basin Study Task 4 Existing Infrastructure Response Report
v
Glossary
Basin Study Watersheds (Study Area): The Los Angeles River, San Gabriel
River, South Santa Monica Bay, Ballona Creek, North Santa Monica Bay, Malibu
Creek, and Dominguez Channel/Los Angeles Harbor watersheds.
Capture Efficiency: The ratio of total recharge captured versus the total
stormwater potential at a specific facility. Potential combines both what was
captured and what bypassed, representing the total possible amount of stormwater
moving through a facility.
Climate Projection: A set of future weather projections (e.g. precipitation and
evaporation) based on a single climate model. Task 4 uses 6 climate projections.
F-Table: Hydrologic function table. Used to simulate operations guidelines for
stormwater facilities and is a generalized volume versus discharge curve. WMMS
F-Tables control the discharge rate at specific volumes within the model.
Future Period: Projected water years 2012 through 2095.
Historic Period: Historic record, water years 1987 through 2000.
LSPC: Loading Simulation Program in C++, the hydrologic simulation program
within WMMS.
Operation Guidelines: A set of recommended instructions that provide guidance
on how to efficiently and safely operate a water conservation or flood control
facility based on different stream or reservoir conditions.
Probable Maximum Flood (PMF): A flooding event that results from the most
severe combination of critical meteorological and hydrologic conditions that are
reasonably possible in the region.
Rating Curve: Relationship between a reservoir water surface elevation or
storage volume, and the outflow or discharge from a dam.
Spaghetti Plot: A method for viewing large amounts of data to help visualize
select representative climate projections such as the controlling upper and lower
bound, or most extreme climate cases.
Spillway Event: A storm event where the reservoir water surface elevation
behind a dam is at or above the spillway crest elevation and is discharging flows.
Water Control Manual: USACE equivalent of dam operation guidelines.
Water Year: The 12-month period between October 1st through September 30
th
for any given year. Water years are written as the ending year (i.e., water year
1986-87 is written as 1987).

Los Angeles Basin Study Task 4 Existing Infrastructure Response Report
vi
This page intentionally left blank.
Los Angeles Basin Study Task 4 Existing Infrastructure Response Report
ES-1
Executive Summary
The Los Angeles County Flood Control District (LACFCD) partnered with the
U.S. Department of the Interior, Bureau of Reclamation (Reclamation) to
collaborate on the Los Angeles Basin Stormwater Conservation Study (LA Basin
Study). The purpose of the LA Basin Study is to investigate long-range water
conservation and flood risk impacts caused by projected changes in climate
conditions and population in the Los Angeles region. The LA Basin Study will
recommend potential modifications or changes in the operation of the existing
stormwater capture systems as well as the development of new facilities that
could help resolve future water supply and flood risk issues. These
recommendations will be developed by identifying alternatives and conducting
trade-off analyses.
For Task 4, Existing Infrastructure Response and Operations Guidelines Analysis
of the LA Basin Study, Reclamation, the U.S. Army Corps of Engineers
(USACE), and the LACFCD jointly analyzed the major components of the water
conservation and flood risk mitigation system. For the analysis, Reclamation
assessed the 14 major LACFCD dams and reservoirs, USACE analyzed their 4
major flood control dams in the region, and LACFCD assessed the 26 major
spreading grounds interconnected to the water conservation system. The
LACFCD also evaluated 5 major channel outlets. This report summarizes the
data, methods, and results of the existing infrastructure response to the historic
climate and future projections.
The purpose of Task 4 is to assess the response of existing infrastructure and
analyze the operation guidelines under both the current and future climate
conditions. It is important to recognize that this effort relies upon the existing
configuration of the water conservation and flood risk mitigation network as the
baseline condition.
This evaluation includes a ranking assessment of the current and future
stormwater volumes conserved or discharged, and other impacts to the water
conservation and flood risk mitigation system. The following sub-tasks were
identified to conduct this assessment:
Response to Current Climate (Water Year 1987 through 2000)
o Analyze stormwater volumes conserved or discharged
o Analyze infrastructure response and operations guidelines
Response to Future Climate (Water Year 2012 through 2095)
o Analyze stormwater volumes conserved or discharged
o Analyze infrastructure response and operations guidelines
Los Angeles Basin Study Task 4 Existing Infrastructure Response Report
ES-2
The response to the current climate provided a representation of the existing
situation and revealed how the existing infrastructure could reasonably be
expected to perform under a historical climate to which the region has become
accustomed. However, this may not be the case in the future. The response to
future climate assessed the existing infrastructure under varying climate
conditions to understand if it would function satisfactorily. This analysis of the
existing infrastructure served as a status quo assessment of historical conditions as
well as a “no action” evaluation of the future.
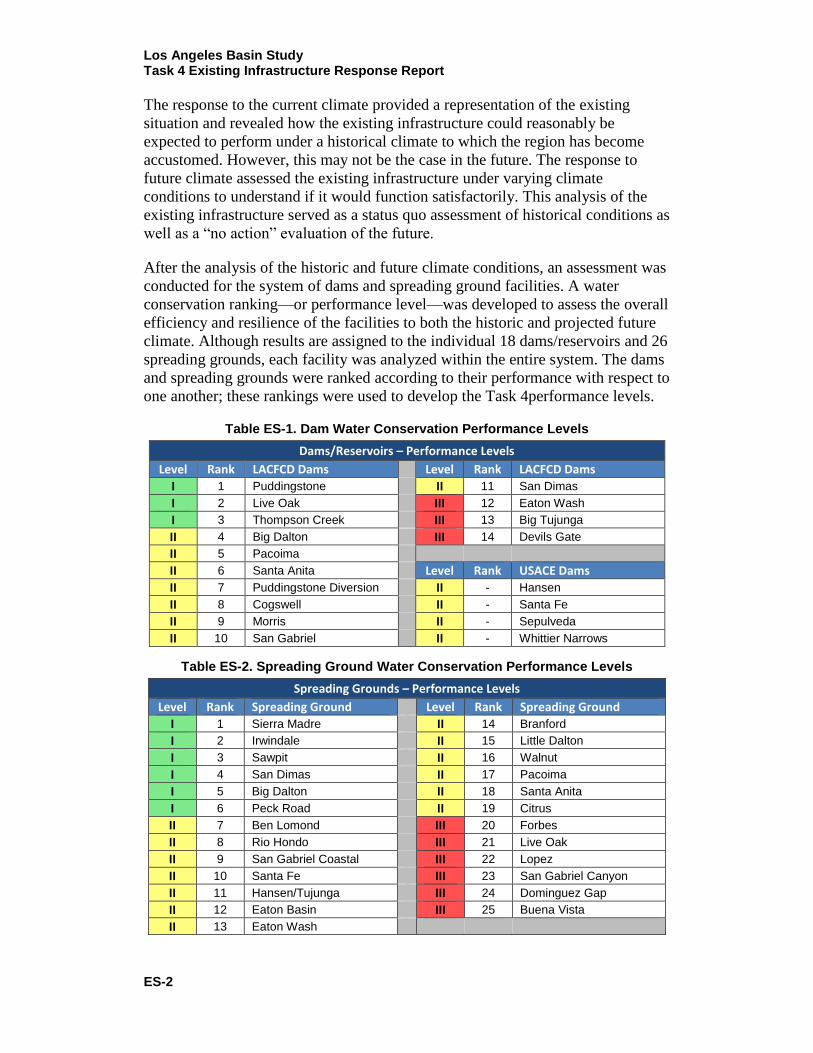
After the analysis of the historic and future climate conditions, an assessment was
conducted for the system of dams and spreading ground facilities. A water
conservation ranking—or performance level—was developed to assess the overall
efficiency and resilience of the facilities to both the historic and projected future
climate. Although results are assigned to the individual 18 dams/reservoirs and 26
spreading grounds, each facility was analyzed within the entire system. The dams
and spreading grounds were ranked according to their performance with respect to
one another; these rankings were used to develop the Task 4performance levels.
Table ES-1. Dam Water Conservation Performance Levels
Dams/Reservoirs – Performance Levels
Level Rank LACFCD Dams
Level Rank LACFCD Dams
I 1 Puddingstone
II 11 San Dimas
I 2 Live Oak
III 12 Eaton Wash
I 3 Thompson Creek
III 13 Big Tujunga
II 4 Big Dalton
III 14 Devils Gate
II 5 Pacoima
II 6 Santa Anita
Level Rank USACE Dams
II 7 Puddingstone Diversion
II - Hansen
II 8 Cogswell
II - Santa Fe
II 9 Morris
II - Sepulveda
II 10 San Gabriel
II - Whittier Narrows
Table ES-2. Spreading Ground Water Conservation Performance Levels
Spreading Grounds – Performance Levels
Level Rank Spreading Ground Level Rank Spreading Ground
I 1 Sierra Madre II 14 Branford
I 2 Irwindale II 15 Little Dalton
I 3 Sawpit II 16 Walnut
I 4 San Dimas II 17 Pacoima
I 5 Big Dalton II 18 Santa Anita
I 6 Peck Road II 19 Citrus
II 7 Ben Lomond III 20 Forbes
II 8 Rio Hondo III 21 Live Oak
II 9 San Gabriel Coastal III 22 Lopez
II 10 Santa Fe III 23 San Gabriel Canyon
II 11 Hansen/Tujunga III 24 Dominguez Gap
II 12 Eaton Basin III 25 Buena Vista
II 13 Eaton Wash
Los Angeles Basin Study Task 4 Existing Infrastructure Response Report
ES-3
Generally, facilities that were the least efficient resulted in being the least resilient
to climate change and were assigned Performance Level III which has a high
potential for enhancements. Facilities that were generally more efficient were
more resilient to climate change and were assigned Performance Level II. Finally,
facilities that were the most efficient tended to be the most resilient to climate
change and were assigned to Performance Level I.
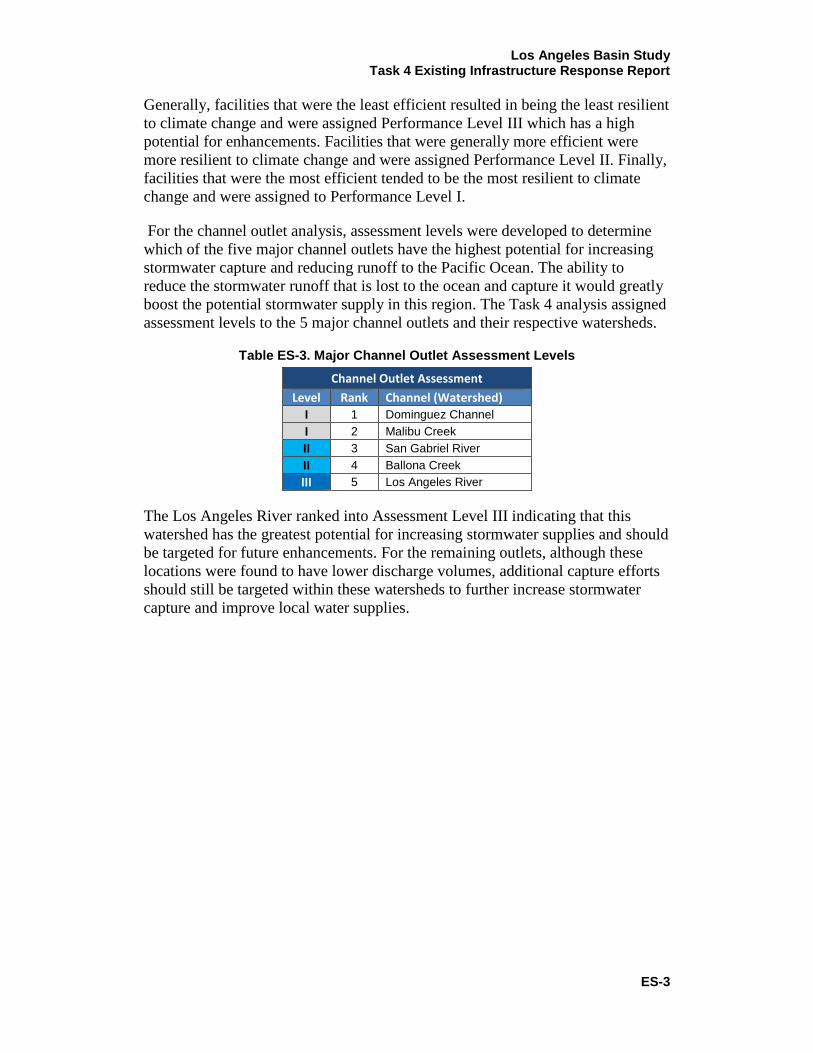
For the channel outlet analysis, assessment levels were developed to determine
which of the five major channel outlets have the highest potential for increasing
stormwater capture and reducing runoff to the Pacific Ocean. The ability to
reduce the stormwater runoff that is lost to the ocean and capture it would greatly
boost the potential stormwater supply in this region. The Task 4 analysis assigned
assessment levels to the 5 major channel outlets and their respective watersheds.
Table ES-3. Major Channel Outlet Assessment Levels
Channel Outlet Assessment
Level Rank Channel (Watershed)
I 1 Dominguez Channel
I 2 Malibu Creek
II 3 San Gabriel River
II 4 Ballona Creek
III 5 Los Angeles River
The Los Angeles River ranked into Assessment Level III indicating that this
watershed has the greatest potential for increasing stormwater supplies and should
be targeted for future enhancements. For the remaining outlets, although these
locations were found to have lower discharge volumes, additional capture efforts
should still be targeted within these watersheds to further increase stormwater
capture and improve local water supplies.
Los Angeles Basin Study Task 4 Existing Infrastructure Response Report
ES-4
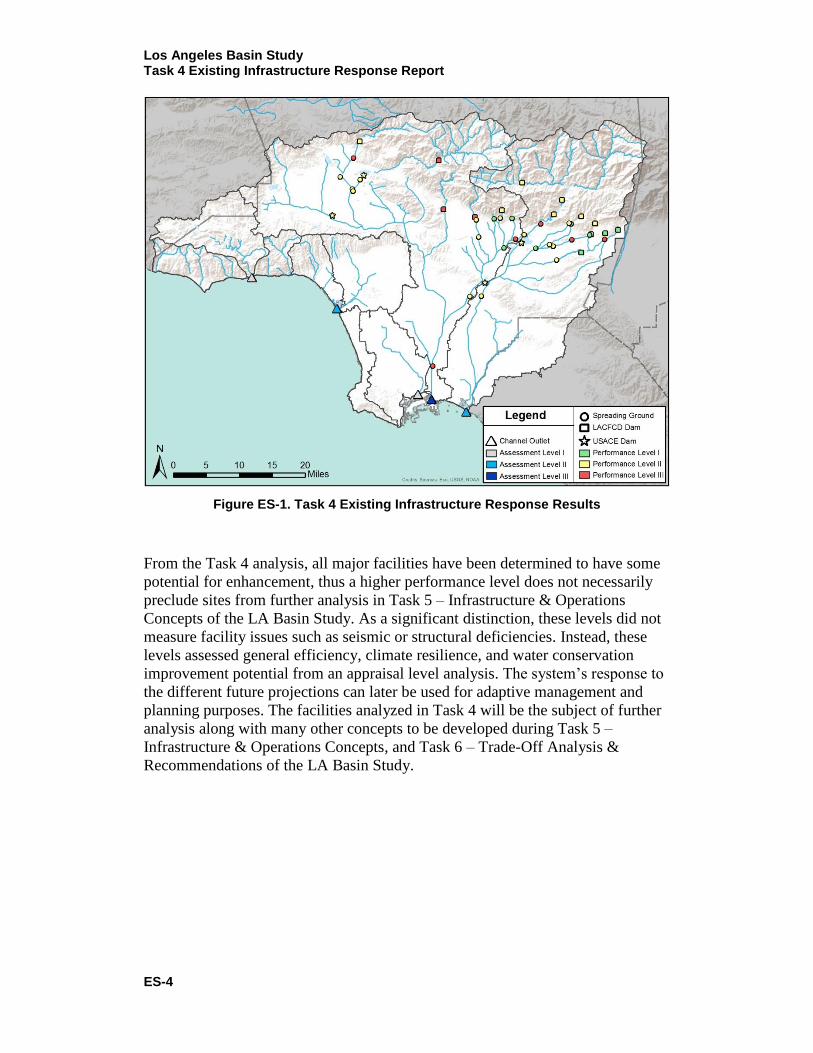
Figure ES-1. Task 4 Existing Infrastructure Response Results
From the Task 4 analysis, all major facilities have been determined to have some
potential for enhancement, thus a higher performance level does not necessarily
preclude sites from further analysis in Task 5 – Infrastructure & Operations
Concepts of the LA Basin Study. As a significant distinction, these levels did not
measure facility issues such as seismic or structural deficiencies. Instead, these
levels assessed general efficiency, climate resilience, and water conservation
improvement potential from an appraisal level analysis. The system’s response to
the different future projections can later be used for adaptive management and
planning purposes. The facilities analyzed in Task 4 will be the subject of further
analysis along with many other concepts to be developed during Task 5 –
Infrastructure & Operations Concepts, and Task 6 – Trade-Off Analysis &
Recommendations of the LA Basin Study.
Los Angeles Basin Study Task 4 Existing Infrastructure Response Report
1
1 Introduction
1.1 Study Purpose
The purpose of the LA Basin Study is to study long-term water conservation and
flood risk impacts from projected climate conditions and population changes in
the region. The LA Basin Study will recommend potential changes to the
operation of stormwater capture systems, modifications to existing facilities, and
development of new facilities that could help resolve future water supply and
flood risk issues. The recommendations will be developed through identifying
alternatives and conducting trade-off analyses.
The purpose of Task 4 is to assess the response of existing infrastructure and
analyze the operation guides under both the current and future climate conditions.
1.2 Study Background
The LACFCD is considering large-scale enhancements to its water conservation
capabilities to better meet the long-term projected needs of the Los Angeles
region and also to be more prepared for and resilient to future climate conditions.
From informal discussions between LACFCD and several major water agencies,
this consideration was the driving force for creating the partnership between the
LACFCD and Reclamation under the Basin Studies Program (Reclamation 2009).
The LA Basin Study utilizes the latest climate science and hydrologic modeling
tools available to create a vision of the near-term and long-term future of
stormwater capture within the Los Angeles basin. The LA Basin Study provides
the opportunity for multiple water management agencies to participate in a
collaborative process to plan for future local water supply scenarios. The LA
Basin Study will examine opportunities to enhance existing LACFCD and other
government or local agency facilities, and to develop new facilities to provide
direct benefits to water agencies and local communities.
The LA Basin Study will consider technical viability of implementing innovative
facility concepts that show a prospective for increasing infiltrative capacity to
recharge groundwater. A trade-off analysis and adaptive planning process will be
conducted to evaluate the regional impacts and the economic costs and benefits of
the various stormwater capture alternatives. Additionally, the study will look at
the costs of attaining different goals through a cost-effectiveness analysis. The
final outcome and recommendations of the LA Basin Study concept development
and trade-off analyses will serve as a guiding document for further local water
supply development planning, financing strategy, and policy adoption by the
LACFCD and other LA Basin Study partners.

Los Angeles Basin Study Task 4 Existing Infrastructure Response Report
2
1.3 Description of Study Area
The Los Angeles River, San Gabriel River, South Santa Monica Bay, North Santa
Monica Bay, Ballona Creek, Malibu Creek, and Dominguez Channel/Los Angeles
Harbor watersheds (Basin Study Watersheds) are the focus of this LA Basin
Study and are shown in Figure 1. This study incorporates the entire watershed
boundaries, including where they extend beyond the County of Los Angeles. For
Task 4, the existing dam, spreading ground facilities, and major channel outlets
within the study area have been analyzed.
Figure 1. Los Angeles Basin Stormwater Conservation Study Watersheds
The LACFCD’s 14 major dams and reservoirs, shown in Figure 2, are located in
the front range of the San Gabriel Mountains stretching more than 40 miles from
the San Fernando Valley on the west to the eastern edge of the San Gabriel Valley
(Los Angeles County Department of Public Works 2013). The largely
undeveloped watershed area upstream of the LACFCD dams is approximately
418 square miles with majority of it falling within the Angeles National Forest.
The system also includes 4 major USACE dams which are primarily used for
flood control purposes currently. Spreading grounds, which serve to infiltrate
stormwater runoff, are located in areas of high permeability downstream from the
major LACFCD and USACE dams. The region’s major channel outlets to the
Pacific Ocean and their respective watersheds are shown in Figure 3. Conceptual
water conservation enhancements to these facilities will occur during Task 5.
Los Angeles Basin Study Task 4 Existing Infrastructure Response Report
3
Figure 2. Los Angeles Basin Stormwater Conservation Facilities
Figure 3. Los Angeles Basin Major Channel Outlets and their Watersheds
Los Angeles Basin Study Task 4 Existing Infrastructure Response Report
4
The Basin Study Watersheds contain more than 9 million people and cover
approximately 2,000 square miles. More than 95 percent of Los Angeles County’s
population resides within the LA Basin Study area. This population concentration
also accounts for nearly one-fourth of the State of California’s population.
Presently, California’s population is 37.3 million people and the County of Los
Angeles’ population is almost 9.8 million. By 2050, the populations of California
and the County of Los Angeles are projected to reach approximately 50.3 million
and 11.4 million, respectively.
The State’s population as a whole is projected to increase by more than 34
percent, while Los Angeles County’s is projected to increase by approximately 16
percent by 2050 (Department of Finance 2013). Projected larger population
growth rates outside of Los Angeles County indicate that there will be higher
competition for imported sources of water and higher pressure to increased
development of local water supply sources. At present, Los Angeles County
accounts for the largest amount of water demand of any urbanized county in
California. Total water usage within the Los Angeles County portion of the
Metropolitan Water District of Southern California (MWD) service area exceeded
1.54 million acre-feet in fiscal year 2011-12 (MWD 2012).
1.4 Hydrology Model Used for Study
The Watershed Management Modeling System (WMMS) was used for the
historic and projected hydrologic modeling for Task 4. The Loading Simulation
Program in C++ (LSPC) is the underlying hydrologic program within WMMS
that performs the simulations. LSPC was used to simulate the hydrologic runoff
and volume outputs for all reservoirs, spreading facilities, and major channel
outlets within the LACFCD system. For simplicity, LSPC will be referred as
either WMMS or the model in this report.
1.5 Facility Modeling
Although WMMS is the primary hydrologic model used for the LA Basin Study,
other models were used to help remodel or construct more accurate reservoir
rating curves for WMMS. The dam and reservoir operational characteristics were
fine-tuned within these external models and the resulting rating curves were
converted to WMMS F-tables for the system-wide simulations. For the update, all
14 major LACFCD dams, 4 major USACE dams, and the 26 major spreading
facilities within the study area were modified. However, the major channel outlets
did not require a remodel and remained unchanged. The remodel was conducted
in different stages by LACFCD, Reclamation, and the USACE.
Los Angeles Basin Study Task 4 Existing Infrastructure Response Report
5
Figure 4. Stormwater Conservation Facilities Remodel
Facility Remodel
Major Dams
LACFCD
14
Army Corps
4
Major Spreading Facilities
Los Angeles Basin
26
No Remodel
Major Channel Outlets
5
1.5.1 Dam/Reservoir Models
The LACFCD dams and reservoirs were evaluated by Reclamation using the
Modified Puls level-pool reservoir routing method to model dam releases,
concentrating specifically on spillway discharges for historical events with large
flows. By incorporating recent reservoir surveys to account for current sediment
buildup conditions, updated reservoir rating curves were developed which were
then converted to F-tables for input into WMMS. This process is discussed further
in Section 2.2.1.
For USACE dams, existing outlet and spillway rating curves were used as a
starting point for the analysis to develop the F-tables for input into WMMS.
Recent reservoir surveys were also incorporated into the rating curves to account
for current sediment buildup conditions. A comparison between historic releases
and the current water control manuals was conducted to determine if and when
any major variations to the operating plan occurred. The approved operating
schedules for USACE dams have changed over the historic period; all 4 major
USACE dams have usually been operated closely to the scheduled releases with
only minor variations. Per the water control manuals, as reservoir stages behind
USACE dams approach spillway the outlet gates are closed on a step-wise basis
in an effort to maintain the downstream channel capacity for as long as possible,
which leads to fluctuating releases. Therefore, the curves were smoothed out
before being converted to WMMS F-tables.
Los Angeles Basin Study Task 4 Existing Infrastructure Response Report
6
1.5.2 Spreading Ground Update
To improve the modeling of the spreading facilities, an update was made to the
WMMS flow network. This modification involved adding a forebay and inlet
structure component to the majority of the spreading facilities so that WMMS
could better model a flashy storm bypassing the spreading ground. This
operational characteristic was previously not been included in the hydrologic
modeling and—out of necessity to improve the model for these more detailed
simulations—has now been accounted for. This process is discussed further in
Section 2.2.2.
1.6 Summary of Procedures
For the existing infrastructure response, this effort built upon the work previously
completed by Reclamation and the LACFCD during Task 3:
Task 3.1 – Development of Climate-Adjusted Hydrologic Model Inputs
Task 3.2 – Hydrologic Modeling Report
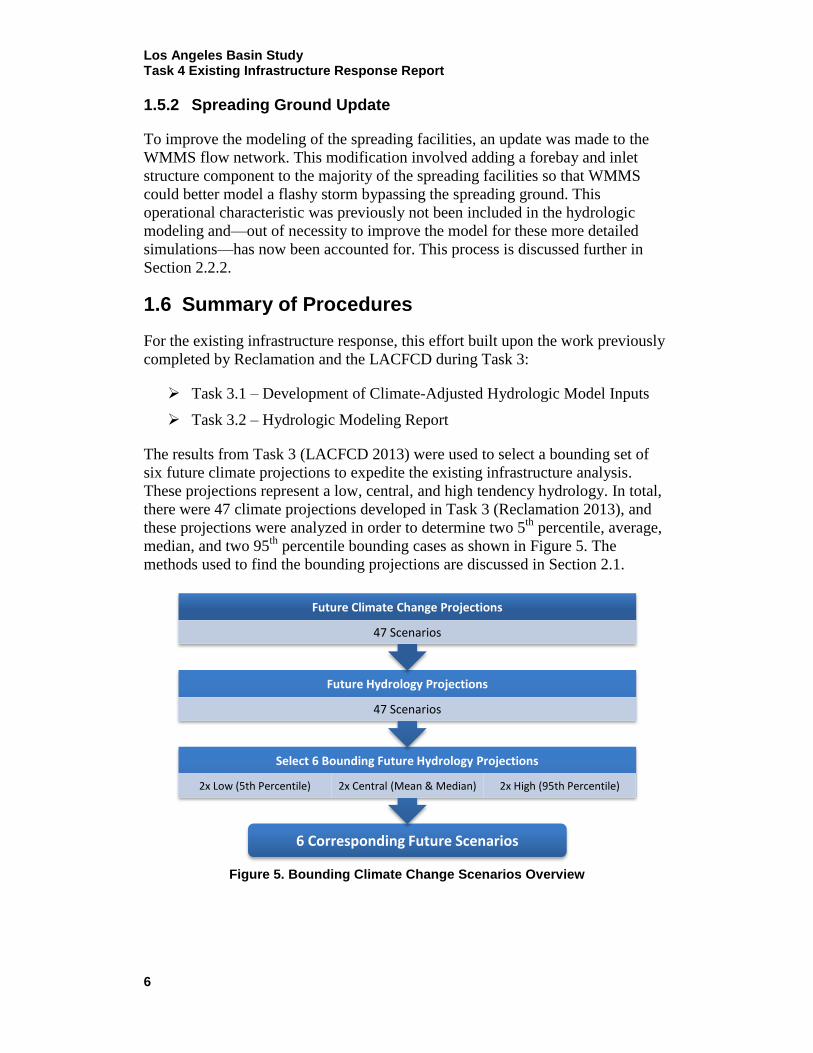
The results from Task 3 (LACFCD 2013) were used to select a bounding set of
six future climate projections to expedite the existing infrastructure analysis.
These projections represent a low, central, and high tendency hydrology. In total,
there were 47 climate projections developed in Task 3 (Reclamation 2013), and
these projections were analyzed in order to determine two 5th
percentile, average,
median, and two 95th
percentile bounding cases as shown in Figure 5. The
methods used to find the bounding projections are discussed in Section 2.1.
Figure 5. Bounding Climate Change Scenarios Overview
6 Corresponding Future Scenarios
Select 6 Bounding Future Hydrology Projections
2x Low (5th Percentile) 2x Central (Mean & Median) 2x High (95th Percentile)
Future Hydrology Projections
47 Scenarios
Future Climate Change Projections
47 Scenarios
Los Angeles Basin Study Task 4 Existing Infrastructure Response Report
7
The six corresponding climate change scenarios were then used in WMMS to
simulate the response of the existing infrastructure. The output for each of the
dams, spreading ground facilities, and major channel outlets were then analyzed
to better understand how efficient or resilient each of the facilities were to the
varying future climatic conditions.
The 18 major dams within the system were analyzed primarily for yearly
variations of stormwater captured and released, as well as the frequency of
spillway events. The 26 major spreading grounds were analyzed for variations in
stormwater conservation. Lastly, the major channel outlets were analyzed for the
amount of stormwater runoff that is discharged to the ocean.
The main purpose of the LA Basin Study Task 4 is to investigate how the current
infrastructure, as it exists today, will respond to changes caused by future climate
variations. Each of the dams, spreading grounds, and major channel outlets that
make up the system were analyzed to gain a better understanding of the impacts
of climate change. Task 4 is a precursor to the development of concepts in Task 5.
The current infrastructure response assumes that no modifications to the water
conservation and flood risk mitigation system will occur from the present through
2095. While this “no action” future is not intended to be a realistic depiction, this
critical assumption does provide a baseline condition for Task 5 when new or
existing concepts are investigated further.
Los Angeles Basin Study Task 4 Existing Infrastructure Response Report
8
2 Methods
This section details the procedures used to analyze and rank all 18 major dams, 26
major spreading facilities, and 5 major channel outlets based on a number of
different ranking criteria. A smaller subset of climate change scenarios was
targeted and a number of steps were taken to prepare the WMMS model.
Section 2.1. details the procedure to select the subset of low, central, and high
bounding future climate projections.
Section 2.2. details the model improvement process of the dams and spreading
grounds.
Section 2.3. details the methods used to analyze the dams, spreading grounds,
and channel outlets as well as their subsequent performance level ranking.
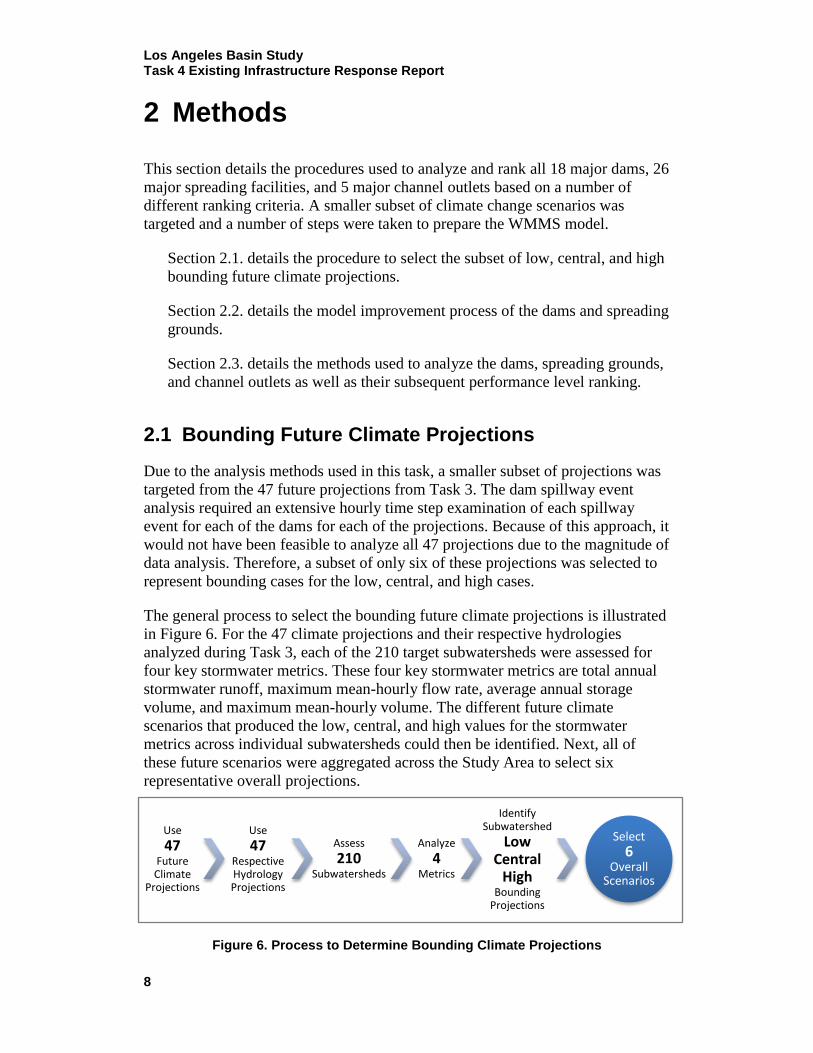
2.1 Bounding Future Climate Projections
Due to the analysis methods used in this task, a smaller subset of projections was
targeted from the 47 future projections from Task 3. The dam spillway event
analysis required an extensive hourly time step examination of each spillway
event for each of the dams for each of the projections. Because of this approach, it
would not have been feasible to analyze all 47 projections due to the magnitude of
data analysis. Therefore, a subset of only six of these projections was selected to
represent bounding cases for the low, central, and high cases.
The general process to select the bounding future climate projections is illustrated
in Figure 6. For the 47 climate projections and their respective hydrologies
analyzed during Task 3, each of the 210 target subwatersheds were assessed for
four key stormwater metrics. These four key stormwater metrics are total annual
stormwater runoff, maximum mean-hourly flow rate, average annual storage
volume, and maximum mean-hourly volume. The different future climate
scenarios that produced the low, central, and high values for the stormwater
metrics across individual subwatersheds could then be identified. Next, all of
these future scenarios were aggregated across the Study Area to select six
representative overall projections.
Figure 6. Process to Determine Bounding Climate Projections
Use
47 Future Climate
Projections
Use
47 Respective Hydrology Projections
Assess
210 Subwatersheds
Analyze
4 Metrics
Identify Subwatershed
Low Central
High Bounding
Projections
Select 6
Overall Scenarios
Los Angeles Basin Study Task 4 Existing Infrastructure Response Report
9
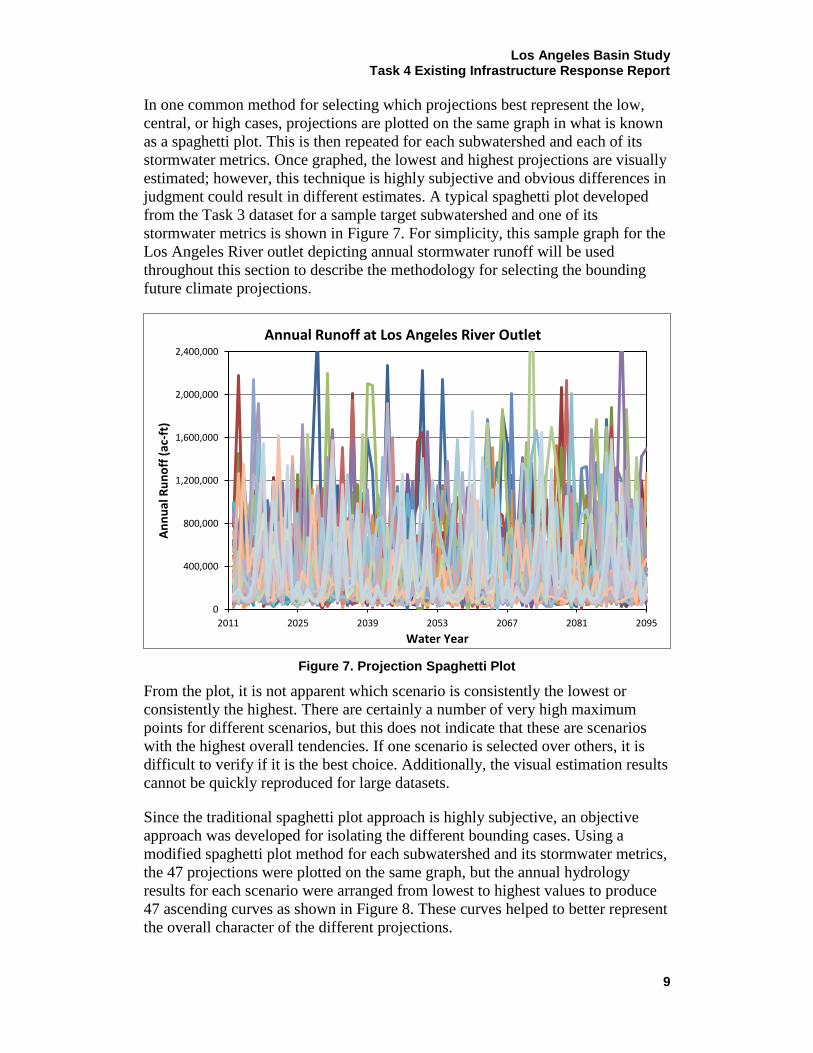
In one common method for selecting which projections best represent the low,
central, or high cases, projections are plotted on the same graph in what is known
as a spaghetti plot. This is then repeated for each subwatershed and each of its
stormwater metrics. Once graphed, the lowest and highest projections are visually
estimated; however, this technique is highly subjective and obvious differences in
judgment could result in different estimates. A typical spaghetti plot developed
from the Task 3 dataset for a sample target subwatershed and one of its
stormwater metrics is shown in Figure 7. For simplicity, this sample graph for the
Los Angeles River outlet depicting annual stormwater runoff will be used
throughout this section to describe the methodology for selecting the bounding
future climate projections.
Figure 7. Projection Spaghetti Plot
0
400,000
800,000
1,200,000
1,600,000
2,000,000
2,400,000
2011 2025 2039 2053 2067 2081 2095
An
nu
al R
un
off
(ac
-ft)
Water Year
Annual Runoff at Los Angeles River Outlet
From the plot, it is not apparent which scenario is consistently the lowest or
consistently the highest. There are certainly a number of very high maximum
points for different scenarios, but this does not indicate that these are scenarios
with the highest overall tendencies. If one scenario is selected over others, it is
difficult to verify if it is the best choice. Additionally, the visual estimation results
cannot be quickly reproduced for large datasets.
Since the traditional spaghetti plot approach is highly subjective, an objective
approach was developed for isolating the different bounding cases. Using a
modified spaghetti plot method for each subwatershed and its stormwater metrics,
the 47 projections were plotted on the same graph, but the annual hydrology
results for each scenario were arranged from lowest to highest values to produce
47 ascending curves as shown in Figure 8. These curves helped to better represent
the overall character of the different projections.
Los Angeles Basin Study Task 4 Existing Infrastructure Response Report
10
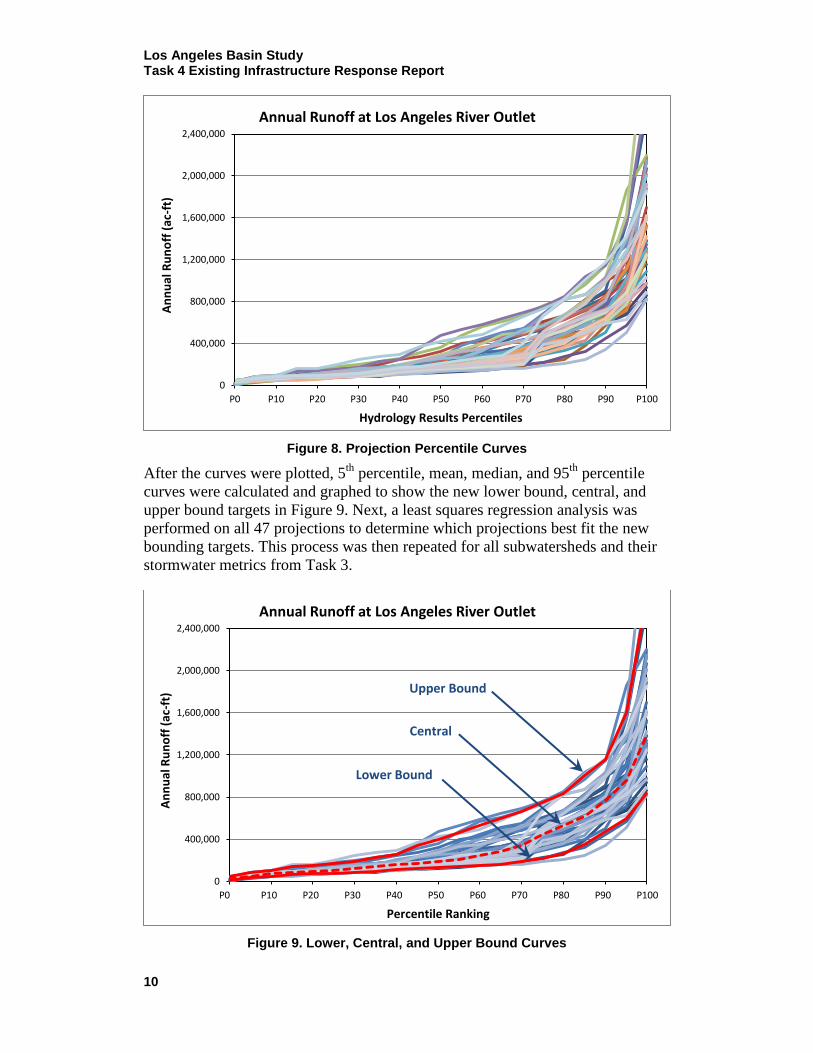
Figure 8. Projection Percentile Curves
0
400,000
800,000
1,200,000
1,600,000
2,000,000
2,400,000
P0 P10 P20 P30 P40 P50 P60 P70 P80 P90 P100
An
nu
al R
un
off
(ac
-ft)
Hydrology Results Percentiles
Annual Runoff at Los Angeles River Outlet
After the curves were plotted, 5th
percentile, mean, median, and 95th
percentile
curves were calculated and graphed to show the new lower bound, central, and
upper bound targets in Figure 9. Next, a least squares regression analysis was
performed on all 47 projections to determine which projections best fit the new
bounding targets. This process was then repeated for all subwatersheds and their
stormwater metrics from Task 3.
Figure 9. Lower, Central, and Upper Bound Curves
0
400,000
800,000
1,200,000
1,600,000
2,000,000
2,400,000
P0 P10 P20 P30 P40 P50 P60 P70 P80 P90 P100
An
nu
al R
un
off
(ac
-ft)
Percentile Ranking
Annual Runoff at Los Angeles River Outlet
Lower Bound
Central
Upper Bound
Los Angeles Basin Study Task 4 Existing Infrastructure Response Report
11
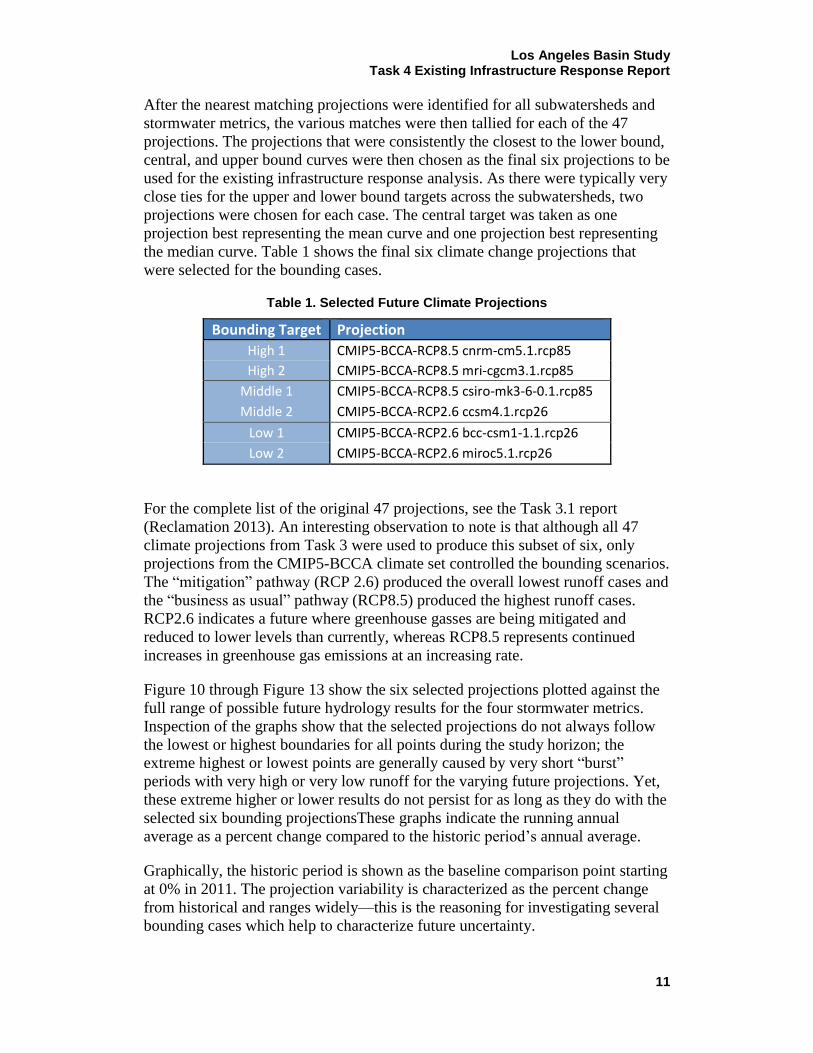
After the nearest matching projections were identified for all subwatersheds and
stormwater metrics, the various matches were then tallied for each of the 47
projections. The projections that were consistently the closest to the lower bound,
central, and upper bound curves were then chosen as the final six projections to be
used for the existing infrastructure response analysis. As there were typically very
close ties for the upper and lower bound targets across the subwatersheds, two
projections were chosen for each case. The central target was taken as one
projection best representing the mean curve and one projection best representing
the median curve. Table 1 shows the final six climate change projections that
were selected for the bounding cases.
Table 1. Selected Future Climate Projections
Bounding Target Projection
High 1 CMIP5-BCCA-RCP8.5 cnrm-cm5.1.rcp85
High 2 CMIP5-BCCA-RCP8.5 mri-cgcm3.1.rcp85
Middle 1 CMIP5-BCCA-RCP8.5 csiro-mk3-6-0.1.rcp85
Middle 2 CMIP5-BCCA-RCP2.6 ccsm4.1.rcp26
Low 1 CMIP5-BCCA-RCP2.6 bcc-csm1-1.1.rcp26
Low 2 CMIP5-BCCA-RCP2.6 miroc5.1.rcp26
For the complete list of the original 47 projections, see the Task 3.1 report
(Reclamation 2013). An interesting observation to note is that although all 47
climate projections from Task 3 were used to produce this subset of six, only
projections from the CMIP5-BCCA climate set controlled the bounding scenarios.
The “mitigation” pathway (RCP 2.6) produced the overall lowest runoff cases and
the “business as usual” pathway (RCP8.5) produced the highest runoff cases.
RCP2.6 indicates a future where greenhouse gasses are being mitigated and
reduced to lower levels than currently, whereas RCP8.5 represents continued
increases in greenhouse gas emissions at an increasing rate.
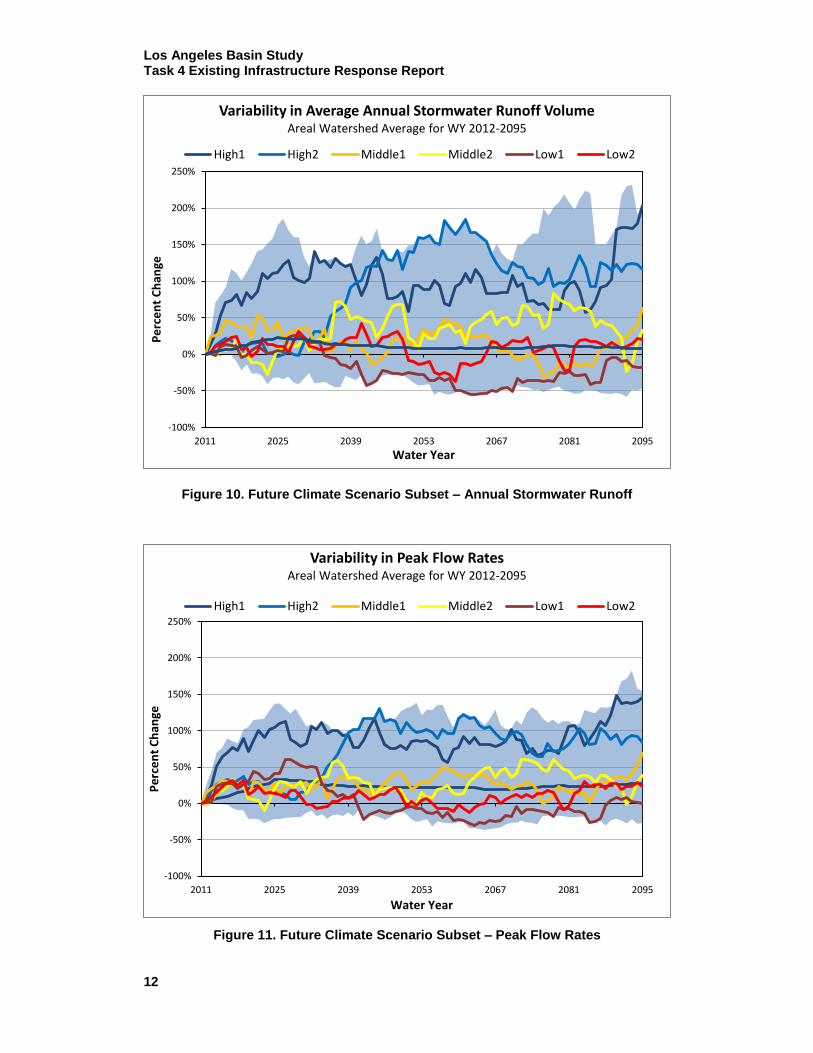
Figure 10 through Figure 13 show the six selected projections plotted against the
full range of possible future hydrology results for the four stormwater metrics.
Inspection of the graphs show that the selected projections do not always follow
the lowest or highest boundaries for all points during the study horizon; the
extreme highest or lowest points are generally caused by very short “burst”
periods with very high or very low runoff for the varying future projections. Yet,
these extreme higher or lower results do not persist for as long as they do with the
selected six bounding projectionsThese graphs indicate the running annual
average as a percent change compared to the historic period’s annual average.
Graphically, the historic period is shown as the baseline comparison point starting
at 0% in 2011. The projection variability is characterized as the percent change
from historical and ranges widely—this is the reasoning for investigating several
bounding cases which help to characterize future uncertainty.
Los Angeles Basin Study Task 4 Existing Infrastructure Response Report
12
Figure 10. Future Climate Scenario Subset – Annual Stormwater Runoff
Variability in Average Annual Stormwater Runoff Volume Areal Watershed Average for WY 2012-2095
250%
200%
150%
ge
an 100%hC t
nec 50%
rP
e
0%
-50%
-100%
2011 2025 2039 2053 2067 2081 2095
Water Year
High1 High2 Middle1 Middle2 Low1 Low2
Figure 11. Future Climate Scenario Subset – Peak Flow Rates
-100%
-50%
0%
50%
100%
150%
200%
250%
2011 2025 2039 2053 2067 2081 2095
Pe
rce
nt
Ch
ange
Water Year
Variability in Peak Flow Rates Areal Watershed Average for WY 2012-2095
High1 High2 Middle1 Middle2 Low1 Low2

Los Angeles Basin Study Task 4 Existing Infrastructure Response Report
13
Figure 12. Future Climate Scenario Subset – Average Reservoir Volume
Variability in Average Reservoir Volume Areal Watershed Average for WY 2012-2095
250%
200%
150%
eg
an 100%
Ch
t n
ec 50%
Pe
r
0%
-50%
-100%
2011 2025 2039 2053 2067 2081 2095
Water Year
High1 High2 Middle1 Middle2 Low1 Low2
Figure 13. Future Climate Scenario Subset – Peak Reservoir Volume
Variability in Peak Reservoir Volume Areal Watershed Average for WY 2012-2095
250%
200%
150%
eg
an 100%
Ch
t n
ec 50%
Pe
r
0%
-50%
-100%
2011 2025 2039 2053 2067 2081 2095
Water Year
High1 High2 Middle1 Middle2 Low1 Low2
Los Angeles Basin Study Task 4 Existing Infrastructure Response Report
14
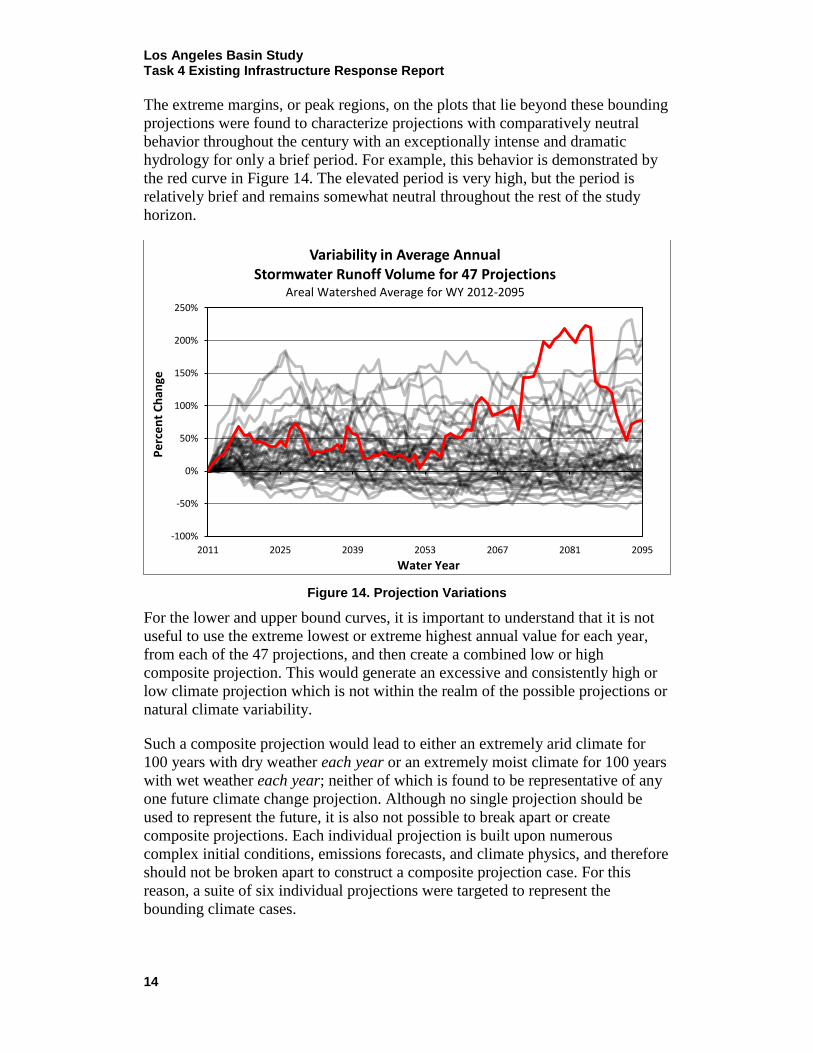
The extreme margins, or peak regions, on the plots that lie beyond these bounding
projections were found to characterize projections with comparatively neutral
behavior throughout the century with an exceptionally intense and dramatic
hydrology for only a brief period. For example, this behavior is demonstrated by
the red curve in Figure 14. The elevated period is very high, but the period is
relatively brief and remains somewhat neutral throughout the rest of the study
horizon.
Figure 14. Projection Variations
Variability in Average Annual Stormwater Runoff Volume for 47 Projections
Areal Watershed Average for WY 2012-2095 250%
200%
e 150%
gan
Ch 100%
t n
ec 50%
Pe
r
0%
-50%
-100%
2011 2025 2039 2053 2067 2081 2095
Water Year
For the lower and upper bound curves, it is important to understand that it is not
useful to use the extreme lowest or extreme highest annual value for each year,
from each of the 47 projections, and then create a combined low or high
composite projection. This would generate an excessive and consistently high or
low climate projection which is not within the realm of the possible projections or
natural climate variability.
Such a composite projection would lead to either an extremely arid climate for
100 years with dry weather each year or an extremely moist climate for 100 years
with wet weather each year; neither of which is found to be representative of any
one future climate change projection. Although no single projection should be
used to represent the future, it is also not possible to break apart or create
composite projections. Each individual projection is built upon numerous
complex initial conditions, emissions forecasts, and climate physics, and therefore
should not be broken apart to construct a composite projection case. For this
reason, a suite of six individual projections were targeted to represent the
bounding climate cases.
Los Angeles Basin Study Task 4 Existing Infrastructure Response Report
15
2.2 WMMS Infrastructure Remodel
Task 4 focuses on the major LACFCD dams, the major USACE flood control
dams, the region’s major spreading facilities, major channel outlets, and the
overall potential for increased conservation efforts at these sites. The water
conservation facilities within WMMS—with the exception of the major channel
outlets—were improved with more accurate discharge rating curves in order to
better evaluate the system’s response to the future climate.
Baseline conditions used for the Task 4 remodeling caused the simulated
historical values to differ from observed historical values in some cases. This
important notion is based upon a major premise:
The existing facilities are evaluated in their current state.
The purpose of Task 4 is to assess the response of existing infrastructure and
analyze the operation guidelines under both the current and future climate
conditions. Therefore, the current physical configuration and operations of
existing infrastructure were held constant in the WMMS modeling of the system
for both historical and future climate conditions. As a result, simulations did not
model how physical configurations or operations of any particular facility may
have changed over time throughout the historical period via construction projects
or changes in operation guidelines.
Section 2.2.1. describes the improvements that were employed to better
model spillway flows at LACFCD and USACE dams.
Section 2.2.2. describes the improvements that were employed to better
model the spreading grounds.
2.2.1 Dam/Reservoir Remodel
Discharges from LACFCD dams are regulated using valves at the dams for
reservoir stages below spillway crest elevations. The operation guidelines for the
dams allow considerable flexibility in operation of the valves to regulate releases
to downstream spreading grounds. Day to day operations of the dams are
influenced by field conditions including immediate and approaching weather
conditions. This operational variability posed a significant challenge in modeling
the projected hydrology. For reservoir stages above spillway crest elevation,
however, discharges are released through the spillway, which typically have no
operational controls.
Los Angeles Basin Study Task 4 Existing Infrastructure Response Report
16
Similarly, discharges from the four USACE dams are regulated using the gated
outlets for reservoir stages below spillway crest elevations. It should be noted that
Sepulveda and Hansen Dams also have some ungated outlets. The USACE dams
are operated primarily for flood control with the objective of passing the flow to
the downstream channel as quickly as possible without causing flood damage.
Day to day operations are directed by using operating plans as described in each
dam’s water control manual. Outlet gate settings are based on the reservoir water
surface elevation and are influenced from restrictions due to conditions such as
channel capacity, weather forecasts, and downstream maintenance or construction
projects. For reservoir stages above spillway crest elevation, discharges are
released through the spillway.
At the beginning of Task 3, a large-scale effort was undertaken to prepare
WMMS for simulating the future climate projections. Prior to this, all dam and
reservoir discharges were based on observed historic dam discharge records.
Therefore, generalized F-tables were developed from preliminary rating curves
that were based upon normal operational trends during the historic time period.
These F-tables characterized the relationships between the historical average dam
discharges versus the surface water elevation or volume stored within each
reservoir. Essentially, a typical elevation-discharge or volume-discharge
relationship was developed from these observed historical records.
In moving forward with the existing infrastructure analysis, these average annual
F-tables were further refined to correlate the actual rated discharge capacity of the
valves and spillway at each dam. Reclamation used documentation provided by
LACFCD to review and update the F-tables for the 14 major LACFCD dams.
Reclamation reviewed the operation guidelines at each of the 14 dams and the
discharge rating curves for both the valves and spillways. The USACE performed
a similar analysis for the 4 major USACE dams.
For each dam, the F-tables were compared with the discharge rating curves for the
valve and spillway operations. Upon inspection, it was determined that the
average annual discharge curves developed previously were generally sufficient
for reservoir stages below spillway crest elevation. In certain instances below the
spillway crest elevation, the original average annual F-table discharge rate
exceeded the discharge capacity of the valves, thus the lesser value was used for
the newly updated F-table. For reservoir stages above the spillway crest, the
established spillway rating curves were used for the F-table values.
Los Angeles Basin Study Task 4 Existing Infrastructure Response Report
17
The Modified Puls level-pool reservoir routing method was utilized to model
spillway discharges for selected historical time periods with large flows to test the
updated F-tables. It should be noted that the modeling requirements for this
reservoir routing methodology required that the elevation-discharge relationship
have a positive rate of change throughout its operational range. No flow occurs
through a dam when the reservoir stage is exactly at the spillway crest elevation;
therefore, the stage must rise to a certain elevation above the crest before the rated
spillway discharge begins to exceed the maximum discharge through the valves.
Consequently, a transition zone was created in the elevation-discharge
relationship beginning at the spillway crest elevation which represents a
progressive closure of the valves in conjunction with increasing flow rates
through the spillway. This concept is illustrated in Figure 15.
Figure 15. WMMS Reservoir F-table Remodel
0
100
200
300
400
500
600
700
800
900
1,000
0 5,000 10,000 15,000 20,000 25,000 30,000
Dis
char
ge (
cfs)
Storage Volume (ac-ft)
Morris Dam Storage-Discharge F-Table
Valve Releases
Spillway Releases
F-Table "Transition Zone" Modeled Behavior
True Behavior
A transition zone was used to combine the average annual operations curve below
the spillway crest elevation with the established spillway discharge rating curves.
This combination produced the final F-table for each dam.
Los Angeles Basin Study Task 4 Existing Infrastructure Response Report
18
2.2.2 Spreading Ground Remodel
In order to better represent the intricate interaction between the channel forebays,
inlet structures, spreading grounds, and large storm flows, a remodel of the
WMMS spreading facilities was conducted. In the previous version of the model,
spreading grounds were assumed to be in-line with the storm channels, which
effectively forced the spreading ground to fill to capacity before it would allow
any water to move downstream. While this is not an appropriate depiction for
most spreading grounds, there are a few exceptions where facilities operate in this
manner. For example, the Peck Road Spreading Basin, just west of Santa Fe Dam,
functions as a large in-line spreading facility where all incoming stormwater
runoff has to flow through the facility before reaching the downstream outlet
structure. However, the majority of facilities are not in-line and this modeling
update was completed to reflect this.
The spreading ground remodel added a channel forebay and inlet structure to
nearly all modeled spreading grounds. Channel forebays are designed to retain a
small amount of water within the channel so that a spreading ground can control
inflow from the channel. During large storm events, these forebays are quickly
filled beyond capacity and once full, these forebays are designed to release all
stormwater downstream. Due to this behavior, large amounts of stormwater are
bypassed and cannot be captured by the spreading facility. This operational
condition is standard for nearly all spreading ground facilities, where intake of
stormwater runoff into the spreading ground is limited by the forebay release
volume and/or the channel flow rate. Figure 16 shows how WMMS was modified
to better replicate this spreading ground operational behavior.
Figure 16. Spreading Ground Remodel Schematic
This spreading ground remodel permitted for a more accurate system to control
the spreading ground operations, and additionally allowed the system to be more
responsive to larger or flashier storm events.
Los Angeles Basin Study Task 4 Existing Infrastructure Response Report
19
2.3 Infrastructure Analysis
The existing infrastructure response was analyzed for both the historic period and
future period projections. The updated WMMS model was used to produce
discharge rates and volume data at each of the dams, spreading grounds, and
channel outlets. WMMS performed the simulations of the water conservation and
flood risk mitigation network simultaneously for the existing infrastructure.
Therefore, hydrologic impacts on a specific facility are propagated to other nearby
facilities due to this system modeling. The historical period includes Water Years
1987 through 2000, and the future period projections are from Water Years 2012
through 2095. The historic climate simulations serve as a baseline condition that
can be presumed to represent the typical weather that the Study Area has grown
accustomed—and these can then be compared against the future projections. The
facility response data between the historical and future periods was then
compiled, analyzed, and ranked.
For the assessment of the existing infrastructure, the individual facilities were
ranked based upon their performance within the network. This allows the dams,
spreading grounds, and channel outlets to be compared to their counterparts to
comprehend where each stands with respect to one another. However, a certain
level of institutional knowledge will be necessary when processing these
performance levels. For example, certain dams and reservoirs are connected in
series without spreading grounds between. In such cases, low efficiency
performance of the upstream dams may be offset by high performance levels of
downstream facilities and may not significantly hinder overall performance of the
system.
Section 2.3.1. describes the key dam/reservoir metrics and the ranking
methods.
Section 2.3.2. describes the key spreading ground metrics and the ranking
methods.
Section 2.3.3. describes the key major channel outlet metrics and the
ranking methods.
2.3.1 Dams/Reservoirs
This section describes the hydrologic metrics used during the analysis of the
dams/reservoirs and also discusses the assessment methods used for ranking their
performance levels.
Los Angeles Basin Study Task 4 Existing Infrastructure Response Report
20
2.3.1.1 Key Dam/Reservoir Metrics
The analysis of the dams and reservoirs used four key stormwater metrics to
determine their performance:
Average Annual Volume of Stormwater Captured or Retained
Average Annual Volume of Stormwater Discharged through Spillway
Frequency of Spillway Events
PMF Exceedance Events
The inflow and discharge hydrographs and the volume of stormwater runoff
stored were analyzed for each of the dams. The analysis determined the average
annual volume of stormwater captured in the reservoirs and the average annual
volume of stormwater lost through the spillways. The analysis identified and
analyzed spillway events where the water surface elevation behind a dam was at
or above the spillway crest elevation. Additionally, the peak flow rates from all
projections were checked to determine if flows were within the maximum rated
discharge capacity of the dams. All dams are designed and rated to pass flows of
their respective Probable Maximum Flood (PMF).
For the stormwater metrics, the volume of water captured in the reservoirs was
considered to be available for controlled release to downstream spreading
grounds. This volume thus represents available water supply. However, the
volume of water released during spillway flow is likely to exceed the intake
capacity of the downstream spreading facilities. This stormwater instead flows out
to the ocean and is much less likely to contribute to available water supply. The
ratio of the average stormwater captured by a dam versus the total amount of
stormwater that flowed into the dam provides an indication of the capture
efficiency of the facility for local water conservation.
From the analysis of the simulation results for possible PMF exceedances, it was
found that the PMF flow rate was not exceeded for any of the future projections.
Therefore, the PMF exceedance events metric was not used in determining the
performance level rankings.
2.3.1.2 Ranking Method
From the analysis results, water conservation performance levels were developed
for the dams and reservoirs. Specific criteria were used to assign each of the dams
to one of three performance level categories ranging from “I” – potential for
enhancements to “III” – high potential for enhancements.
Los Angeles Basin Study Task 4 Existing Infrastructure Response Report
21
The ranking criteria for each of the dams included the following:
D1. Historic capture efficiency
D2. Future capture efficiency
D3. Change in future capture efficiency
D4. Historic frequency of spillway events
D5. Future frequency of spillway events
The equations used for each of the ranking criterion are listed below. For ranking
criteria D2 and D5, the most conservative of the six future projections was chosen
to better indicate which facilities were the least efficient or least resilient to
climate change.
𝐷1 = [(𝐴𝑣𝑒𝑟𝑎𝑔𝑒 𝐶𝑎𝑝𝑡𝑢𝑟𝑒 𝑉𝑜𝑙𝑢𝑚𝑒)𝐻𝑖𝑠𝑡𝑜𝑟𝑖𝑐
(𝐴𝑣𝑒𝑟𝑎𝑔𝑒 𝐶𝑎𝑝𝑡𝑢𝑟𝑒 𝑉𝑜𝑙𝑢𝑚𝑒)𝐻𝑖𝑠𝑡𝑜𝑟𝑖𝑐+(𝐴𝑣𝑒𝑟𝑎𝑔𝑒 𝑆𝑝𝑖𝑙𝑙𝑤𝑎𝑦 𝑉𝑜𝑙𝑢𝑚𝑒)𝐻𝑖𝑠𝑡𝑜𝑟𝑖𝑐]
𝐷2 = 𝑀𝑖𝑛 [(𝐴𝑣𝑒𝑟𝑎𝑔𝑒 𝐶𝑎𝑝𝑡𝑢𝑟𝑒 𝑉𝑜𝑙𝑢𝑚𝑒)6,𝐹𝑢𝑡𝑢𝑟𝑒
(𝐴𝑣𝑒𝑟𝑎𝑔𝑒 𝐶𝑎𝑝𝑡𝑢𝑟𝑒 𝑉𝑜𝑙𝑢𝑚𝑒)6,𝐹𝑢𝑡𝑢𝑟𝑒+(𝐴𝑣𝑒𝑟𝑎𝑔𝑒 𝑆𝑝𝑖𝑙𝑙𝑤𝑎𝑦 𝑉𝑜𝑙𝑢𝑚𝑒)6,𝐹𝑢𝑡𝑢𝑟𝑒]
𝐷3 = 𝐷2 − 𝐷1
𝐷4 = [(𝑁𝑢𝑚𝑏𝑒𝑟 𝑜𝑓 𝑆𝑝𝑖𝑙𝑙𝑤𝑎𝑦 𝐸𝑣𝑒𝑛𝑡𝑠)𝐻𝑖𝑠𝑡𝑜𝑟𝑖𝑐
(14 𝐻𝑖𝑠𝑡𝑜𝑟𝑖𝑐 𝑌𝑒𝑎𝑟𝑠)]
𝐷5 = 𝑀𝑎𝑥 [(𝑁𝑢𝑚𝑏𝑒𝑟 𝑜𝑓 𝑆𝑝𝑖𝑙𝑙𝑤𝑎𝑦 𝐸𝑣𝑒𝑛𝑡𝑠)6,𝐹𝑢𝑡𝑢𝑟𝑒
(84 𝐹𝑢𝑡𝑢𝑟𝑒 𝑌𝑒𝑎𝑟𝑠)]
After the values were calculated, the LACFCD dams were then ranked for each
criterion. The rankings ranged from 1 through 14, with 1 representing the best
performing facility and 14 representing the lowest performing facility. A ranking
scale of 14 is used since there are 14 LACFCD dams. As shown below, the five
dam criteria were then averaged to determine the final rank for each of the dams.
The highest performing (lowest ranking quarter) dams were assigned Performance
Level I. Moderately performing dams (the center half grouping) were assigned
Performance Level II. The lowest performing (highest ranking quarter) were
assigned Performance Level III.
𝐹𝑖𝑛𝑎𝑙 𝑅𝑎𝑛𝑘 = 𝐴𝑣𝑒𝑟𝑎𝑔𝑒 [𝐷1, 𝐷2, 𝐷3, 𝐷4, 𝐷5]
Dams in Performance Level I typically have high capture efficiencies and
spillway events are rare; however, these facilities may still be considered for
further enhancements and receive additional analysis in Task 5. Generally, there
is always some potential to make enhancements to any facility.
Dams in Performance Level II typically have a moderate capture efficiency and/or
moderate number of spillway events. These facilities are more likely to be
considered for enhancements and will likely be the subject of further analysis in
Task 5.
Los Angeles Basin Study Task 4 Existing Infrastructure Response Report
22
Dams in Performance Level III typically have poor capture efficiency and more
frequent spillway events. Out of all of the dams, these are most likely to be
considered for modifications and will be the subject of further analysis in Task 5.
The emphasis on capture efficiency and spillway events from this method does
not adequately address the potential for improved performance of the USACE
dams. Therefore, this method was considered but ultimately not used to determine
the final performance levels of the 4 USACE dams. Each was assigned
Performance Level II and will be the subject of further investigation in Task 5.
2.3.2 Spreading Grounds
This section describes the major hydrologic metrics that were used during the
analysis of the spreading facilities as well as discusses the assessment methods
used for ranking their performance levels.
2.3.2.1 Key Spreading Ground Metrics
The spreading ground analysis used two key stormwater metrics to determine
their performance:
Total Annual Volume of Stormwater Recharged
Total Annual Volume of Stormwater Bypassed
From the two metrics, the total potential annual volume of stormwater that could
be captured was determined. The ratio of total recharge verses the total potential
provides an indication of the efficiency of the spreading ground. In the context of
this report, bypass for the spreading grounds is defined to be the stormwater that
entered the channel forebay but was not recharged at that spreading ground. The
total potential is the combination of the bypass plus the quantity recharged in the
spreading ground.
2.3.2.2 Ranking Method
After the analysis of the different metrics was complete, all spreading facilities
were ranked based upon a number of criteria. Similar to the dams, specific criteria
were developed to assign each of the spreading facilities to one of the three
performance level categories. The criteria used were as follows:
S1. Historic bypass
S2. Historic capture efficiency
S3. Capture volume versus spreading ground wetted area
S4. Capture volume versus spreading ground surface storage volume
S5. Capture volume versus spreading ground percolation rate
S6. Change in future recharge
S7. Change in future capture efficiency
S8. Range of potential capture

Los Angeles Basin Study Task 4 Existing Infrastructure Response Report
23
The equations used for each of the ranking criterion are listed below. The last
three criteria, S6 through S8, were developed to assess the overall variation of the
future projection results with respect to the historic conditions.
𝑆1 = (𝐴𝑣𝑒𝑟𝑎𝑔𝑒 𝐵𝑦𝑝𝑎𝑠𝑠 𝑉𝑜𝑙𝑢𝑚𝑒)𝐻𝑖𝑠𝑡𝑜𝑟𝑖𝑐
𝑆2 = [(𝐴𝑣𝑒𝑟𝑎𝑔𝑒 𝑅𝑒𝑐ℎ𝑎𝑟𝑔𝑒 𝑉𝑜𝑙𝑢𝑚𝑒)𝐻𝑖𝑠𝑡𝑜𝑟𝑖𝑐
(𝐴𝑣𝑒𝑟𝑎𝑔𝑒 𝑅𝑒𝑐ℎ𝑎𝑟𝑔𝑒 𝑉𝑜𝑙𝑢𝑚𝑒)𝐻𝑖𝑠𝑡𝑜𝑟𝑖𝑐+(𝐴𝑣𝑒𝑟𝑎𝑔𝑒 𝐵𝑦𝑝𝑎𝑠𝑠 𝑉𝑜𝑙𝑢𝑚𝑒)𝐻𝑖𝑠𝑡𝑜𝑟𝑖𝑐]
𝑆3 = [(𝐴𝑣𝑒𝑟𝑎𝑔𝑒 𝑅𝑒𝑐ℎ𝑎𝑟𝑔𝑒 𝑉𝑜𝑙𝑢𝑚𝑒)𝐻𝑖𝑠𝑡𝑜𝑟𝑖𝑐
(𝑆𝑝𝑟𝑒𝑎𝑑𝑖𝑛𝑔 𝐺𝑟𝑜𝑢𝑛𝑑 𝑊𝑒𝑡𝑡𝑒𝑑 𝐴𝑟𝑒𝑎)]
𝑆4 = [(𝐴𝑣𝑒𝑟𝑎𝑔𝑒 𝑅𝑒𝑐ℎ𝑎𝑟𝑔𝑒 𝑉𝑜𝑙𝑢𝑚𝑒)𝐻𝑖𝑠𝑡𝑜𝑟𝑖𝑐
(𝑆𝑝𝑟𝑒𝑎𝑑𝑖𝑛𝑔 𝐺𝑟𝑜𝑢𝑛𝑑 𝑆𝑡𝑜𝑟𝑎𝑔𝑒 𝑉𝑜𝑙𝑢𝑚𝑒)]
𝑆5 = [(𝐴𝑣𝑒𝑟𝑎𝑔𝑒 𝑅𝑒𝑐ℎ𝑎𝑟𝑔𝑒 𝑉𝑜𝑙𝑢𝑚𝑒)𝐻𝑖𝑠𝑡𝑜𝑟𝑖𝑐
(𝑆𝑝𝑟𝑒𝑎𝑑𝑖𝑛𝑔 𝐺𝑟𝑜𝑢𝑛𝑑 𝑃𝑒𝑟𝑐𝑜𝑙𝑎𝑡𝑖𝑜𝑛 𝑅𝑎𝑡𝑒)]
𝑆6 = 𝑀𝑎𝑥 [(𝐴𝑣𝑒𝑟𝑎𝑔𝑒 𝑅𝑒𝑐ℎ𝑎𝑟𝑔𝑒 𝑉𝑜𝑙𝑢𝑚𝑒)6,𝐹𝑢𝑡𝑢𝑟𝑒
(𝐴𝑣𝑒𝑟𝑎𝑔𝑒 𝑅𝑒𝑐ℎ𝑎𝑟𝑔𝑒 𝑉𝑜𝑙𝑢𝑚𝑒)𝐻𝑖𝑠𝑡𝑜𝑟𝑖𝑐]
𝑆7 = 𝑀𝑖𝑛 [(𝐴𝑣𝑒𝑟𝑎𝑔𝑒 𝑅𝑒𝑐ℎ𝑎𝑟𝑔𝑒 𝑉𝑜𝑙𝑢𝑚𝑒)6,𝐹𝑢𝑡𝑢𝑟𝑒
(𝐴𝑣𝑒𝑟𝑎𝑔𝑒 𝑅𝑒𝑐ℎ𝑎𝑟𝑔𝑒 𝑉𝑜𝑙𝑢𝑚𝑒)6,𝐹𝑢𝑡𝑢𝑟𝑒+(𝐴𝑣𝑒𝑟𝑎𝑔𝑒 𝐵𝑦𝑝𝑎𝑠𝑠 𝑉𝑜𝑙𝑢𝑚𝑒)6,𝐹𝑢𝑡𝑢𝑟𝑒] − 𝑆2
𝑆8 = (𝐸𝑥𝑝𝑜𝑛𝑒𝑛𝑡 𝑜𝑛 𝑆𝑡𝑜𝑟𝑚𝑤𝑎𝑡𝑒𝑟 𝑅𝑒𝑐ℎ𝑎𝑟𝑔𝑒 𝐶𝑢𝑟𝑣𝑒)
For the change in future recharge (S6), this ranking category was established to
determine whether a specific facility is flexible with respect to future variation in
climate. For this category, the maximum of the six future projections was chosen
to better indicate which facilities were the most efficient and resilient to climate
change. If annual stormwater runoff is projected to increase overall, infrastructure
that is already capable of capturing additional stormwater indicates a more
flexible or robust facility. This behavior is ranked higher in this criterion.
Conversely, existing infrastructure that cannot readily increase its recharge with
anticipated increases in annual stormwater runoff indicates less flexibility overall.
This facility type is ranked lower in this criterion.
For the change in future capture efficiency (S7), this ranking category was
established to indicate whether a specific facility is able to adapt to the adverse
effects of climate change. For this category, the most conservative of the six
future projections was chosen to better indicate which facilities were the most
adaptable to climate change. Specifically, if average annual stormwater runoff is
anticipated to decrease, infrastructure that is able to increase its capture efficiency
indicates a more flexible or robust facility. This adaptability is ranked higher in
this criterion. Conversely, existing infrastructure that cannot readily increase its
future capture efficiency when runoff is expected to decrease indicates lesser
overall adaptability. This facility type is ranked lower in this criterion.
Los Angeles Basin Study Task 4 Existing Infrastructure Response Report
24
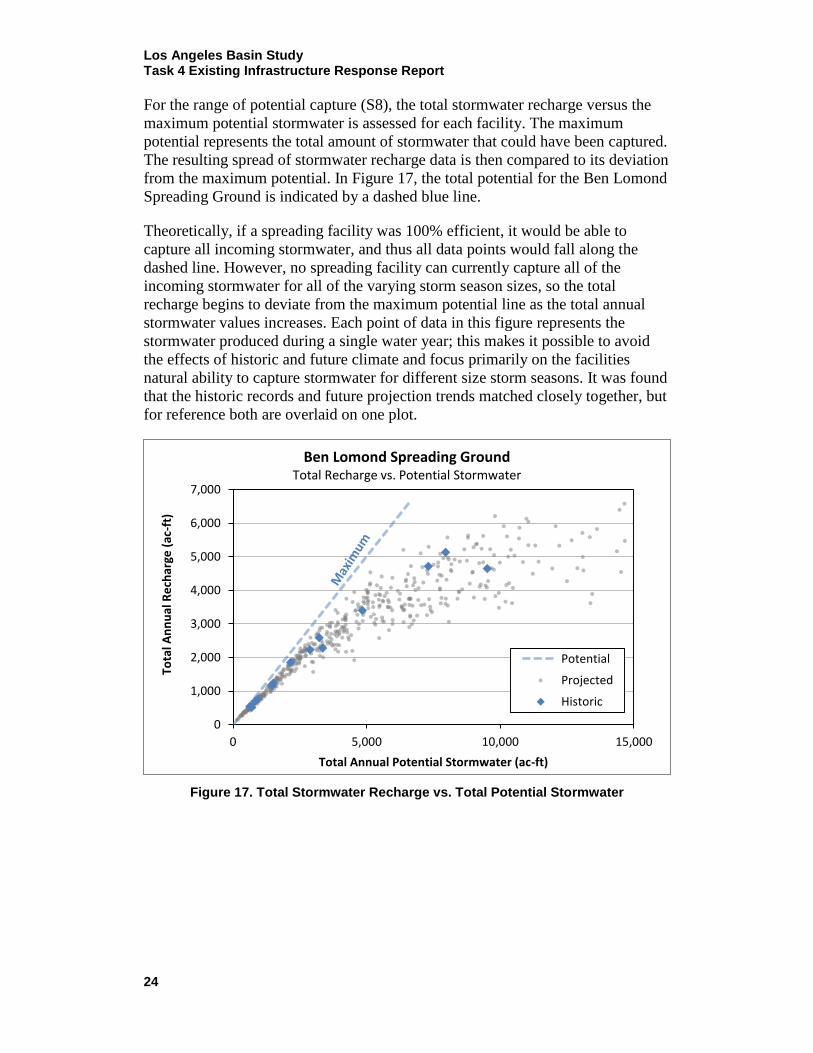
For the range of potential capture (S8), the total stormwater recharge versus the
maximum potential stormwater is assessed for each facility. The maximum
potential represents the total amount of stormwater that could have been captured.
The resulting spread of stormwater recharge data is then compared to its deviation
from the maximum potential. In Figure 17, the total potential for the Ben Lomond
Spreading Ground is indicated by a dashed blue line.
Theoretically, if a spreading facility was 100% efficient, it would be able to
capture all incoming stormwater, and thus all data points would fall along the
dashed line. However, no spreading facility can currently capture all of the
incoming stormwater for all of the varying storm season sizes, so the total
recharge begins to deviate from the maximum potential line as the total annual
stormwater values increases. Each point of data in this figure represents the
stormwater produced during a single water year; this makes it possible to avoid
the effects of historic and future climate and focus primarily on the facilities
natural ability to capture stormwater for different size storm seasons. It was found
that the historic records and future projection trends matched closely together, but
for reference both are overlaid on one plot.
Figure 17. Total Stormwater Recharge vs. Total Potential Stormwater
Ben Lomond Spreading Ground Total Recharge vs. Potential Stormwater
7,000
ft
)- 6,000
ac (
eg 5,000
arhc
e 4,000
Ral
un 3,000
nta
l A
2,000
To
1,000
0
0 5,000 10,000 15,000
Total Annual Potential Stormwater (ac-ft)
Potential
Projected
Historic
Los Angeles Basin Study Task 4 Existing Infrastructure Response Report
25
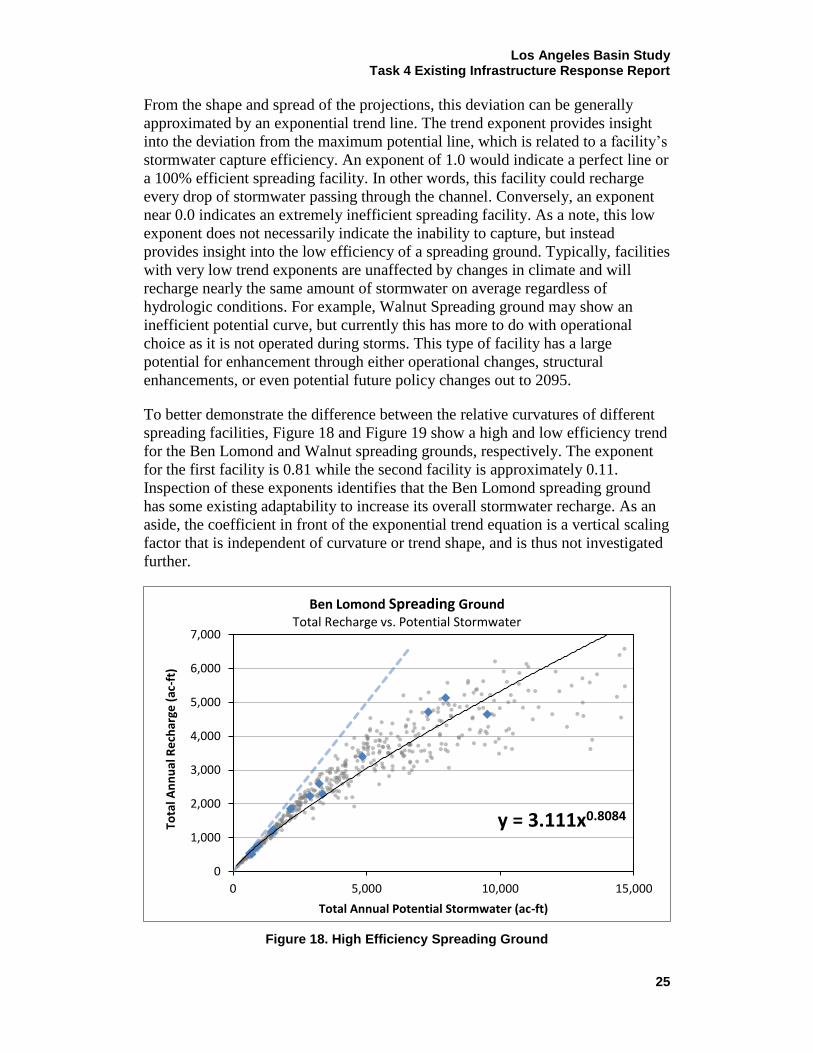
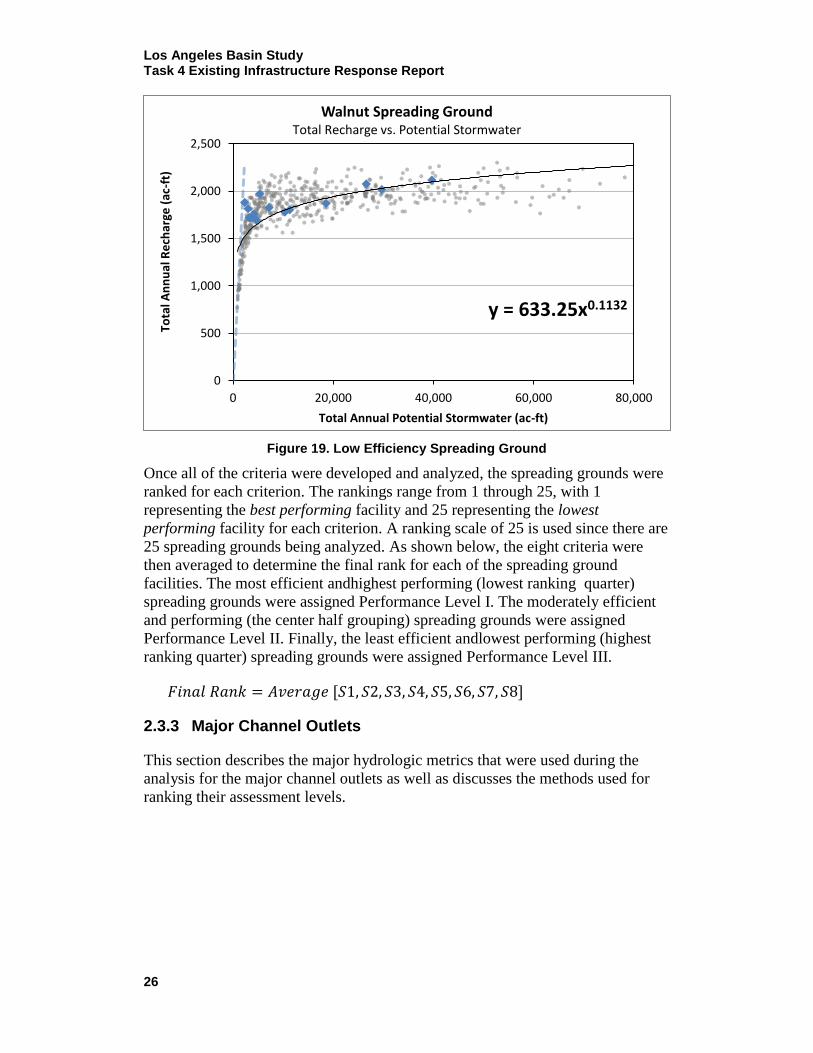
From the shape and spread of the projections, this deviation can be generally
approximated by an exponential trend line. The trend exponent provides insight
into the deviation from the maximum potential line, which is related to a facility’s
stormwater capture efficiency. An exponent of 1.0 would indicate a perfect line or
a 100% efficient spreading facility. In other words, this facility could recharge
every drop of stormwater passing through the channel. Conversely, an exponent
near 0.0 indicates an extremely inefficient spreading facility. As a note, this low
exponent does not necessarily indicate the inability to capture, but instead
provides insight into the low efficiency of a spreading ground. Typically, facilities
with very low trend exponents are unaffected by changes in climate and will
recharge nearly the same amount of stormwater on average regardless of
hydrologic conditions. For example, Walnut Spreading ground may show an
inefficient potential curve, but currently this has more to do with operational
choice as it is not operated during storms. This type of facility has a large
potential for enhancement through either operational changes, structural
enhancements, or even potential future policy changes out to 2095.
To better demonstrate the difference between the relative curvatures of different
spreading facilities, Figure 18 and Figure 19 show a high and low efficiency trend
for the Ben Lomond and Walnut spreading grounds, respectively. The exponent
for the first facility is 0.81 while the second facility is approximately 0.11.
Inspection of these exponents identifies that the Ben Lomond spreading ground
has some existing adaptability to increase its overall stormwater recharge. As an
aside, the coefficient in front of the exponential trend equation is a vertical scaling
factor that is independent of curvature or trend shape, and is thus not investigated
further.
Figure 18. High Efficiency Spreading Ground
Ben Lomond Spreading Ground Total Recharge vs. Potential Stormwater
7,000
6,000
ft)
-ac
(e 5,000
gar
hc 4,000
e R
alu 3,000
nn
tal A 2,000
To y = 3.111x0.8084 1,000
0
0 5,000 10,000 15,000
Total Annual Potential Stormwater (ac-ft)
Los Angeles Basin Study Task 4 Existing Infrastructure Response Report
26
Figure 19. Low Efficiency Spreading Ground
Walnut Spreading Ground Total Recharge vs. Potential Stormwater
2,500
ft
)-
ac 2,000
(eg
arhc 1,500
e R
alu
nn 1,000
tal A y = 633.25x0.1132
To 500
0
0 20,000 40,000 60,000 80,000
Total Annual Potential Stormwater (ac-ft)
Once all of the criteria were developed and analyzed, the spreading grounds were
ranked for each criterion. The rankings range from 1 through 25, with 1
representing the best performing facility and 25 representing the lowest
performing facility for each criterion. A ranking scale of 25 is used since there are
25 spreading grounds being analyzed. As shown below, the eight criteria were
then averaged to determine the final rank for each of the spreading ground
facilities. The most efficient andhighest performing (lowest ranking quarter)
spreading grounds were assigned Performance Level I. The moderately efficient
and performing (the center half grouping) spreading grounds were assigned
Performance Level II. Finally, the least efficient andlowest performing (highest
ranking quarter) spreading grounds were assigned Performance Level III.
𝐹𝑖𝑛𝑎𝑙 𝑅𝑎𝑛𝑘 = 𝐴𝑣𝑒𝑟𝑎𝑔𝑒 [𝑆1, 𝑆2, 𝑆3, 𝑆4, 𝑆5, 𝑆6, 𝑆7, 𝑆8]
2.3.3 Major Channel Outlets
This section describes the major hydrologic metrics that were used during the
analysis for the major channel outlets as well as discusses the methods used for
ranking their assessment levels.
Los Angeles Basin Study Task 4 Existing Infrastructure Response Report
27
2.3.3.1 Key Major Channel Outlet Metrics
The major channel outlet analysis used two key stormwater metrics to determine
their performance:
Average Annual Volume of Stormwater Discharged to the Ocean
Peak Flood Flow Rate
From the two metrics, the major channel outlets could be assessed overall for their
respective watershed’s stormwater discharges lost to the ocean and their general
flood risk mitigation ability. The quantity of stormwater volume that is discharged
to the ocean from the channels provides an indication of the potential stormwater
supply that could be captured within their upstream watersheds. The peak flood
flow rate at the channel outlets allows for an understanding of the potential
changes from the historic climate to the future projections.
2.3.3.2 Ranking Method
After the analysis of the two metrics were complete, the 5 major channels outlets
were ranked based upon several criteria. Similar to the other facilities, specific
criteria were developed to grade each of the channel outlets. The criteria used
were as follows:
C1. Change in future discharge
C2. Change in future unit area discharge
C3. Change in future discharge per total discharge
C4. Change in future average peak flow rate
The equations used for each of the ranking criterion are listed below. For ranking
criterion C4, the maximum of the six future projections was chosen to indicate
which channel outlet could see the largest overall change due to climate change.
𝐶1 = (𝐴𝑣𝑒𝑟𝑎𝑔𝑒 𝐴𝑛𝑛𝑢𝑎𝑙 𝐷𝑖𝑠𝑐ℎ𝑎𝑟𝑔𝑒)𝐹𝑢𝑡𝑢𝑟𝑒 − (𝐴𝑣𝑒𝑟𝑎𝑔𝑒 𝐴𝑛𝑛𝑢𝑎𝑙 𝐷𝑖𝑠𝑐ℎ𝑎𝑟𝑔𝑒)𝐻𝑖𝑠𝑡𝑜𝑟𝑖𝑐
𝐶2 = [(𝐴𝑣𝑒𝑟𝑎𝑔𝑒 𝐴𝑛𝑛𝑢𝑎𝑙 𝐷𝑖𝑠𝑐ℎ𝑎𝑟𝑔𝑒)𝐹𝑢𝑡𝑢𝑟𝑒 − (𝐴𝑣𝑒𝑟𝑎𝑔𝑒 𝐴𝑛𝑛𝑢𝑎𝑙 𝐷𝑖𝑠𝑐ℎ𝑎𝑟𝑔𝑒)𝐻𝑖𝑠𝑡𝑜𝑟𝑖𝑐
𝐴𝑟𝑒𝑎 𝑜𝑓 𝑊𝑎𝑡𝑒𝑟𝑠ℎ𝑒𝑑]
𝐶3 =
[𝐴𝑣𝑒𝑟𝑎𝑔𝑒 𝐴𝑛𝑛𝑢𝑎𝑙 𝐷𝑖𝑠𝑐ℎ𝑎𝑟𝑔𝑒
5 𝑂𝑢𝑡𝑙𝑒𝑡 𝑇𝑜𝑡𝑎𝑙 𝐷𝑖𝑠𝑐ℎ𝑎𝑟𝑔𝑒]
𝐹𝑢𝑡𝑢𝑟𝑒
− [𝐴𝑣𝑒𝑟𝑎𝑔𝑒 𝐴𝑛𝑛𝑢𝑎𝑙 𝐷𝑖𝑠𝑐ℎ𝑎𝑟𝑔𝑒
5 𝑂𝑢𝑡𝑙𝑒𝑡 𝑇𝑜𝑡𝑎𝑙 𝐷𝑖𝑠𝑐ℎ𝑎𝑟𝑔𝑒]
𝐻𝑖𝑠𝑡𝑜𝑟𝑖𝑐
[𝐴𝑣𝑒𝑟𝑎𝑔𝑒 𝐴𝑛𝑛𝑢𝑎𝑙 𝐷𝑖𝑠𝑐ℎ𝑎𝑟𝑔𝑒
5 𝑂𝑢𝑡𝑙𝑒𝑡 𝑇𝑜𝑡𝑎𝑙 𝐷𝑖𝑠𝑐ℎ𝑎𝑟𝑔𝑒]
𝐻𝑖𝑠𝑡𝑜𝑟𝑖𝑐
𝐶4 = [𝑀𝑎𝑥[(𝐴𝑣𝑒𝑟𝑎𝑔𝑒 𝑃𝑒𝑎𝑘 𝐹𝑙𝑜𝑤)𝐹𝑢𝑡𝑢𝑟𝑒] − (𝐴𝑣𝑒𝑟𝑎𝑔𝑒 𝑃𝑒𝑎𝑘 𝐹𝑙𝑜𝑤)𝐻𝑖𝑠𝑡𝑜𝑟𝑖𝑐
(𝐴𝑣𝑒𝑟𝑎𝑔𝑒 𝑃𝑒𝑎𝑘 𝐹𝑙𝑜𝑤)𝐻𝑖𝑠𝑡𝑜𝑟𝑖𝑐]
After the values were calculated, the major channel outlets were then ranked for
each criterion. The rankings ranged from 1 through 5, with 1 representing the
lowest discharging watershed and 5 representing the highest discharging
Los Angeles Basin Study Task 4 Existing Infrastructure Response Report
28
watershed. A ranking scale of 5 is used since there were 5 major channel outlets
analyzed that discharge to the Pacific Ocean. As shown below, the four major
channel outlet criteria were then averaged to determine the final rank for each.
Due to the small amount of major channel outlets, the two lowest discharging
(lowest ranking) outlets were assigned Assessment Level I. The next two higher
discharging channel outlets were assigned Assessment Level II. The one
remaining and highest discharging outlet was assigned Assessment Level III.
𝐹𝑖𝑛𝑎𝑙 𝑅𝑎𝑛𝑘 = 𝐴𝑣𝑒𝑟𝑎𝑔𝑒 [𝐶1, 𝐶2, 𝐶3, 𝐶4]
The channel outlets in Assessment Level I have a lower discharge volume when
compared to the others. The channel outlets in Assessment Level II and III have
incrementally higher stormwater discharge volumes to the ocean; this in turn
means that the upstream watershed could be the focus of creating additional
stormwater capture.

Los Angeles Basin Study Task 4 Existing Infrastructure Response Report
29
3 Results and Discussion
Analysis of the existing infrastructure response for both the historic and future
climate projections was performed for this task of this LA Basin Study. This task
built upon a subset of the Task 3 future projections and performed a detailed
analysis of the individual water conservation facilities, dams, and channel outlets
within the Basin Study Watersheds. The facilities assessed in this task were:
18 Dams
o 14 Major LACFCD Dams
o 4 Major USACE Dams
26 Major Spreading Ground Facilities
5 Major Channel Outlets
Reclamation analyzed the 14 major LACFCD dams, USACE assessed their 4
major dams, and LACFCD analyzed the 26 major spreading grounds and 5
channel outlets in the region. Although there are 26 spreading grounds, the
Hansen and Tujunga facilities share the same channel forebay subwatershed
within WMMS resulting in these two sites being analyzed together. Therefore,
there are only 25 rankings for spreading grounds in this report.
For the dam and spreading ground performance levels, Table 2 defines specific
terminology to better describe the performance and differentiate between the
levels. Performance Level I indicates an existing facility that is functioning with a
high efficiency and is very resilient to the projected climate. Even with this
performance level, however, the facilities in this category may still have the
potential for future enhancements. On the lower end of the spectrum, Performance
Level III describes a facility that operates at a lower efficiency and may
experience adverse impacts from the future climate projections. This type of
facility is generally a higher priority and has a greater potential for enhancements.
Table 2. Performance Levels (Dams & Spreading Grounds)
Performance Level
Performance Description
Prospective Enhancements
Enhancement Priority
I High Efficiency
High Resiliency to Climate Change Projections
Potential Exists Low
↕
High
II Moderate Efficiency
Moderate Resiliency to Climate Change Projections
Moderate Potential
III Low Efficiency
Low Resiliency to Climate Change Projections
High Potential
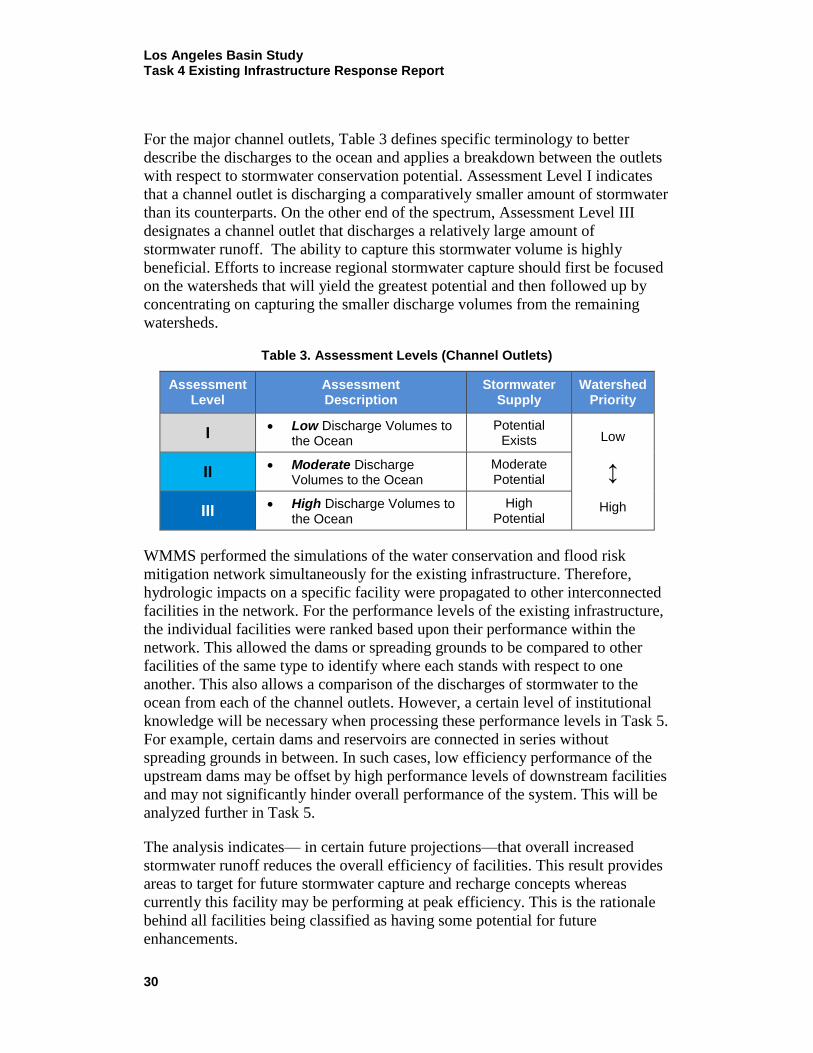
Los Angeles Basin Study Task 4 Existing Infrastructure Response Report
30
For the major channel outlets, Table 3 defines specific terminology to better
describe the discharges to the ocean and applies a breakdown between the outlets
with respect to stormwater conservation potential. Assessment Level I indicates
that a channel outlet is discharging a comparatively smaller amount of stormwater
than its counterparts. On the other end of the spectrum, Assessment Level III
designates a channel outlet that discharges a relatively large amount of
stormwater runoff. The ability to capture this stormwater volume is highly
beneficial. Efforts to increase regional stormwater capture should first be focused
on the watersheds that will yield the greatest potential and then followed up by
concentrating on capturing the smaller discharge volumes from the remaining
watersheds.
Table 3. Assessment Levels (Channel Outlets)
Assessment Level
Assessment Description
Stormwater Supply
Watershed Priority
I Low Discharge Volumes to
the Ocean
Potential Exists Low
↕
High
II Moderate Discharge
Volumes to the Ocean
Moderate Potential
III High Discharge Volumes to
the Ocean
High Potential
WMMS performed the simulations of the water conservation and flood risk
mitigation network simultaneously for the existing infrastructure. Therefore,
hydrologic impacts on a specific facility were propagated to other interconnected
facilities in the network. For the performance levels of the existing infrastructure,
the individual facilities were ranked based upon their performance within the
network. This allowed the dams or spreading grounds to be compared to other
facilities of the same type to identify where each stands with respect to one
another. This also allows a comparison of the discharges of stormwater to the
ocean from each of the channel outlets. However, a certain level of institutional
knowledge will be necessary when processing these performance levels in Task 5.
For example, certain dams and reservoirs are connected in series without
spreading grounds in between. In such cases, low efficiency performance of the
upstream dams may be offset by high performance levels of downstream facilities
and may not significantly hinder overall performance of the system. This will be
analyzed further in Task 5.
The analysis indicates— in certain future projections—that overall increased
stormwater runoff reduces the overall efficiency of facilities. This result provides
areas to target for future stormwater capture and recharge concepts whereas
currently this facility may be performing at peak efficiency. This is the rationale
behind all facilities being classified as having some potential for future
enhancements.

Los Angeles Basin Study Task 4 Existing Infrastructure Response Report
31
Since this existing infrastructure analysis serves as the baseline condition for the
development of Task 5, it was important to use operational guidelines and rating
curves that existed prior to the start of the future period in water year 2012.
Additionally, any infrastructure modifications that were implemented after the
start of the future period are not included in this analysis. Since the WMMS
model is calibrated to match historical data and new modifications would not have
sufficient data to calibrate against, these relatively recent modifications are
omitted from Task 4. For instance, the modifications completed at Morris Dam to
lower the minimum pool are not included in this task. However, Task 5 will
consider any recent infrastructure and operational guidelines that are now used or
are in short-term development for the water conservation and flood risk mitigation
system. Furthermore, Task 5 will develop new infrastructure and/or operational
guideline concepts in addition to these planned modifications not yet accounted
for in the WMMS model.
The remainder of this section discusses the results from the analysis of the
existing dams, spreading grounds, and major channel outletsfor the historical
period (Water Years 1987 through 2000) and the future climate projections
(Water Years 2012 through 2095).
Section 3.1. provides an overview of the results from the dam analysis.
Section 3.2. provides an overview of the results from the spreading ground
analysis.
Section 3.3. provides an overview of the results from the major channel
outlet analysis.
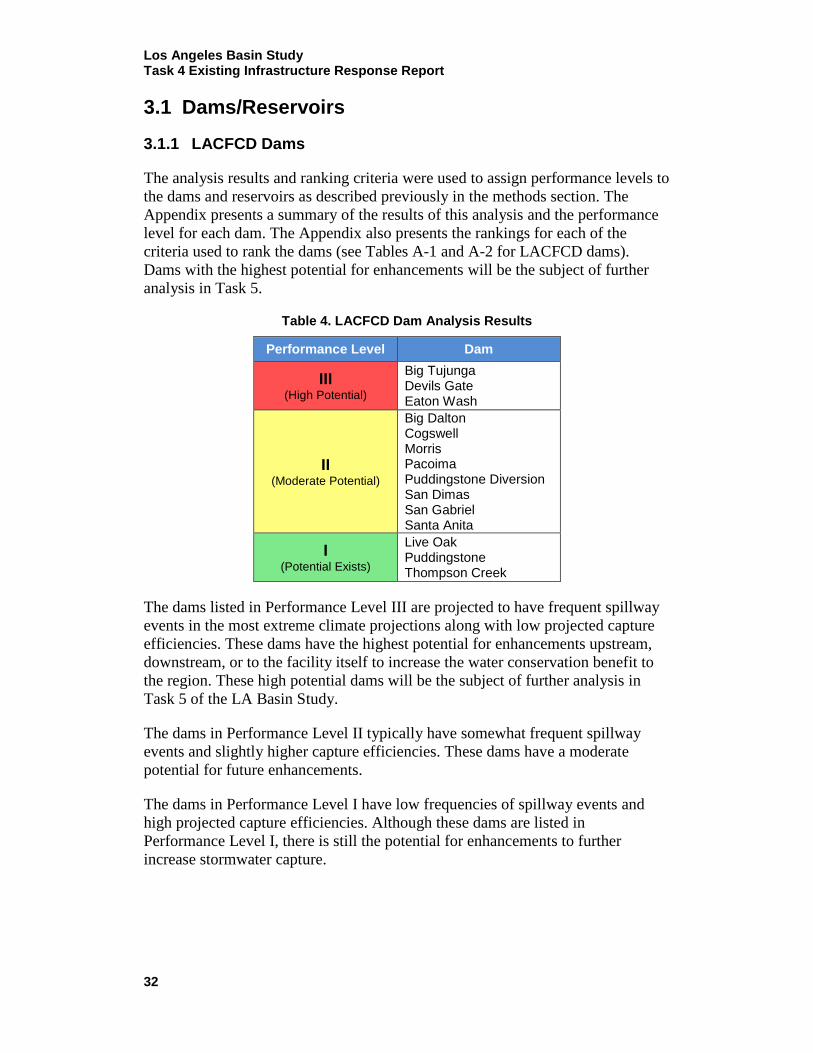
Los Angeles Basin Study Task 4 Existing Infrastructure Response Report
32
3.1 Dams/Reservoirs
3.1.1 LACFCD Dams
The analysis results and ranking criteria were used to assign performance levels to
the dams and reservoirs as described previously in the methods section. The
Appendix presents a summary of the results of this analysis and the performance
level for each dam. The Appendix also presents the rankings for each of the
criteria used to rank the dams (see Tables A-1 and A-2 for LACFCD dams).
Dams with the highest potential for enhancements will be the subject of further
analysis in Task 5.
Table 4. LACFCD Dam Analysis Results
Performance Level Dam
III (High Potential)
Big Tujunga Devils Gate Eaton Wash
II (Moderate Potential)
Big Dalton Cogswell Morris Pacoima Puddingstone Diversion San Dimas San Gabriel Santa Anita
I (Potential Exists)
Live Oak Puddingstone Thompson Creek
The dams listed in Performance Level III are projected to have frequent spillway
events in the most extreme climate projections along with low projected capture
efficiencies. These dams have the highest potential for enhancements upstream,
downstream, or to the facility itself to increase the water conservation benefit to
the region. These high potential dams will be the subject of further analysis in
Task 5 of the LA Basin Study.
The dams in Performance Level II typically have somewhat frequent spillway
events and slightly higher capture efficiencies. These dams have a moderate
potential for future enhancements.
The dams in Performance Level I have low frequencies of spillway events and
high projected capture efficiencies. Although these dams are listed in
Performance Level I, there is still the potential for enhancements to further
increase stormwater capture.
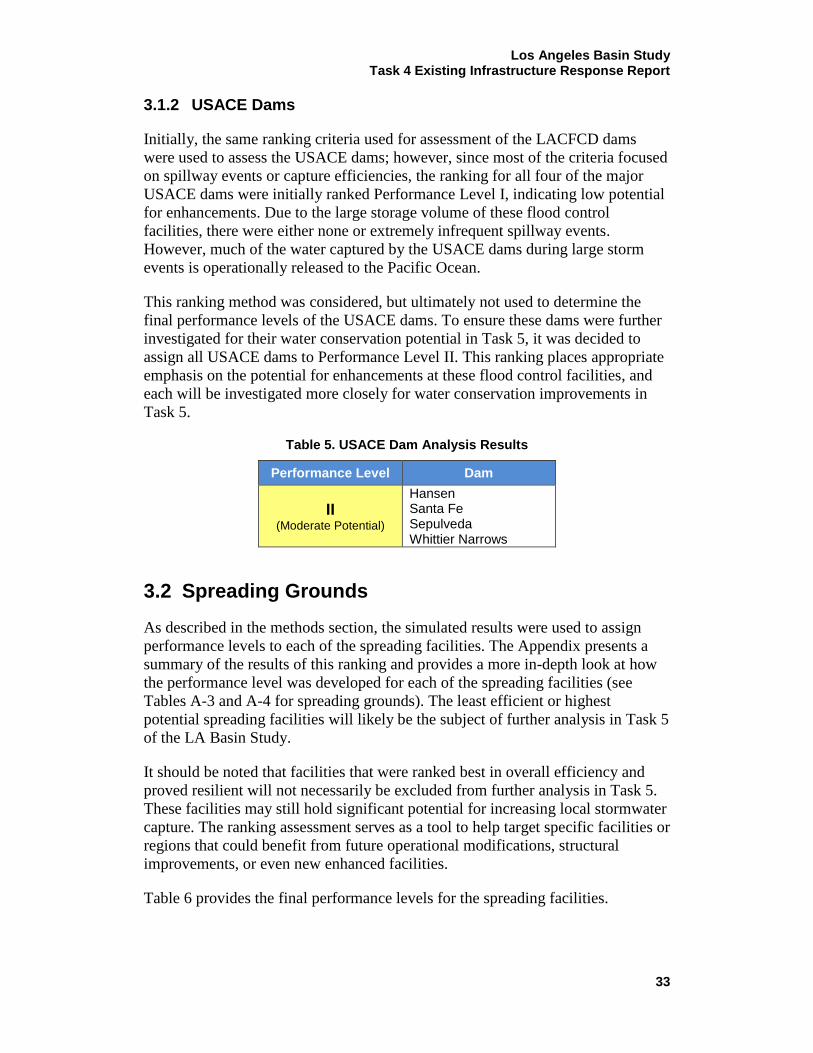
Los Angeles Basin Study Task 4 Existing Infrastructure Response Report
33
3.1.2 USACE Dams
Initially, the same ranking criteria used for assessment of the LACFCD dams
were used to assess the USACE dams; however, since most of the criteria focused
on spillway events or capture efficiencies, the ranking for all four of the major
USACE dams were initially ranked Performance Level I, indicating low potential
for enhancements. Due to the large storage volume of these flood control
facilities, there were either none or extremely infrequent spillway events.
However, much of the water captured by the USACE dams during large storm
events is operationally released to the Pacific Ocean.
This ranking method was considered, but ultimately not used to determine the
final performance levels of the USACE dams. To ensure these dams were further
investigated for their water conservation potential in Task 5, it was decided to
assign all USACE dams to Performance Level II. This ranking places appropriate
emphasis on the potential for enhancements at these flood control facilities, and
each will be investigated more closely for water conservation improvements in
Task 5.
Table 5. USACE Dam Analysis Results
Performance Level Dam
II (Moderate Potential)
Hansen Santa Fe Sepulveda Whittier Narrows
3.2 Spreading Grounds
As described in the methods section, the simulated results were used to assign
performance levels to each of the spreading facilities. The Appendix presents a
summary of the results of this ranking and provides a more in-depth look at how
the performance level was developed for each of the spreading facilities (see
Tables A-3 and A-4 for spreading grounds). The least efficient or highest
potential spreading facilities will likely be the subject of further analysis in Task 5
of the LA Basin Study.
It should be noted that facilities that were ranked best in overall efficiency and
proved resilient will not necessarily be excluded from further analysis in Task 5.
These facilities may still hold significant potential for increasing local stormwater
capture. The ranking assessment serves as a tool to help target specific facilities or
regions that could benefit from future operational modifications, structural
improvements, or even new enhanced facilities.
Table 6 provides the final performance levels for the spreading facilities.

Los Angeles Basin Study Task 4 Existing Infrastructure Response Report
34
Table 6. Spreading Ground Analysis Results
Performance Level Spreading Ground
III (High Potential)
Buena Vista Dominguez Gap Forbes Live Oak Lopez San Gabriel Canyon
II (Moderate Potential)
Ben Lomond Branford Citrus Eaton Basin Eaton Wash Hansen/Tujunga Little Dalton Pacoima Rio Hondo San Gabriel Coastal Santa Anita Santa Fe Walnut
I (Potential Exists)
Big Dalton Irwindale Peck Road San Dimas Sawpit Sierra Madre
Spreading grounds assigned to Performance Level III typically are the least
efficient, least resilient, or have a large potential for increasing stormwater
capture. Performance Level II represents facilities that are moderately efficient,
moderately resilient, or have a moderate potential for increasing stormwater
capture. And finally, Performance Level I showcases facilities that have an
overall high efficiency, high resilience, and have some level of potential
stormwater capture ability.
As a limitation for these rankings, the performance levels were developed solely
from analyzing model results. Due to this, they cannot encompass every
operational aspect and may not truly represent reality. A certain degree of
subjective scrutiny will be required when utilizing the results in Task 5.
Nevertheless, these performance levels provide valuable results to help target
facilities that have the greatest opportunity for enhancing stormwater capture.
Lastly, Sierra Madre is shown to have a high performance level; however, this site
could not be properly modeled within WMMS, and is potentially ranked
artificially high for efficiency and resilience. Furthermore, the Hansen and
Tujunga spreading grounds have been combined since these two spreading
grounds share the same forebay subwatershed within the WMMS model.
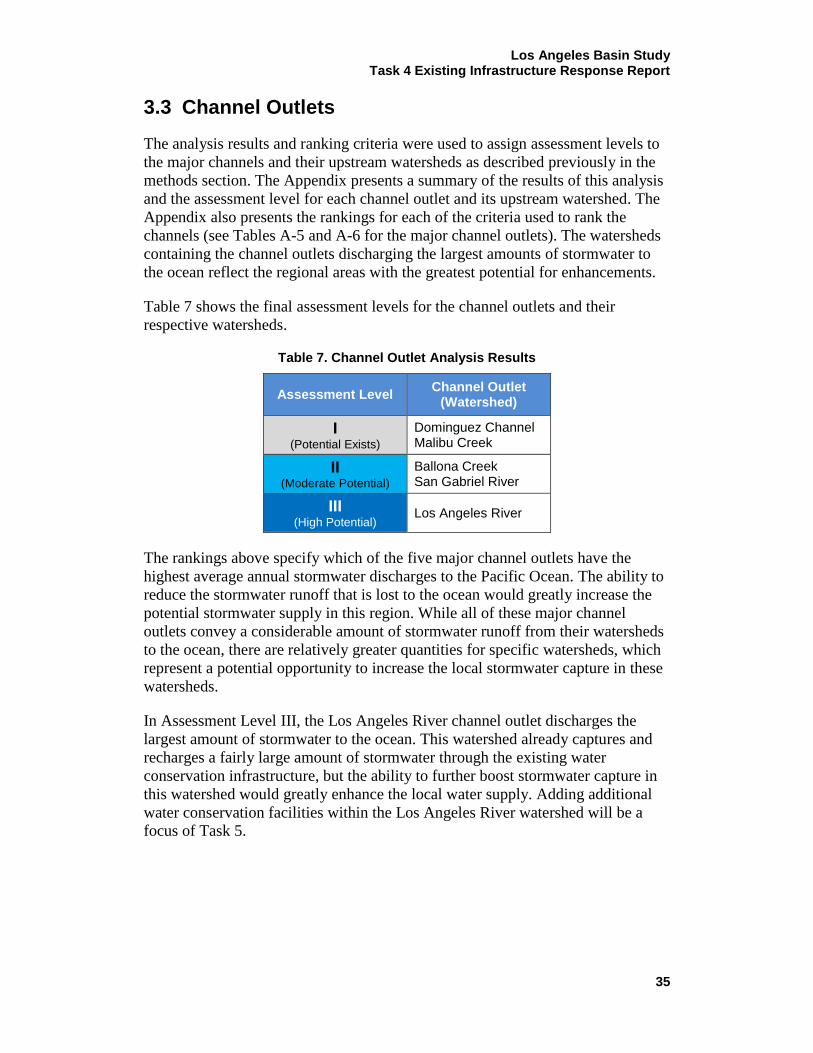
Los Angeles Basin Study Task 4 Existing Infrastructure Response Report
35
3.3 Channel Outlets
The analysis results and ranking criteria were used to assign assessment levels to
the major channels and their upstream watersheds as described previously in the
methods section. The Appendix presents a summary of the results of this analysis
and the assessment level for each channel outlet and its upstream watershed. The
Appendix also presents the rankings for each of the criteria used to rank the
channels (see Tables A-5 and A-6 for the major channel outlets). The watersheds
containing the channel outlets discharging the largest amounts of stormwater to
the ocean reflect the regional areas with the greatest potential for enhancements.
Table 7 shows the final assessment levels for the channel outlets and their
respective watersheds.
Table 7. Channel Outlet Analysis Results
Assessment Level Channel Outlet
(Watershed)
I (Potential Exists)
Dominguez Channel Malibu Creek
II (Moderate Potential)
Ballona Creek San Gabriel River
III (High Potential)
Los Angeles River
The rankings above specify which of the five major channel outlets have the
highest average annual stormwater discharges to the Pacific Ocean. The ability to
reduce the stormwater runoff that is lost to the ocean would greatly increase the
potential stormwater supply in this region. While all of these major channel
outlets convey a considerable amount of stormwater runoff from their watersheds
to the ocean, there are relatively greater quantities for specific watersheds, which
represent a potential opportunity to increase the local stormwater capture in these
watersheds.
In Assessment Level III, the Los Angeles River channel outlet discharges the
largest amount of stormwater to the ocean. This watershed already captures and
recharges a fairly large amount of stormwater through the existing water
conservation infrastructure, but the ability to further boost stormwater capture in
this watershed would greatly enhance the local water supply. Adding additional
water conservation facilities within the Los Angeles River watershed will be a
focus of Task 5.
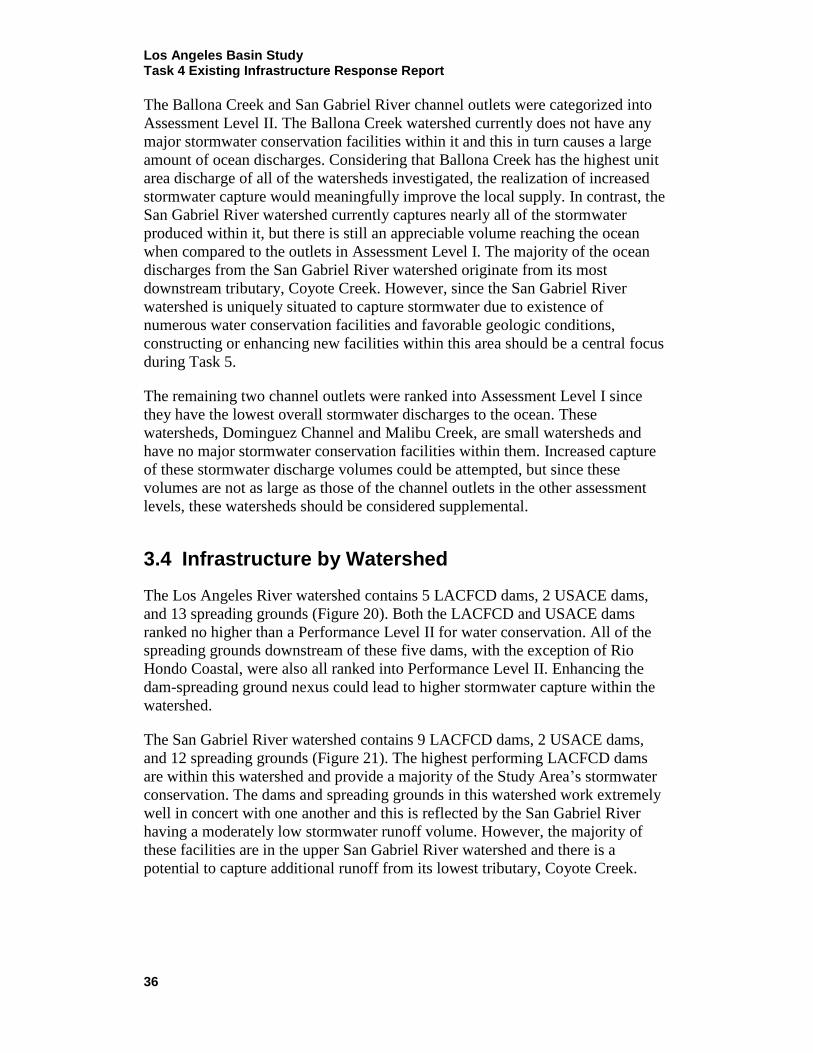
Los Angeles Basin Study Task 4 Existing Infrastructure Response Report
36
The Ballona Creek and San Gabriel River channel outlets were categorized into
Assessment Level II. The Ballona Creek watershed currently does not have any
major stormwater conservation facilities within it and this in turn causes a large
amount of ocean discharges. Considering that Ballona Creek has the highest unit
area discharge of all of the watersheds investigated, the realization of increased
stormwater capture would meaningfully improve the local supply. In contrast, the
San Gabriel River watershed currently captures nearly all of the stormwater
produced within it, but there is still an appreciable volume reaching the ocean
when compared to the outlets in Assessment Level I. The majority of the ocean
discharges from the San Gabriel River watershed originate from its most
downstream tributary, Coyote Creek. However, since the San Gabriel River
watershed is uniquely situated to capture stormwater due to existence of
numerous water conservation facilities and favorable geologic conditions,
constructing or enhancing new facilities within this area should be a central focus
during Task 5.
The remaining two channel outlets were ranked into Assessment Level I since
they have the lowest overall stormwater discharges to the ocean. These
watersheds, Dominguez Channel and Malibu Creek, are small watersheds and
have no major stormwater conservation facilities within them. Increased capture
of these stormwater discharge volumes could be attempted, but since these
volumes are not as large as those of the channel outlets in the other assessment
levels, these watersheds should be considered supplemental.
3.4 Infrastructure by Watershed
The Los Angeles River watershed contains 5 LACFCD dams, 2 USACE dams,
and 13 spreading grounds (Figure 20). Both the LACFCD and USACE dams
ranked no higher than a Performance Level II for water conservation. All of the
spreading grounds downstream of these five dams, with the exception of Rio
Hondo Coastal, were also all ranked into Performance Level II. Enhancing the
dam-spreading ground nexus could lead to higher stormwater capture within the
watershed.
The San Gabriel River watershed contains 9 LACFCD dams, 2 USACE dams,
and 12 spreading grounds (Figure 21). The highest performing LACFCD dams
are within this watershed and provide a majority of the Study Area’s stormwater
conservation. The dams and spreading grounds in this watershed work extremely
well in concert with one another and this is reflected by the San Gabriel River
having a moderately low stormwater runoff volume. However, the majority of
these facilities are in the upper San Gabriel River watershed and there is a
potential to capture additional runoff from its lowest tributary, Coyote Creek.
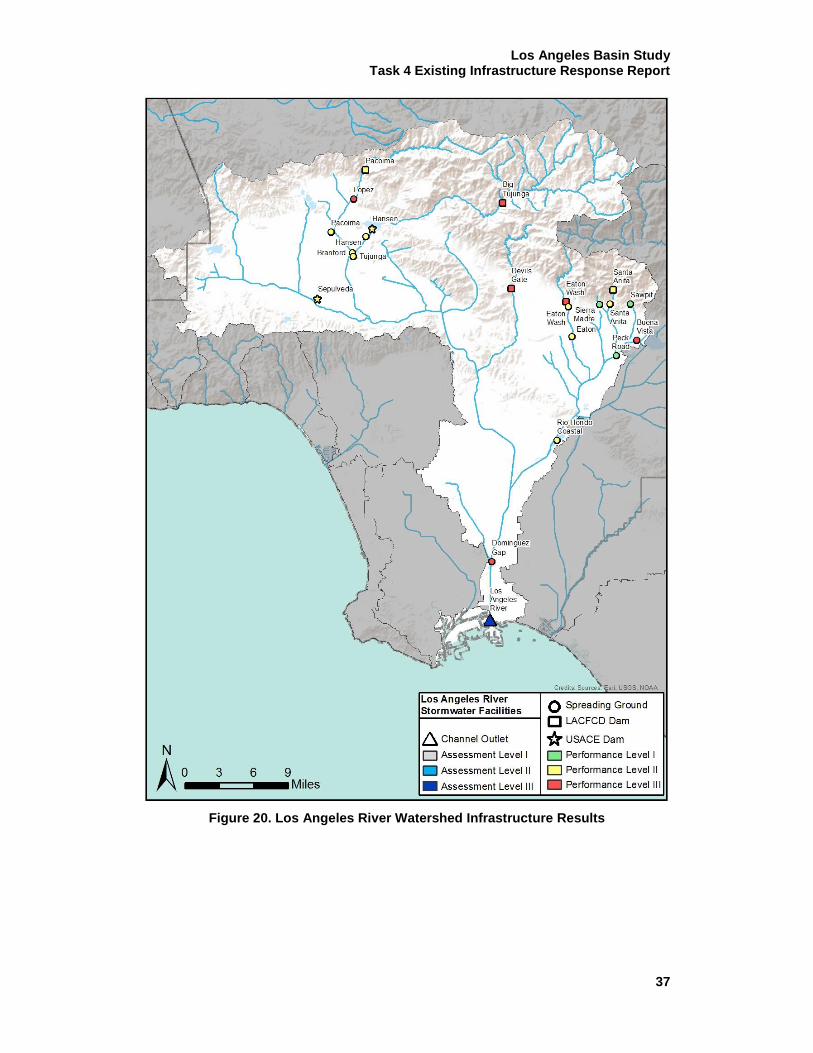
Los Angeles Basin Study Task 4 Existing Infrastructure Response Report
37
Figure 20. Los Angeles River Watershed Infrastructure Results
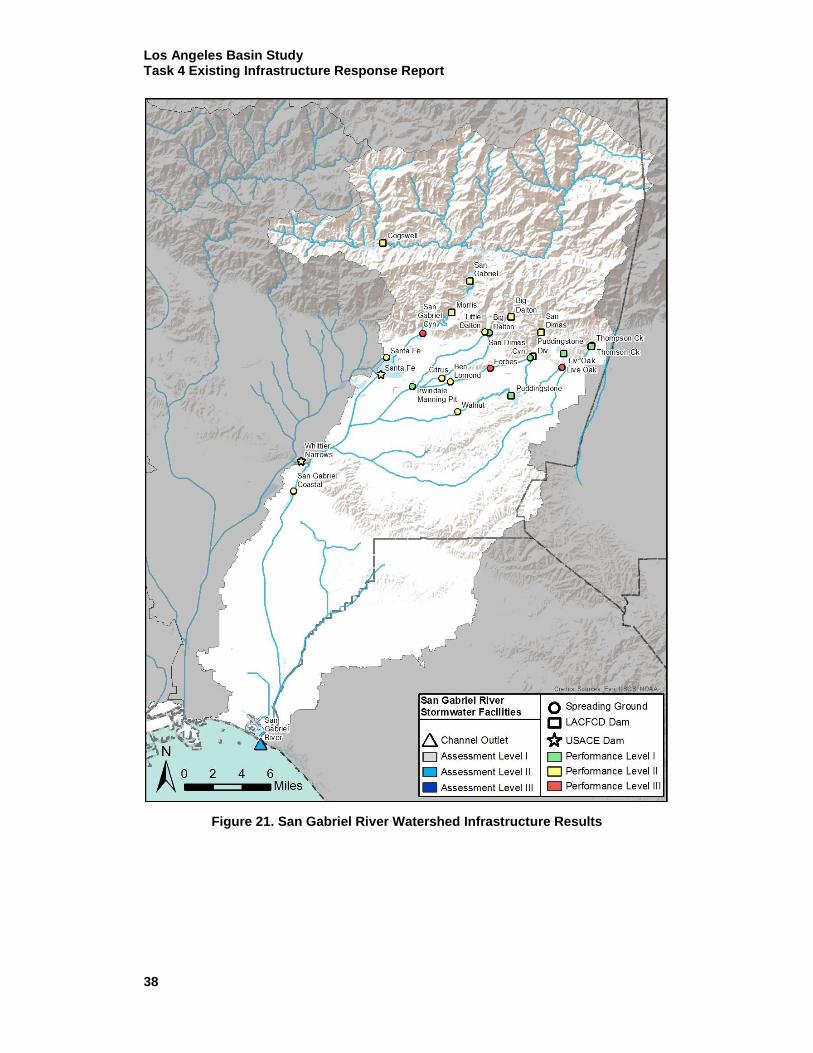
Los Angeles Basin Study Task 4 Existing Infrastructure Response Report
38
Figure 21. San Gabriel River Watershed Infrastructure Results

Los Angeles Basin Study Task 4 Existing Infrastructure Response Report
39
4 Conclusion
The objective of Task 4 was to assess the response of the existing spreading
grounds, dams, and channel outlets throughout the system for both historic and
projected future climate conditions and to assess the potential for increased
stormwater capture. The water conservation and flood risk mitigation network
includes 14 major LACFCD dams and reservoirs, 4 major USACE dams, 26
major spreading grounds, and 5 major channel outlets in the region. This task
built upon the downscaled climate change projections and hydrologic modeling
results of Task 3 of the LA Basin Study to assess stormwater capture and to
analyze infrastructure response and operations plans for the facilities. The 18
dams/reservoirs and 26 spreading grounds were given performance levels
independently; however, these major components were analyzed as a system and
were ranked with respect to the other facilities in the network. Similarly, the 5
major channel outlets in the region were compared to one another for their
stormwater discharges to the ocean, and were assigned assessment levels to assist
in targeting specific watersheds for potential enhancements.
4.1 Dams/Reservoirs
4.1.1 LACFCD Dams
For the dams, the inflow and discharge hydrographs and the stormwater captured
for each of the 14 major LACFCD dams were analyzed. The analysis was
performed for the historical period, which included Water Years 1987 through
2000, and for six separate climate projections for the future period, which
encompassed Water Years 2012 through 2095.
The analysis was performed to determine the following:
Average Annual Volume of Stormwater Captured
Average Annual Volume of Stormwater Discharged through Spillway
Frequency of Spillway Events
The results were used to assign performance levels to the 14 major LACFCD
dams. Specific criteria were used to assign each of the dams to one of three
performance level categories, designated “I” (potential for enhancements) to “III”
(high potential for enhancements). Table A-2 in the Appendix presents a summary
of the results of this analysis and the performance level for each dam. The dams
with the highest potential will be the primary subject of further analysis in Task 5
of the LA Basin Study. Nevertheless, certain lower potential dams may still be
analyzed as well, as there is always some potential for enhancement.
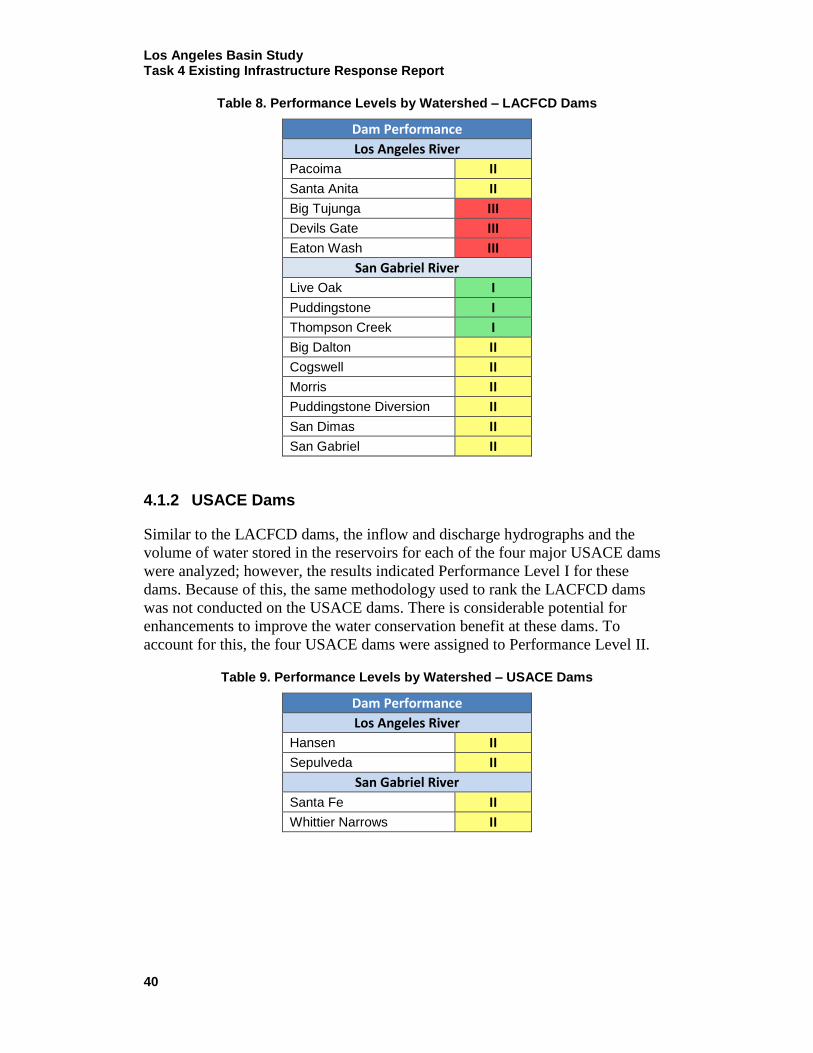
Los Angeles Basin Study Task 4 Existing Infrastructure Response Report
40
Table 8. Performance Levels by Watershed – LACFCD Dams
Dam Performance
Los Angeles River
Pacoima II
Santa Anita II
Big Tujunga III
Devils Gate III
Eaton Wash III
San Gabriel River
Live Oak I
Puddingstone I
Thompson Creek I
Big Dalton II
Cogswell II
Morris II
Puddingstone Diversion II
San Dimas II
San Gabriel II
4.1.2 USACE Dams
Similar to the LACFCD dams, the inflow and discharge hydrographs and the
volume of water stored in the reservoirs for each of the four major USACE dams
were analyzed; however, the results indicated Performance Level I for these
dams. Because of this, the same methodology used to rank the LACFCD dams
was not conducted on the USACE dams. There is considerable potential for
enhancements to improve the water conservation benefit at these dams. To
account for this, the four USACE dams were assigned to Performance Level II.
Table 9. Performance Levels by Watershed – USACE Dams
Dam Performance
Los Angeles River
Hansen II
Sepulveda II
San Gabriel River
Santa Fe II
Whittier Narrows II

Los Angeles Basin Study Task 4 Existing Infrastructure Response Report
41
4.2 Spreading Grounds
For the analysis of the spreading facilities, the total recharge, efficiency, and
future resiliency of the facilities was analyzed. The analysis was performed to
determine the following:
Total Annual Volume of Stormwater Recharged
Total Annual Volume of Stormwater Bypassed
The results were used to assign performance levels to the 26 major spreading
grounds. Specific criteria were used to assign each of the spreading grounds to
one of three performance level categories, designated “I” (potential for
enhancements) to “III” (high potential for enhancements). Table A-4 in the
Appendix presents a summary of the results of this analysis and the performance
level for each facility. The spreading ground facilities with the highest potential
will be the primary subject of further analysis in Task 5 of the LA Basin Study.
Table 10. Performance Levels by Watershed – Spreading Grounds
Spreading Ground Performance Los Angeles River
San Gabriel River Peck Road I Big Dalton I Sawpit I Irwindale I Sierra Madre I San Dimas I Branford II Ben Lomond II Eaton Basin II Citrus II
Eaton Wash II Little Dalton II Hansen/Tujunga II San Gabriel Coastal II Pacoima II Santa Fe II
Rio Hondo II Walnut II Santa Anita II Forbes III Buena Vista III Live Oak III Dominguez Gap III San Gabriel Canyon III
Lopez III
Facilities in Performance Level III that were determined to be the least efficient
and resilient, or have the highest overall potential for stormwater capture have a
multitude of reasons or limitations for this ranking. Although certain facilities
may not be readily adaptable or easily modified, there still is an opportunity for
enhancing stormwater capture in the form of adjacent new infrastructure or even
nearby regional facilities. These regional improvements could help to increase the
overall capture efficiency for a specific area.

Los Angeles Basin Study Task 4 Existing Infrastructure Response Report
42
4.3 Channel Outlets
For the analysis of the major channel outlets, the change in future discharges and
average peak flow rates were analyzed. The analysis was performed to determine
the following:
Average Annual Volume of Stormwater Discharged to the Ocean
Peak Flood Flow Rate
The results were used to assign assessment levels to the 5 major channel outlets
and their respective watersheds. Specific criteria were used to assign each of the
channel outlets to one of three assessment level categories, designated “I” (low
watershed priority for water conservation) to “III” (high watershed priority for
conservation). Table A-6 in the Appendix presents a summary of the results of
this analysis and the assessment level for each outlet. The watersheds containing
the channel outlets with the highest stormwater discharges to the ocean will help
to guide the analysis in Task 5 of the LA Basin Study.
Table 11. Assessment Levels by Watershed – Major Channel Outlets
Channel Outlet Assessment
Watershed
Dominguez Channel I
Malibu Creek I
Ballona Creek II
San Gabriel River II
Los Angeles River III
4.4 Future Considerations
It is very important to understand that this assessment relied upon the current
water conservation and flood risk mitigation system as the baseline condition,
assuming that no modifications were made over the course of the study period.
This uniform baseline was used to assess the current configuration and
operational guidelines for two time periods:
1. Historical Climate Conditions (WY 1987-2000)
2. Future Climate Projections (WY 2012-2095)
This assessment improved the current understanding of whether or not the
existing system would function adequately in the future as compared to its
historical performance. It was found that there is a wide range of overall
efficiency and resiliency within the existing system and that certain facilities are
more readily adaptable to future changes than others. Facilities with the greatest
potential for increased stormwater capture will be the subject of further analysis
under Task 5 – Infrastructure & Operations Concepts.
Los Angeles Basin Study Task 4 Existing Infrastructure Response Report
43
The baseline water conservation and flood risk mitigation system used in this
analysis may change considerably over the course of the future study horizon.
These changes may be both large-scale and small-scale; centralized capture and
decentralized capture; short, quick reforms and longer, more methodical reforms
throughout the entire system over the next century. These changes were
intentionally overlooked so that this analysis could serve as a status quo
assessment of historical conditions and also be a “no action” evaluation of the
future.
Over the course of the LA Basin Study planning horizon, major changes in
technology and significant shifts in policies will certainly occur. These changes
are likely to considerably alter the existing infrastructure and the operational
guidelines that were used in this analysis. These changes will have major impacts
on the water conservation and flood risk mitigation system as well as on the
overall network of watersheds.
Additionally, one of the major changes now being embraced is the
implementation of decentralized stormwater capture. Historically, stormwater
capture was based on a centralized network such as the sites analyzed in Task 4.
While this system has functioned well for nearly a century, newer integrated
regional water management techniques are improving upon the processes.
Decentralized stormwater capture will play an increasingly important role in local
water supply and contribute to the broader hydrologic network to help
complement the existing infrastructure. While the current goals of the existing
infrastructure is to provide water conservation and flood risk mitigation to the
region, future engineering techniques, improved scientific understanding, shifts in
policies, and further collaboration among agencies will help to transform the
existing infrastructure into a system that is well prepared to perform into the
future.
Los Angeles Basin Study Task 4 Existing Infrastructure Response Report
44
5 References
Department of Finance, 2013. State of California, Department of Finance, Report
P-1 (County): State and County Total Population Projections, 2010-2060.
Sacramento, California, January 2013. Online: (http://www.dof.ca.gov/
research/demographic/reports/projections/P-1/).
LACFCD, 2013. Los Angeles Basin Stormwater Conservation Study: Task 3.2
Hydrologic Modeling Report. Prepared for Los Angeles County Flood
Control District, by Los Angeles County Department of Public Works,
Alhambra, California. September 2013. Online:
(http://www.usbr.gov/lc/socal/basinstudies/LABasin.html)
MWD, 2012. Annual Report 2012. The Metropolitan Water District of Southern
California, Los Angeles, California. 2012. Online:
(http://www.mwdh2o.com/mwdh2o/pages/about/AR/AR12/2012AR-low-
res.pdf)
Reclamation, 2009. Basin Study Framework: WaterSMART Program. U.S.
Department of the Interior, Bureau of Reclamation. Washington D.C.
December 2009. Online: (http://www.usbr.gov/WaterSMART/
bsp/docs/Revised%20Framework%202.26.13.pdf>.
Reclamation, 2013. Los Angeles Basin Stormwater Conservation Study: Task 3.1.
Downscaled Climate Change Report. Prepared for the U.S. Department of
the Interior, Bureau of Reclamation by the Technical Service Center,
Denver Colorado. September 2013. Online:
(http://www.usbr.gov/lc/socal/basinstudies/LA-Basin-Study-
Report_October2013.pdf)
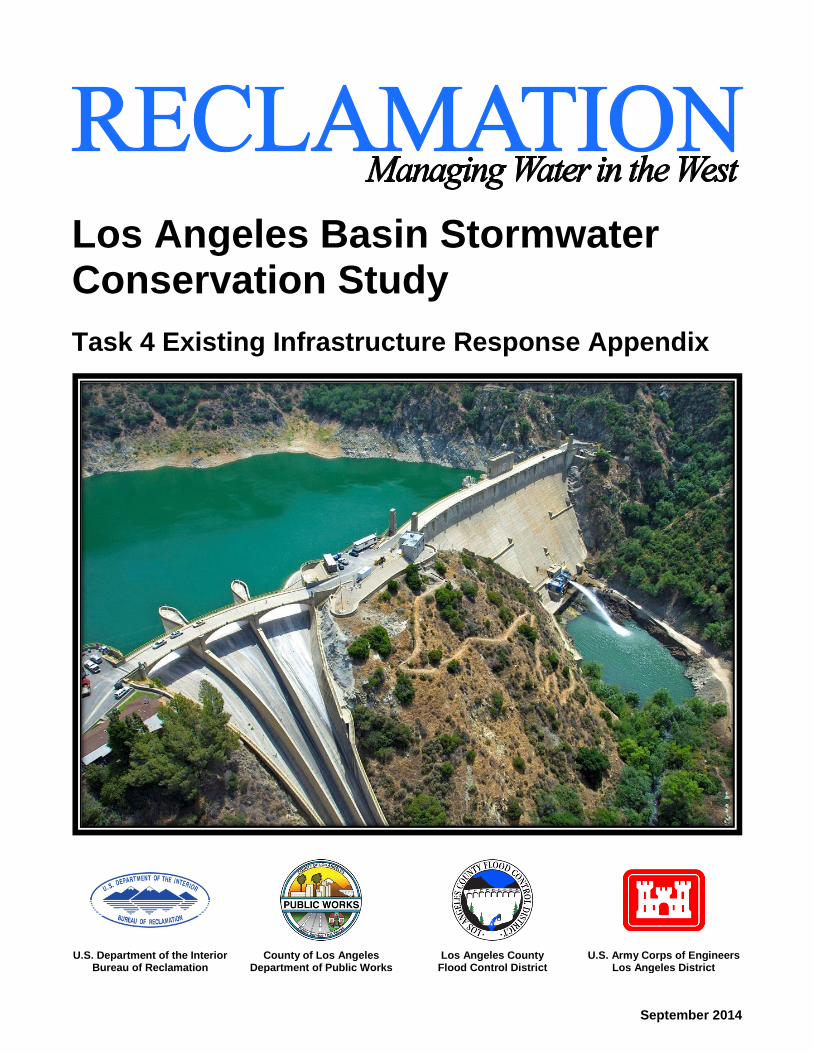
September 2014
Los Angeles Basin Stormwater Conservation Study
Task 4 Existing Infrastructure Response Appendix
U.S. Department of the Interior Bureau of Reclamation
County of Los Angeles Department of Public Works
Los Angeles County Flood Control District
U.S. Army Corps of Engineers Los Angeles District

This page intentionally left blank.
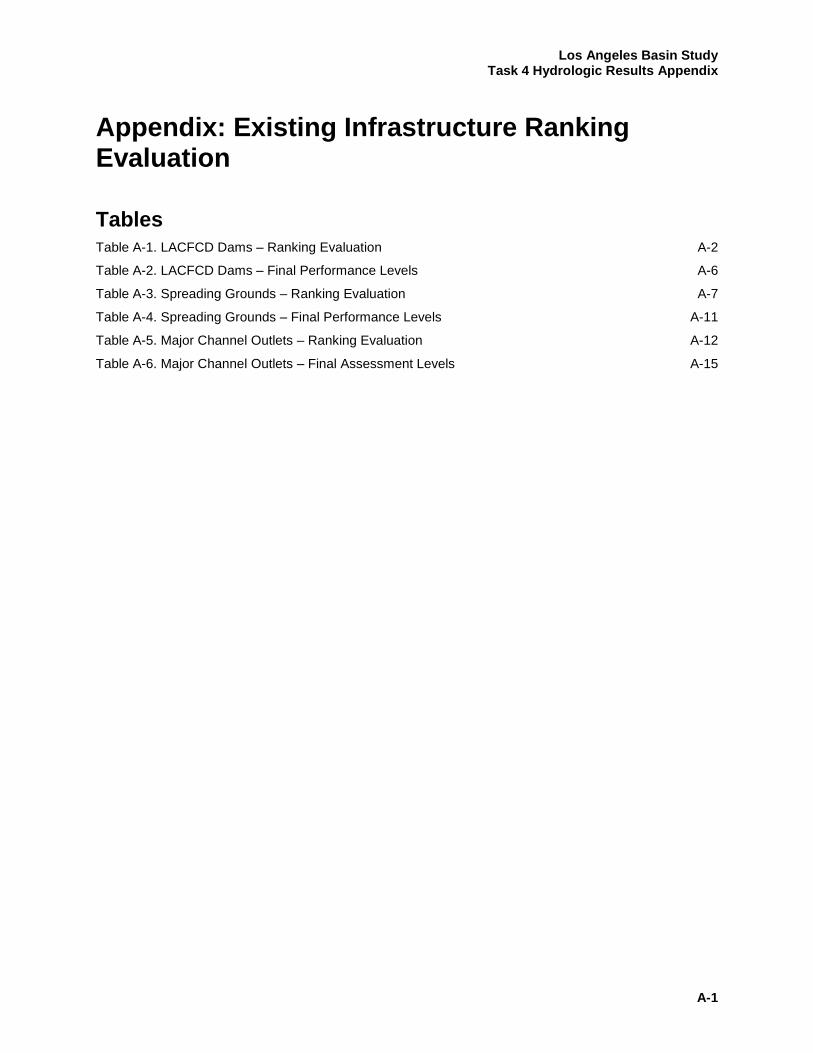
Los Angeles Basin Study Task 4 Hydrologic Results Appendix
A-1
Appendix: Existing Infrastructure Ranking Evaluation
Tables
Table A-1. LACFCD Dams – Ranking Evaluation A-2
Table A-2. LACFCD Dams – Final Performance Levels A-6
Table A-3. Spreading Grounds – Ranking Evaluation A-7
Table A-4. Spreading Grounds – Final Performance Levels A-11
Table A-5. Major Channel Outlets – Ranking Evaluation A-12
Table A-6. Major Channel Outlets – Final Assessment Levels A-15
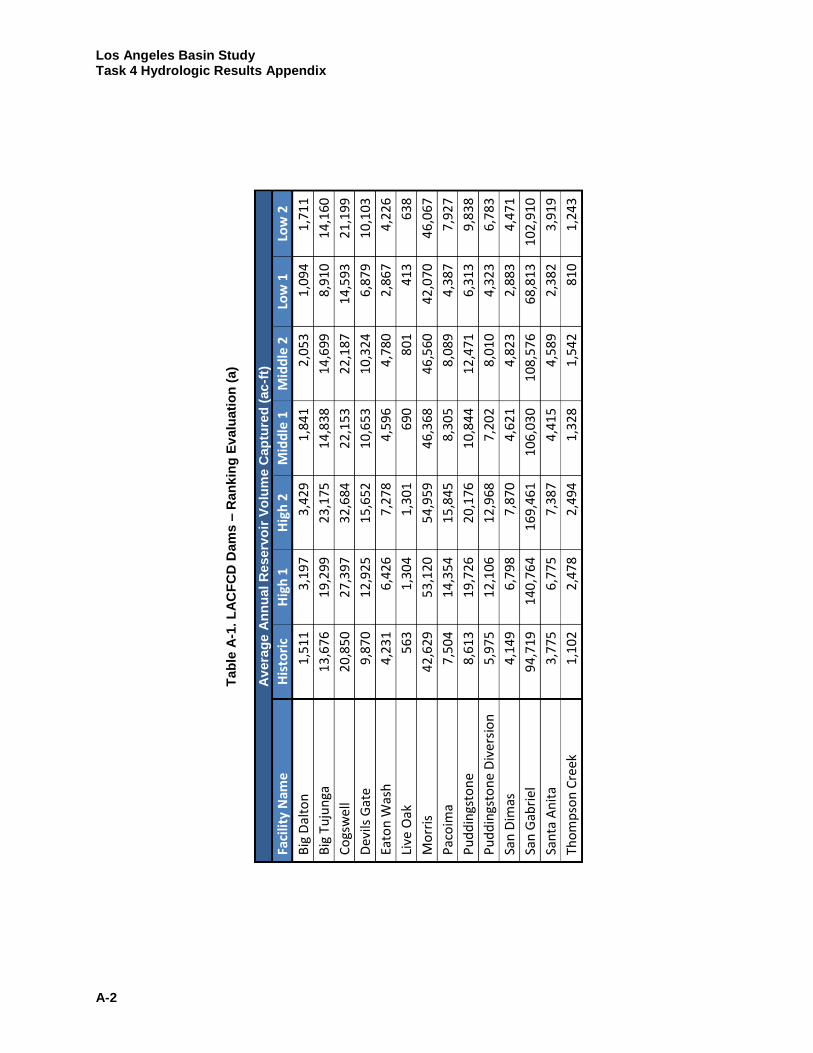
Los Angeles Basin Study Task 4 Hydrologic Results Appendix
A-2
Tab
le A
-1. L
AC
FC
D D
am
s –
Ran
kin
g E
valu
ati
on
(a)
Av
era
ge A
nn
ual
Re
serv
oir
Vo
lum
e C
ap
ture
d (
ac
-ft)
Fa
cilit
y N
ame
H
isto
ric
Hig
h 1
H
igh
2
Mid
dle
1
Mid
dle
2
Low
1
Low
2
Big
Dal
ton
1
,51
1
3,1
97
3
,42
9
1,8
41
2
,05
3
1,0
94
1
,71
1
Big
Tu
jun
ga
13
,67
6
19
,29
9
23
,17
5
14
,83
8
14
,69
9
8,9
10
1
4,1
60
Co
gsw
ell
20
,85
0
27
,39
7
32
,68
4
22
,15
3
22
,18
7
14
,59
3
21
,19
9
Dev
ils G
ate
9,8
70
1
2,9
25
1
5,6
52
1
0,6
53
1
0,3
24
6
,87
9
10
,10
3
Eato
n W
ash
4
,23
1
6,4
26
7
,27
8
4,5
96
4
,78
0
2,8
67
4
,22
6
Live
Oak
5
63
1
,30
4
1,3
01
6
90
8
01
4
13
6
38
Mo
rris
4
2,6
29
5
3,1
20
5
4,9
59
4
6,3
68
4
6,5
60
4
2,0
70
4
6,0
67
Pac
oim
a 7
,50
4
14
,35
4
15
,84
5
8,3
05
8
,08
9
4,3
87
7
,92
7
Pu
dd
ings
ton
e 8
,61
3
19
,72
6
20
,17
6
10
,84
4
12
,47
1
6,3
13
9
,83
8
Pu
dd
ings
ton
e D
iver
sio
n
5,9
75
1
2,1
06
1
2,9
68
7
,20
2
8,0
10
4
,32
3
6,7
83
San
Dim
as
4,1
49
6
,79
8
7,8
70
4,6
21
4
,82
3
2,8
83
4
,47
1
San
Gab
riel
9
4,7
19
1
40
,76
4
16
9,4
61
1
06
,03
0
10
8,5
76
6
8,8
13
1
02
,91
0
San
ta A
nit
a 3
,77
5
6,7
75
7
,38
7
4,4
15
4
,58
9
2,3
82
3
,91
9
Tho
mp
son
Cre
ek
1,1
02
2
,47
8
2,4
94
1
,32
8
1,5
42
8
10
1
,24
3

Los Angeles Basin Study Task 4 Hydrologic Results Appendix
A-3
Tab
le A
-1. L
AC
FC
D D
am
s –
Ran
kin
g E
valu
ati
on
(b
)
Av
era
ge A
nn
ual
Re
serv
oir
Sp
illw
ay V
olu
me (
ac
-ft)
Fa
cilit
y N
ame
H
isto
ric
Hig
h 1
H
igh
2
Mid
dle
1
Mid
dle
2
Low
1
Low
2
Big
Dal
ton
0
26
7
69
46
5
6
12
2
1
Big
Tu
jun
ga
9,0
96
3
4,2
89
28
,93
1
11
,70
1 1
6,2
77
5,4
25
1
0,8
41
Co
gsw
ell
6,8
29
2
5,8
98
2
1,4
83
9
,84
2
12
,47
7
4,4
04
8
,15
8
Dev
ils G
ate
5,5
62
1
9,2
77
1
4,9
74
7
,23
0
9,7
74
3
,77
0
6,1
27
Eato
n W
ash
6
40
2
,73
9
2,1
86
9
21
1
,29
1
50
0
85
4
Live
Oak
0
31
1
4 7
1
3
4
5
Mo
rris
7
4,8
89
1
89
,34
1
19
6,3
23
9
6,1
29
1
09
,91
0
43
,51
6
84
,46
5
Pac
oim
a 6
46
4
,12
3
2,9
67
9
23
1
,36
8
61
3
65
1
Pu
dd
ings
ton
e 0
41
3
0
13
3
0
0
0
Pu
dd
ings
ton
e D
iver
sio
n
29
1
1,9
75
1
,83
0
76
6
89
5
37
1
53
3
San
Dim
as
61
8
4,0
66
3
,61
0
1,5
25
2
,09
4
74
0
1,1
44
San
Gab
riel
2
0,1
23
9
4,7
85
7
5,4
18
3
3,1
98
4
4,1
51
1
5,3
02
2
4,6
40
San
ta A
nit
a 2
05
1
,86
2
1,1
15
4
48
6
44
2
82
3
82
Tho
mp
son
Cre
ek
0 6
2
20
16
2
6
8
9

Los Angeles Basin Study Task 4 Hydrologic Results Appendix
A-4
Tab
le A
-1. L
AC
FC
D D
am
s –
Ran
kin
g E
valu
ati
on
(c)
His
tori
c an
d F
utu
re C
aptu
re E
ffic
ien
cie
s Fa
cilit
y N
ame
H
ist.
D
1 H
igh
1
Hig
h 2
M
id. 1
M
id. 2
Lo
w 1
Lo
w 2
M
in.
D2
Ch
ange
D
3
Big
Dal
ton
1
00%
1
92
%
98
%
98
%
97
%
99
%
99
%
92
%
4
-8%
4
Big
Tu
jun
ga
60%
1
3 3
6%
4
4%
5
6%
4
7%
6
2%
5
7%
3
6%
1
3
-24
%
13
Co
gsw
ell
75%
1
1 5
1%
6
0%
6
9%
6
4%
7
7%
7
2%
5
1%
1
1
-24
%
12
Dev
ils G
ate
64%
1
2 4
0%
5
1%
6
0%
5
1%
6
5%
6
2%
4
0%
1
2
-24
%
11
Eato
n W
ash
8
7%
9
70
%
77
%
83
%
79
%
85
%
83
%
70
%
8 -1
7%
9
Live
Oak
1
00%
1
98
%
99
%
99
%
98
%
99
%
99
%
98
%
2
-2%
2
Mo
rris
3
6%
14
22
%
22
%
33
%
30
%
49
%
35
%
22
%
14
-1
4%
7
Pac
oim
a 9
2%
7 7
8%
8
4%
9
0%
8
6%
8
8%
9
2%
7
8%
7
-1
4%
6
Pu
dd
ings
ton
e 1
00%
1
98
%
10
0%
9
9%
1
00
%
10
0%
1
00
%
98
%
1
-2%
1
Pu
d. D
iv.
95%
5
86
%
88
%
90
%
90
%
92
%
93
%
86
%
5
-9%
5
San
Dim
as
87%
8
63
%
69
%
75
%
70
%
80
%
80
%
63
%
9
-24
%
14
San
Gab
riel
8
2%
10
60
%
69
%
76
%
71
%
82
%
81
%
60
%
10
-2
3%
1
0
San
ta A
nit
a 9
5%
6
78
%
87
%
91
%
88
%
89
%
91
%
78
%
6 -1
6%
8
Tho
mp
son
Crk
. 1
00%
1
98
%
99
%
99
%
98
%
99
%
99
%
98
%
3
-2%
3
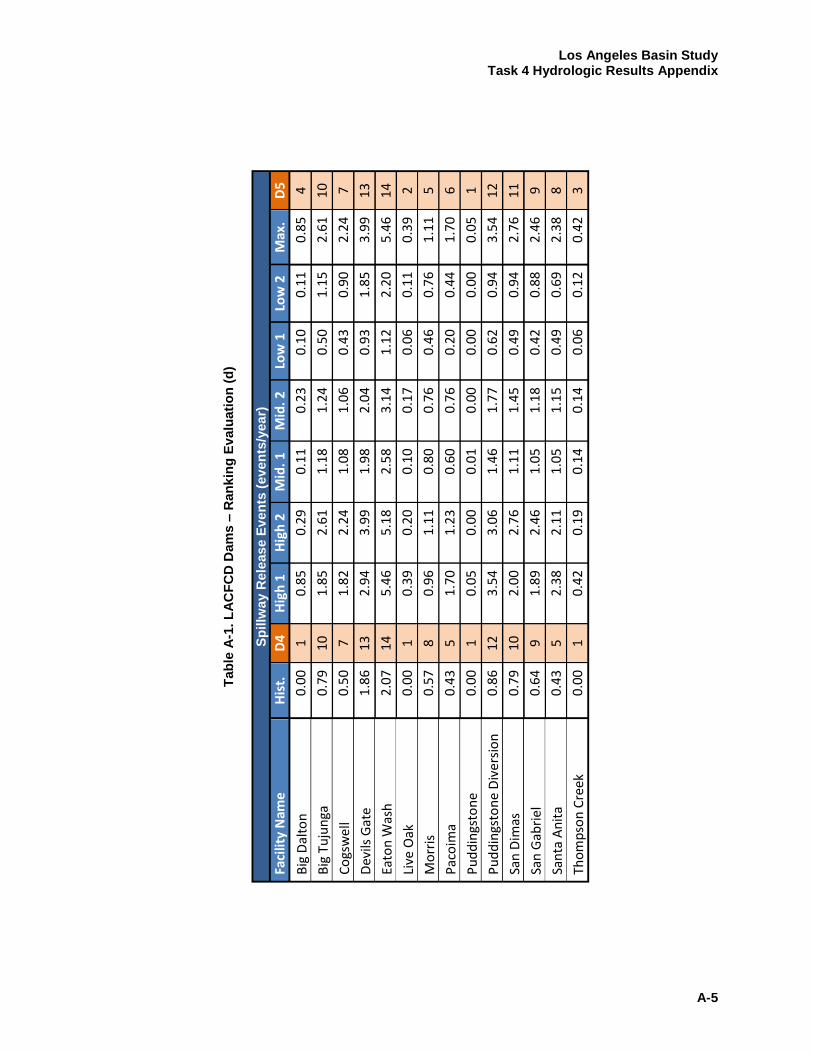
Los Angeles Basin Study Task 4 Hydrologic Results Appendix
A-5
Tab
le A
-1. L
AC
FC
D D
am
s –
Ran
kin
g E
valu
ati
on
(d
)
Sp
illw
ay R
ele
as
e E
ven
ts (
ev
en
ts/y
ea
r)
Faci
lity
Nam
e
His
t.
D4
Hig
h 1
H
igh
2
Mid
. 1
Mid
. 2
Low
1
Low
2
Max
. D
5
Big
Dal
ton
0
.00
1
0
.85
0
.29
0
.11
0
.23
0
.10
0
.11
0
.85
4
Big
Tu
jun
ga
0.7
9
10
1.8
5
2.6
1
1.1
8
1.2
4
0.5
0
1.1
5
2.6
1
10
Co
gsw
ell
0.5
0
7
1.8
2
2.2
4
1.0
8
1.0
6 0
.43
0
.90
2
.24
7
Dev
ils G
ate
1.8
6
13
2.9
4
3.9
9
1.9
8
2.0
4
0.9
3
1.8
5
3.9
9
13
Eato
n W
ash
2
.07
1
4 5
.46
5
.18
2
.58
3
.14
1
.12
2
.20
5
.46
1
4
Live
Oak
0
.00
1
0
.39
0
.20
0
.10
0
.17
0
.06
0
.11
0
.39
2
Mo
rris
0
.57
8
0
.96
1
.11
0
.80
0
.76
0
.46
0
.76
1
.11
5
Pac
oim
a 0
.43
5
1
.70
1
.23
0
.60
0
.76
0
.20
0
.44
1
.70
6
Pu
dd
ings
ton
e 0
.00
1
0
.05
0
.00
0
.01
0
.00
0
.00
0
.00
0
.05
1
Pu
dd
ings
ton
e D
iver
sio
n
0.8
6
12
3.5
4
3.0
6
1.4
6
1.7
7
0.6
2
0.9
4
3.5
4
12
San
Dim
as
0.7
9
10
2.0
0
2.7
6
1.1
1
1.4
5
0.4
9
0.9
4
2.7
6
11
San
Gab
riel
0
.64
9
1
.89
2
.46
1
.05
1
.18
0
.42
0
.88
2
.46
9
San
ta A
nit
a 0
.43
5
2
.38
2
.11
1
.05
1
.15
0
.49
0
.69
2
.38
8
Tho
mp
son
Cre
ek
0.0
0
1 0
.42
0
.19
0
.14
0
.14
0
.06
0
.12
0
.42
3

Los Angeles Basin Study Task 4 Hydrologic Results Appendix
A-6
Tab
le A
-2. L
AC
FC
D D
am
s –
Fin
al
Pe
rfo
rman
ce L
ev
els
LAC
FCD
Dam
s D
1
D2
D3
D4
D
5 A
vera
ge
Leve
l
Big
Dal
ton
1
4
4
1 4
2
.8
II
Big
Tu
jun
ga
13
1
3
13
1
0
10
1
1.8
II
I
Co
gsw
ell
11
1
1
12
7
7
9.6
II
De
vils
Gat
e 1
2
12
1
1
13
1
3
12
.2
III
Eato
n W
ash
9
8
9
14
1
4
10
.8
III
Live
Oak
1
2 2
1 2
1.6
I
Mo
rris
1
4
14
7
8
5
9.6
II
Pac
oim
a 7
7
6
5 6
6
.2
II
Pu
dd
ings
ton
e
1 1
1
1
1
1.0
I
Pu
dd
ings
ton
e D
iver
sio
n
5 5
5
1
2
12
7
.8
II
San
Dim
as
8 9
1
4
10
1
1
10
.4
II
San
Gab
riel
1
0
10
1
0
9 9
9
.6
II
San
ta A
nit
a 6
6
8
5 8
6
.6
II
Tho
mp
son
Cre
ek
1 3
3
1
3
2.2
I
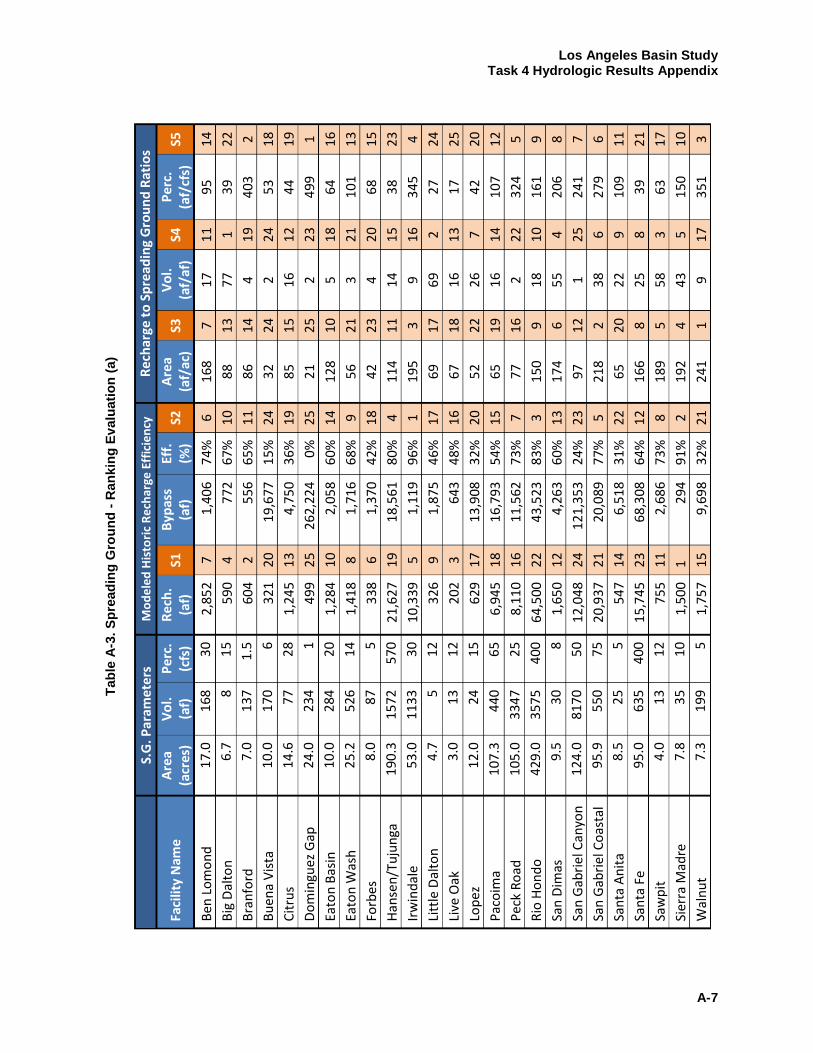
Los Angeles Basin Study Task 4 Hydrologic Results Appendix
A-7
T
ab
le A
-3.
Sp
read
ing
Gro
un
d -
Ran
kin
g E
valu
ati
on
(a)
S.
G. P
aram
ete
rs
Mo
de
led
His
tori
c R
ech
arge
Eff
icie
ncy
R
ech
arge
to
Sp
read
ing
Gro
un
d R
atio
s
Faci
lity
Nam
e
Are
a (a
cres
) V
ol.
(a
f)
Pe
rc.
(cfs
) R
ech
. (a
f)
S1
Byp
ass
(af)
Ef
f.
(%)
S2
Are
a (a
f/ac
) S3
V
ol.
(a
f/af
) S4
P
erc
. (a
f/cf
s)
S5
Ben
Lo
mo
nd
1
7.0
1
68
30
2,8
52
7
1,4
06
7
4%
6
1
68
7
17
1
1
95
14
Big
Dal
ton
6
.7
8 1
5 5
90
4
77
2
67
%
10
8
8
13
7
7
1
39
22
Bra
nfo
rd
7.0
1
37
1.5
6
04
2
55
6
65
%
11
8
6
14
4
19
4
03
2
Bu
ena
Vis
ta
10
.0
170
6
3
21
2
0
19
,67
7
15
%
24
3
2
24
2
24
5
3 1
8
Cit
rus
14
.6
77
28
1,2
45
1
3
4,7
50
3
6%
1
9
85
1
5
16
1
2
44
19
Do
min
guez
Gap
2
4.0
2
34
1
49
9
25
2
62
,22
4
0%
2
5
21
2
5
2 2
3
49
9 1
Eato
n B
asin
1
0.0
2
84
20
1,2
84
1
0
2,0
58
6
0%
1
4
128
1
0
5 1
8
64
16
Eato
n W
ash
2
5.2
5
26
14
1,4
18
8
1,7
16
6
8%
9
5
6
21
3
21
1
01
13
Forb
es
8.0
8
7 5
3
38
6
1,3
70
4
2%
1
8
42
2
3
4 2
0
68
15
Han
sen
/Tu
jun
ga
19
0.3
1
57
2
57
0
21
,62
7 1
9 1
8,5
61
80
%
4 1
14
11
14
15
38
23
Irw
ind
ale
53
.0
113
3
30
10
,33
9
5 1
,11
9
96
%
1
195
3
9
16
3
45
4
Litt
le D
alto
n
4.7
5
12
32
6
9 1
,87
5
46
%
17
6
9
17
6
9
2
27
24
Live
Oak
3
.0
13
12
20
2
3 6
43
4
8%
1
6
67
1
8
16
1
3
17
25
Lop
ez
12
.0
24
15
62
9
17
1
3,9
08
3
2%
2
0
52
2
2
26
7
4
2 2
0
Pac
oim
a 1
07.3
4
40
65
6,9
45
1
8
16
,79
3
54
%
15
6
5
19
1
6
14
1
07
12
Pec
k R
oad
1
05.0
3
347
2
5 8
,11
0
16
1
1,5
62
7
3%
7
7
7
16
2
22
3
24
5
Rio
Ho
nd
o
429
.0
357
5
40
0
64
,50
0
22
4
3,5
23
8
3%
3
1
50
9
18
1
0
16
1 9
San
Dim
as
9.5
3
0 8
1
,65
0
12
4
,26
3
60
%
13
1
74
6
55
4
2
06
8
San
Gab
riel
Can
yon
1
24
.0
81
70
5
0 1
2,0
48
24
12
1,3
53
2
4%
2
3 9
7 1
2 1
25
24
1 7
San
Gab
riel
Co
asta
l 9
5.9
5
50
75
20
,93
7
21
2
0,0
89
7
7%
5
2
18
2
38
6
2
79
6
San
ta A
nit
a 8
.5
25
5
54
7
14
6
,51
8
31
%
22
6
5
20
2
2
9
10
9 1
1
San
ta F
e 9
5.0
6
35
40
0
15
,74
5
23
68
,30
8
64
%
12
1
66
8
25
8
3
9 2
1
Saw
pit
4
.0
13
12
75
5
11
2
,68
6
73
%
8
189
5
5
8
3
63
17
Sier
ra M
adre
7
.8
35
10
1,5
00
1
29
4
91
%
2
192
4
4
3
5
15
0 1
0
Wal
nu
t 7
.3
199
5
1
,75
7
15
9
,69
8
32
%
21
2
41
1
9 1
7
35
1 3
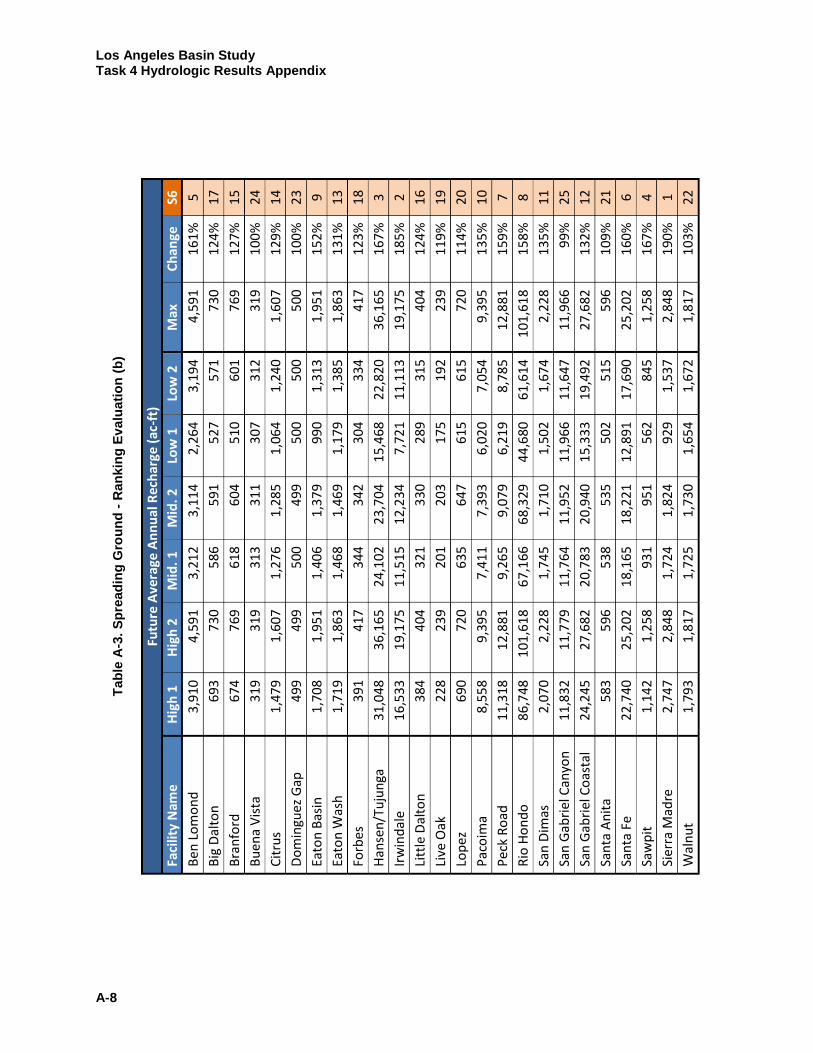
Los Angeles Basin Study Task 4 Hydrologic Results Appendix
A-8
T
ab
le A
-3.
Sp
read
ing
Gro
un
d -
Ran
kin
g E
valu
ati
on
(b
)
Futu
re A
vera
ge A
nn
ual
Rec
har
ge (
ac-f
t)
Faci
lity
Nam
e
Hig
h 1
H
igh
2
Mid
. 1
Mid
. 2
Low
1
Low
2
Max
C
han
ge
S6
Ben
Lo
mo
nd
3
,91
0
4,5
91
3
,21
2
3,1
14
2
,26
4
3,1
94
4
,59
1
16
1%
5
Big
Dal
ton
6
93
73
0
58
6
59
1
52
7
57
1
73
0
12
4%
1
7
Bra
nfo
rd
674
7
69
6
18
6
04
5
10
6
01
7
69
12
7%
1
5
Bu
ena
Vis
ta
319
3
19
3
13
3
11
3
07
3
12
3
19
1
00
%
24
Cit
rus
1,4
79
1
,60
7
1,2
76
1
,28
5
1,0
64
1
,24
0
1,6
07
1
29
%
14
Do
min
guez
Gap
4
99
49
9
50
0
49
9
50
0
50
0
50
0
10
0%
2
3
Eato
n B
asin
1
,70
8
1,9
51
1
,40
6
1,3
79
9
90
1
,31
3
1,9
51
1
52
%
9
Eato
n W
ash
1
,71
9
1,8
63
1
,46
8
1,4
69
1
,17
9
1,3
85
1
,86
3
13
1%
1
3
Forb
es
391
4
17
3
44
3
42
3
04
3
34
4
17
1
23
%
18
Han
sen
/Tu
jun
ga
31
,048
3
6,1
65
2
4,1
02
23
,70
4
15
,46
8
22
,820
3
6,1
65
1
67
%
3
Irw
ind
ale
1
6,5
33
19
,17
5
11
,51
5 1
2,2
34
7
,72
1
11
,113
1
9,1
75
1
85
%
2
Litt
le D
alto
n
384
4
04
3
21
3
30
2
89
3
15
4
04
1
24
%
16
Live
Oak
2
28
23
9 2
01
20
3 1
75
19
2 2
39
11
9%
1
9
Lop
ez
690
7
20
6
35
6
47
6
15
6
15
7
20
1
14
%
20
Pac
oim
a 8
,55
8
9,3
95
7
,41
1
7,3
93
6
,02
0
7,0
54
9
,39
5
13
5%
1
0
Pec
k R
oad
1
1,3
18
12
,88
1
9,2
65
9
,07
9
6,2
19
8
,78
5
12
,88
1
15
9%
7
Rio
Ho
nd
o
86
,748
1
01
,61
8
67
,16
6 6
8,3
29
4
4,6
80
6
1,6
14
10
1,6
18
1
58
%
8
San
Dim
as
2,0
70
2
,22
8
1,7
45
1
,71
0
1,5
02
1
,67
4
2,2
28
1
35
%
11
San
Gab
riel
Can
yon
1
1,8
32
11
,77
9
11
,76
4 1
1,9
52
1
1,9
66
1
1,6
47
11
,96
6
99
%
25
San
Gab
riel
Co
asta
l 2
4,2
45
27
,68
2
20
,78
3 2
0,9
40
1
5,3
33
1
9,4
92
27
,68
2
13
2%
1
2
San
ta A
nit
a 5
83
59
6
53
8
53
5
50
2
51
5
59
6
10
9%
2
1
San
ta F
e 2
2,7
40
25
,20
2
18
,16
5 1
8,2
21
1
2,8
91
1
7,6
90
25
,20
2
16
0%
6
Saw
pit
1
,14
2
1,2
58
9
31
9
51
5
62
8
45
1
,25
8
16
7%
4
Sier
ra M
adre
2
,74
7
2,8
48
1
,72
4
1,8
24
9
29
1
,53
7
2,8
48
1
90
%
1
Wal
nu
t 1
,79
3
1,8
17
1
,72
5
1,7
30
1
,65
4
1,6
72
1
,81
7
10
3%
2
2
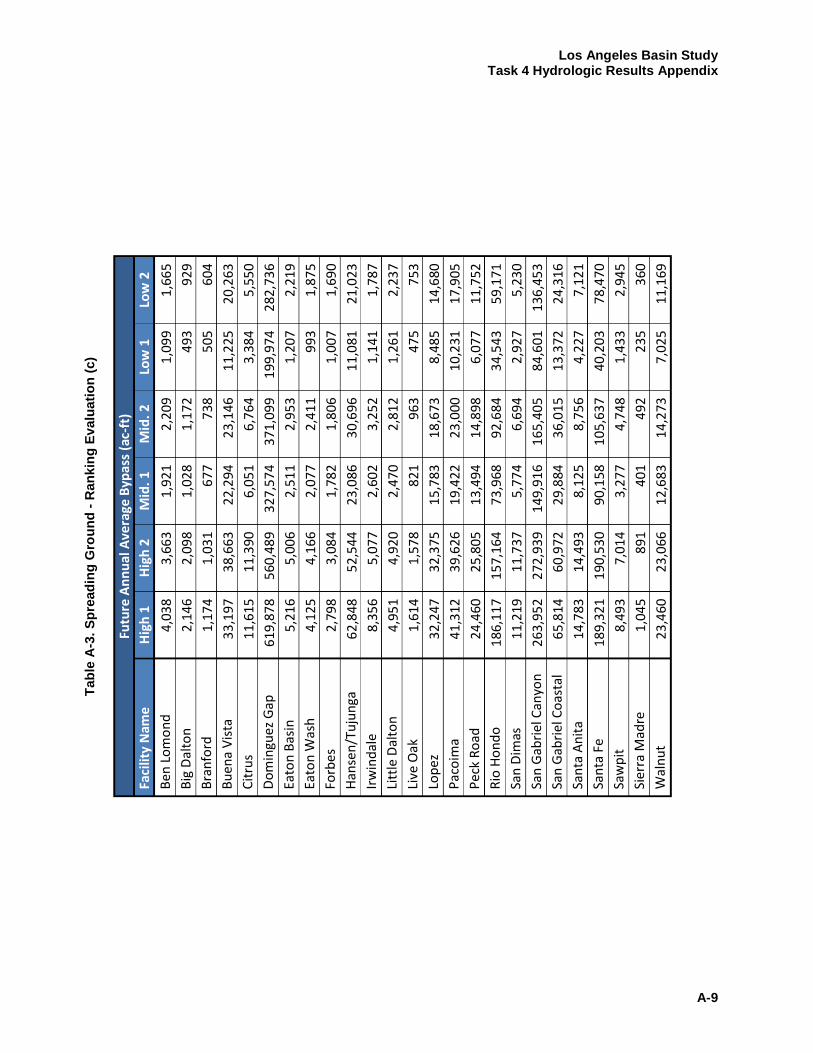
Los Angeles Basin Study Task 4 Hydrologic Results Appendix
A-9
T
ab
le A
-3.
Sp
read
ing
Gro
un
d -
Ran
kin
g E
valu
ati
on
(c)
Futu
re A
nn
ual
Ave
rage
Byp
ass
(ac-
ft)
Faci
lity
Nam
e
Hig
h 1
H
igh
2
Mid
. 1
Mid
. 2
Low
1
Low
2
Ben
Lo
mo
nd
4
,03
8
3,6
63
1
,92
1
2,2
09
1,0
99
1
,66
5
Big
Dal
ton
2
,14
6
2,0
98
1
,02
8
1,1
72
49
3
92
9
Bra
nfo
rd
1,1
74
1
,03
1
67
7
73
8
50
5
60
4
Bu
ena
Vis
ta
33
,19
7
38
,66
3
22
,29
4
23
,14
6 1
1,2
25
2
0,2
63
C
itru
s 1
1,6
15
1
1,3
90
6
,05
1
6,7
64
3,3
84
5
,55
0
Do
min
guez
Gap
6
19
,87
8
56
0,4
89
3
27
,57
4
37
1,0
99
1
99
,97
4
28
2,7
36
Ea
ton
Bas
in
5,2
16
5
,00
6
2,5
11
2
,95
3 1
,20
7
2,2
19
Ea
ton
Was
h
4,1
25
4
,16
6
2,0
77
2
,41
1 9
93
1
,87
5
Forb
es
2,7
98
3
,08
4
1,7
82
1
,80
6 1
,00
7
1,6
90
H
anse
n/T
uju
nga
6
2,8
48
5
2,5
44
2
3,0
86
3
0,6
96
11
,08
1
21
,02
3
Irw
ind
ale
8,3
56
5
,07
7
2,6
02
3
,25
2 1
,14
1
1,7
87
Li
ttle
Dal
ton
4
,95
1
4,9
20
2
,47
0
2,8
12
1,2
61
2
,23
7
Live
Oak
1
,61
4
1,5
78
8
21
96
3 4
75
75
3 Lo
pez
3
2,2
47
3
2,3
75
1
5,7
83
1
8,6
73
8,4
85
1
4,6
80
P
aco
ima
41
,31
2
39
,62
6
19
,42
2
23
,00
0 1
0,2
31
1
7,9
05
P
eck
Ro
ad
24
,46
0
25
,80
5
13
,49
4
14
,89
8 6
,07
7
11
,75
2
Rio
Ho
nd
o
18
6,1
17
1
57
,16
4
73
,96
8
92
,68
4 3
4,5
43
5
9,1
71
Sa
n D
imas
1
1,2
19
1
1,7
37
5
,77
4
6,6
94
2,9
27
5
,23
0
San
Gab
riel
Can
yon
2
63
,95
2
27
2,9
39
1
49
,91
6
16
5,4
05
8
4,6
01
1
36
,45
3
San
Gab
riel
Co
asta
l 6
5,8
14
6
0,9
72
2
9,8
84
3
6,0
15
13
,37
2
24
,31
6
San
ta A
nit
a 1
4,7
83
1
4,4
93
8
,12
5
8,7
56
4,2
27
7
,12
1
San
ta F
e 1
89
,32
1
19
0,5
30
9
0,1
58
10
5,6
37
4
0,2
03
78
,47
0 Sa
wp
it
8,4
93
7
,01
4
3,2
77
4
,74
8 1
,43
3
2,9
45
Si
erra
Mad
re
1,0
45
8
91
4
01
4
92
2
35
3
60
W
aln
ut
23
,46
0
23
,06
6
12
,68
3
14
,27
3 7
,02
5
11
,16
9
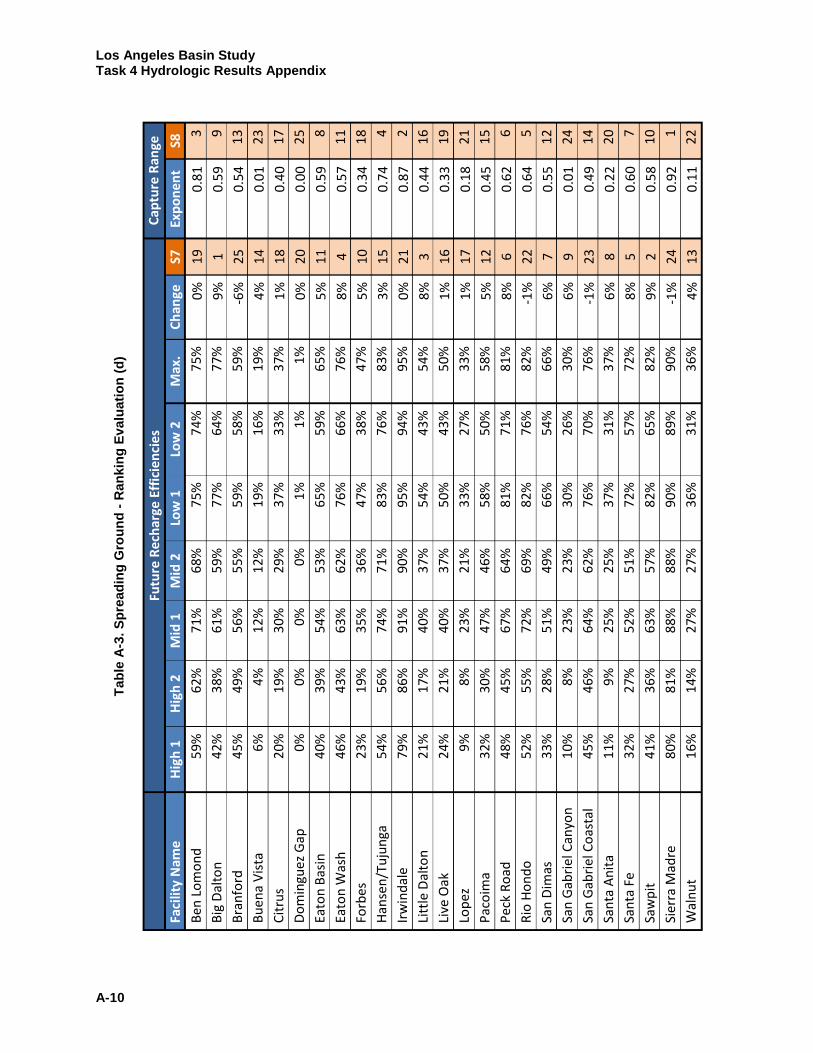
Los Angeles Basin Study Task 4 Hydrologic Results Appendix
A-10
T
ab
le A
-3.
Sp
read
ing
Gro
un
d -
Ran
kin
g E
valu
ati
on
(d
)
Fu
ture
Re
char
ge E
ffic
ien
cie
s C
aptu
re R
ange
Faci
lity
Nam
e
Hig
h 1
H
igh
2
Mid
1
Mid
2
Low
1
Low
2
Max
. C
han
ge
S7
Exp
on
ent
S8
Ben
Lo
mo
nd
5
9%
62
%
71
%
68
%
75
%
74
%
75
%
0%
1
9
0.8
1
3
Big
Dal
ton
4
2%
38
%
61
%
59
%
77
%
64
%
77
%
9%
1
0
.59
9
Bra
nfo
rd
45%
4
9%
5
6%
5
5%
5
9%
5
8%
5
9%
-6
%
25
0
.54
1
3
Bu
ena
Vis
ta
6%
4
%
12
%
12
%
19
%
16
%
19
%
4%
1
4
0.0
1
23
Cit
rus
20%
1
9%
3
0%
2
9%
3
7%
3
3%
3
7%
1
%
18
0
.40
1
7
Do
min
guez
Gap
0
%
0%
0
%
0%
1
%
1%
1
%
0%
2
0
0.0
0
25
Eato
n B
asin
4
0%
39
%
54
%
53
%
65
%
59
%
65
%
5%
1
1
0.5
9
8
Eato
n W
ash
4
6%
43
%
63
%
62
%
76
%
66
%
76
%
8%
4
0
.57
1
1
Forb
es
23%
1
9%
3
5%
3
6%
4
7%
3
8%
47
%
5%
1
0
0.3
4
18
Han
sen
/Tu
jun
ga
54%
5
6%
7
4%
7
1%
8
3%
7
6%
8
3%
3
%
15
0
.74
4
Irw
ind
ale
79
%
86
%
91
%
90
%
95
%
94
%
95
%
0%
2
1 0
.87
2
Litt
le D
alto
n
21%
1
7%
4
0%
3
7%
5
4%
4
3%
5
4%
8
%
3
0.4
4
16
Live
Oak
2
4%
21
%
40
%
37
%
50
%
43
%
50
%
1%
1
6
0.3
3
19
Lop
ez
9%
8
%
23
%
21
%
33
%
27
%
33
%
1%
1
7
0.1
8
21
Pac
oim
a 3
2%
30
%
47
%
46
%
58
%
50
%
58
%
5%
1
2
0.4
5
15
Pec
k R
oad
4
8%
45
%
67
%
64
%
81
%
71
%
81
%
8%
6
0
.62
6
Rio
Ho
nd
o
52%
5
5%
7
2%
6
9%
8
2%
7
6%
8
2%
-1
%
22
0
.64
5
San
Dim
as
33%
2
8%
5
1%
4
9%
6
6%
5
4%
6
6%
6
%
7
0.5
5
12
San
Gab
riel
Can
yon
1
0%
8%
2
3%
2
3%
3
0%
2
6%
3
0%
6
%
9
0.0
1
24
San
Gab
riel
Co
asta
l 4
5%
46
%
64
%
62
%
76
%
70
%
76
%
-1%
2
3
0.4
9
14
San
ta A
nit
a 1
1%
9%
2
5%
2
5%
3
7%
3
1%
3
7%
6
%
8
0.2
2
20
San
ta F
e 3
2%
27
%
52
%
51
%
72
%
57
%
72
%
8%
5
0
.60
7
Saw
pit
4
1%
36
%
63
%
57
%
82
%
65
%
82
%
9%
2
0
.58
1
0
Sier
ra M
adre
8
0%
81
%
88
%
88
%
90
%
89
%
90
%
-1%
2
4
0.9
2
1
Wal
nu
t 1
6%
14
%
27
%
27
%
36
%
31
%
36
%
4%
1
3
0.1
1
22

Los Angeles Basin Study Task 4 Hydrologic Results Appendix
A-11
T
ab
le A
-4.
Sp
read
ing
Gro
un
d –
Fin
al
Perf
orm
an
ce L
ev
els
Spre
adin
g G
rou
nd
S1
S2
S3
S4
S5
S6
S7
S8
A
vera
ge
Leve
l
Ben
Lo
mo
nd
7
6 7
11
1
4
5 1
9
3
10
.8
II
Big
Dal
ton
4
10
13
1
2
2
17
1
9
9
.6
I
Bra
nfo
rd
2 1
1 1
4
19
2
15
2
5
13
1
2.6
II
Bu
ena
Vis
ta
20
24
24
2
4
18
2
4
14
2
3
21
.4
III
Cit
rus
13
19
15
1
2
19
1
4
18
1
7
15
.9
II
Do
min
guez
Gap
2
5 2
5 2
5
23
1
23
2
0
25
2
0.9
II
I
Eato
n B
asin
1
0 1
4 1
0
18
1
6
9 1
1
8
12
.0
II
Eato
n W
ash
8
9 2
1
21
1
3
13
4
1
1
12
.5
II
Forb
es
6 1
8 2
3 2
0 1
5 1
8 1
0 1
8 1
6 III
Han
sen
/Tu
jun
ga
19
4 1
1
15
2
3
3 1
5
4
11
.8
II
Irw
ind
ale
5 1
3 1
6
4 2
21
2
6
.8
I
Litt
le D
alto
n
9 1
7 1
7
2
24
1
6
3
16
1
3.0
II
Live
Oak
3
16
18
1
3
25
1
9
16
1
9
16
.1
III
Lop
ez
17
20
22
7
2
0
20
1
7
21
1
8.0
II
I
Pac
oim
a 1
8 1
5 1
9
14
1
2
10
1
2
15
1
4.4
II
Pe
ck R
oad
1
6 7
16
2
2
5 7
6
6
10
.6
I
Rio
Ho
nd
o
22
3 9
10
9
8 2
2
5
11
.0
II
San
Dim
as
12
13
6 4
8
11
7
1
2
9.1
I
San
Gab
riel
Can
yon
2
4 2
3 1
2
25
7
25
9
2
4
18
.6
III
San
Gab
riel
Co
asta
l 2
1 5
2 6
6
12
2
3
14
1
1.1
II
San
ta A
nit
a 1
4 2
2 2
0
9
11
2
1
8
20
1
5.6
II
San
ta F
e
23
12
8 8
2
1
6 5
7
1
1.3
II
Saw
pit
1
1 8
5 3
1
7
4 2
1
0
7.5
I
Sier
ra M
adre
1
2 4
5
10
1
24
1
6
.0
I
Wal
nu
t 1
5 2
1 1
17
3
22
1
3
22
1
4.3
II
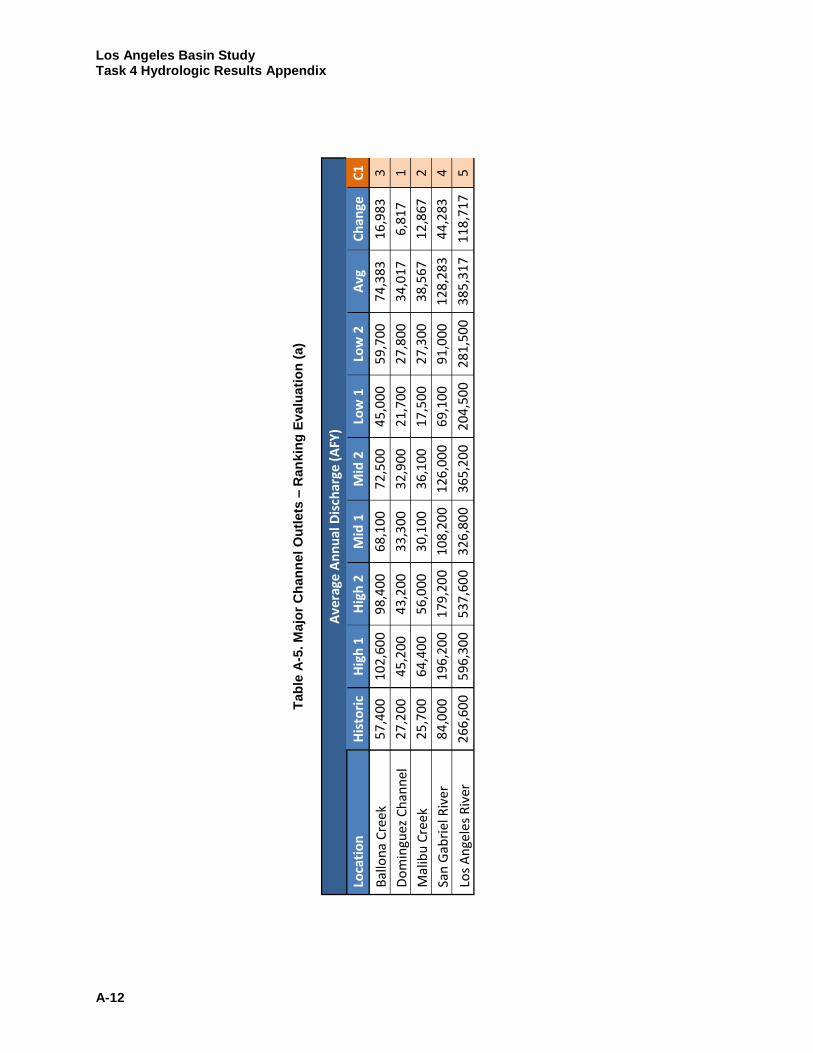
Los Angeles Basin Study Task 4 Hydrologic Results Appendix
A-12
Tab
le A
-5. M
ajo
r C
han
ne
l O
utl
ets
– R
an
kin
g E
valu
ati
on
(a)
Ave
rage
An
nu
al D
isch
arge
(A
FY)
Loca
tio
n
His
tori
c H
igh
1
Hig
h 2
M
id 1
M
id 2
Lo
w 1
Lo
w 2
A
vg
Ch
ange
C
1
Bal
lon
a C
ree
k 5
7,4
00
10
2,6
00
9
8,4
00
6
8,1
00
7
2,5
00
4
5,0
00
5
9,7
00
7
4,3
83
1
6,9
83
3
Do
min
guez
Ch
ann
el
27
,200
4
5,2
00
4
3,2
00
3
3,3
00
3
2,9
00
2
1,7
00
2
7,8
00
3
4,0
17
6
,81
7
1
Mal
ibu
Cre
ek
25
,700
6
4,4
00
5
6,0
00
3
0,1
00
3
6,1
00
1
7,5
00
2
7,3
00
3
8,5
67
1
2,8
67
2
San
Gab
riel
Riv
er
84
,000
1
96
,20
0
17
9,2
00
1
08
,20
0
12
6,0
00
6
9,1
00
9
1,0
00
1
28
,28
3
44
,28
3
4
Los
An
gele
s R
iver
2
66,6
00
5
96
,30
0
53
7,6
00
3
26
,80
0
36
5,2
00
2
04
,50
0
28
1,5
00
3
85
,31
7
11
8,7
17
5
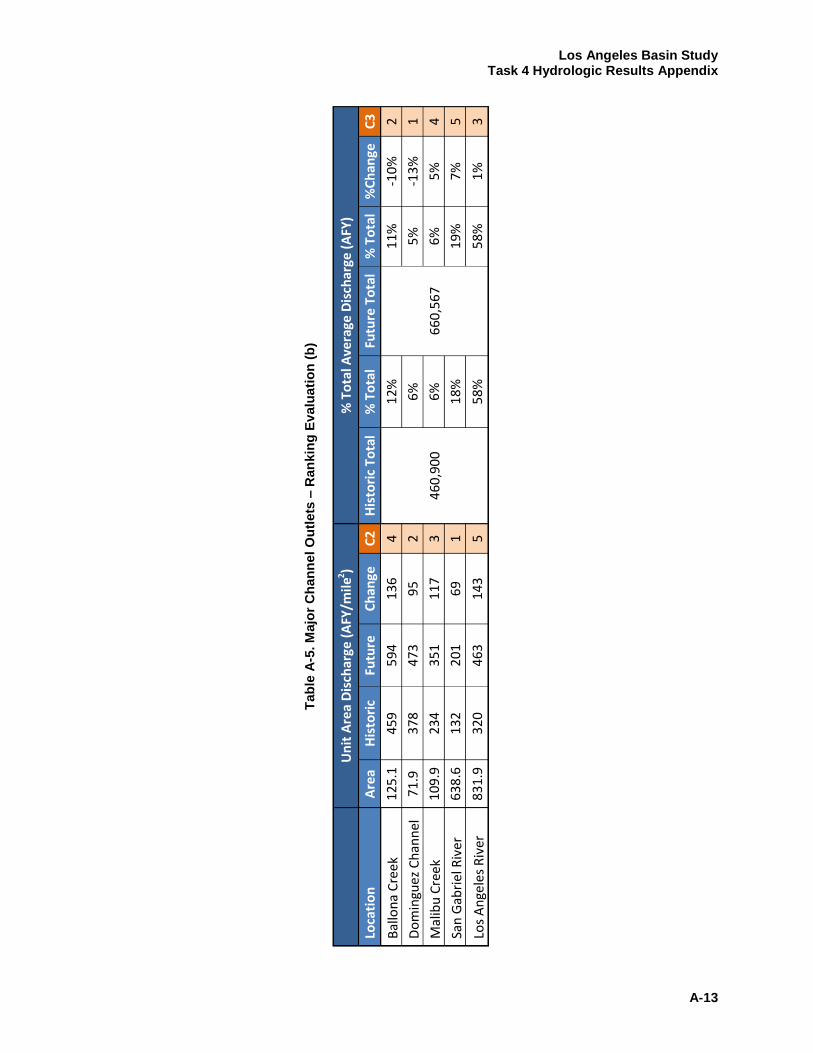
Los Angeles Basin Study Task 4 Hydrologic Results Appendix
A-13
Tab
le A
-5. M
ajo
r C
han
ne
l O
utl
ets
– R
an
kin
g E
valu
ati
on
(b
)
U
nit
Are
a D
isch
arge
(A
FY/m
ile2 )
% T
ota
l Ave
rage
Dis
char
ge (
AFY
)
Loca
tio
n
Are
a H
isto
ric
Futu
re
Ch
ange
C
2
His
tori
c T
ota
l %
To
tal
Futu
re T
ota
l %
To
tal
%C
han
ge
C3
Bal
lon
a C
ree
k 1
25.1
4
59
59
4
13
6
4
46
0,9
00
12
%
66
0,5
67
11
%
-10
%
2
Do
min
guez
Ch
ann
el
71
.9
378
4
73
9
5
2 6
%
5%
-1
3%
1
Mal
ibu
Cre
ek
109
.9
234
3
51
1
17
3
6%
6
%
5%
4
San
Gab
riel
Riv
er
638
.6
132
2
01
6
9
1 1
8%
1
9%
7
%
5
Los
An
gele
s R
iver
8
31.9
3
20
46
3
14
3 5
58
%
58
%
1%
3
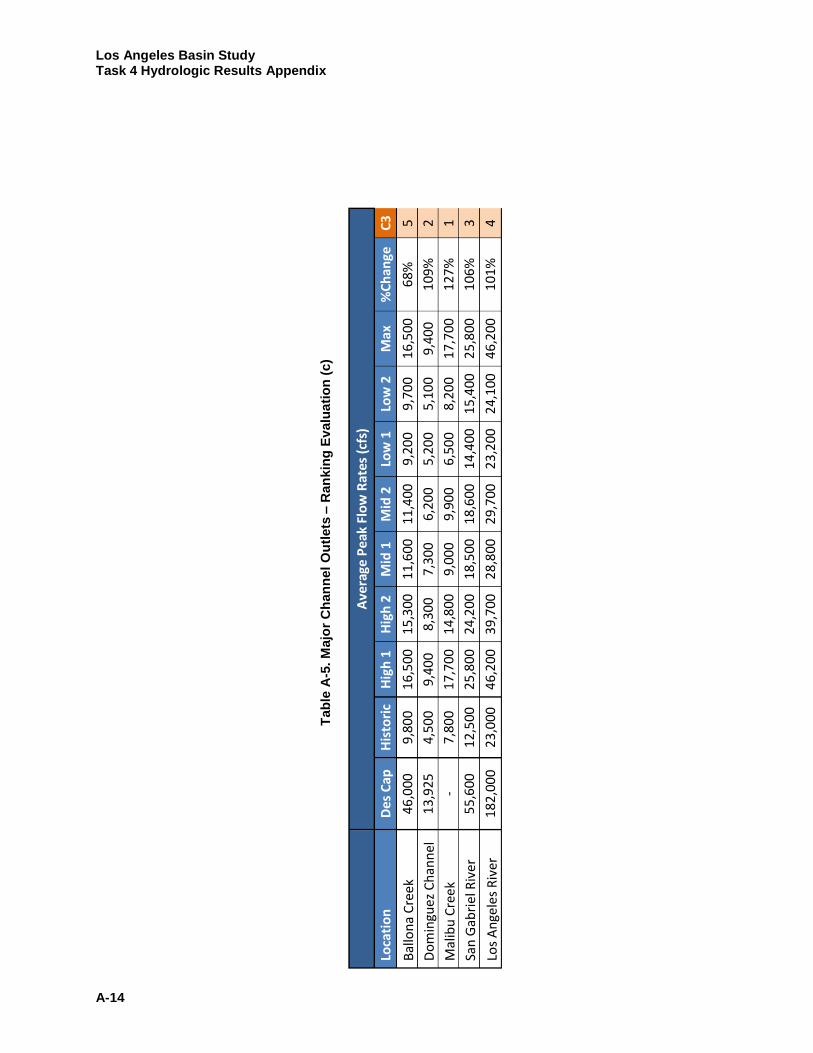
Los Angeles Basin Study Task 4 Hydrologic Results Appendix
A-14
Tab
le A
-5. M
ajo
r C
han
ne
l O
utl
ets
– R
an
kin
g E
valu
ati
on
(c)
A
vera
ge P
eak
Flo
w R
ates
(cf
s)
Loca
tio
n
De
s C
ap
His
tori
c H
igh
1
Hig
h 2
M
id 1
M
id 2
Lo
w 1
Lo
w 2
M
ax
%C
han
ge
C3
Bal
lon
a C
ree
k 4
6,0
00
9,8
00
1
6,5
00
1
5,3
00
1
1,6
00
1
1,4
00
9
,20
0
9,7
00
1
6,5
00
6
8%
5
Do
min
guez
Ch
ann
el
13
,925
4
,50
0
9,4
00
8
,30
0
7,3
00
6
,20
0
5,2
00
5
,10
0
9,4
00
1
09
%
2
Mal
ibu
Cre
ek
- 7
,80
0
17
,70
0
14
,80
0
9,0
00
9
,90
0
6,5
00
8
,20
0
17
,70
0
12
7%
1
San
Gab
riel
Riv
er
55
,600
1
2,5
00
25
,80
0
24
,20
0
18
,50
0
18
,60
0
14
,40
0
15
,40
0
25
,80
0
10
6%
3
Los
An
gele
s R
iver
1
82,0
00
2
3,0
00
46
,20
0
39
,70
0
28
,80
0
29
,70
0
23
,20
0
24
,10
0
46
,20
0
10
1%
4

Los Angeles Basin Study Task 4 Hydrologic Results Appendix
A-15
Tab
le A
-6. M
ajo
r C
han
ne
l O
utl
ets
– F
inal
As
sessm
en
t L
ev
els
Maj
or
Ch
ann
el O
utl
et
Met
ric
Ran
kin
gs
Loca
tio
n
C1
C
2
C3
C
4
AV
G
Leve
l
Bal
lon
a C
reek
3
4 2
5 3
.50
II
Do
min
guez
Ch
ann
el
1 2
1 2
1.5
0
I
Mal
ibu
Cre
ek
2 3
4 1
2.5
0
I
San
Gab
riel
Riv
er
4 1
5 3
3.2
5
II
Los
An
gele
s R
iver
5
5 3
4 4
.25
II
I