Embed Size (px)
Citation preview

Written: March 1970
Distributed: July 1970
LA-4449UC-41, HEALTHAND SAFETYandUC-80, REACTORTECHNOLOGY
LOS ALAMOS SCIENTIFIC LABORATORYof the
University of CaliforniaLOS ALAMOS • NEW MEXICO
A Risk Analysis of the
Omega West Reactor
by
Harry J. OtwayMorris E. Battat
Ronald K. LohrdingRobert D. TurnerRichard L. Cubitt
-LEGAL NOTICE-This report was prepared as an account of worksponsored by the United States Government. Neitherthe United State* nor the United States Atomic EnergyCommission, nor any of their employees, nor any oftheir contractors, subcontractors, or their employees,makes any warranty, express or implied, or assumes anylegal liability or responsibility for the accuracy, com-pleteness or usefulness of any information, apparatus,product or process disclosed, or represents that its usewould not infringe privately owned rights.
rjir/miDirnoN o r THIS noc-.-Mi--.xT is UNLIMITED.,
A RISK ANALYSIS OF THE OMEGA WEST REACTOR
Harry J. Otway, Morris E. Battat, Ronald K. Lohrding,Robert D. Turner, and Richard L. Cubitt
ABSTRACT
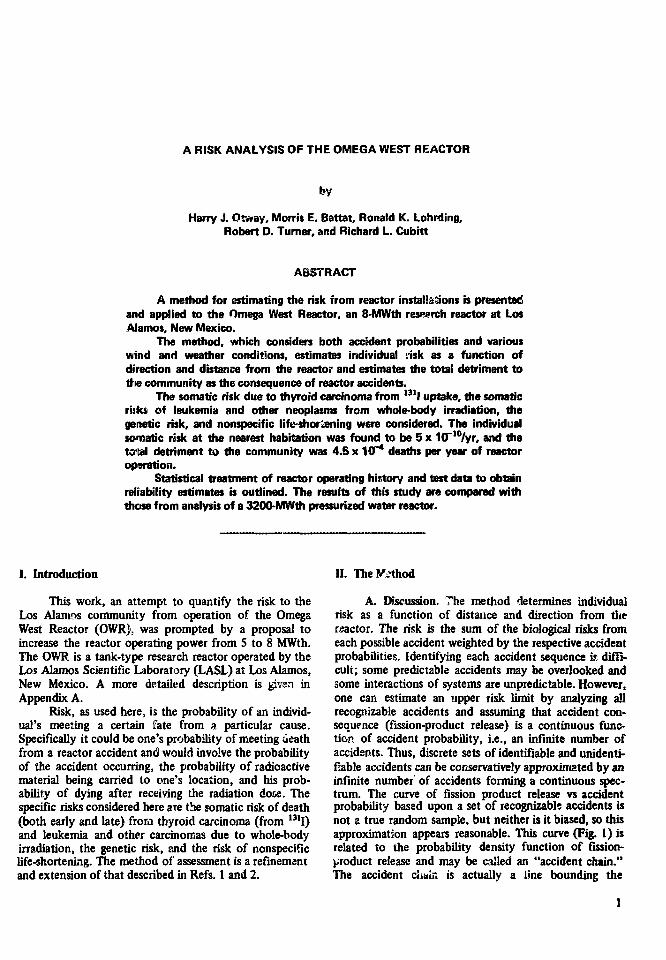
A method for estimating the risk from reactor installations is presentedand applied to the Omega West Reactor, an 8-MWth research reactor at LosAlamos, New Mexico.
The method, which considers both accident probabilities and variouswind and weather conditions, estimates individual risk as a function ofdirection and distance from the reactor and estimates the total detriment tottiie community as the consequence of reactor accidents.
The somatic risk due to thyroid carcinoma from 131I uptake, the somaticrinks of leukemia and other neoplasms from whole-body irradiation, thegenetic risk, and nonspecific life-shortening were considered. The individualsonnatic risk at the nearest habitation was found to be 5 x 10Tlo/yr, and thetotal detriment to the community was 4.5 x 1CT* deaths per year of reactoropsration.
Statistical treatment of reactor operating hiitory and test data to obtainreliability estimates is outlined. The results of this study are compared withthose from analysis of a 3200-MWth pressurized water reactor.
I. Introduction
This work, an attempt to quantify the risk to theLos Alamos community from operation of the OmegaWest Reactor (OWR). was prompted by a proposal toincrease the reactor operating power from 5 to 8 MWth.The OWR is a tank-type research reactor operated by theLos Alamos Scientific Laboratory (LASL) at Los Alamos,New Mexico. A more detailed description is given inAppendix A.
Risk, as used here, is the probability of an individ-ual's meeting a certain fate from a particular cause.Specifically it could be one's probability of meeting aeathfrom a reactor accident and would involve the probabilityof the accident occurring, the probability of radioactivematerial being carried to one's location, and his prob-ability of dying after receiving the radiation dose. Thespecific risks considered here are the somatic risk of death(both early and late) from thyroid carcinoma (from 13lI)and leukemia and other carcinomas due to whole-bodyirradiation, the genetic risk, and the risk of nonspecificlife-shortening. The method of assessment is a refinementand extension of that described in Refs. 1 and 2.
II. The Method
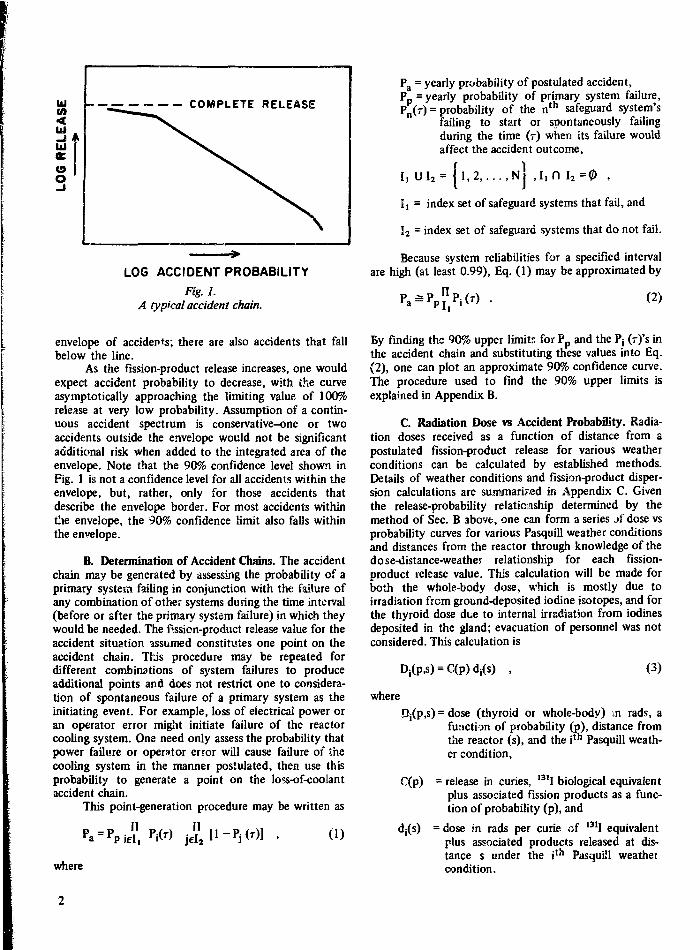
A. Discussion. The method determines individualrisk as a function of distance and direction from diereactor. The risk is the sum of the biological risks fromeach possible accident weighted by the respective accidentprobabilities. Identifying each accident sequence is diffi-cult; some predictable accidents may be overlooked andsome interactions of systems are unpredictable. However,one can estimate an upper risk limit by analyzing allrecognizable accidents and assuming that accident con-sequence (fission-product release) is a continuous func-tion of accident probability, i.e., an infinite number ofaccidents. Thus, discrete sets of identifiable and unidenti-fiable accidents can be conservatively approximated by aninfinite number' of accidents forming a continuous spec-trum. The curve of fission product release vs accidentprobability based upon a set of recognizable accidents isnot a true random sample, but neither is it biased, so thisapproximation appears reasonable. This curve (Fig. 1) isrelated to the probability density function of fusion-product release and may be called an "accident chain."The accident chain is actually a line bounding the
1
COMPLETE RELEASE
LOG ACCIDENT PROBABILITY
Fig. 1.A typical accident chain.
envelope of accidents; there are also accidents that fallbelow the line.
As the fission-product release increases, one wouldexpect accident probability to decrease, with the curveasymptotically approaching the limiting value of 100%release at very low probability. Assumption of a contin-uous accident spectrum is conservative-one or twoaccidents outside the envelope would not be significantadditional risk when added to the integrated area of theenvelope. Note that the 90% confidence level shown inFig. 1 is not a confidence level for all accidents within theenvelope, but, rather, only for those accidents thatdescribe the envelope border. For most accidents withinthe envelope, the 90% confidence limit also falls withinthe envelope.
B. Determination of Accident Chains. The accidentchain may be generated by assessing the probability of aprimary system failing in conjunction with the failure ofany combination of other systems during the time interval(before or after the primary system failure) in which theywould be needed. The fission-product release value for theaccident situation assumed constitutes one point on theaccident chain. Tfus procedure may be repeated fordifferent combinations of system failures to produceadditional points and does not restrict one to considera-tion of spontaneous failure of a primary system as theinitiating event. For example, loss of electrical power oran operator error might initiate failure of the reactorcooling system. One need only assess the probability thatpower failure or operator error will cause failure of thecooling system in the manner postulated, then use thisprobability to generate a point on the loss-of-coolantaccident chain.
This point-generation procedure may be written as
n n (1)
Pa = yearly probability of postulated accident,P_ = yearly probability of primary system failure,P£(T) = probability of the n t h safeguard system's
failing to start or spontaneously failingduring the time (r) when its failure wouldaffect the accident outcome,
11 U l2 =
I, = index set of safeguard systems that fail, and
12 = index set of safeguard systems that do not fail.
Because system reliabilities for a specified intervalare high (at least 0.99), Eq. (1) may be approximated by
P ^ p n p . (T\ (2)
By finding the 90% upper limits for P p and the Ps (T)'S inthe accident chain and substituting these values into Eq.(2), one can plot an approximate 90% confidence curve.The procedure used to find the 90% upper limits isexplained in Appendix B.
C. Radiation Dose vs Accident Probability. Radia-tion doses received as a function of distance from apostulated fission-product release for various weatherconditions can be calculated by established methods.Details of weather conditions and fission-product disper-sion calculations are summarised in Appendix C. Giventhe release-probability relationship determined by themethod of Sec. B above, one can form a series jf dose vsprobability curves for various Pasquill weather conditionsand distances from the reactor through knowledge of thedose-distance-weathes- relationship for each fission-product release value. This calculation will be made forboth the whole-body dose, which is mostly due toirradiation from ground-deposited iodine isotopes, and forthe thyroid dose due to internal irradiation from iodinesdeposited in the gland; evacuation of personnel was notconsidered. This calculation is
(3)
whereDj(p,s) = dose (thyroid or whole-body) in rads, a
function of probability (p), distance fromthe reactor (s), and the i t h Pasquill weath-er condition,
<XP)
where
= release in curies, I3II biological equivalentplus associated fission products as a func-tion of probability (p), and
= dose in rads per curie of 131I equivalentplus associated products released at dis-tance s under the i t h Pasquiil weathercondition.

D. Individual Mortality Risk vs Accident Probabil-ity. Once the relationships of radiation dose vs probabilityfor various Pasquill conditions have been determined forthe distances of interest, the relationships correlatingmortality risk and dose (see Sec. IV-B) may be used toobtain mortality risk as a function of accident probabilityfor several distances. The method is not restricted to useof the linear risk-dose assumption employed here:
M j(p^)=D i(p,s)m(p) (4)
where
Mj(p,s) = mortality risk (thyroid or whole-body) forthe i t h Pasquill condition,
Dj(p,s) = defined by Eq. (3), and
m(p) = mortality risk per rad of radiation (thy-roid or whole-body).
E. Individual Risk. The total risk to a person at aspecific distance and angle from the reactor may be foundby integrating the mortality risk of Eq. (4) over allaccident probabilities, then multiplying by the probabilitydensity function of the wind direction and Pasquillweather conditions, and summing over all Pasquill condi-tions. The value thus derived permits one to determinethe risk on the basis of local weather conditions or todetermine a necessary exclusion area.
where
(5)
R(0 ,s) = individual mortality risk per year at dis-tance s and angle 0 (thyroid or whole-body),
Mj(p,s) = defined by Eq. (4),
= probability density function for wind di-rection 9 under the i t h Pasquill condition,and
= probability of the i t h Pasquill condition'soccurring.
These equations effectively determine the risk as afunction of distance, for each Pasquill condition, with thewind assumed to be blowing always in the same directionat the most pessimistic speed. The angular distribution ofwind direction for each Pasquill condition is thm con-sidered to determine the angular distribution of risk. Therisk at every location (6 ,s), for each Pasquill condition isthen added, each risk being weighted by its percentage ofoccurrence.
One could also consider the distributions of windspeed, humidity, and temperature, but they probablywould not appreciably affect the risk estimate.
F. Total Population Risk. The total risk of deathsper year to the population around the reactor site may befound by integrating the individual risk times the popula-tion density over distance and angle from the reactoj.This is a discrete function because the population doesnot occur as a continuum, rather each person is a discretepoint. The distance summation limits are from the ex-clusion boundary out to the point where the populationstops; the angle summation limits are clearly from 0 to360°.
360
T = (6)$<r.O t » 0
where
T = total risk to the population in deaths peryear,
R(0,s) = defined in Eq. (5), and
H(0,s) = number of people at angle 8 and distance sfrom the reactor.
ID. Estimation of Failure Rates
A. Discussion. After one has defined a representa-tive subset of accidents from an assumed accidentcontinuum, the main difficulty is in finding the failureprobability cf each link of the accident chain. The failurerate for each link must be estimated and transformed toprobability using Eq. (B-5) of Appendix B.
Of several ways to estimate failures, the leastrigorous is to have someone familiar with the systemestimate its failure rate. At best this is a poor method, sowhen using it we always recorded an extremely pessimis-tic estimate. Thus, if the study were to be biased, it wouldbe toward higher risk.
Another method is to search the literature to findexperimentally determined failure rates. Two obviousproblems in this type of estimate are that the componentmay be similar but not identical to the component ofinterest, and that the failure rate may have been deter-mined in an environment different from that in which thecomponent of interest operates.
B. Estimation from Reactor Data. A third, mathe-matically pleasing, method of estimating failure rates is touse data from the operating history of the reactor ofinterest o. similar reactors. This is easy if we assume thatthe failures are distributed as a Poisson process withgamma-distributed waiting time to failure and indepen-dent exponentially distributed inter-arrival times. These

assumptions are valid if it can be assumed that mainten-ance and repair result in no wear-out effect.
The problem of accurately estimating failure rateshinges on obtaining enough operating history of a systemand its components. If a component does no- fail in 15 yrof operation, can we accurately estimate its failure rate?Probably not, but we can certainly put an upper boundon th" failure rats and state what confidence we place onthat bound. Take, for example, the electric motor thatoperates the primary spray system of the OWR. Thisspray system has been tested 130 times without failure.We can compute the upper confidence limit for its failurerate using Eq. (3-4) of Appendix B. Using the equation tocompute a 90% confidence interval, we have
0<v< 4.61(2) (130)
= 0.90
r 10"2] =0.0.90
where v is the failure rate for the electric motor. Thisequation implies that, taking one chance in 10 of beingwrong, the failure rate of the electric motor is not greaterthan 1.75 x 10"2/demand. Similarly, for a 99.9% confi-dence interval, we have
= 0.999
Discussed in Appendix D, Sec. 3, is an OWR flappervalve that has been tested 500 times withoui a failure.Using this information, we can compute a 90% confidenceinterval of
3]=0.<and a 99.9% confidence interval of
PjO<K<4.61x lO"3! =0.90
P[O<I><1.36X = 0.999
If we could not find an acceptable failure-rate estimatefor a component with no observed failures, we conserva-tively used the 99.9% upper confidence limit. Thisestimate has some nice properties. It estimates the failurerate of the component in its working environment(although admittedly not in an accident environment) andis forced to be conservative by use of a 99.9% confidencelevel as the estimated average failure rate.
The method for estimating failure rates when atleast one failure occurs is explained in Eq. (B-5) ofAppendix B. Take, for example, the three flow blockageaccidents that have occurred in 500 reactor-years (seeAppendix E, Sec. 4(b)). The exact estimate of the failurerate is 1 - €v, where v = failures/years observed= 6.0 x 10"3/yr. Therefore, ths failure rate is 1 - e " =5.98 x 10"3. This shows that using i> (Eq. (B-5) ofAppendix B) to estimate the failure rate is a goodapproximation for a process observed for 500 yr. Usingthe above information, we can now compute an upper
confidence limit on the failure rate, using Eq. (B-4) ofAppendix B.
IV. Risk
A. The Concept off Risk.* We now attempt to g;vean appreciation for numerical values of risk by consider-ing the values of some that are commonly accepted.Because the reactor risk discussed here is due to reactoraccidents, comparison with other accident risks is heipful.Table I shows selected U.S. accident figures from !966.People are not equally exposed to ail these hazards and,indeed, some are not exposed to some hazards at all, butmany of these accidents are common in our society, sothe risks they provide are representative of the "average"risk to the "average" person.
Accidents providing hazards on the order of 10~3
per person per year are uncommon. When a risk approach-es this level, immediate action is taken to reduce thehazard. This level of risk is unacceptable to everyone.
At an accident level of 10"4 per person per year,people spend money, especially public money, to controlthe cause. Money is spent for traffic signs and control,and police and fire departments are maintained with pub-lic funds. Safety slogans popularized for accidents in thiscategory show an element of fear; e.g., "The life you savemay be your own."
Risks at the level of 10~5 per person per year arestill considered by society. Mothers warn their childrenabout most of these hazards (playing with fire, drowning,firearms, poisons), and some people accept a degree ofinconvenience, such as not traveling by air, to avoid them.
TABLE!
SOME U.S. ACCIDENTAL DEATH STATISTICSFOR 1966 (Ref. 3)
Accident
Motor vehicleFallsFire and explosionDrowningFirearmsPoisoninf (solids and
liquids)CataclysmLightning
TotalDeaths
53,04120,0668,0845,6872,5582,283
155no
Probability ofDeath/Person/Yr
2.7 x 10"**1.0 xlO"4
4.0 x 10's
2.8xlO' s
1.3xl0"s
1.1 x l0" s
8.0 xlO"7
5.5 x lO ' 7
•This section is based in pail upon private communication fromR. R. Brownies of LASL.

Safety slogans for these risks have a piecautionary ring:"Never swim alone," "Never point a gun at another per-son," "Keep medicines out of children's reach."
Accidents with a probability of about 10"5 per per-son per year are not of great concern to the averageperson. He may be aware of them, but he feels they willnever happen to him. Phrases associated with these occur-rences have an element of resignation: "Lightning neverstrikes twice," "An act of God."
Another factor affecting this analysis is that riskassessment seems to be influenced by the number ofpeople dying in an accident and by the amount of accom-panying property damage. An automobile accident thatkills 10 people on the east coast is considered newsworthyin California-10 people killed in 10 separate accidents are:.ot. The Alaska earthquake of 1964 killed 117 peopleand caused property damage of about $311 million. Thelargest commercial airplane crashes (one airplane) killabout 100 people and cause property damage of $5 to100 mi'lion. Reaction to these figures may be comparedwith that to accidents in which people almost always diesingly, such as suffocation, which causes about 1300deaths each year in the USA.
The intent of this discussion was to point out thatthere is a general lack of concern about accidents havingmortality risks of less than 10"6/yr. This will provide acomparison for evaluation of the results of the OWR riskanalysis. A more detailed discussion of accident risks ispresented in Refs. 1 and 2.
B. The Risks Considered. To avoid underestimatingrisks, we assumed that the consequences of irradiation arelinear with dose, that there are no threshold or rateeffects, and that there is no repair of radiation damage.We do not suggest that these conditions representreality-only that they provide an upper limit of risk. It isquite clear that threshold, rate, and repair effects do existand make the actual risks lower than those suggested here.Numerical values of the probability of death per unit doseand the sources of these estimates follow.
A Whole-Body Somatic Risk. The risks included inwhole-body somatic risk are death from leukemia andfrom carcinomas other than of the thyroid. For doses upto 150 rad, a linear relationship of "*Q x 10"6 per personper rad has been used as the probability of death fromeach of these.1 '4 For higher doses, the response is basedupon the acute effects of radiation.s
2. Thyroid Carcinoma. Assuming that the productof morbidity and mortality is roughly constant for allages,1'4 the chance of death from internal 131I irradiationof the thyroid has been taken as 1 x 10"6 per person perrad.
3. Nonspecific Life-Shortening. After radiation ex-posure of animal populations, increased mortality is notedwhich is not associated with any single disease but seems
as though the animals had undergone accelerated physio-logical aging. Studies on animal groups (mostly mice andrats)6"12 show varied results. Some have not shown thiseffect at all, while others6 '7 show life-span reductionsranging from 0.5 to 7.8% per 100 rad. The average resultseems to be about 2 to 3% iife-span reduction per 100-raddose. A study of American radiologists13 indicated a valueof 4 to 5% per 100 rad, but the dosimetry was uncertain.Studies of British radiologists and the Japanese bombsurvivors14>ls have been inconclusive. An estimated 7%life-span reduction per 100 rad is used here as anapproximate upper limit of risk. This may also beexpressed as a mortality probability of 700 x 10"6 perperson per rad.
4. Genetic Risk. In predicting genetic risk, the term"genetic death " is used. A genetic death .nay bf; definedas the eventual extinction of a gene lineage. This mightoccur through ths reduced fertility or sterility of someonecarrying the gene or through stillbirth, abortion, or earlyembryonic or pre-reproductive death. The term is some-what misleading in that a genetic death may not representa somatic death; a genetic death (sterility, for example)may not have an associated corpse. Therefore, calculationof radiation-induced mutation frequency is meaningfulonly in comparison with natural mutation frequency,discussed below.
fa) Radiation-Induced Mutations. Most radiationmutation data come from studies with mice16"21 thatprovide a value of 10~7 mutations per gene per rad pergerm cell. Japanese human data22 support this figure,which may also be expressed as 4000 x 10"6 mutationsper rad per person. The International Commission onRadiological Protection (1CRP)23 suggests a higher valueof 7200 x 10"6 genetic deaths per rad which is used hereas an upper limit. About 2.5% of these mutations wouldbe expected in the first generation.23
(b) Natural Mutations. A reasonable estimate ofnatural mutation frequency of the causal genes is aboutfive mutations per million genes per generation.23"25
With 20,000 genes per man, this yields 0.1 mutationper germ cell in each generation, or 200,000x10"*natural mutations per person per generation. To preservegenetic equilibrium, the numbeT of genetic deaths mustequal the number of mutations; therefore, this figure alsorepresents the natural rate of genetic death per person pergeneration.
V. Results
The results of applying the method to the OWR areoutlined. Details of the calculations are given in theappendixes.
A. Fission-Product Release vs Probability. Thesource term for this risk assessment is th? reieas>prob-ability envelope shown in Fig. 2. The accidents considered

are itemized in detail in Appendix E, and details of thereliability ciaia appear in Appendix D. There are fivegeneral sources of system and component reliability data:
1. Component reliability measurements.2. Reactor operating history.3. Specific system test data.4. Largely intuitive assessment of reliability.5. Calculated reliabilities (e.g., fault tree).
We hi've used nil these although 4 and 5 overlapsomewhat. The statistical treatment used to obtain confi-dence levels and failure probabilities from OWR operatingrustory and test data is detailed in Appendix B.
Note that our source term (Fig. 2) is almostidentical to that for a 1000-MWe pressurized waterreactor with containment and atmospheric spray andcooling systems.' 2
B. Risk vs Distance. Ri^k vs distance results fordifferent Pasquill weather conditions are shown in Figs. 3through 5. These curves are the results of the calculationsdescribed by the integral portion of Eq. (5)-that is,before the probability of occurrence of the variousPasquill conditions has been included. Dose calculationsare explained in Appendix C.
Local meteorology is important in considering theOWR wluch is located in the bottom of a long, narrowcanyon. The local meteorology (see Appendix F) as givenby Eq. (5) is applied to Figs. 3 through 5 to produce Fig.6. This figure shows lines of constant somatic mortalityrisk (thyroid carcinoma, leukemia, and other carcinomas)superimposed upon a schematic plan of Los Alamos. Thewarehouse immediately northwest of OWR is the nearest
-5
UPPER 9 0 % CONFIDENCE LIMIT
I I I I I I I I I I111
10"= 10" 10"ACCIDENT PROBABILITY PER YEAR
Fig. 2.Fission-product release vs probability.
a:
RIS
K P
ER
Y
E5,
5,
MO
RTA
LITY
5,
5,10
C
D
l ,d'0
5
I\
\\1
, 1
_
1
V
1 1
— NOMINAL CASE
UPPER 90% ~CONFIDENCE LIMIT
RESIDENTIAL AREA
^.NEAREST COMMERCIALPROPERTY ~1 1
IOZ to1 to"DOWNWIND DISTANCE FROM
REACTOR { METERS )
Fig. 3.Yearly mortality risk vs distance (Pasquill conditionType C, Sm/sec cross-canyon wind).
<UJ
> -
a.
~l >-
io
<a
a
HJ
|0-4
I0"5
o"7
o~6
_9
1
-
\
1
1 1
rflNAL CASE
UPPER 9 0 %N CONFIDENCE LIMIT
BRIDGE 1 > . ^
, LOS ALAMOS| RESERVOIR
1 |
10 10 !0
DOWNWIND DISTANCE FROM REACTOR (METERS)
Fig. 4.Yearly mortality risk vs distance (Pasquill conditionType E, lm/sec up-cany on wind).

10-3
a:ina.
!O.-5
t10 ',-6
— NOMINAL CASE
UPPER 9 0 %" CONFIDENCE LIMIT
CHAIN LINK
FENCES
10* 10° 10
DOWNWIND DISTANCE FROMREACTOR ( METERS )
Fig. 5.Yearly mortality risk vs distance (Pasquill conditionType F, lm/sec down<anyon wind).
uncontrolled structure. An aerial view of the area isshown in Fig. 7. The highest individual somatic risk to thepopulation is about 5 x 10"10/yr which, relative to thevalues of Sec. IV, is negligible. The risk added by the0WR would increase the chance of accidental death foran "average" person with "avenge" accident exposure by0.0001%. The nonspecific life-shortening at the point ofhighest individual risk may be expressed as 25 sec per yearof continuous exposure.
C. The Total Risk. The total risk, based upon a30-yr reactor lifetime can be expressed as a detrimentover all generations of 1.35 x 10~2 death. This figure isconservative because it also contains genetic deaths andthe equivalent cf nonspecific life-shortening. The totalrisks (30-yr reactor operation) are:
Somatic (acute and late)Nonspecific Life-ShorteningGenetic
First GenerationSubsequent Generations
5.1 x1.2 x
3 x1.2 x
icrs
10-3
lO'4
10"2
Based on 30 years of reactor operation, the totalrisk figure in the table above could also be expressed as4.5 x 10"4 deaths per year. For comparison, a communitythis size (~ 13,000)* would have about 2600 naturalgenetic deaths per generation, assuming natural mutationrates and genetic equilibrium. Also, on the basis ofnational accident statistics, there should be about 270accidental deaths here in a 30-yr period.
VI. Conclusions
Our estimates of risk are pessimistic. The accidentprobability and fission-product release calculations weremade conservatively, and the upper risk limit was esti-mated by assuming a continuous accident spectrum, i.e.,an infinite number of discrete accidents. Further pessi-mism was introduced through use of linear consequencevs dose relationships, neglecting dose rate, biologicalrepair, and threshold mechanisms. Note that the riskbased upon the 90% upper confidence limit of therelease-probability curve (see Figs. 3 through 5) is notappreciably greater than the. nominal value. Previouswork1 '2 showed that risk is not particularly sensitive toaccident probability.
It is interesting that our accident source term(fission-product, release vs accident probability curve, Fig.2) is almost the same as that found in Refs. 1 and 2 for a1000-MWe (3200-MWth) pressurized water reactor (PWR)and that the integrated source terms are almost identical.A couple of inferences could be made from this. One isthat the source terms for most thermal reactors aspresently designed and sited might I e quite similar. Asecond is that this similarity may give a very crudemeasure of the effectiveness of some of the PWRsafeguards. Namely, the PWR containment andatmospheric cooling and spray systems may account foran effective power reduction from 3200 to 8 MWth, afactor of 400. This statement must be viewed withextreme caution because there are many other basicdifferences in design between a PWR and a tank-typeresearch reactor For a given design, this approach mightenable evaluation of specific safeguard systems in terms ofequivalent power reduction. Another conclusion is thatmethods like this seem to be consistent in their assess-ment of reactor risk and provide the sort of numericalresult that one would expect.
Finally, from this study, it appears that the indef-inite operation of the Omega West Reactor at a power of8 MWth presents no undue risk to the community of LosAlamos.
Total ~ 1.4 xlO"2•This figure represents the population of Los Alamos County, ex-clussive of the suburb of White Rock, who would be at risk.

NORTHCOMMUNITY /
TRAILER „COURT JO7YR
-V*
v I 57C I ; POPULATION a AREA
INDIVIDUALMORTALITY RISKCONTOURS
Fig. 6.Individual mortality risk contours superimposed on plan of Los Alamos, New Mexico.
Notes on the Method. Two objections to analysessuch as this are the difficulty in identification of allaccidents and accident processes, and the problem offinding good reliability data for reactor systems andcomponents.
First, we feel that a risk estimate based upon acontinuous accident spectrum overestimates the risk thatwould be added by accidents that were overlooked or byinterconnected faults. The sample of accidents used toestablish thif continuum included all those that could beidentified and, while it is not a random sample, neither isit a biased sample.
Second, although accurate reliability data arescarce, it is not difficult to obtain conservative upperlimits on failure rates from operating history and testdata. The results show that risk levels based on these dataare not even marginally high und, indeed, risk levels arenot particularly sensitive to accident probabilities. Thisimplies that conservative reliability estimates may besufficient for risk analyses, so that precise reliability dataare not necessary.
Acknowledgments
We are grateful to N. E. Bradbury and Jane H. Hallfor suggesting and supporting this work and to R. LeeAamodt for many valuable discussions. Prof. Robert C.Erdmann of the University of California at Los Angeleswas a helpful consultant.
References
1. Harry i. Otway, "The Application of Risk Allocation toReactor Siting and Design," Los Alamos Scientific Laboratoryreport LA^»316 (May 1970).
2. Harry J. Otway and Robert C. Erdmann, "Reactor Siting andDesign from a Risk Viewpoint," Nucl. Eng. Design 12 (1970),in press.
3. Accident Facts, 1968 Ed., National Safety Council, Chicago,Illinois, 1966.

Fig. 7.Aerial view (looking east) of Pajarito Plateau, showing OWR Site under arrow, Los Alamos townsite atleft and center, and laboratory areas at right.
4. Harry J. Otway and Robert C. Erdmann, "Leukemia andThyroid Carcinoma: A Comparison of the Late MortalityRisks from Reactor Accidents," Submitted to Nuclear Safetyin June 1969. Scheduled for Volume 11, September-October1970.
5. Samuel Glasstone, The Effects of Nuclear Weapons, Rev. Ed.,U. S. Atomic Energy Commission, Washington, 1962.
6. G. Failla and P. McClement, "The Shortening of Life byChronic Whole-Body Irradiation," Am. J. Roentgenol.Radium Therapy Nucl. Med. 78,946 (1957).
7. W. L. Russell, "Shortening of Life in the Offspring of MaleMice Exposed to Neutron Radiation for an Atomic Bomb,'"Proc. Nat. Acad. Sci. U. S. 43, 324 (1957).
8. R. F. Kallman and H. 1. Kohn, "Life-Shortening by Whole-and Partial-Body 7-Irradiation in Mice," Science 128, 301(1958).
9. P. Alexander and O. Connell, "Shortening of the Life Span ofMice by Irradiation with X-Rays and Treatment with Radio-mimetic Chemicals," Radiation Res. 12, 38 (1960).
10. J. B. Storer, B. S. Roberts, I. V. Boone, and P. S. Harris,"Relative Effectiveness of Neutrons for Production of De-layed Biological Effects. II. Effect of Single Doses ofNeutrons from an Atomic Weapon on Life Span of Mice,"Radiation Res. 8,71 (1958).
11. E. Lorenz, L. O. Jacobson, W. E. Heston, M. Shimkin, A. B.Eschenbrenner, M. K. Deringer, J. Doniger, and R.Schweisthal, Chapter 3 in "Effects of Long-Continued Total-Body Gamma Irradiation on Mice, Guinea Pigs, and Rabbits.II. Effects on Life Span, Weight, Blood ficture, and Carcin-ogenesis and the Role of the Intensity of Radiation,"Biological Effects of External Xand Gamma Radiation, R. E.Zirkle, Ed., Part 1, McGraw-Hill, New York, 1954, p. 24.
12. M. A. Bb'i, "Data Pertaining to Shortening of Life Span byIonizing Radiation," University of Rochester report UR-442(May 1956).
13. R. Seltzer and P. E. Sartwell, "The Influence of OccupationalExposure to Radiation on the Mortality of American Radio-legists and Other Medical Specialists," Am J. Epidemiology81,2(1965).

14. W. M. Court-Brown and R. Doll, "Expectation of Life andMortality from Cancer among British Radiologists," Brit.Med. J. 2,181 (19S8).
15. S. Jablon, M. Ishida, and M. Yamasaki, "Studies of theMortality of A-Bomb Survivors. 3. Description of the Sampleand Mortality, 1950-1960," Radiation Rs. 25,25 (1965).
16. W. L. Russell, "The Effect of Radiation Dose Rate andFractionation on Mutation in Mice," in Repair from GeneticRadiation Damage and Differential Radioscnsitivity in GermCells, F. H. Sobels, Ed., Macmillan, New Yonc, 1963, p. 205.
17. M. F. Lyon and T. M. Morris, "Mutation Rates at a New Setof Specific Loci in the Mouse," Genetics Res. 7, 12 (1966).
18. M. F. Lyon, R. } . S. Phillips, and A. G. Searle, "The OverallRates of Dominant and Recessive Lethal and Visible MutationInduced by Spermatogoma] X-irradiation of Mice," GeneticsRes. 5,448 (1964).
19. K. G. Luning, "Studies of Irradiated Mouse Populations. HI.Accumulation of Recessive Lethals," Mutation Res. 1, 86(1964).
20. R. J. S. Phillips, "A Comparison of Mutation Induced byAcute X- and Chronic Gamma Irradiation in Mice." Brit. J.Radiol. 34,261 (1961).
21. T. Sugahara, "Genetic Effects of Chronic Irradiation Given toMice through Three Successive Generations," Genetics 50,1143(1964).
22. J. V. J.'eel, and W. J. Schull, The Effect of Exposure to theAtomic Bombs on Pregnancy Termination in Hiroshima andNagasaki, Publication 461, Natl. Acad. Sci., Natl. Res.Council, Washington, 1956.
23. The Evaluation of Risks from Radiation, Internationa] Com-mission on Radiological Protection Publication 8, PergamonPress, New''rk, 1966.
24. Report of . ; United Nations Scientific Committee on theEffects of Atomic Radiation, General Assembly OfficialRecords: Twenty-First Session, Suppl. 14 (A/6314), UnitedNations, New York, 1966.
25. J. F. Crow, "The Estimation of Spontaneous and Radiation-Induced Mutation Rates in Man," Eugenics Quart. 3, 201(1956).
APPENDIX A
THE OMEGA WEST REACTOR*
1. Introduction
The Omega West Reactor (OWR) is a thermal, heter-ogeneous, tank-type research reactor operated by the LosAlamos Scientific Laboratory (LASL). It provides sampleirradiations, a source for external neutron and gamma-raybeam experiments, and facilities for irradiation of instru-mented capsules.
The OWR was originally operated at a power levelof 5.0 MW. In 1967, after 9 yr of operation, the powerlevel was increased to 8.0 MW. The OWR normally oper-ates on a 24-h/day, 5-day/week schedule.
2. Reactor Description
The OWR uses an assembly of material testing re-actor (MTR)-type fuel elements supported inside a stain-less steel tank. The core support structure and grid plate
•This appendix is based on LA-4192, "1969 Status Report on theOmega West Reactor, with Revised Safety Analysis" (July 15,1969).
are aluminum. Light water circulated downward throughthe core at 3500 gal/min serves as moderator and coolant.The reactor is controlled by eight blade-type poison rods.The reactor tank is covered with a stainless steel lid thatsupports the control-rod drive mechanisms and aiso con-tains two large hatches for access to the core. An irregu-larly octagonal biological shield of heavy concrete sur-rounds the tank and thermal column. Experimental portsopen on al! shield faces; a large thermal-column dooropens on the east side. Instrumentation ports are in arecess at the bottom of the south face and extend under-neath the core.
Figure A-l is a cutaway view of the reactor.
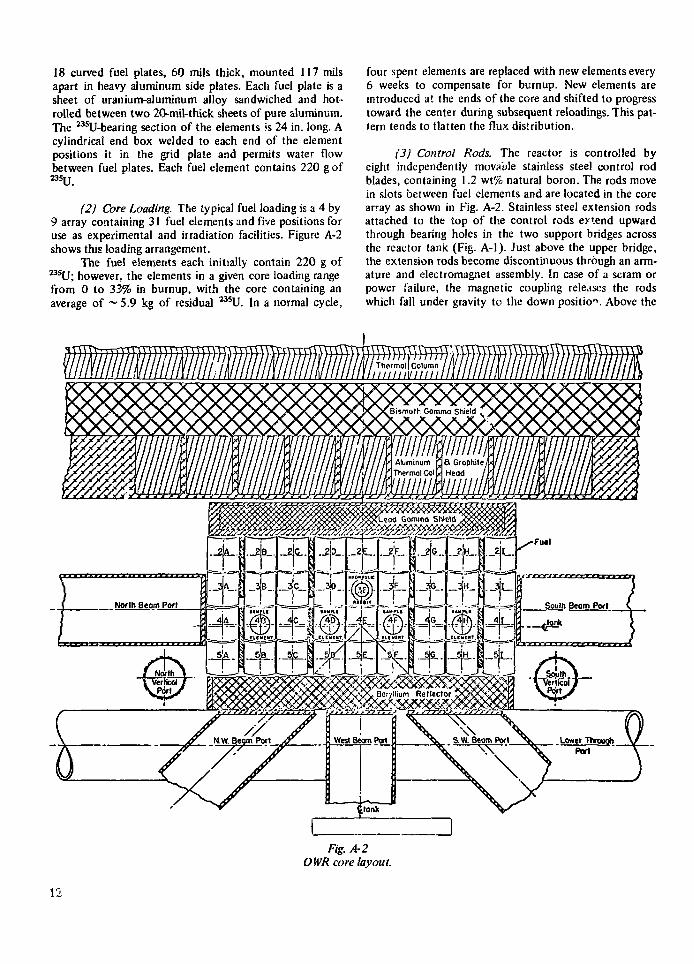
(a) Reactor Core. The reactor core is a 4 by 9 arrayof fuel elements and experiment or sample elements sup-ported vertically in the aluminum grid plate. Eight bor-ated stainless steel control blades move in slots betweenfuel elements. A beryllium reflector is on the west face ofthe core, and a lead gamma shield on the east face; thenorth and south faces are water reflected.
(1) Fuel Elements. The metal fuel elements are ofthe type developed originally for the MTR. Each contains
10

Fig. A-lCutaway view ofOWR.
11
18 curved fuel plates, 60 mils thick, mounted 117 milsapart in heavy aluminum side plates. Each fuel plate is asheet of uranium-aluminum alloy sandwiched and hot-rolled between two 20-mil-thick sheets of pure aluminum.The H5U-bearing section of the elements >s 24 in. long. Acylindrical end box welded to each end of the elementpositions it in the grid plate and permits water flowbetween fuel plates. Each fuel element contains 220 g of23SU.
(2) Core Loading. The typical fuel loading is a 4 by9 array containing 31 fuel elements and five positions foruse as experimental and irradiation facilities. Figure A-2shows this loading arrangement.
The fuel elements each initially contain 220 g of^ U ; however, the elements in a given core loading rangefrom 0 to 33% in burnup, with the core containing anaverage of ~ 5.9 kg of residual 135U. In a normal cycle,
four spent elements are replaced with new elements every6 weeks to compensate for burnup. New elements areintroduced at the ends of the core and shifted to progresstoward the center during subsequent reloadings. This pat-tern tends to flatten the flux distribution.
(3) Control Rods. The reactor is controlled byeight independently movable stainless steel control rodblades, containing 1.2 wt% natural boron. The rods movein slots between fuel elements and are located in the corearray as shown in Fig. A-2. Stainless steel extension rodsattached to the top of the control rods extend upwardthrough bearing holes in the two support bridges acrossthe reactor tank (Fig. A-l). Just above the upper bridge,the extension rods become discontinuous through an arm-ature and electromagnet assembly. In case of a scram orpower failure, the magnetic coupling releases the rodswhich fall under gravity to the down position Above the
Thermal| ColumnIIIIIIIV1IIII
Fig. A-2OWR core layout.
12

magnet assembly, the rods pass through chevron seals inthe reactor tank lid. Just above the lid, they are coupledthrough a rack and pinion to the drive mechanism, con-sisting of a reduction gear box and drive motor. Motorcontrols are interlocked so that oniy one rod can be raisedat a time. The control rods are routinely replaced after90,000 MW h of operation, although this exposure doesnot adversely affect their mechanical properties.
(b) Reactor Tank. The OWR reactor tank is a stain-less steel cylinder, 8 ft in diameter and about 24 ft highwith l/4-in.-thick walls and 3/8-in.-thick bottom plate.The lid is bolted to the top flange of the tank and sealedwith an O-ring. The lid contains two 28.5-in.diam hatchesfor access to the interior. Heavy glass viewing windows inthe hatches allow observation of the core and tank inte-rior during reactor operation. The tank contains the fol-lowing penetrations.
(1) Coolant Inlet and Outlet Coolant Lines. The12-in.-diam coolant inlet line enters the reactor founda-tion — 6 ft below the tank bottom and extends upwardthrough the concrete shield to the tank inlet 49 in. abovecore centerline. Water flow through the core is downwardthrough the fuel elements into the base structure and outthe 12-in.-diam exit pipe through the tank bottom. Fromthere, the exit line passes up along the reactor tank, insidethe concrete shield, to 49 in. above core centerline beforemaking a U bend and going back below floor level intothe large delay line. At the top of the U bend in the exitpipe, a short 12-in.-diam pipe reenters the reactor tankthrough a "flapper" valve. A more complete discussion ofthis system is given in Sec. 4(aX2) below.
(2) Five Beam Ports. Five 6-in.-diam horizontalbeam ports enter the reactor tank at the core centerline.
(3) Two Horizontal Through Ports. The 6-in.-diamthrough ports pass alongside the core within a few inchesof the west face and extend through the shielding at eachend.
(4) Inclined Port. The inclined port is a 4-in.-diamtube that angles 30° from the horizontal down to justabove the core centerline.
(5) Instrument Ports. Five 4-in.-diam instrumentports extend through the tank wall to positions under thecore. These ports house ion chambers.
(6) Tank Drain Line. The l-in.-diam stainless steeldrain line enters 15H in. above the tank bottom, bends90°, and extends to 1 in. above the bottom where itterminates in a gate valve.
(7) Thermal Column. The 6-ft-diam stainless steelthermal-column liner is welded into the reactor tank atfloor level and extends into the tank to a position ad-jacent to the core. An aluminum head is bolted to the
liner flange; a stainless stee! O-ring between the head andflange serves as a watertight seal.
(c) Reactor Shielding. Biological shielding abovethe reactor is provided by the 17 ft of water above thefuel. A heavy-concrete shield surrounds the tank andthermal column. This shield is 5 ft thick to a height of 11ft above the reactor room floor and is at least 3 ft thickabove that.
3. Reactor Control and Instrumentation
(a) Reactivity. Maximum allowable excess reac-tivity for the OWR is 13%. Present operational require-ments call for an available excess reactivity of 8%, utilizedas follows.
Equilibrium xenonXenon overrideFuel burnupSamarium and stable fission
productsTemperature coefficientExperiments
3.50.72.8
0.30.20.5
TOTAL 8.0%
The eight boron-stainless control blades serve asboth safety and shim rods, with the four center rods beingused as regulating rods at a slower speed for automaticcontrol.
The control-rod drive speeds give reactivity inser-tion rates compatible with both safety and operationalrequirements. The available reactivity insertion rates are:
Averagemanualautomatic
Maximummanualautomatic
4 .5x1 Or4 Ak/k~ sec,1.6 x 1CTS
1.2xlO~3Ak/kTsec,2.7 x 10rs
The automatic rates are for the four center todsmoved as a gang; the manual rates are for movement ofone rod at a time.
The instrumentation and safety systems are simpleand reliable. For reactor startup, check lists are usedinstead of chains of permissive interlocks, thereby elimin-ating much complication without significantly affectingsafety. Only one type of atuomatic safety action, the fullscram, is provided; no automatic setbacks, rundowns, orreverses are used. All scram channels are independent, andonly one signal is required to initiate a scram.
(]) Safety System. Current to the rod-lifting mag-nets is supplied by a fail-safe electronic current source.The magnet-current control chassis is an electronic trip
13
and cuts off the dc supply to the magnets upon loss of the150-V scram-bus voltage. A superimposed ac componenthelps reduce the rod breakaway time. Scrams are triggeredby breaking the scram-bus line with relays. The safetycircuit response time averages 63 msec from the input of ascram impluse to the instant the rods break away fromthe magnets.
Any of the following conditions will initiate a re-actor scram.
High power level, channel 1High power level, channel 2High power level, channel 3Short periodLoss of coolant flowLoss of pump powerHigh coolant exit temperatureFail-safe voltage scrams (2)Experiment scrams (as needed)Manual scram
(2) Neutron Instrumentation. Six neutron monitor-ing channels provide the necessary level and period cover-age from startup to operating power. These channels areas follows.
Log Count-Rate Channel. This channel provides low-level coverage during core loading and reactor startup.Range coverage for the count-rate channel is fromabout 0.1 W to 8kW.
Log NPeriod Channel. This is a conventional log leveland period channel providing coverage from the 8-W to24-MW level. Overlap between this channel and the logcount-rate channel is at least three decades.
Power-Level Safety Channels. These three linear levelchannels provide power-level indication in the powerrange and input to three power-level scram circuits.
Integrator Channel. This channel provides an audiblesignal, proportional to reactor power, for routine oper-ation at the design power level.
Differential Level Channel. This channel provides asuppressed magnified level signal, and its principal useis to detect small reactivity changes.
Automatic Power-Level Control The automatic con-trol system uses the output of one of the linear chan-nels and holds the reactor power constant. The systemis a discontinuous, or on-off, type of servo control andis used only at constant power levels. A "servo-fault"circuit removes the system from servo control andprevents rod withdrawal if the error signal calls for toolarge an increase in power level.
(3j Annunciator System. A host of annunciators
provides visual and audible alarms of off-standard operat-ing conditions and those that may be approaching poten-tially dangerous limits.
(4) Electrical Power System. The OWR site is ser-viced by an overhead 13.2-kV electric power line. Powerfrom this line is divided into a 750-kVA regular serviceand a 100-kVA special service for reactor and experimentinstrumentation. In case of a power failure, an emergencygasoline-powered generator is available to power essentialequipment, such as radiation monitors and public addresssystem. It does not power the OWR main circulatingpump. The generator is a three-phase, 110/208-V, 25-kW,31-kVA set that must be manually started and trans-ferred.
4. Reactor Cooling System
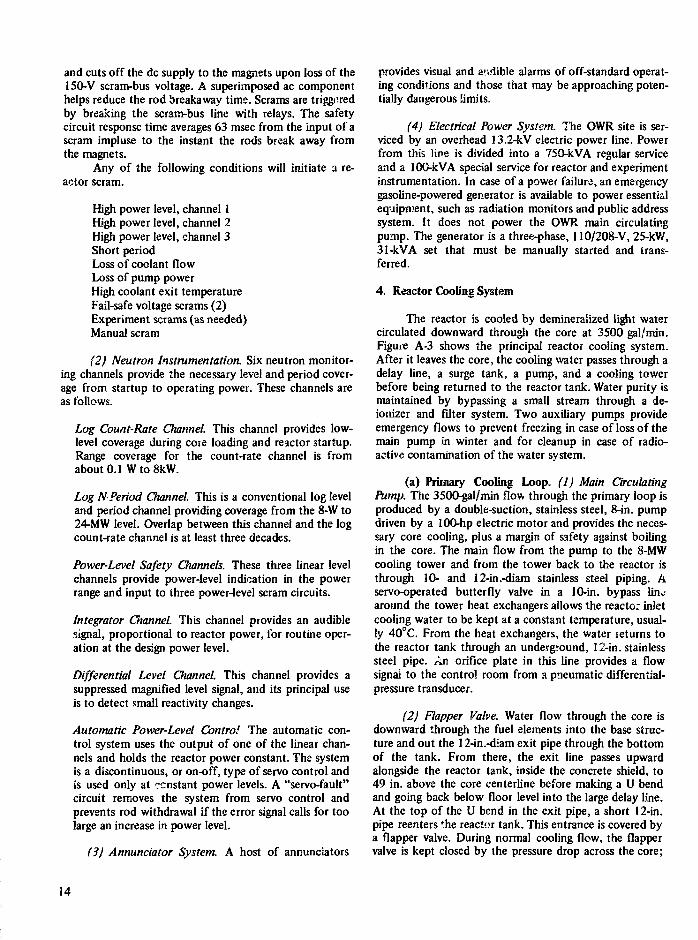
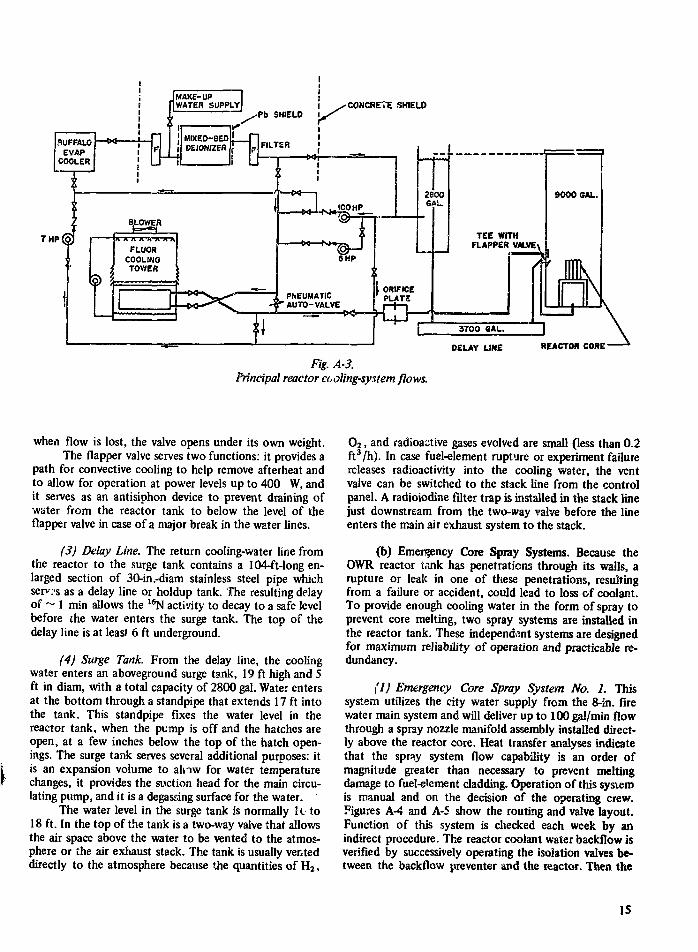
The reactor is cooled by demineraiized light watercirculated downward through the core at 3500 gal/min.Figure A-3 shows the principal reactor cooling system.After it leaves the core, the cooling water passes through adelay line, a surge tank, a pump, and a cooling towerbefore being returned to the reactor tank. Water purity ismaintained by bypassing a small stream through a de-ionizer and filter system. Two auxiliary pumps provideemergency flows to prevent freezing in case of loss of themain pump in winter and for cleanup in case of radio-active contamination of the v/ater system.
(a) Primary Cooling Loop. (I) Main CirculatingPump. The 3500-gal/min flow through the primary loop isproduced by a double-suction, stainless steel, 8-in. pumpdriven by a 100-hp electric motor and provides the neces-sary core cooling, plus a margin of safety against boilingin the core. The main flow from the pump to the 8-MWcooling tower and from the tower back to the reactor isthrough 10- and 12-in.-diam stainless steel piping. Aservo-operated butterfly valve in a 10-in. bypass linearound the tower heat exchangers allows the reactor inletcooling water to be kept at a constant temperature, usual-ly 40°C. From the heat exchangers, the water returns tothe reactor tank through an underground, 12-in. stainlesssteel pipe. An orifice plate in this line provides a flowsignal to the control room from a pneumatic differential-pressure transducer.
(2) Flapper Valve. Water flow through the core isdownward through the fuel elements into the base struc-ture and out the 12-in.-diam exit pipe through the bottomof the tank. From there, the exit line passes upwardalongside the reactor tank, inside the concrete shield, to49 in. above the core centerline before making a U bendand going back below floor level into the large delay line.At the top of the U bend in the exit pipe, a short 12-in.pipe reenters •he reactor tank- This entrance is covered bya flapper valve. During normal cooling flow, the flappervalve is kept closed by the pressure drop across the core;
14
DELAY LINE REACTOR CORE-
Fig. A-3.Principal reactor cooling-system flows.
when flow is lost, the valve opens under its own weight.The flapper valve serves two functions: it provides a
path for convective cooling to help remove afterheat andto allow for operation at power levels up to 400 W, andit serves as an antisiphon device to prevent draining ofwater from the reactor tank to below the level of theflapper valve in case of a major break in the water lines.
(3) Delay Line. The return cooling-water line fromthe reactor to the surge tank contains a 104-ft-long en-larged section of 30-in.-diam stainless steel pipe whichsenvs as a delay line or holdup tank. The resulting delayof ~ 1 min allows the 16N activity to decay to a safe levelbefore the water enters the surge tank. The top of thedelay line is at least 6 ft underground.
(4) Surge Tank. From the delay line, the coolingwater enters an aboveground surge tank, 19 ft high and 5ft in diam, with a total capacity of 2800 gal. Water entersat the bottom through a standpipe that extends 17 ft intothe tank. This standpipe fixes the water level in thereactor tank, when the pump is off and the hatches areopen, at a few inches below the top of the hatch open-ings. The surge tank serves several additional purposes: itis an expansion volume to alnw for water temperaturechanges, it provides the suction head for the main circu-lating pump, and it is a degassing surface for the water.
The water level in the surge tank is normally k to18 ft. In the top of the tank is a two-way valve that allowsthe air space above the water to be vented to the atmos-phere or the air exhaust stack. The tank is usually venteddirectly to the atmosphere because the quantities of H2 ,
O2 , and radioactive gases evolved are small (less than 0.2ft3/h). In case fuel-element rupture or experiment failurereleases radioactivity into the cooling water, the ventvalve can be switched to the stack line from the controlpanel. A radioiodine filter trap is, installed in the stack linejust downstream from the two-way valve before the lineenters the main air exhaust system to the stack.
(b) Emei^ency Core Spray Systems. Because theOWR reactor tank has penetrations through its walls, arupture or leak in one of these penetrations, resultingfrom a failure or accident, could lead to loss of coolant.To provide enough cooling water in the form of spray toprevent core melting, two spray systems are installed inthe reactor tank. These independent systems are designedfor maximum reliability of operation and practicable re-dundancy.
(1) Emergency Core Spray System No. 1. Thissystem utilizes the city water supply from the 8-in. firewater main system and will deliver up to 100 gal/min flowthrough a spray nozzle manifold assembly installed direct-ly above the reactor core. Heat transfer analyses indicatethat the spray system flow capability is an order ofmagnitude greater than necessary to prevent meltingdamage to fuel-element cladding. Operation of this systemis manual and on the decision of the operating crew.Figures A-4 and A-5 show the routing and valve layout.Function of this system is checked each week by anindirect procedure. The reactor coolant water backflow isverified by successively operating the isolation valves be-tween the backflow preventer and the reactor. Then the
IS

li 'PIPE TOREACTM TOt»
Fig. A-4.Emergency core-spray system No. 1, showinglocation of spray nozzles directly above core.
• INCHWATER
TIE-INVALVE
ALARMPRESSURESWITCH
POSITIONALARM
PRESSURE
.GAUGES ,ISOLATION
VALVES
CONTROL ROW
Fig. A-5.Valve arrangement for core-spray system No. 1.
fire-main water flow up to the reactor isolation valveassembly is checked, thus verifying the total unobstructedflow path. The spray system shutoff valve arrangement isshown in Fig. A-5.
(2) Emergency Core Spray System No. 2. Thissystem has a secure source of pure reactor-system water,is not dependent on the reactor tank lid structure forsupport, is fully automatic, and is checked in a directfunctional test each week. The system utilizes a 3-hp,electrically driven centrifugal pump to deliver coolingspray to the core at about 18 gal/min. The pump drawswater from the 1-in. drain line at the bottom of the 30-in.delay line and delivers it through two, 15-degree, solidcone, 1/2-in. spray nozzles mounted in a recess in thetank wall below the lid. A flow meter in the discharge linemeasures the flow rate. Because *he capacity of the 30-in.delay line is about 3700 gal, there is ample water tomaintain the spray at 18 gal/min for about V-h h. Theangle and direction of the two nozzles were set for opti-mal spray coverage on the core during full-scale mock-uptests. Fig. A-6 shows the location of the spray nozzles inthe reactor tank. This spray system is automaticallyactuated by liquid-level sensors that measure the waterlevel in the reactor tank and provide audible and visualannunciator alarms at the reactor console.
SO INCH OUTLET BELAY LINE3700 «ALL0K CAPACITY
Fig. A-6.Emergency core-spray aystem No. 2, showinglocations of delay-line reservoir and spray nozzles inrecess below tank lid.
16
5. Site and Facilities
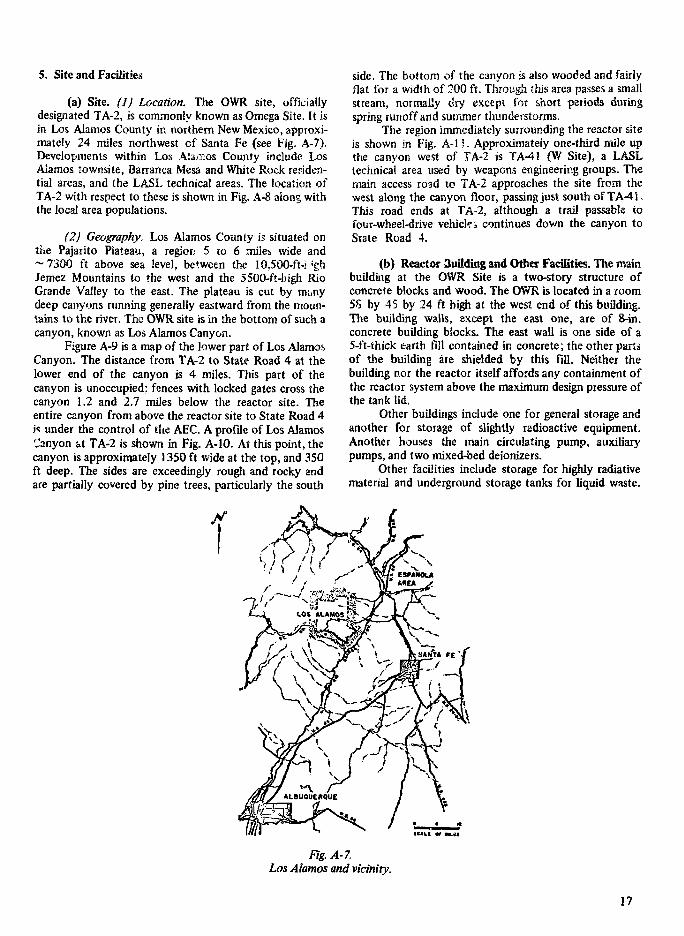
(a) Site. (1) Location. The OWR site, officiallydesignated TA-2, is commonly known as Omega Site. It isin Los Alamos County in northern New Mexico, approxi-mately 24 miles northwest of Santa Fe (see Fig. A-7).Developments within Los Alamos County include LosAlamos townsite, Barranca Mesa and White Rock residen-tial areas, and the LASL technical areas. The location ofTA-2 with respect to these is shown in Fig. A-8 along withthe local area populations.
(2) Geography. Los Alamos County is situated onthe Pajarito Plateau, a region 5 to 6 miles wide and~ 7300 ft above sea level, between the 10,500-ft-t ;ghJemez Mountains to the west and the 5500-ft-high RioGrande Valley to the east. The plateau is cut by manydeep canyons running generally eastward from the moun-tains to the river. The OWR site is in Ihe bottom of such acanyon, known as Los Alamos Canyon.
Figure A-9 is a map of the lower part of Los AlamosCanyon. The distance from TA-2 to State Road 4 at thelower end of the canyon is 4 miles. This part of thecanyon is unoccupied: fences with locked gates cross thecanyon 1.2 and 2.7 miles below the reactor site. Theentire canyon from above the reactor site to State Road 4is under the control of tite AEC. A profile of Los AlamosCanyon at TA-2 is shown in Fig. A-10. At this point, thecanyon is approximately 1350 ft wide at the top, and 350ft deep. The sides are exceedingly rough and rocky andare partially covered by pine trees, particularly the south
side. The bottom of the canyon is also wooded and fairlyflat for a width of 200 ft. Through this area passes a smallstream, normally dry except for short periods duringspring runoff and summer thunderstorms.
The region immediately surrounding the reactor siteis shown in Fig. A-l! . Approximately one-third mile upthe canyon west of TA-2 is TA-41 (W Site), a LASLtechnical area used by weapons engineering groups. Themain access ro3d to TA-2 approaches the site from thewest along the canyon floor, passing just south of TA-41.This road ends at TA-2, although a trail passable tofour-wheel-drive vehicle i continues down the canyon toState Road 4.
(b) Reactor 3uilding and Other Facilities. The mainbuilding at the OWR Site is a two-story structure ofconcrete blocks and wood. The OWR is located in a room58 by 45 by 24 ft high at the west end of this building.The building walls, except the east one, are of 8-in.concrete building biocks. The east wall is one side of a5-ft-thick earth fill contained in concrete; the other partsof the building are shielded by this fill. Neither thebuilding nor the reactor itself affords any containment ofthe reactor system above the maximum design pressure ofthe tank lid.
Other buildings include one for general storage andanother for storage of slightly radioactive equipment.Another houses the main circulating pump, auxiliarypumps, and two mixed-bed deionizers.
Other facilities include storage for highly radiativematerial and underground storage tanks for liquid waste.
fig. A-7.Los Alamos and vicinity.
17

tOOO 0 2000 4000 «O0O f O M IOO0O
I I ISCALt IN FCCT
[jgT DENOTES POPULATION
Fjf. A-8.Los Alamos townsite and laboratory technical areas. Boxes show local area populations.
IS

SCALE (MLCS)
Fig. A-9.Lower end of Los Alamos Canyon.
ELEVATIONABOVE
SEALEVtL
GA WEST K A C T M
AL OtSTAHCC PROM IKACTOK
Fig. A-10.Profile of Los Alamos Canyon at OWR Site. Slopesare shown straight, but actually consist of severalvertical steps and shelves.
19

Fig.A-11.Relative locations of OWR Site and W Site. Land tracts above the canyon rim to the north aredescribed in the text.
20
APPENDIX B
PROBABILITY AND STATISTICS
I
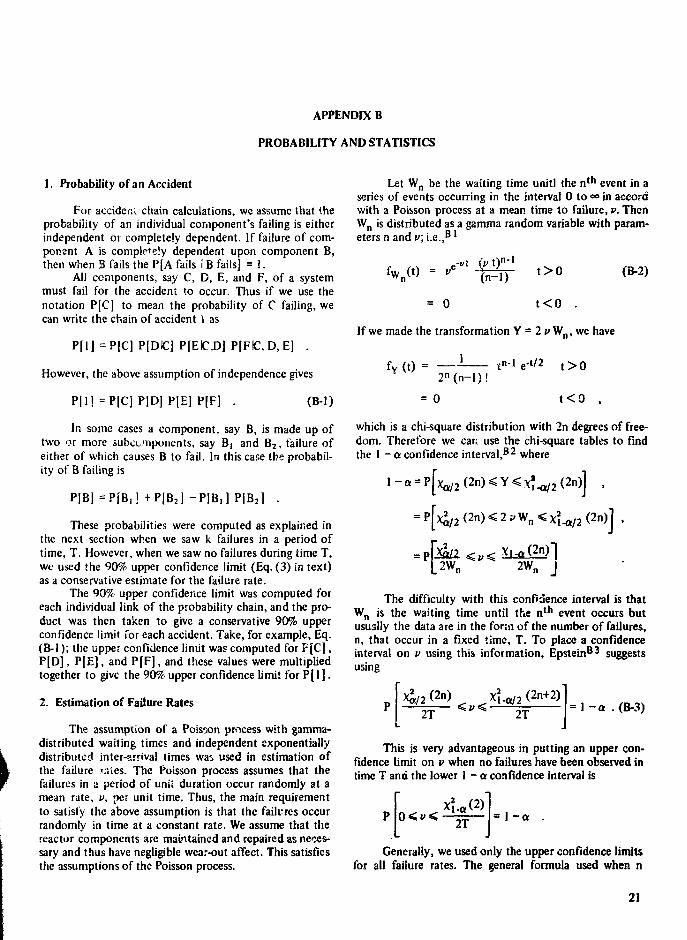
I. Probability of an Accident
For accident chain calculations, we assume that theprobability of an individual component's failing is eitherindependent or completely dependent. If failure of com-ponent A is completely dependent upon component B,then when B fails the P[A fails IB fails] = 1.
All components, say C, D, E, and F, of a systemmust fail for the accident to occur. Thus if we use thenotation P[C] to mean the probability of C failing, wecan write the chain of accident 1 as
P[l] = P[C] P[DC] P[EC,D] P[FIC, D, E] .
However, the above assumption of independence gives
P [ 1 ] = P [ C ] P [ D ] P [ E ] P [ F ) . (B-l)
In some cases a component, say B, is made up oftwo or more subcomponents, say Bj and B2 , failure ofeither of which causes B to fail. In this case the probabil-ity of B failing is
P [ B ] = P [ B 1 1 + P [ B 2 ] - P [ B 1 ] P [ B 2 ] .
These probabilities were computed as explained inthe next section when we saw k failures in a period oftime, T. However, when we saw no failures during time T,we used the 90% upper confidence limit (Eq. (3) in text)as a conservative estimate for the failure rate.
The 90% upper confidence limit was computed foreach individual link of the probability chain, and the pro-duct was then taken to give a conservative 90% upperconfidence limit for each accident. Take, for example, Eq.(B-l); the upper confidence limit was computed for F[C],P |D] , P[E], and P[F], and these values were multipliedtogether to give the 90% upper confidence limit for P ( l ] .
2. Estimation of Failure Rates
The assumption of a Poisson process with gamma-distributed waiting times and independent exponentiallydistributed inter-arrival times was used in estimation ofthe failure j.-.ies. The Poisson process assumes that thefailures in a period of unit duration occur randomly at amean rate, v, per unit time. Thus, the main requirementto satisfy the above assumption is that the failures occurrandomly in time at a constant rate. We assume that thereactor components are maintained and repaired as neces-sary and thus have negligible wear-out affect. This satisfiesthe assumptions of the Poisson process.
Let Wn be the waiting time unitl the n t h event in aseries of events occurring in the interval 0 to «> in accordwith a Poisson process at a mean time to failure, v. ThenWn is distributed as a gamma random variable with param-eters n and v\ i .e.,8 '
(B-2)
= 0 t<0 .
If we made the transformation Y = 2 v Wn, we have
fY (t) =2n(n-l)!
t""1 e'1'2 t > 0
= 0 t < 0
which is a chi-square distribution with 2n degrees of free-dom. Therefore we can use the chi-square tables to findthe 1 -aconfidence interval,62 where
(2n) < 2 9 Wn (2n)J
The difficulty with this confidence interval is thatWn is the waiting time until the n t h event occurs butusually the data are in the form of the number of failures,n, that occur in a fixed time, T. To place a confidenceinterval on v using this information, Epstein03 suggestsusing
_
This is very advantageous in putting an upper con-fidence limit on v when no failures have been observed intime T and the lower I - a confidence interval is
0<v< 2T
Generally, we used only the upper confidence limitsfor all failure rates. The general formula used when n
21

failures are observed in time T is
M-cr (2n+2)
2TI- a (B-4)
Alsc, the a level was generally chosen equal to 0.10.We have shown that a confidence interval can be
placed upon c, the mean time to failure, when the esti-mate v = n/T. However, we want a failure rate value thatis the probability of a failure for a fixed period of time.From Eq. (B-l), we see that the distribution of the wait-ing time to the first failure is
= 0
x > 0
x < 0
which is the exponential distribution. Thus the probabil-ity of a failure in a given period of time, or the failurerate,is
Q(t)=
Fort>100,Q(t)ai> .
(B-5)
One can also find a failure rate for the upper confidencelimit by using Eq. (B-5) where
2T
References
Bl. Emanuel Paraen, Stochastic Processes, Holden-Day, Inc., SanFrancisco, 1962, p. 134.
B2. Igor Bazovsky, Reliability Theory and Practice, Prentice Hall,Englcwood Cliffs, New Jersey, 1961, p. 235.
B3. B. Epstein, "Estimation from Life Test Data," IRE Trans.Reliability Quality Control RQC-9, (1960).
APPENDIX C
DISPERSION AND DOSE CALCULATIONS
1. Introduction
The calcu! ted doses and risk estimates presentedhere are based on the operating conditions, meteorology,and accident analysis peculiar to the Omega West Reactor(OWR). The calculational procedure was, briefly, as fol-lows. Atmospheric dispersion and ground depositionfactors for a given meteorological condition were com-puted for several downwind distances. These factors wereused to compute thyroid and whole-body doses for a"unit" source release to the atmosphere. The computeddose at a selected down-wind distance, together with thedata on atmospheric release vs accident probability peryear (Fig. 2 in text), were then combined to yield an
integrated dose which, in turn, was converted to an indi-vidual mortality risk figure. These were repeated for otherdownwind distances, and the individual mortality risks vsdistance were plotted. The entire cycle was then repeatedfor other meteorological conditions of interest. Becauseall exposure points were always assumed to be downwindfrom the source point, the risk estimates were modified torepresent the available wind and weather distribution dataat the reactor site. Finally, the "weather-corrected" riskestimates were used to infer lines of constant individualmortality risk on . map of the surrounding townsite (Fig.6 in text).
22
2. Fission-Product Inventory 3. Assumptions Made in the Calculations
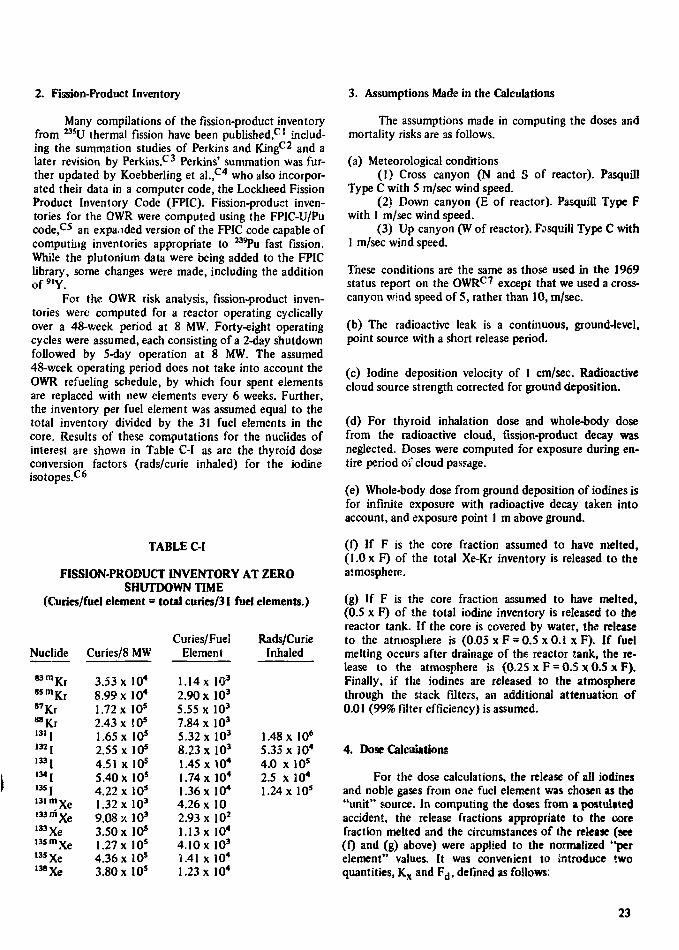
Many compilations of the fission-product inventoryfrom M SU thermal fission have been published,**' includ-ing the summation studies of Perkins and King c 2 and alater revision by Perkins.c3 Perkins' summation was fur-ther updated by Koebberling et al . ,C 4 who also incorpor-ated their data in a computer code, the Lockheed FissionProduct Inventory Code (FPIC). Fission-product inven-tories for the OWR were computed using the FPIC-U/Pucode,C 5 an expanded version of the FPIC code capable ofcomputing inventories appropriate to M9Pu fast fission.White the plutonium data were being added to the FPIClibrary, some changes were made, including the additionof 9 1 Y.
For the OWR risk analysis, fission-product inven-tories were computed for a reactor operating cyclicallyover a 48-week period at 8 MW. Forty-eight operatingcycles were assumed, each consisting of a 2-day shutdownfollowed by 5-day operation at 8 MW. The assumed48-week operating period does not take into account theOWR refueling schedule, by which four spent elementsare replaced with new elements every 6 weeks. Further,the inventory per fuel element was assumed equal to thetotal inventory divided by the 31 fuel elements in thecore. Results of these computations for the nuclides ofinterest are shown in Table C-I as arc the thyroid doseconversion factors (rads/curie inhaled) for the iodineisotopes.C 6
TABLE C-I
FISSION-PRODUCT INVENTORY AT ZEROSHUTDOWN TIME
(Curies/fuel element = total curies/31 fuel elements.)
Nuclide Curies/8 MW
8 3 m K r8 S m Kr87 Kr88 Krm ,132,
133,
,M ,
. 3 5 ,
13lmXe133riiXe133 Xe135 m X e135 Xe138 Xe
3.53 x l O 4
8.99x10*1.72 x 10s
2.43 x ! 0s
1.65 x 10s
2.55 x 10s
4.51 x 10s
5.40 x 10s
4.22 x 10s
1.32 x 10³
9.08 x 10³
3.50 x 10s
1.27 x 10s
4.36 x 10s
3.80 x 10s
Curies/FuelElement
1.14x 10³
2.90 xlO3
5.55 xlO3
7.84 x 10³
5.32 x 10³
8.23 x I03
1.45x\0*1.74 x 10*1.36 x 104
4.26 x 102.93 x 102
1.13 x 10*4.10 xlO3
1.41 xlO4
1.23 x 10⁴
Rads/CurieInhaled
1.48 x 10*5.35 x 104
4.0 x 10s
2.5 x 10⁴
1.24 x 10⁵
The assumptions made in computing the doses andmortality risks are as follows.
(a) Meteorological conditions(1) Cross canyon (N and S of reactor). Pasquill
Type C with 5 m/sec wind speed.(2) Down canyon (E of reactor). Pasquill Type F
with 1 m/sec wind speed.(3) Up canyon (W of reactor). F^squill Type C with
1 m/sec wind speed.
These conditions are the same as those used in the 1969status report on the 0WRC7 except that we used a cross-canyon wind speed of 5, rather than 10, m/sec.
(b) The radioactive leak is a continuous, ground-level,point source with a short release period.
(c) Iodine deposition velocity of 1 cm/sec. Radioactivecloud source strength corrected for ground deposition.
(d) For thyroid inhalation dose and whole-body dosefrom the radioactive cloud, fission-product decay wasneglected. Doses were computed for exposure during en-tire period of cloud passage.
(e) Whole-body dose from ground deposition of iodines isfor infinite exposure with radioactive decay taken intoaccount, and exposure point 1 m above ground.
(f) If F is the core fraction assumed to have melted,(1.0 x F) of the total Xe-Kr inventory is released to theatmosphere.
(g) If F is the core fraction assumed to have melted,(0.5 x F) of the total iodine inventory is released to thereactor tank. If the core is covered by water, the releaseto the atmosphere is (0.05 x F = 0.5x0.1 xF) . If fuelmelting occurs after drainage of the reactor tank, the re-lease to the atmosphere is (0.25 x F = 0.5 x 0.5 x F).Finally, if the iodines are released to the atmospherethrough the stack filters, an additional attenuation of0.01 (99% filter efficiency) is assumed.
4. Dose Calculations
For the dose calculations, the release of all iodinesand noble gases from one fuel element was chosen as the"unit" source. In computing the doses from a postulatedaccident, the release fractions appropriate to the corefraction melted and the circumstances of the release (see( 0 and (g) above) were applied to the normalized "perelement" values. It was convenient to introduce twoquantities, Kx and Fd, defined as follows:
23

Kx = dilution factor = 1/(JTU oy o2) sec/m3 ,
where
u = averege wind speed (m/sec) ,
oy,oz = standard deviation of the plume distribution inthe y and z directions (m).
Fd = depletion factor (due to ground deposition) forthe radioactive cloud = Q'x/Q'o .
where
Q'x = effective depleted source term,Q'o = original source term.
The dilution and depletion factors, at selected downwind
dilution factors are from Hilsmeier and Gifford^-8 thedepletion factors are based on the work ofChamberlain.4-'
Using Kx and Fd , the thyroid dose can be com-puted as follows.
Dr = (1/ffu oy az) Fd R(2 Qn Bn) rads
= K x F d R ( S Q n B n ) r a d s ,
where
R = breathing rate = 3.47 x 10"* m3/sec,
Qn = curies of n th iodine nuclide released,
Bn = rads/curie of n th iodine nuclide inhaled.
distances, for the three meteorological conditions of in- In the equation above, Kx Qn is the concentration timeterest (see preceding section) are shown in Table C-II. The integral for the n th iodine nuclide. Using this formula and
TABLE C-II
DILUTION FACTORS (K,) VS DOWNWIND DISTANCES (X) FORSELECTED STABILITY CATEGORIES
(Depletion factors Fd at • deposition velocity of 1 cm/sec,applicable to iodine isotopes, are given in parentheses.)
Dilution Factor (Sec/m3)Downwind
Distance (m)
100
200
400
800
1000
2000
3500
5000
10000
Type C, 5 m/Sec
8.0x10"*(9.1x10"')
2.0X10"*(9.1x10"')
6.0xl0"s
(9.0x10"')
1.5xl0"s
(8.9x10"')
1.0xl0"s
(8.8x10"')
2.8x?.0'6
(8.7x110"')
9.0x10"'(8.6x10"')
5.2 xlO"7
(8.5x10"')
1.8 x JO"7
(8.2x10"')
TypeE
2.1 x(6.0x
5.3 x(5.1 x
1.4 x(4.2x
4.5 x(2.8x
3.1 x(2.7x
1.0 x(2.2x
3.8 x(1.7x
2.5 x(1.3 x
9.0 x(7.4x
, 1 m/Sec
10's
10"')
10"3
10"')
10"3
10"')
10"*10"')
10"*10"')
10"*10"')
10"s
10"')
10"5
10"')
10"6
10"2)
Type F, 1 m/Sec
5.0 xlO"2
(5.2x10"')
1.2 xlO"2
(4.0x10' ')
3.3 x 10"3
(2.6x10"')
9.3 x 10"*(1.8x10"')
7.0 x 10"*(1.5x10"')
2.2 x 10"*(9.0 xlO"2)
9.5 x 10"3
( 5.5 x 10"' )
6.0 x 10s
(3.8x10*)
2.6 x i0"s
(1.4xlO'J)
24

the data shown in Tables C-I and C-II, one can calcu-late the thyroid doses, shown in Table C-IV.
Because of the various possible iodine release frac-tions, the radioactive cloud doses were computed separ-ately for the noble gases and for the iodines. Theintegrated dose due to the passage of a semi-infinite radio-active cloudC9 is given by
D7 = 0.25(po/p)ET
where(po/p) = correction factor for air at other than
standard conditions = 1.2 at 7000-ft alti-tude.
E7 = average gamma energy (MeV) released perdisintegration
\l> = concentration time integral (Ci-sec/m3)
For the problem at hand, the contributions to the clouddosage can be written as follows:
D7 (Xe + Kr) = 0.3 Kx (Ci-MeV/dis)Xe+Kr rads
D r (iodines) = 0.3 Kx Fd (Ci-MeV/dis)iodines rads
Using the data given in 1 aole C-II and the values of Ci-MeV/dis given in Table C-III, the cloud dosages werecomputed; the results for the Xe + Kr and iodine contri-butions are tabulated in Table C-IV.
It then remains to compute the gamma doses fromthe radioactive iodines deposited on the ground. For theassumed 0.01-m/sec deposition velocity, one can write
Deposition rate (Ci/m2 ) =
(0.01 m/sec) x (^ Ci - sec/m3 ) ,
where \\> is the concentration time integral. Assuming in-finite plane source geometry, the gamma dose rate contri-bution from the i th iodine nuclide (D* j) was obtained fora detector point lm above ground. The dose rate for in-finite exposure, taking radioactive decay into account,can be shown to be (D^ t/X
l), where A' is the appropriatedisintegration constant. The total dose, obtained bysumming the latter expression over the iodine nuclides,can also be corrected to account for the finite nature ofthe source; this was done, and the results are shown inTable C-IV.
5. Calculation of Individual Mortality Risks
The data in Table C-IV can now be used to obtaincurves of individual mortality risk vs downwind distance(from the reactor) for each of three directions of interest,cross canyon, up canyon, and down canyon. Using thecurve of atmospheric release vs accident probability peryear (Fig. 2), we scaled the doses in Table C-IV (in aspecified direction) appropriately to account for the re-lease conditions associated with each postulated accident.
TABLE C-ffl
DATA USED IN DETERMINATION OF EFFECTIVE GAMMA-RAY SOURCE STRENGTHFOR WHOLE-BODY DOSE CALCULATIONS, BASED ON RELEASE FRACTION
OF 1.0 FOR ALL NUCLIDES
Nuclide
83mKr8smXr87 Kr88 Kr131 j132,1 3 3 1134,
135 j
131 171 X e
1 3 3 m Xe133 Xe!3smXe135 Xe138 Xe
Half-Life
1.9 H4.4 H
76. M2.8 H8.1 D2.3 H
20.6 H53. M
6.7 H12. D2.3 D5.3 D
16. M9.1 H
17. M
Gamma MeVPer Dis
0.0410.21.42.00.42.00.551.31.50.1630.2330.0810.520.251.0
Curies Released/Fuel Element
1.14xlO3
2.90 x 10³
5.55 x 10³
7.84 xlO3
5.32 x 10³
8.23 x 10³
1.45x10*1.74x10*1.36x10*4.26x102.93 x 101
1.13x10*4.10 xlO3
1.41 x 10⁴
1.23x10*
Ci-MeV/Dis
4.67 x 105.80 x 102
7.77 x 10³
1.57x10*2.13 x 103
1.65x10*7.98 ,. 103
2.26 x 10*2.04x10*6.946.83 x 109.15 x 10s
2.13 xlO 3
3.53 x 10³
5.23x10*
25
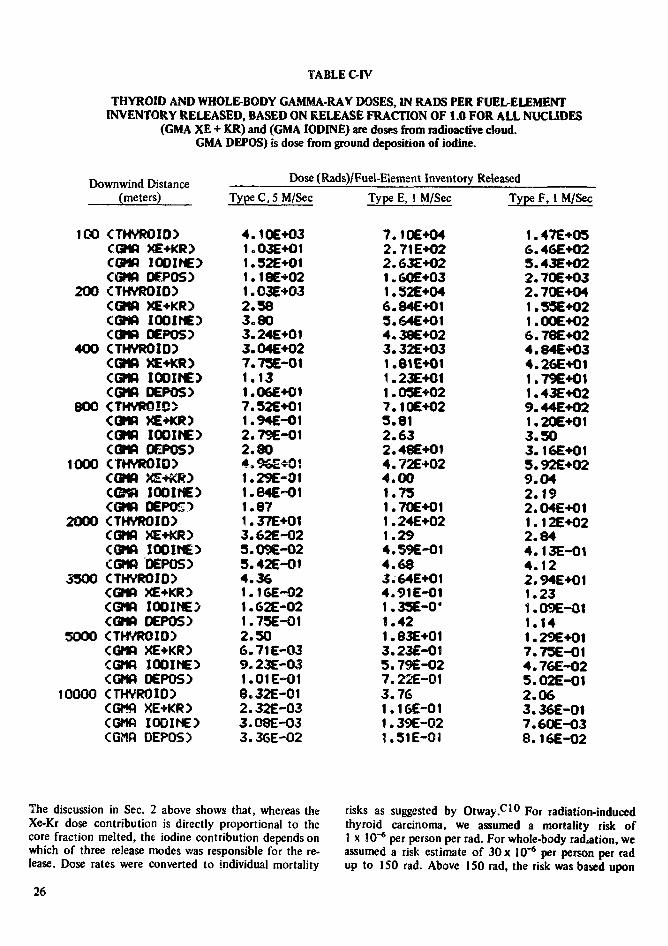
TABLE CIV
THYROID AND WHOLE-BODY GAMMA-RAY DOSES, IN RADS PER FUEL-ELEMENTINVENTORY RELEASED, BASED ON RELEASE FRACTION OF 1.0 FOR ALL NUCUDES
(GMA XE + KR) and (GMA IODINE) are doses from radioactive cloud.GMA DEPOS) is dose from ground deposition of iodine.
Downwind Distance(meters)
ICO CTHVROID)CGMfl XE+KR)CGMfl IODINE)CGMfl DEPOS)
200 CTHVROID)CGMfl XE+KR)CGMfl IOOINE)COMfl DEPOS)
400 CTHVROID)CGMfl XE+KR)CGMfl IOOINE)CGMfl DEPOS)
800 CTHVR0ID)CQHP XE+KR)CGHR IODINE)CGHA OEPOS)
1000 CTHVROID)CGMfl XE+KR)C©M IODINE)CGMfl OEPOS>
2000 CTHVROID)CGMfl XE+KR)CGMfi IODINE)CGMfl DEPOS)
3500 CTHVROID)CGMfl XE+KR)CGMfl IOOINE/CGMfl DEPOS)
5000 CTHVROID)CGMfl XE+KR)CGMfl IOOINE)CGMfl DEPOS)
10000 CTHVROID)CGMfl XE+KR)CGMfi IOOINE)CGMfi DEPOS)
Type C, 5 M/Sec
4.10E+031.03E+011.32E+011.18E+021.C3E+032.383c 803.24E+013.04E+027.73E-011.131.06E+G17.52E+011.94E-012.7SE-012.804s96E*011.29E-011.84E-011.871.37E+013.62E-025.09E-025.42E-014.361.16E-021.62E-021.75E-012.506.71E-039.23E-031.01E-018.32E-012.32E-033.08E-033.36E-02
Type E, 1 M/Sec
7.10E+042.71E+022.63E+02K6QE+031.S2E+046.84E+01S.64E+014.38E+023.32E+031.81E+011.23E+011.05E+027.10E+025.812.632.48E+014.72E+024.001.751.70E+011.24E+021.294.59E-014.683.64E+014.91E-011.35E~0f
1.421.83E+013.23E-015.79E-027.22E-013.761.16E-011.39E-021.51E-01
Type F, 1 M/Sec
1.47E+056.46E+025.43E+022.70E+032.70E+041.55E+021.00E+026.78E+024.84E+034.26E+011.79E+011.43E+029.44E+021.20E+013.503.16E+015.92E+029.042.192.04E+011.12E+022.844.13E-014.122.94E+011.231.09E-011.141.29E+017.75E-014.76E-025.02E-012.063.36E-017.60E-038.16E-02
The discussion in Sec. 2 above shows that, whereas theXe-Kr dose contribution is directly proportional to thecore fraction melted, the iodine contribution depends onwhich of three release modes v/as responsible for the re-lease. Dose rates were converted to individual mortality
26
risks as suggested by Otway.CI° For radiation-inducedthyroid carcinoma, we assumed a mortality risk of1 x 10~6 per person per rad. For whole-body radiation, weassumed a risk estimate of 30 x 10"' per person per radup to ISO rad. Above ISO rad, the risk was based upon

the response to acute whole-body irradiation. Results ofthese calculations for the cross-canyon case at distances of102. 103, and 104 m are shown in Figs. C-l through C-3.Corresponding curves for the up- and down-canyon caseswere also plotted. The individual mortality risk at a givendistance was obtained by integrating the curve in ques-tion. Results of these integrations are shown in Figs. 3through 5 in the body of the report. The method used toaccount for local meteorology and to infer lines of con-stant mortality risk (Fig. 6) is given in Appendix F.
>-
o2
1.0
10"
10"
10"'
? 10"
T l I I I
NOMINAL CASEWHOLE BODYTHYROID
[ I I I I I I II0-12 10''° KT8 I0-6 I0-4 ID"2
ACCIDENT PROBABILITY PER YEAR
Fig. C-l.Individual mortality risk vs accident probability at102 meters. (Pasquill Condition Type C, 5 m/seccross-canyon wind).
1.0
10"
q
O
n-8
1 1 1
- NOMINAL CASEWHOLE BCDYTHYROID
i 1 1
-2K> '"• 10"" to"0 O"° 10 10
ACCIDENT PROBABILITY PER YEARFig. C-2.
Individual mortality risk vs accident probability at103 meters. •'Pasquill Condition Type C. 5 m/seccross-canyon wind).
1.0
E
> >o-?
| , o -2
>QZ 10"° -
NOMINAL CASE
WHOLE BODYTHYROID
I0 " " IO"1U
ACCIDENT
,-6 ,-2lO'" 10'° K) 10PROBABILITY PER YEARFig. C-3.
Individual mortality risk vs accident probability atl(f meters. (Pasquill Condition Type C, 5 m/seccross-canyon wind).
References
C 1. S. K. Penny, D. K. Trubey, and J. Gumey, "Bibliography,Subject Index, and Author Index of the Literature Exam-ined by the Radiation Shielding Information Center," OakRidge National Laboratory report ORNL-RSIC-S (Rev. 1)(1966), pp. 15-19.
C 2. J. F. Perkins and R. W. King, "Energy Release from theDecay of Fission Products," Nucl. Sci. Eng. 3,726 (1958).
C 3. J. F. Perkins, "Decay of U-235 Fission Products," RedstoneArsenal report RR-TR-63-U (1963).
C 4. K. O. Koebberling, W. E. Krull, and J. H. Wilson, "LockheedFission Product Inventory Code," Lockheed-Georgia Com-pany Internal report ER-6906 (1964).
C 5. M. E. Battat, D. J. Dudziak. and rLR. Hicks, "Fission Pro-duct Release and Inventory from Pu Fast Fission," LosAlamos Scientific Laboratory report LA 3954 (1968).
C 6. 1. } . DiNunr.o, F. D. Anderson, R. E. Baker, and R. L.Waterficld, "Calculation of Distance Factors for Power andTest Reactor Sites," U. S. Atomic Energy Commission docu-ment TID-14844 (1962).
C 7. H. T. Williams, O. W. Stopinski, J. L. Yamell, A. R. Lyle. C.L. Warner, and H. L. Maine, "1969 Status Report on theOmegs West Reactor, with Revised Safety Analysis," LoxAlamos Scientific Laboratory report LA-4192 (1969).
C 8. W. F. Hilsmeier and F. A. Gifford, Jr., "Graphs for Estimat-ing Atmospheric Dispersion." Oak Ridge National Labora-tory report ORO-S45 (1962).
C 9. "Meteorology and Atomic Energy 1968," David H. Siade,Ed., U. S. Atomic Energy Commission/Division of TechnicalInformation (1968), pp. 204-206.
CIO. H. J. Otway, "The Application of Risk Allocation to Re-actor Siting and Design," Los Alamos Scientific Laboratoryreport LA-4316 (1970).
27

APPENDIX D
SUMMARY OF RELIABILITY DATA
The failure rates for critical components and sys-tems used in this analysis were derived from reliabilitymeasurements and estimates found in the literature andfrom statistical treatment of both OWR system test dataand OWR (and other reactor) operating histories. Refer-ences Dl through D4 were used as background for thefollowing discussion of reliability estimates for importantelements.
1. Main Coolant line Failure
Measured failure-rate data for primary system pip-ing are scarce, but there are many calculated and intuitiveestimates in the literature. Values of 2 x 1G"3 to3 x 10~*/yr have been reported05'0C for large-scale rup-ture of primary coolant systems in various types of reac-tors. Otway,0' on the basis of a literature search, used10~3/yr as a pessimistic estimate for catastrophic failureof the primary coolant system of a pressurized water re-actor (PWR). Green and Bourne05 estimated the reliabil-ity of hydraulic hoses and pressure vessels to be about afactor of ten higher for low-stress than for high-stress(pressure) applications. The OWR primary piping is sched-ule 10 (or greater) stainless steel which at S3 C maximumoperating temperature would have an allowable workingpressure (AWP) of about 350 psig. The AWP is basedupon one-quarter of ultimate strength, so the pressurecorresponding to ultimate strength would be about 1400psig, whereas the maximum operating pressure in theOWR is 28 psig. Further, most of the OWR primary sys-tem is underground and not exposed to mechanicaldamage. Because of this and the very low operating pres-sure we have conservatively used 5 x 10 /yr as theprobability of catastrophic rupture of the primary coolantsystem.
2. Instrument Port Failure
Although the five 4-in.-diam instrument ports thatpenetrate the reactor tank are considerably smaller thanthe main coolant line, their location below the reactorcore warrants consideration of their possible role in loss-of-coolant accidents. Because of their close proximity tothe core, these ports are exposed to high neutron andgamma fluxes; also, their location precludes inspectionand testing once they are installed. For gas-cooled reac-tors, Cave and Holmes0 8 have proposed values for theprobability of sudden and severe failure of steel pressureparts. Where there is no reinspection nor retesting, theygive z faiiuie probability of 10"* in 30 yr of service for
parts exposed to neutron irradiation; for unirradiatedcomponents, the figure is a factor of 10 smaller. Note thatthe instrument ports are exposed only to the static pres-sure from the water ;.n the tank. For this study, we haveused a failure rate of 5 x lO^/yr for the instrument ports,i.e., a factor of 10 higher than that assumed for the maincoolant line.
3. Antisiphou System Failure
The main component of the antisiphon loop in theOWR is the "flapper" valve (see Appendix A). Duringnormal cooling flow, this valve is closed; on loss of flow itfalls open under its own weight. One method used toestimate the failure rate for this valve was based on OWRtest data. The flapper valve in its present configurationhas operated for approximately 13 yr without failure.During normal reactor operations the main coolant pumpis turned off approximately once a week. If the Rappervalve should fail to close on startup of the pump, the corecoolant flow would be drastically reduced and the mal-function would be indicated by annunciator signals at thereactor console. Using a value of no failure in 500 obser-vations, we estimate failure probabilities of4.6 x 10~3/demand (90% upper confidence limit) and1.4 x 10"*/demand (99.9% upper confidence limit).
Reliability may also be estimated by considering thevalve as a component that is in continuous service andassigning it a failure rate. Failure rates quoted03 forvarious valve types (ball, butterfly, check, and controlvalves) range from 3 to 8 failures/106 h, or 0.03 toO.C7/yr. Because of the importance of this valve, we haveused the conservative value of 7 x 10"2/yr.
4. Emergency Core Spray System No. 1
This system uses city water from the fire watermain. Decision to actuate this system is made by the oper-ating crew and involves manipulation of two valves. Thesystem is checked each week by an indirect functionaltest procedure. In assigning a failure probability, we usedthe following individual component probabilities.
Fire water main systemValve failure rateOperator error
iO^/demand!0~3/demand10"3/operation
Using the methods described in Appendix B, we com-puted the failure probability to be 2.1 x 10~'/demand.
28
5. Emergency Core Spray System No. 2
T! s system uses reactor-system water and employsan electrically driven pump to deliver cooling spray to thecore. Therefore, the reliability depends only on the suc-cess or failure of the electric motor starter circuit. Prob-ability of the electric motor's failing once started, wasselected as 5 x lCT3/yr,D1> p3> D 4 and the probability ofstartup failure was conservatively taken as 10 times theyearly failure rate, giving 5 x 10"2/demand.
An alternate method was also used to estimate thespray system's reliability on the basis of OWR operatingdata. This system is routinely checked each week, and nofailures have been observed in 130 checkouts. On thebasis of Appendix B, the failure probabilities were com-puted as 1.8 x 10~2/demand(90%uppei confidence limit)and 5.2 x 2O"2/demand (99.9% upper confidence limit).The latter value, which compares with those in the litera-ture, was used in the accident calculations.
6. Control Rods and Scram Systems
The control rods and reactor scram systems havenot failed to respond to shutdown demand in the past 13yr of OWR operation. An estimated 3200 scram demandshave been initiated without failures. According to Appen-dix B, the failure probability is 7.2 x lO^/demand (90%upper confidence limit) and 2.2 x 10"3/demand (99.9%upper confidence limit).
7. Cladding Defects in Fuel Elements
Harrison09 reports that in the first 11 yr of opera-tion, the Materials Testing Reactor (MTR) successfullyused over 2000 MTR-type fuel-element assemblies. How-ever, on three separate occasions, mechanical deficienciesin the assemblies were responsible for 164 to 184 "fail-ures." On only one of these occasions, when 142 failureswere caused by a seemingly ic'nor change in assemblydesign, did the cladding rupture or any fissile material orfission products escape from the fuel plates. The otherfailures were caused by undetected errors during assemblyfabrication. Eagan01" has reported multiple failures ofcladding on MTR-type fuel elements ovc-r a 2-yr period.
During this period, three different companies manufac-tured the reactor fuel, but only that from one manufac-turer failed. Before this 2-yr period, the reactor hadoperated for 9 yr without any cladding failure. In light ofthese experiences, it seemed reasonable to assign a clad-ding failure probability based on th<; OWR experience ofno cladding failures during 13 yr of operation. Using thesedata, one arrives at 0.2 to 0.5/yr for the 90% and 99.9%upper confidence limits, respectively. A value of 0.5/yrwas chosen for this study.
References
D 1. "FaUure Data Handbook for Nuclear Power Facilities,"Liquid Metals Engineering Center report LMEC-MEMQ-69-7(1969).
D 2. "Failure Rate Data Book," Vols. 1-3, U. S. Naval Fleet Mis-sile Systems and Evaluation Group, Corona, California,1966-196o.
D 3. "Reliability Analysis of Nuclear Power Plant ProtectiveSystems," Hoimes and Narver report HN-190 (1967).
D 4. Earles, "Reliability Application and Analysis Guide,"MI-60-54 (Rev. I), The Martin Company (July 1961).
D 5. A. E. Green and A. J. Bourne, "Safety Assessment withReference to Automatic Protective Systems for Nuclear Re-actors," AHSB-(S>117 (1956).
D 6. L. Cave and J. R. Crickmer, "Safety Assessment of FastReactors by Probability Methods," Proc. Intern. Conf.Safety of Fast Reactors, Aix-en-Provcnce, France, Septem-ber 1967.
D 7. H. J. Otway, "The Application of Risk Allocation to Reac-tor Siting and Design," Los Alamos Scientific Laboratoryreport LA-4316 (1970).
D 8. L. Cave and R. E. Holmes, "Suitability of the AdvancedGas-Cooled Reactor for Urban Siting," Proc. Symp. Con-tainment and Siting of Nuclear Power Plants, Vienna, April1967.
D 9. L. I. Harrison, "Mechanical Failures of MTR Fuel Assem-blies," Nucleonics 21, No. 10, 78 (1963).
D10. J. L. Eagan, "Multiple Failures of MTR-Type Fuel Elementsat the LPTR," University of California Research Laboratoryreport UCRL-71736 (1969).
29

APPENDIX E
SUMMARY OF ACCIDENTS CONSIDERED
I. Introduction
Estimation of numerical reliability values for re-actor systems and components is important in probabilis-tic reactor risk analysis. The reliability data are used toobtain overall probabilities for postulated accidents. Theaccident probabilities, together with their associated con-sequences, are the input to the risk calculation. Here, wewill examine several accidents, compute their probabil-ities, and give release estimates. For those accidents whichdo result in a fission-product release, the computed prob-abilities and release figures provide the input data for thedispersion and dose calculations discussed in Appendix C.
Accidents which could result in fission-product re-Ssase to the atmosphere may be categorized as reactivityaccidents, loss of coolant, loss of cooling flow, and fuelelement cladding failures. In the analysis of these acci-dents, the engineered safeguards and safety systems incor-porated in the Omega West Reactor (OWR) design areimportant considerations. These safety features include anantisiphon loop, a free convection loop, two emergencycore spray systems, control-rod design compatible withboth safety and operational requirement, and safetysystem instrumentation (see Appendix A). The fission-product releases quoted in this appendix are in terms ofcuries of 131I released. However, in performing the disper-sion and dose calculations, due account is taken of theother iodine isotopes and the Xe-Kr fission products.
2. Reactivity Accidents
The reactivity accidents chosen for this study havebeen discussed by Williams et al. in the 1969 status reporton the OWR,EI so only brief descriptions of selectedaccidents are given here. These include control-rod break-age, startup accidents, accidents at power, and core load-ing accidents. Williams and co-workers also consideredaccidental reactivity additions due to manual withdrawalof the control rods and replacement of air with water (orgraphite) in the experimental ports, but concluded thatthese did not pose any safety problems. !n fact, fromresults of SPERT experiments for OWR-iike cores,Williams and co-workers concluded that only a core load-ing accident couk' result in fission-product release. Forthe OWR, the SPERT results indicated that periods short-er than 4 to 5 msec would be required to produce fuelmelting.
(a/ Control Rod Breakage. A reactivity excursioncould result if one of lie control rods broke accidentally
and the absorber section moved from a region of higher toa region of lower worth. The maximum step increase inreactivity due to a rod break, from a 10-kW initial powerlevel, is estimated as 1% in A k/k, corresponding to a22-msec period. Considering SPERT data, the excursionwould be self-limiting with maximum fuel temperaturesof 150°C, and no fission products would be released.
(b) Startup Accidents. A possible consequence ofan operator error, or control-rod drive failure, or both isthe sequential or simultaneous withdrawal of the controlrods During startup, and for an initial power level of 0.8W (apparent source level), the following values were calcu-lated. For sequential withdrawal at maximum speed, theramp rate is 0.16 $/sec and the minimum period is 63msec. In case of simultaneous withdrawal of all eightcontrol rods, the maximum reactivity insertion rate wouldbe 0.8 $/sec with a minimum period of 21 msec. Theseminimum values are larger than the 4- to 5-msec periodsrequired for fuel melting. The probability of a reactivityfault at startup, due to either equipment failure or opera-tor error, is of the order of 10"4 per year.E2
(c) Accidents During Power Operation. In theOWR, an automatic control system is used to hold thereactor power constant at any preset level from 10 kW todesign power. This is accomplished by a servo system thatdrives the four central control rods and is so designed thatthe maximum reactivity rate for the four rods movingtogether is about 0.004 S/sec. Results of tests that simu-lated the reactor response to a continuous rod withdrawalby the setvo system showed a two-decade increase inpower level over 130 sec, with a final reactor periodlonger than 10 sec. Because of the slow response, suffi-cient time is available for operator action or for one ofthe scram channels to terminate the power rise beforereactor damage can occur. Reactor faulting at power hasbeen estimated as 10"2 per year.E2
(d) Core Loading Accident. The core loading acci-dent discussed by Williams et al.E1 was the dropping of afuel element in a just-critical core. They estimated thatthis would result ir (1) a ramp reactivity-insertion rate of10 S/sec, (2) a minimum period of 4.7 msec, (3) meltingof about 2% of the total fuel plate area, and (4) escape tothe atmosphere of less than 0.01% of the iodines. Theyalso stated that such an accident could only result frommultiple miiukes and accidental deviations from carefullycontrolled procedures.
For a core loading accident to occur, a fuel loadingoperation must have preceded the reactor startup; denote
30

this probability by P L . If the reactor is in operation for6240 h/yr (120 h/wk) and we assume that the refuelingoperations require a total of 100 h/yr, PL is (100/6240)or 1.6 x 10"2/yr. We will also conservatively assume thatonly two procedural errors are required to initiate such anaccident. The probability of ar.y given instruction's beingexecuted improperly, or being omitted, is given byOtwayE2 as 10"3 to 10"4 per instruction. Using 10~3,theoverall accident probability is 1.6xlO"8/yr; the release(0.01% of the iodines) is 16.5 Ci of 13lI and accompany-ing fission products. Note that the OWR has a fuel ele-ment hold-down grid to prevent inadvertent lifting of anyfuel element from the matrix. This grid is unlocked andlifted aside during core loading.
3. Loss-of-Coolant Accidents
The severity of a loss-of-coolant accident is pri-marily a function of the time (after shutdown) requiredfor the coolant level to drop below the core. The time todrain the tank depends, in turn, on whether the reactortank lid is open or closed. During normal operation, it isclosed, but loss of integrity of any one of its variouspenetrations (including two access hatches) wouldamount to its being open. Williams et al.E 1 present datawhich show that fuel melting will occur only if t'.se tank isdrained below the level of the core less than 30 min aftershutdown without corrective measures being taken. Loss-of-coolant accidents considered here are a main coolantline rupture and an instrument port rupture (see Appen-dix A). Appendix D contains a discussion of the reliabilitydata used in the following analysis.
(a) Main Coolant Line Rupture. The most severeloss-of-coolant accident is postulated to be a guillotinebreak of the main coolant line, with the reactor top openand all the engineered safeguard systems failed. The sys-tems of interest for this accident chain are the antisiphonloop (flapper valve) and emergency core-spray system No.1. In case of a main line break, emergency core-spraysystem No. 2 is not taken as a sequence in the accidentchain because its source of water is the delay line which ispart of the primary loop. Failure rates used in arriving atthe overall accident probability are shown in Table E-I.Also shown are the corresponding figures for the casewith the tank top closed and the 90% upper confidencelimits.
The consequences of these accidents, in terms nffission-product release, are difficult to assess. With thetank top open, the extent of fuel melting is an extremelysensitive function of the time required to drain the tank.The fraction (approximately 2/3) of the core assumed tohave melted is extremely pessimistic, but it seemed thatthat fraction would comfortably accommodate any possi-ble mechanism that would drain the tank in a very few 'minutes. The figure of five fuel assemblies melted withthe tank top closed reflects the longer time needed todrain the tank. The I3II release to the atmosphere was
based on the inventory calculations in Appendix C;a 50%iodine release from the melt and a 50% plate-out areincluded in the figures shown in Table E-I.
(b) Instrument Port Rupture. The OWR tank con-tains a number of penetrations that could either fail orrupture during an accident. In contrast to the rupture of alarge-diameter (10 or 12 in.) main coolant line, a break inone of these penetrations would probably create an effec-tive drainage aperture about 4 in. in diameter.E1 Takingan instrument port break as a typical example, the time todrain the tank below core level is estimated as 6 min if thereactor tank top is open. With the top closed, the drainagetime would be considerably longer.^
Given an instrument port rupture, the engineeredsafeguards to be considered are the two emergency core-spray systems. Assuming the reactor tank top to be open,the sequences in the accident chain are as follows:
(1) Probability of an instrument port rupture,5xlO-4 /yr .
(2) Reactor tank top open, 10~2/yr.
(3) Core-spray system No. 1 failure, 2.1 x 10"3/demand.
(4) Core-spray system No. 2 failure, 5.2 x 10~2/demand.
Thus, the accident probability for an instrument portrupture (tank top open) is 5.5 x 10"'°/yr. The conse-quence of such an accident is estimated to be a melting of10% (three fuel assemblies) of the core. Using a 50%iodine release from the melt and 50% plate-out, thiscorresponds to an I3I1 release of 4 x 10³ Ci. The valueused by Williams et al.E1 for a similar case was2.7 x 103 Ci of 131I released. With the reactor tank topclosed, the accident probability is 5.5 x lO'Vyr and theassumed 13II release is 6.7 x 10* Ci, corresponding tomeltdown of half a fuel assembly.
4. Loss of Cooling Flow
This group of accidents includes those that do notinvolve rupture of the coolant piping. Failure of theprimary coolant pump and loss of flow through the indi-vidual fuel elements have been analyzed as the mostprobable accidents in this category.
(a) Loss of Main Coolant Pump. The power level atwhich the 0.WR operates and the automatic convectiveloop incorporated in its design protect the core in case ofmain coolant pump failure. Even without the automaticconvective loop, the flow passages between the uppertank and the plenum below the core aid in setting up anatural convective path. The efficacy of the automaticconvective loop has been demonstrated by experimental
31

TABLE E-l
ACCIDENT PROBABILITIES AND iasI RELEASES FOR LOSS-GF-COOLANT ACCIDENTS(Figures in parentheses are 90% upper confidence limits.)
Failure RatesMain-Line Rupture
Flapper Valve
Vessel Top
Core-spray No. 1
Overall AccidentProbability
Fission-Product ReleaseFuel Assemblies Melted
I3II Release
Tank Top Open
5 xlO"5
(1.9 xlO"4)
7 xl f f 2
(2.5 x Id"1)
1 x l f f 2
(3.9 x Iff2)
2.1 x Iff3
(8.2 x Iff3)
7.3 x Iff"(1.5 x l f f 8 )
20
2.7x10*
Tank Top Closed
5 x Iff5
(1.9 xlff4)
7 xlO"1
(2.5 r. I f f 1 )
9.9 x 10"'(9. x 10"' )
2.1 x 10"s
(8.2 xlO"3)
7.3 x 10"'
5
6.7x10*
Units
Per year
Per year
Per year
Per demand
Per year
Per accident
Curies
tests which showed that the maximum fuel surface tem-perature attained under this circumstance was about100°C.
(b) Fuel-Element Flow Blockage. Experience withreactors employing Materials Testing Reactor (MTR) fuelassemblies has shown that flow blockage from foreignmaterial entrained in the coolant is a possibility. In fact, ithas been estimated that about 80% of all reactors havehad foreign objects in their coolant systems at one tune oranother." In 500 reactor-years of operating history, flowblockage accidents (with some fission-product release)have occurred in at least three reactors of the samegeneral type as the 0WR.EI
The above information implies that the probabilityof a blockage is (3/500) or 0.006/yr. Assuming that thenumber of fuel assemblies blocked is represented by abinomial distribution, the probability of X ruel assembliesbeing blocked is
N!
P = probability that a fuel assembly is blocked,X = the number of fuel assemblies blocked.
whereN = total number (31) of fuel assemblies.
Thus
P ( 0 ) * l . 0 - 0 . 0 0 6 « ( l - p ) 3 1 .
from which p * 1.94 x 10"*. With this information, onecan solve for P(X) as follows.
P(l)= S.98 x 10"s b!ockage/yr,
P(2)= 1.74xl(T s(
P(3) = 3.26x10-*,
P(4) = 4.43xl0r".
Blockage involving more than three fuel elements was notconsidered for this analysis.
If fuel melting occurs beca'jse of flow blockage, themagnitude of the iodine release depends on whether thedischarge is directly to the atmosphere or through thestack filters. Venting through the filters requires that thereactor operator switch a vent valve. Either operator erroror valve failure causes the sequence to fail. Assuming
32

10~3/demand operator error and 2.5 x 10"2/demand valvefailure (estimated from OWR test experience), the com-bined failure rate is 2.6 x 10"'/demand. Hence, the prob-ability of direct release to the atmosphere is 0.026P(X)/yr. Conversely, the probability of venting throughthe stack filters is (1 - 0.026) P(X)/yr.
For the fuel blockage accidents we assume, first,blockage of 1, 2, or 3 fuel assemblies resulting in meltingof 1/4, 1, or 3 fuel assemblies, and, second, a 50% iodinerelease from the melt to the water and a 10% iodinerelease from the water to the atmosphere. For ventingthrough the stack filters, we applied a reduction factor of\02 to the iodine release, based on a 99% filler efficiency.It is also convenient to define
AP(X) = accident probability associated with block-age of X fuel assemblies,
AR(X) = I3'I release corresponding to AP(X).
With the above assumptions and definitions, the values ofAP(X) and AR(X) for direct release to the atmosphere are
AR(1) = 6.7x10 Ci l3 ll2 .7x l0 I Ci l 3 l l8 .0xl0 ICi ' 3 ! I .
AP(l)=1.6xlO-4/yrAP(2) = 4.5x 10"7/yrAP(3) = 8.4x 10"'°/yr
For venting through the stack filters, the correspondingfigures are
= 6.7xl0- 'Ci l 3 lIAR(2)=2.7x lO-'Ci131!
= 8.0xl0"'Ci I 3 lI
yAP(2)=1.7x IO-J/yrAP(3) = 3.1x 10-"/yr
5. Defective Fuel Element Cladding
For this accident, the cladding failure rate wastaken as O.S/yr. As in Sec. 4(b) above, a value of0.026/demand was assumed for the operator error plusvalve failure sequence, and direct release to the atmos-phere was assumed. The accident probability is thus1.3 x 10* 2/yr. The release mechanism postulated for thisaccident was a ckdding failure due to faulty fabricationor corrosion. Fission products considered were Xe, Kr,and, because of their high volatility, the iodine isotopes.If we assume that a cladding failure will expose 0.01% ofthe surface area of a fuel assembly (equivalent to the areaof a 1/2-in,-radius circle) and that 0.01% of the iodineinventory per fuel assembly is released, the I3M release is2.7 x 10"2Ci. This figure is based on a 50% release fromthe melt to the water and a 10% release from the water tothe atmosphere.
References
El. H. T. Williams, O. W. Slopinski, J. L. Yarnell, A. R. Lyle.C.L. Warner, and H. L. Maine, "1969 Status Report on theOmega West Reactor, with Revised Safety Analysis," LosAlamos Scientific Laboratory report LA-4192 (1969).
E2. H. J. Otway, "Th; Application of Risk Allocation to ReactorSiting and Design," Los Alamos Scientific Laboratory reportLA-4316 (1970).
E3, R. E. Mculler, "Objects Found in Power Reactor Systems,"American Nuclear Society Transactions, Supplement to VcL12 (October 1,1969).
APPENDIX F
LOCAL METEOROLOGY
The location of the Omega West Reactor at thebottom of a long, deep canyon presents some uniqueproblems in evaluating the risk to the surrounding popula-tion in case of fission-product release. For example, ifinversion conditions exist in the canyon, the resultingsuppression of vertical air movement will inhibit escape ofeffluent to the adjacent mesa tops. Thus, the canyonmeteorology will determine the dispersion of an effluentcloud. On the other hand, if effluent is transported to themesa top, the conditions at that level will govern itsdispersion. Given a noninversion condition in the canyon,Stopinski1*1 has suggested that effluent transport to the
mesa top would require a northerly or southerly wind onthe mesa and a wind of 180 ±60° (or 0±60°) at thereactor site. Note that the canyon runs east-west and thatmost of the residential areas are north and west of thereactor site. To provide data for the OWR safety analysis,StopinskiF1 studied the meteorology in the vicinity oftlie OWR. Data taken from March 15 to July 31, 1968,were tabulated, and those observations were selectedwhich showed (1) a southerly wind component on themesa, (2) winds of 180 ± 60° at the reactor site, and (3)an isothermal or positive lapse rate from the floor of thecanyon to its rim. Of a total of 2710 data points, 100, or3.7%, met these criteria.
33

We used Stopinski's data to infer the probability ofa noninversion condition in the canyon, where
P[Dose North] =
PfNoninvcrsk.nl PfWind to North]P[Wind to North] + P[Wind to South]
From the wind-row data given in Table IX of the OWRstatus report,F2 we infer that the probabilities of mesawinds in the 180 ± 60° and 0 ± 60° directions are 0.395and 0.180, respectively. Using these figures, we obtain
P[Noninversion] = (0.037/0.395X0.395 + 0.1 £0) = 0.054.
Taking the reactor location as i reference point, and againusing the wind-rose data, one can compute the probability(P,) of the mesa winds blowing into a given sector. Thesecomputations indicate that Pt for the cross-canyon sectors
(0±7S°, !S0 ±75°) is 0.688 and P, for the up- anddown-canyon directions (90 ± 15°, 180 ± 15°) is 0.121.The probability of a calm period is 0.191. DefiningPJsector] as the probability of fusion-product transportto a given sector on the mesa, it follows that
PJsectorj =(P,/0.688) (0.054).
The values computed for P[sector] can be applied, asscale factors, to the appropriate individual mortality riskvs downwind distance curve (Fig. 3 in text) to obtain thedistances corresponding to specified risk number!. Resultsof this procedure are shown in Table F-I.
These data, together with results of similar calcu-lations for the up- and down-canyon cases, can be graph-ically displayed by constructing Sines of constant mortal-ity risk on a schematic plan of the surrounding area (seeFig. 6 in the body of this report).
Fl. O. W. Stopimki, "Interim Report on Winds in Los AlunosCanyon," LASL internal memosutdum (September 25,1968).
F2. H. T. Williams, O. W. Stopinski. J. L. Ymtdl, A. R. LylcC.L. Warner, and H. L. Maine, "1969 Status Report on theOmega West Reactor, with Revised Safety Analysis,'' t o tAlamos Scientific Laboratory report LA-4192 (1969).
Sector Angle(0° = N)
105 to 150°150 to 195°195 to 255°285 to 330°330 to 015°015 to 075°
TABLE F-I
CROSS-CANYON RISK PER SECTOR
P(sector]
0.00570.00570.00680.00520.01630.0144
Mortality Risk vs Distance (m)
10»/yr
210210230200350345
l(T10/yr
6906?0750650
11801150
KT'Vyr
230023002600220042004150
lO-'Vyr
90009000
100008500
1850018400
34