Embed Size (px)
Citation preview
THINK.CHANGE.DO
UTS:INSTITUTE FOR SUSTAINABLE FUTURES
BLINDCOPY LOREM IPSUM

INTEGRATED SUPPLY-DEMAND PLANNING
FOR ALEXANDRIA, EGYPT
Water efficiency study & business case analysis for
water demand management
Draft
For EU-SWITCH / CEDARE
Authors
Stuart White, Monique Retamal
Institute for Sustainable Futures
UTS 2011
Institute for Sustainable Futures, UTS March 2011
Alexandria Water Efficiency Study i
DISCLAIMER
While all due care and attention has been taken to establish the accuracy of the material published,
UTS/ISF and the authors disclaim liability for any loss that may arise from any person acting in reliance
upon the contents of this document.
Please cite this report as: Retamal, M, White, S., 2011, Integrated supply-demand planning for
Alexandria, Egypt: water efficiency study & business case analysis for water demand management.
Prepared for CEDARE by the Institute for Sustainable Futures, University of Technology, Sydney.
Institute for Sustainable Futures, UTS November 2010
Alexandria Water Efficiency Study ii
ACKNOWLEDGEMENTS
The authors would like to thank Dr Dr. Khaled AbuZeid, Eng. Mohamed Elrawady, Nermin
Riad and other staff from CEDARE, Eng. Nadia Abdou, Eng. Hanan Taha and Eng. Noha Sabry
from the Alexandria Water Company and Prof. Dr. Alaa Yassin from Alexandria University.
Many other stakeholders in Alexandria and Cairo agreed to be interviewed as part of this
research and their support for the project is greatly appreciated.
Institute for Sustainable Futures, UTS November 2010
Alexandria Water Efficiency Study iii
EXECUTIVE SUMMARY
Water availability in Egypt is highly constrained, due to its dependence on a fixed national share of
the Nile River basin and population growth. This study, funded by the EU under the SWITCH
program, has been assessing urban water demand in Alexandria and options to maintain the supply-
demand balance, ranging from water efficiency options to effluent reuse and supply options such as
desalination. This analysis was undertaken using an integrated resource planning framework. The
need for new institutional frameworks has been identified, including national regulation of appliance
efficiency and local regulation of new buildings and developments. Indicative costing of options
suggest that there are some highly cost-effective options, particularly water efficiency options, that
could be the subject of investment.
Institute for Sustainable Futures, UTS November 2010
Alexandria Water Efficiency Study iv
TABLE OF CONTENTS
1 INTRODUCTION ................................................................................................................................... 1
Study Aim ............................................................................................................................................ 1
Previous Studies for Alexandria .......................................................................................................... 1
The Integrated Resource Planning Process ......................................................................................... 2
This water supply-demand planning strategy..................................................................................... 3
2 BACKGROUND ..................................................................................................................................... 4
3 IDENTIFICATION OF OPTIONS .................................................................................................................. 4
Background ......................................................................................................................................... 4
Programs previously studied by ISF ................................................................................................ 4
Programs examined in the Alexandria Water Company (AWCO) WDM study ............................... 5
4 DEMAND MANAGEMENT OPTIONS .......................................................................................................... 6
DM1 - Household water saving fittings retrofit .................................................................................. 6
Description ...................................................................................................................................... 6
DM2 - Toilet replacement in households ........................................................................................... 7
Description ...................................................................................................................................... 7
DM3 - Tourist and commercial efficiency improvements .................................................................. 7
Description ...................................................................................................................................... 7
DM4 - Government buildings efficiency improvements ..................................................................... 8
Description ...................................................................................................................................... 8
DM5 - Industrial customers efficiency improvement ......................................................................... 8
Description ...................................................................................................................................... 8
DM6 - System leakage reduction ........................................................................................................ 8
Description ...................................................................................................................................... 8
DM7 - Tariff reform ............................................................................................................................. 9
Institute for Sustainable Futures, UTS November 2010
Alexandria Water Efficiency Study v
Description ...................................................................................................................................... 9
DM8 - Agricultural efficiency offsets .................................................................................................. 9
Description ...................................................................................................................................... 9
DM9 - Appliance efficiency regulation .............................................................................................. 10
Description .................................................................................................................................... 10
5 SUPPLY OPTIONS ................................................................................................................................ 11
S1 – Wastewater recycled from West WWTP and East WWTP for industrial use............................ 11
Description of option .................................................................................................................... 11
S2 - Wastewater recycled from West WWTP and East WWTP for agricultural use ......................... 12
Description of option .................................................................................................................... 12
S3 – Desalination of agricultural drainage water for agricultural use .............................................. 13
Description of option .................................................................................................................... 13
S4 - Groundwater for Irrigation of city parks .................................................................................... 14
Description of option .................................................................................................................... 14
S5 – Desalination of seawater for reuse ........................................................................................... 16
Description of option .................................................................................................................... 16
S6 – Local wastewater reuse for new housing developments ......................................................... 17
Description of option .................................................................................................................... 17
S7 – Local wastewater reuse for new housing developments with Nutrient recovery .................... 17
Description of option .................................................................................................................... 17
6 MODELLING THE SUPPLY-DEMAND BALANCE .......................................................................................... 18
Option summary and assumptions ................................................................................................... 18
7 MODEL RESULTS ................................................................................................................................ 21
Scenario 1 .......................................................................................................................................... 23
Scenario 2 .......................................................................................................................................... 23
8 BUSINESS CASE FOR OPTIONS – COSTING ANALYSIS .................................................................................. 26
Institute for Sustainable Futures, UTS November 2010
Alexandria Water Efficiency Study vi
scenario 1 .......................................................................................................................................... 26
Scenario 2 .......................................................................................................................................... 26
9 ACTION PLAN FOR THE FUTURE ............................................................................................................ 27
Recommendations ............................................................................................................................ 28
10 REFERENCES ................................................................................................................................. 29
Institute for Sustainable Futures, UTS March 2011
Alexandria Water Efficiency Study 1
1 INTRODUCTION
The cities and towns in Egypt operate in a highly constrained water supply situation, due to
the dependence on a fixed national share from the Nile River basin (shared by 10 riparian
countries), and a diminishing per capita share as population increases. As part of the
European Union-funded SWITCH project, the authors have undertaken research on the
urban water supply-demand balance in Alexandria, the second largest city in Egypt.
STUDY AIM
The aim of this study is to develop and model a portfolio of options to meet the projected
demand for water in 2037 in Alexandria while maintain extractions from the Nile system at a
capped amount. The options available include a range of demand management and supply
options and include pricing, regulatory and engineering options.
The study is also designed to present a business case for investment in options that improve
the efficiency of water use, by improving on previous estimates (Turner et al. 2008) and
demonstrating the cost effectiveness of these options relative to the cost of supplying
water.
A user-friendly model for assessing options for water demand management and supply has
been developed, and populated with the best available information regarding water use by
sector and by end use, and also shows the capital and operating costs, and the estimated
yield of the various options in a transparent way.
This report also describes a number of implementation issues associated with the options,
including equity issues, financing and the additional benefits that can be derived from a
number of the options.
PREVIOUS STUDIES FOR ALEXANDRIA
In 2007 and 2008 the Institute for Sustainable Futures (ISF) conducted action research and
training workshops in Cairo and Alexandria on the method of integrated resource planning
as applied to urban water. During these workshops, preliminary data was gathered
regarding household water use, potential options for demand management in Alexandria
and the cost of these options. A preliminary model was set up to estimate the relative costs
of these options. In 2010, ISF and CEDARE set out to undertake a more comprehensive
business case analysis of both demand management and supply options.
Through the SWITCH program in Alexandria, a comprehensive range of studies have been
undertaken by the Learning Alliance (comprising a range of stakeholder agencies including
AWCO, ASDCO, CEDARE, the Governorate of Alexandria and the University of Alexandria)
regarding water management, including groundwater management and supply options,
stormwater and rainwater options, demand management, household water survey, social
impacts & affordability and these culminated in the development of an integrated urban
water management plan (please see AbuZeid et al. 2009, 2010a, 2010b; Chemonics Egypt,
Institute for Sustainable Futures, UTS March 2011
Alexandria Water Efficiency Study 2
2010; Yassin, 2010).. The results of these studies have been reviewed and where possible,
integrated into the modeling and results in this report.
THE INTEGRATED RESOURCE PLANNING PROCESS
Integrated resource planning (IRP) has its origins in the electricity industry in the 1980’s,
with the recognition that it is often cheaper and quicker to reduce the demand for electricity
than it is to build new power stations. The principles underlying IRP include the idea that
reliable reductions in demand can be considered as equivalent to increases in supply, and
the task is therefore to determine what options are available to increase the efficiency of
water use, and to estimate the relative costs and benefits of a range of options to meet the
objectives of a water agancy or utility. These objectives are often driven by an emerging gap
between the demand for water and the available supply or yield.
The process of IRP includes the development of a baseline, or reference case demand
forecast. This forecast is then used to determine the new supply-demand balance in the case
where demand management options are implemented. The development of options that
involve the reduction of water demand through improved water efficiency requires a greater
level of analysis of the demand for water by sector (e.g. residential, commercial, industrial)
or by end use (e.g. toilets, showers, washing machines, garden use). This is called sector and
end use analysis, and can be undertaken with varying levels of detail depending on data
availability. Other aspects of the process of integrated resource planning are described in
Turner et al. (2006).
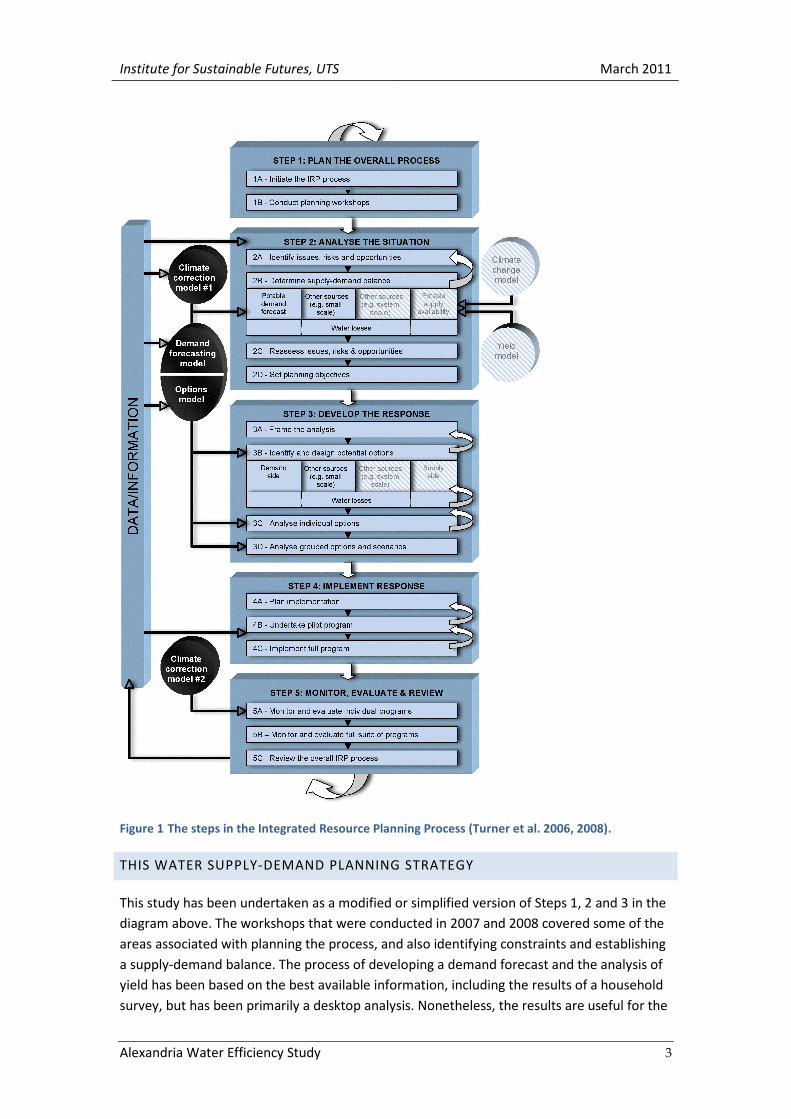
This methodology and process has been applied in a number of areas worldwide, including
in Australia and also in the Middle East (Turner et al. 2008, Turner et al. 2005). The process is
summarized in the diagram below (Figure 1).
Institute for Sustainable Futures, UTS March 2011
Alexandria Water Efficiency Study 3
Figure 1 The steps in the Integrated Resource Planning Process (Turner et al. 2006, 2008).
THIS WATER SUPPLY-DEMAND PLANNING STRATEGY
This study has been undertaken as a modified or simplified version of Steps 1, 2 and 3 in the
diagram above. The workshops that were conducted in 2007 and 2008 covered some of the
areas associated with planning the process, and also identifying constraints and establishing
a supply-demand balance. The process of developing a demand forecast and the analysis of
yield has been based on the best available information, including the results of a household
survey, but has been primarily a desktop analysis. Nonetheless, the results are useful for the
Institute for Sustainable Futures, UTS March 2011
Alexandria Water Efficiency Study 4
purpose of identifying the underlying issues and constraints and a portfolio of options to
meet the supply demand balance and increase the level of sustainability of water use in
Alexandria.
In addition to a literature review of these studies, the ISF team visited Alexandria and Cairo
with CEDARE to meet with the Alexandria Water Company (AWCO) and the Alexandria
Sanitation and Drainage Company (ASDCO) to discuss possible options and gather
information regarding infrastructure planning and costs.
The information gathered through the training workshop, literature review and interviews
were used to build upon the preliminary model in order to develop an integrated water
supply/demand planning strategy including business case analyses of potential options. The
integrated water supply/demand planning strategy involved an analysis of household end
use data (from the household water use survey), analysis of historical water consumption by
sector, water use projections to 2037, development of demand management and supply
options and calculation of water savings and levelised costs.
2 BACKGROUND
The allocation of the Nile River resources to Egypt is based on a 1959 agreement with Sudan
that allocates 55 billion m3 to Egypt. This is supplemented by very small volumes of water
from other sources. The majority of water is used in agriculture, although the cost of
supplying water to urban areas is high due to capital costs for treatment and reticulation.
Egypt is an arid country, and Alexandria is at the very end of an extensive system of canals
that provide water for agriculture, industry and urban uses.
Water supply in the region is the responsibility of the Alexandria Water Company (AWCO).
Wastewater management is undertaken by a separate agency: the Alexandria Sanitation and
Drainage Company (ASDCO). In addition, overall national planning and funding support for
capital works is administered by the Egypt Holding Company for Water and Wastewater.
3 IDENTIFICATION OF OPTIONS
BACKGROUND
PROGRAMS PREVIOUSLY STUDIED BY ISF
During the 2007 and 2008 training workshops a series of options were developed and
examined by ISF. These options were based on preliminary estimates developed from
workshop participants (members of the Learning Alliance) and also the knowledge of the
workshop leaders, based on experience in Australia and also in other countries in the Middle
East (Oman, Jordan). These estimates were based on limited information, but were reality
tested against similar results in other locations. The outcome of this work is shown in Table
1 below.
Institute for Sustainable Futures, UTS March 2011
Alexandria Water Efficiency Study 5
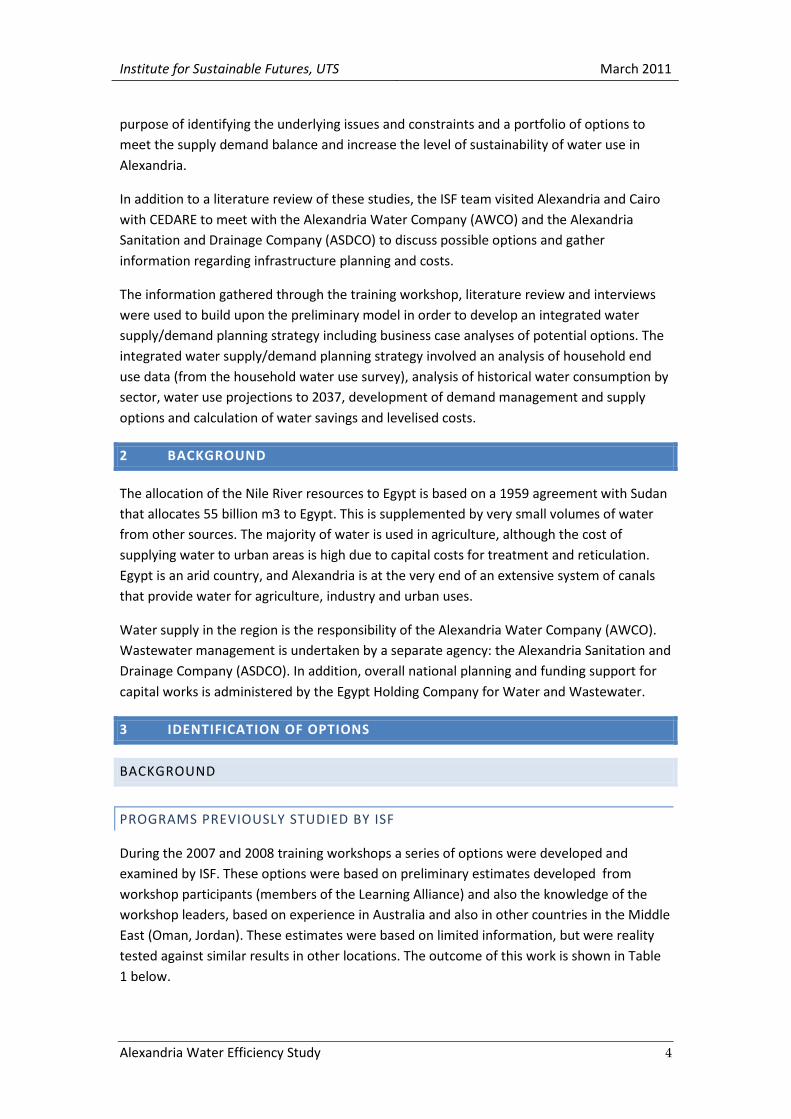
Table 1 Estimates of present value (PV) cost in USD, unit cost (levelised) and yield of a number of
demand management and supply options, as estimated in action research and training workshops
in 2007 and 2008.
All of the above options have subsequently been refined and incorporated into the current
study.
PROGRAMS EXAMINED IN THE ALEXANDRIA WATER COMPANY (AWCO) WDM
STUDY
A range of options were examined in the Alexandria Water Demand Management Study.
The following options were devised by AWCO and CEDARE and assessed qualitatively
through multi-criteria analysis. The three options which received the highest scores were
then examined in more detail. These were options 1, 5 and 9 from the following list.
1 – Minimise losses from the pipe network
2 - Regular detailed monitoring of production, transfers to other areas, demand and losses
3 – Maximise water use efficiency in commercial premises
4 – Maximise industrial water use efficiency
5 – Maximise household water use efficiency
6 – Use alternative water sources for some water uses
Options
Option
cost
PV $m
Unit costs
PV$/PVm3
Water saved
or supplied
in 2037
(mM3/a)
Demand Management Options
Existing properties
Displacement device program 1.4 0.06 2.0
Toilet replacement program 24 0.29 7.3
Household leaks program 6.7 0.07 8.4
Tourist and commercial program 3.3 0.08 3.8
Government program 2.7 0.08 3.1
Industry program 2.8 0.08 3.2
Non revenue water program 66 0.14 4.1
Sub Total 108 *0.11 69
New properties
Household regulations 163 0.45 91
Supply options
Desalination 542 1.22 50
Major industrial reuse 126 1.42 10
Institute for Sustainable Futures, UTS March 2011
Alexandria Water Efficiency Study 6
7 – Capacity building of Alexandria water company in WDM
8 – Co-ordination with the Ministry of water resources and irrigation MWRI – improved
efficiency in agriculture could lead to a higher allocation for the city of Alexandria
9 – Increase water tariff
10 – Awareness and enforcement of laws – community education
The costing estimates determined for options 1, 5 and 9 in the WDM study were used to
inform the costing of options in this integrated resource planning study. The concepts for
options 3, 4, 6 and 8 were also incorporated into this study. While options 2 and 7 were also
considered important strategies, due to difficulties in determining water savings, they were
not included in the present analysis.
4 DEMAND MANAGEMENT OPTIONS
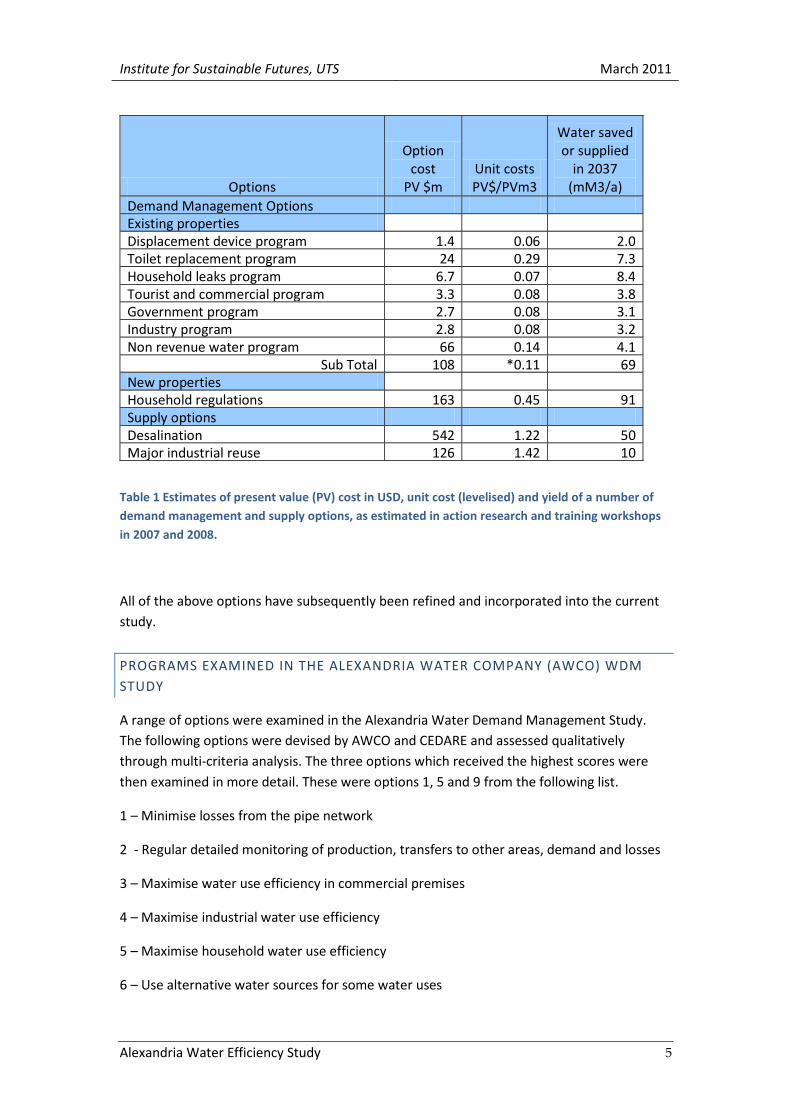
DM1 - HOUSEHOLD WATER SAVING FITTINGS RETROFIT
DESCRIPTION
This program involves employing plumbers and representatives
from the water company to visit households and undertake several
key water saving tasks. These include;
1. Fixing leaks in the plumbing, particularly toilet cistern leaks
2. Replacing old showerheads with new water efficient
showerheads
3. Fitting a displacement device into toilet cisterns to reduce
the volume used when flushing
4. Installing aerators on taps to reduce the flow rate
Evaluations of similar programs in Australia found water savings
around 20 kilolitres / household / annum for average household
size of 2.7 (Turner et al. 2007). The costs for this option have been
based on costing developed by AWCO (AbuZeid et al., 2010b).
Institute for Sustainable Futures, UTS March 2011
Alexandria Water Efficiency Study 7
DM2 - TOILET REPLACEMENT IN HOUSEHOLDS
DESCRIPTION
This option involves employing plumbers to visit households and
replace their old toilets completely. When old 12 litre flush toilets
are replaced with new 4.5 litre / 3 litre dual flush toilets,
significant water savings can be achieved in the household.
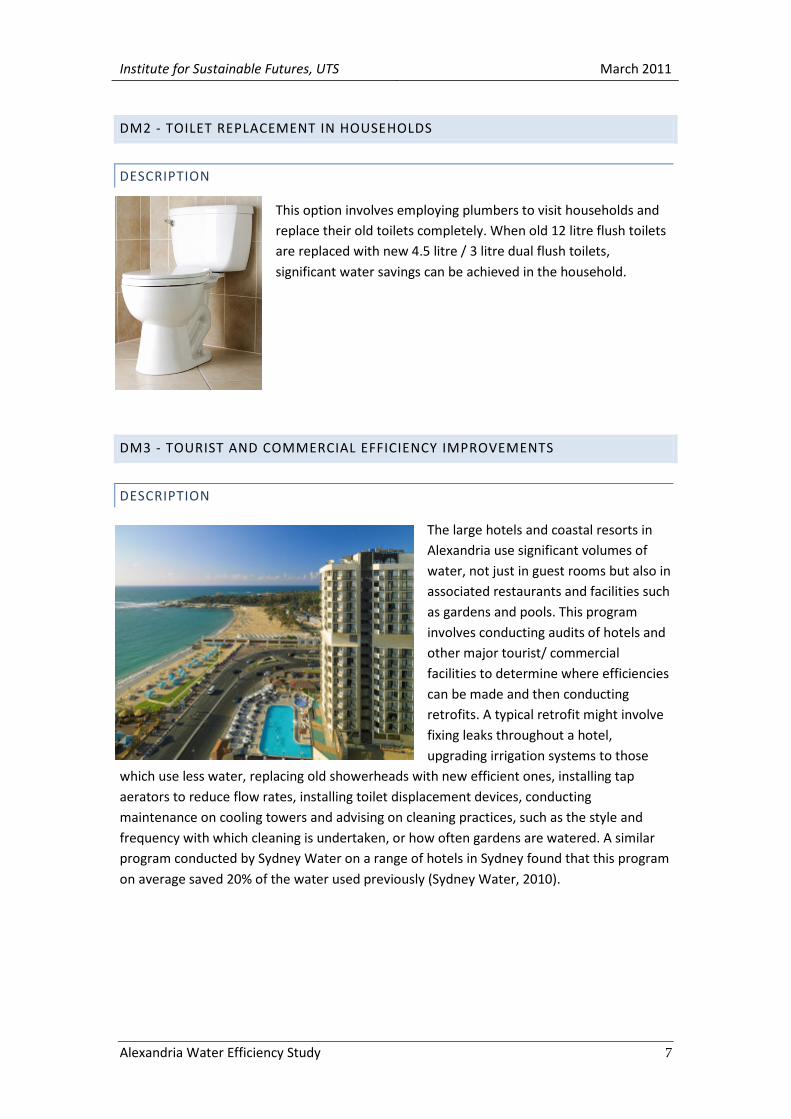
DM3 - TOURIST AND COMMERCIAL EFFICIENCY IMPROVEMENTS
DESCRIPTION
The large hotels and coastal resorts in
Alexandria use significant volumes of
water, not just in guest rooms but also in
associated restaurants and facilities such
as gardens and pools. This program
involves conducting audits of hotels and
other major tourist/ commercial
facilities to determine where efficiencies
can be made and then conducting
retrofits. A typical retrofit might involve
fixing leaks throughout a hotel,
upgrading irrigation systems to those
which use less water, replacing old showerheads with new efficient ones, installing tap
aerators to reduce flow rates, installing toilet displacement devices, conducting
maintenance on cooling towers and advising on cleaning practices, such as the style and
frequency with which cleaning is undertaken, or how often gardens are watered. A similar
program conducted by Sydney Water on a range of hotels in Sydney found that this program
on average saved 20% of the water used previously (Sydney Water, 2010).
Institute for Sustainable Futures, UTS March 2011
Alexandria Water Efficiency Study 8
DM4 - GOVERNMENT BUILDINGS EFFICIENCY IMPROVEMENTS
DESCRIPTION
This option involves carrying out audits and retrofits on government and other institutional
buildings including schools and educational facilities as well as government departments and
offices. Changes conducted as part of the program may include fixing leaks, installing tap
aerators, installing toilet displacement devices to reduce flush volume, conducting
maintenance on cooling towers and modifying cleaning practices to use water more
efficiently. Similar programs carried out in Australia found savings between 10-20% of the
original consumption (Sydney Water, 2010).
DM5 - INDUSTRIAL CUSTOMERS EFFICIENCY IMPROVEMENT
DESCRIPTION
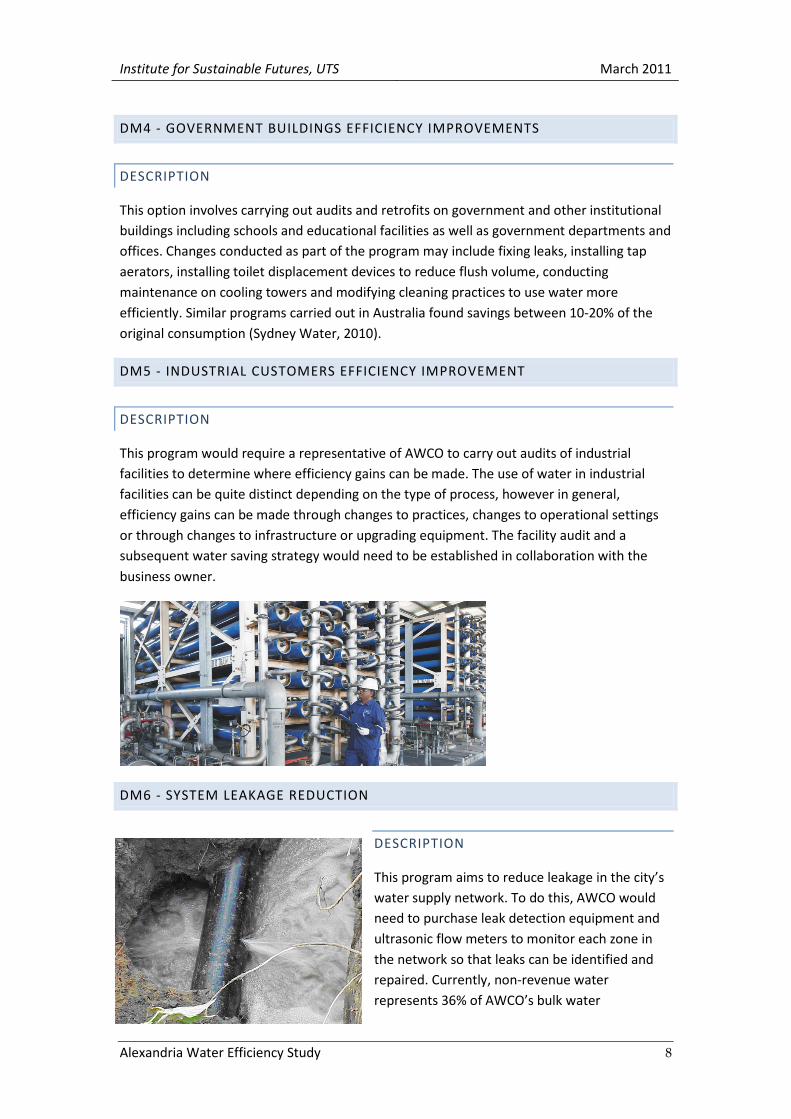
This program would require a representative of AWCO to carry out audits of industrial
facilities to determine where efficiency gains can be made. The use of water in industrial
facilities can be quite distinct depending on the type of process, however in general,
efficiency gains can be made through changes to practices, changes to operational settings
or through changes to infrastructure or upgrading equipment. The facility audit and a
subsequent water saving strategy would need to be established in collaboration with the
business owner.
DM6 - SYSTEM LEAKAGE REDUCTION
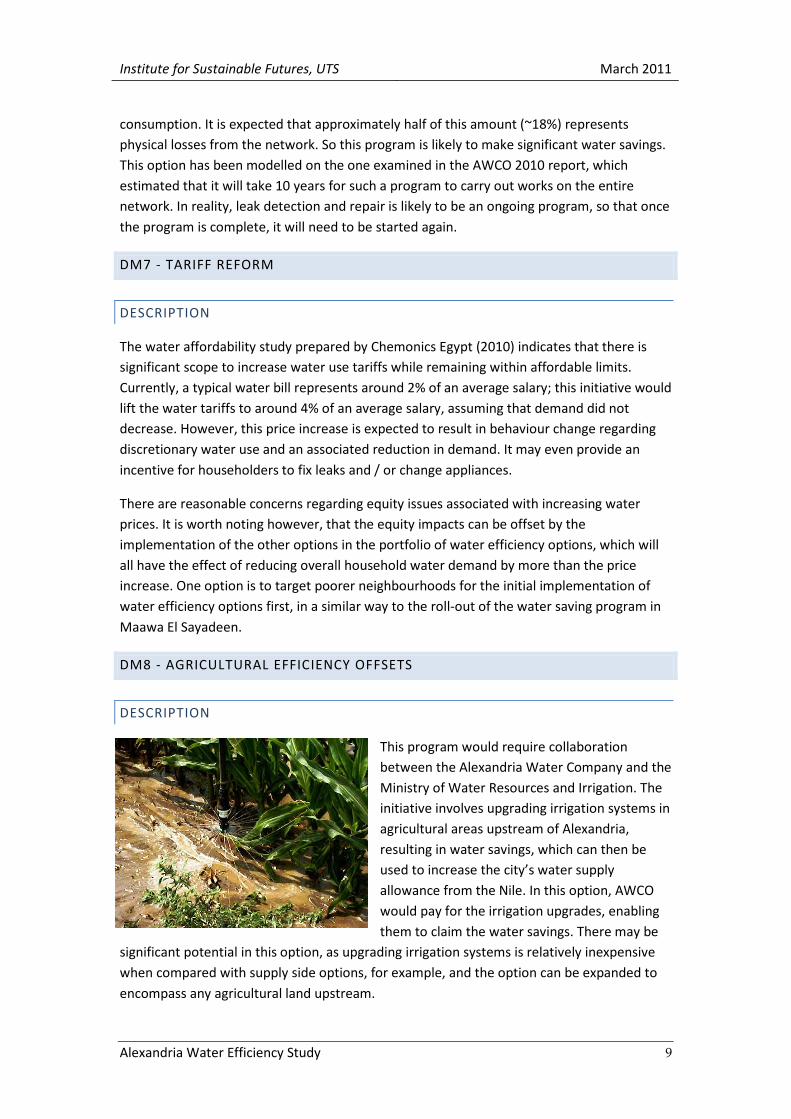
DESCRIPTION
This program aims to reduce leakage in the city’s
water supply network. To do this, AWCO would
need to purchase leak detection equipment and
ultrasonic flow meters to monitor each zone in
the network so that leaks can be identified and
repaired. Currently, non-revenue water
represents 36% of AWCO’s bulk water
Institute for Sustainable Futures, UTS March 2011
Alexandria Water Efficiency Study 9
consumption. It is expected that approximately half of this amount (~18%) represents
physical losses from the network. So this program is likely to make significant water savings.
This option has been modelled on the one examined in the AWCO 2010 report, which
estimated that it will take 10 years for such a program to carry out works on the entire
network. In reality, leak detection and repair is likely to be an ongoing program, so that once
the program is complete, it will need to be started again.
DM7 - TARIFF REFORM
DESCRIPTION
The water affordability study prepared by Chemonics Egypt (2010) indicates that there is
significant scope to increase water use tariffs while remaining within affordable limits.
Currently, a typical water bill represents around 2% of an average salary; this initiative would
lift the water tariffs to around 4% of an average salary, assuming that demand did not
decrease. However, this price increase is expected to result in behaviour change regarding
discretionary water use and an associated reduction in demand. It may even provide an
incentive for householders to fix leaks and / or change appliances.
There are reasonable concerns regarding equity issues associated with increasing water
prices. It is worth noting however, that the equity impacts can be offset by the
implementation of the other options in the portfolio of water efficiency options, which will
all have the effect of reducing overall household water demand by more than the price
increase. One option is to target poorer neighbourhoods for the initial implementation of
water efficiency options first, in a similar way to the roll-out of the water saving program in
Maawa El Sayadeen.
DM8 - AGRICULTURAL EFFICIENCY OFFSETS
DESCRIPTION
This program would require collaboration
between the Alexandria Water Company and the
Ministry of Water Resources and Irrigation. The
initiative involves upgrading irrigation systems in
agricultural areas upstream of Alexandria,
resulting in water savings, which can then be
used to increase the city’s water supply
allowance from the Nile. In this option, AWCO
would pay for the irrigation upgrades, enabling
them to claim the water savings. There may be
significant potential in this option, as upgrading irrigation systems is relatively inexpensive
when compared with supply side options, for example, and the option can be expanded to
encompass any agricultural land upstream.
Institute for Sustainable Futures, UTS March 2011
Alexandria Water Efficiency Study 10
DM9 - APPLIANCE EFFICIENCY REGULATION
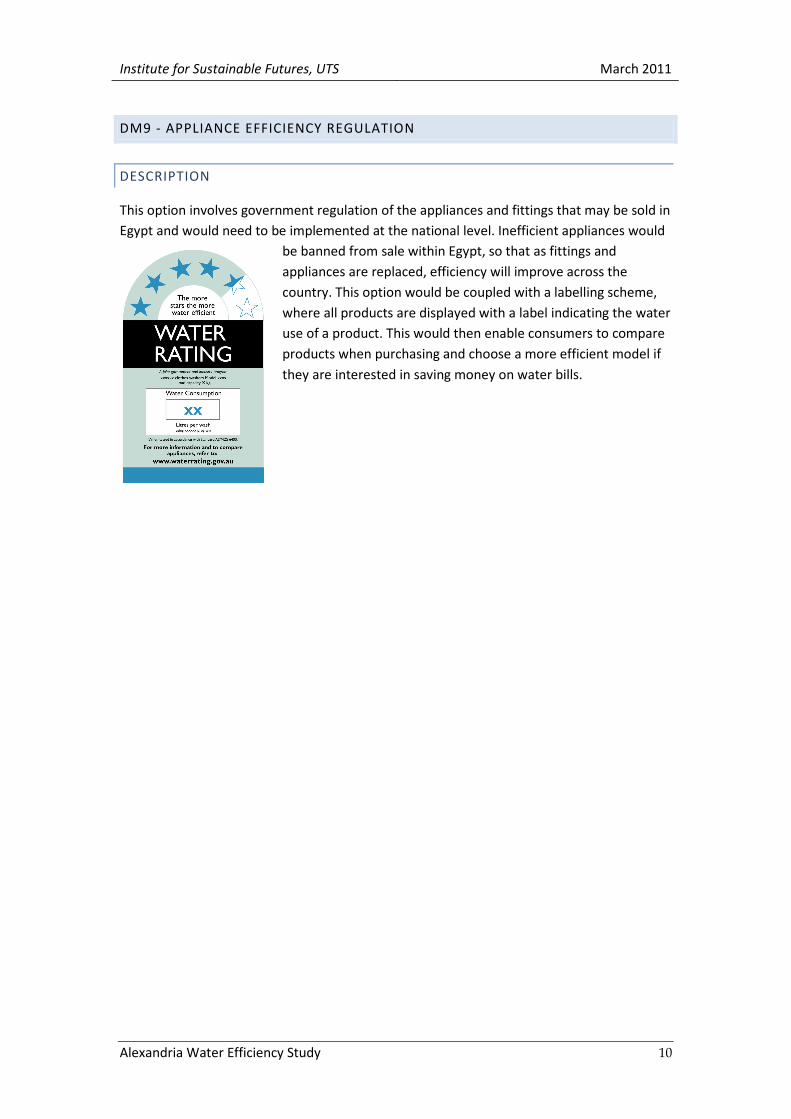
DESCRIPTION
This option involves government regulation of the appliances and fittings that may be sold in
Egypt and would need to be implemented at the national level. Inefficient appliances would
be banned from sale within Egypt, so that as fittings and
appliances are replaced, efficiency will improve across the
country. This option would be coupled with a labelling scheme,
where all products are displayed with a label indicating the water
use of a product. This would then enable consumers to compare
products when purchasing and choose a more efficient model if
they are interested in saving money on water bills.
Institute for Sustainable Futures, UTS March 2011
Alexandria Water Efficiency Study 11
5 SUPPLY OPTIONS
S1 – WASTEWATER RECYCLED FROM WEST WWTP AND EAST WWTP FOR
INDUSTRIAL USE
DESCRIPTION OF OPTION
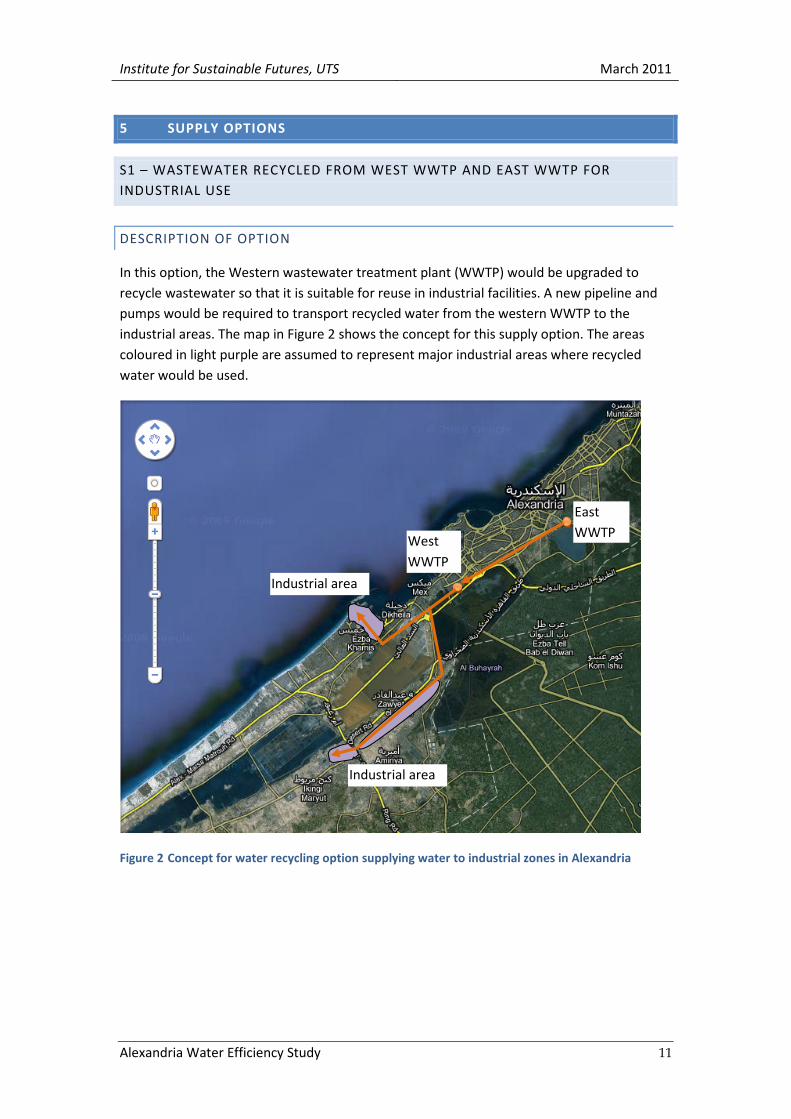
In this option, the Western wastewater treatment plant (WWTP) would be upgraded to
recycle wastewater so that it is suitable for reuse in industrial facilities. A new pipeline and
pumps would be required to transport recycled water from the western WWTP to the
industrial areas. The map in Figure 2 shows the concept for this supply option. The areas
coloured in light purple are assumed to represent major industrial areas where recycled
water would be used.
Figure 2 Concept for water recycling option supplying water to industrial zones in Alexandria
East
WWTP West
WWTP
Industrial area
Industrial area
Institute for Sustainable Futures, UTS March 2011
Alexandria Water Efficiency Study 12
S2 - WASTEWATER RECYCLED FROM WEST WWTP AND EAST WWTP FOR
AGRICULTURAL USE
DESCRIPTION OF OPTION
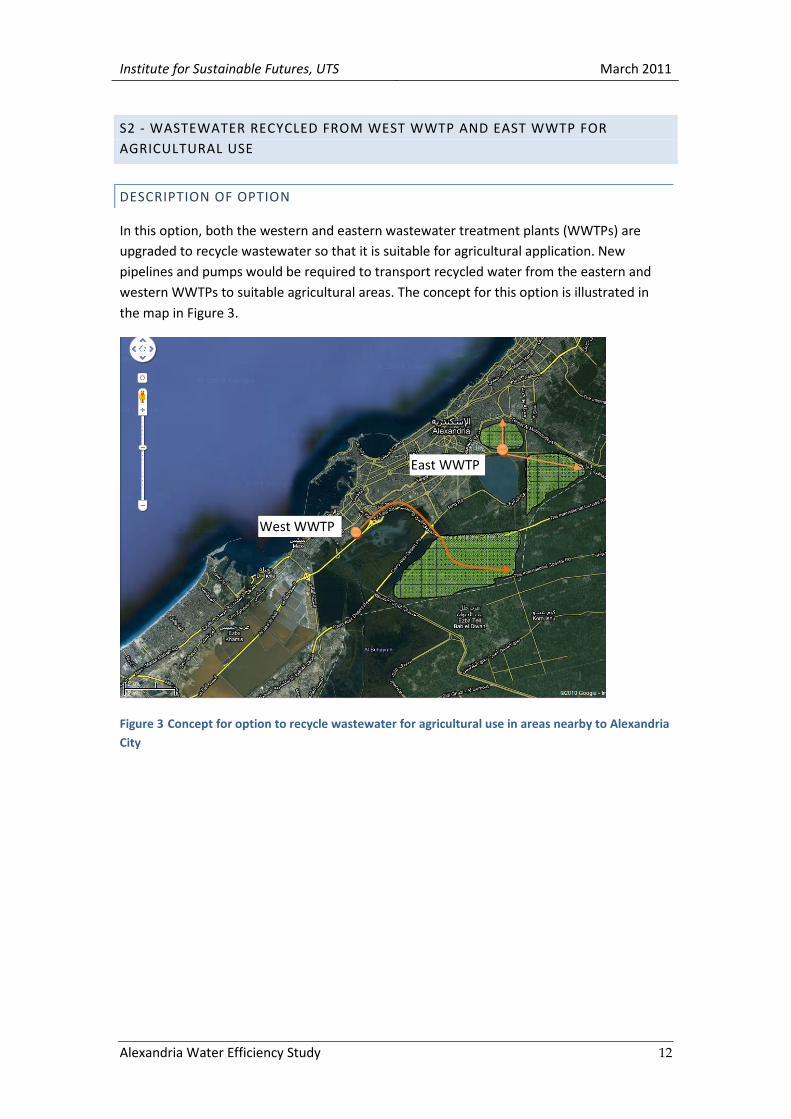
In this option, both the western and eastern wastewater treatment plants (WWTPs) are
upgraded to recycle wastewater so that it is suitable for agricultural application. New
pipelines and pumps would be required to transport recycled water from the eastern and
western WWTPs to suitable agricultural areas. The concept for this option is illustrated in
the map in Figure 3.
Figure 3 Concept for option to recycle wastewater for agricultural use in areas nearby to Alexandria
City
East WWTP
West WWTP
Institute for Sustainable Futures, UTS March 2011
Alexandria Water Efficiency Study 13
S3 – DESALINATION OF AGRICULTURAL DRAINAGE WATER FOR AGRICULTURAL
USE
DESCRIPTION OF OPTION
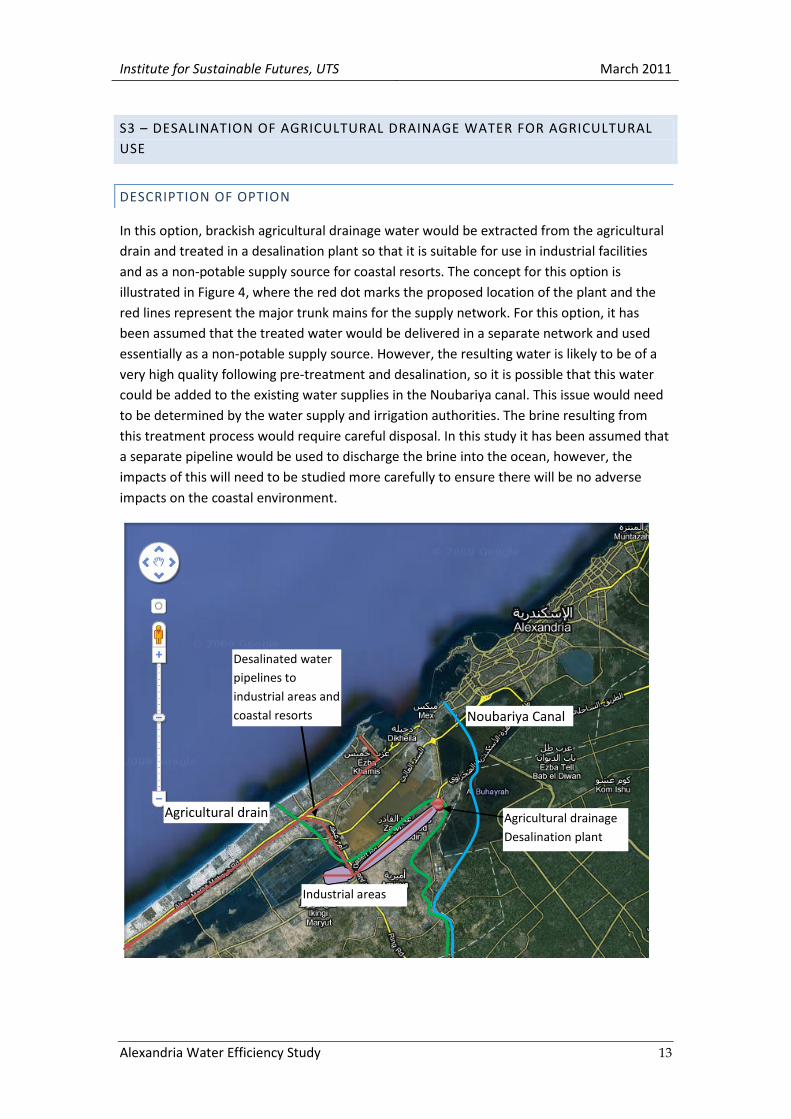
In this option, brackish agricultural drainage water would be extracted from the agricultural
drain and treated in a desalination plant so that it is suitable for use in industrial facilities
and as a non-potable supply source for coastal resorts. The concept for this option is
illustrated in Figure 4, where the red dot marks the proposed location of the plant and the
red lines represent the major trunk mains for the supply network. For this option, it has
been assumed that the treated water would be delivered in a separate network and used
essentially as a non-potable supply source. However, the resulting water is likely to be of a
very high quality following pre-treatment and desalination, so it is possible that this water
could be added to the existing water supplies in the Noubariya canal. This issue would need
to be determined by the water supply and irrigation authorities. The brine resulting from
this treatment process would require careful disposal. In this study it has been assumed that
a separate pipeline would be used to discharge the brine into the ocean, however, the
impacts of this will need to be studied more carefully to ensure there will be no adverse
impacts on the coastal environment.
Industrial areas
Agricultural drainage
Desalination plant
Agricultural drain
Noubariya Canal
Desalinated water
pipelines to
industrial areas and
coastal resorts
Institute for Sustainable Futures, UTS March 2011
Alexandria Water Efficiency Study 14
Figure 4 Concept for supply option S3 where brackish agricultural drainage water is desalinated for
use in industrial areas and coastal resorts (note: the pipeline continues along the coastline to same
extent as option S5)
S4 - GROUNDWATER FOR IRRIGATION OF CITY PARKS
DESCRIPTION OF OPTION
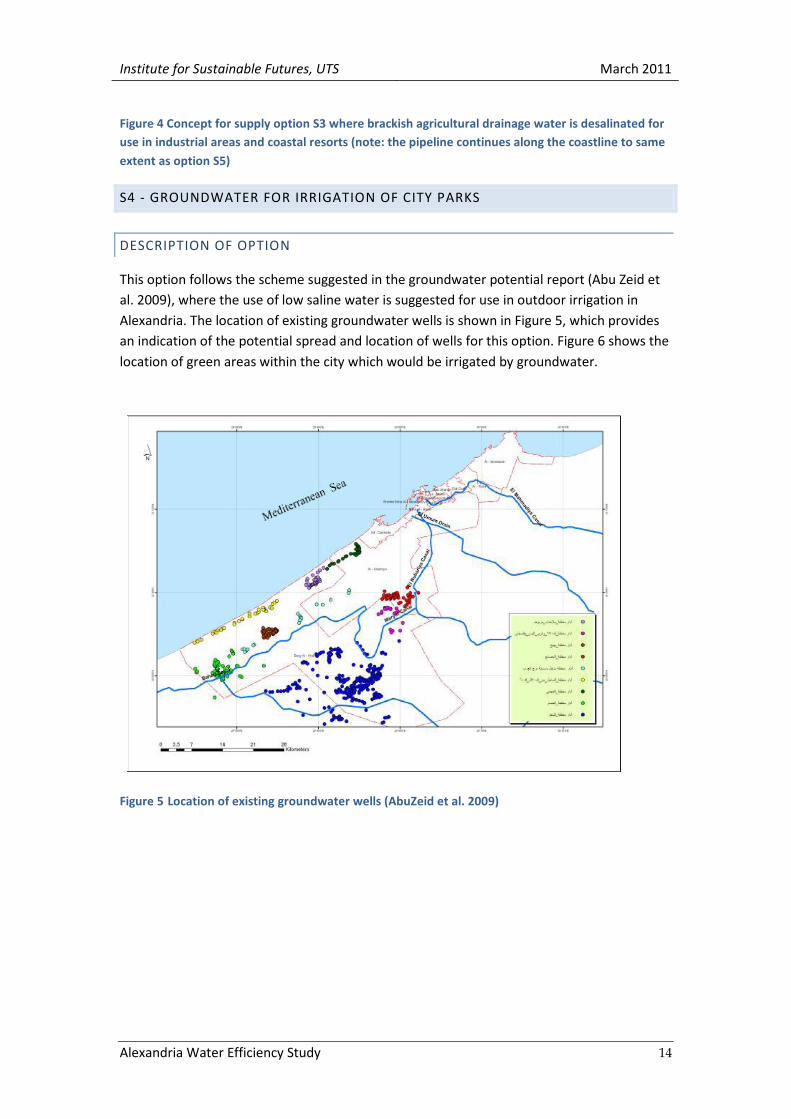
This option follows the scheme suggested in the groundwater potential report (Abu Zeid et
al. 2009), where the use of low saline water is suggested for use in outdoor irrigation in
Alexandria. The location of existing groundwater wells is shown in Figure 5, which provides
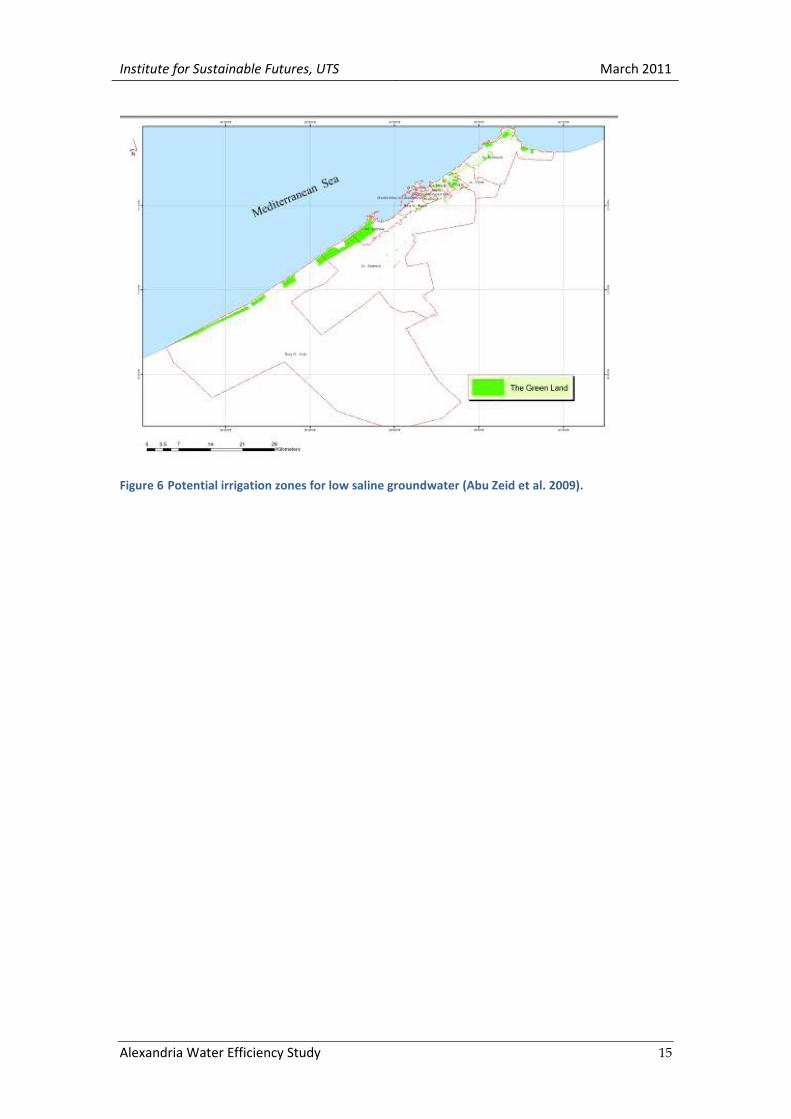
an indication of the potential spread and location of wells for this option. Figure 6 shows the
location of green areas within the city which would be irrigated by groundwater.
Figure 5 Location of existing groundwater wells (AbuZeid et al. 2009)
Institute for Sustainable Futures, UTS March 2011
Alexandria Water Efficiency Study 15
Figure 6 Potential irrigation zones for low saline groundwater (Abu Zeid et al. 2009).
Institute for Sustainable Futures, UTS March 2011
Alexandria Water Efficiency Study 16
S5 – DESALINATION OF SEAWATER FOR REUSE
DESCRIPTION OF OPTION
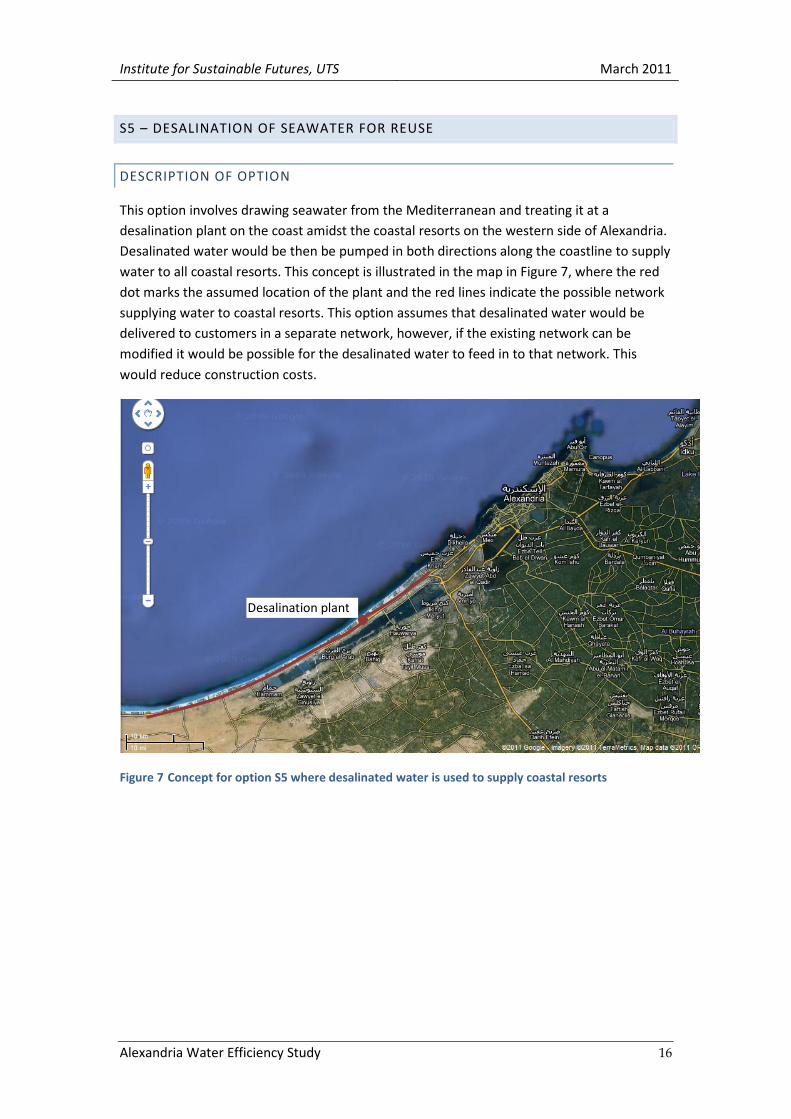
This option involves drawing seawater from the Mediterranean and treating it at a
desalination plant on the coast amidst the coastal resorts on the western side of Alexandria.
Desalinated water would be then be pumped in both directions along the coastline to supply
water to all coastal resorts. This concept is illustrated in the map in Figure 7, where the red
dot marks the assumed location of the plant and the red lines indicate the possible network
supplying water to coastal resorts. This option assumes that desalinated water would be
delivered to customers in a separate network, however, if the existing network can be
modified it would be possible for the desalinated water to feed in to that network. This
would reduce construction costs.
Figure 7 Concept for option S5 where desalinated water is used to supply coastal resorts
Desalination plant
Institute for Sustainable Futures, UTS March 2011
Alexandria Water Efficiency Study 17
S6 – LOCAL WASTEWATER REUSE FOR NEW HOUSING DEVELOPMENTS
DESCRIPTION OF OPTION
This is a water supply and wastewater program that would involve all new housing areas. In
this program, government regulations would require housing developers to install small
scale pressurized sewer systems with local treatment to a recycled water standard. The
recycled water would then be pumped back to households for non-potable use, such as
toilet flushing, gardens, dust suppression and car washing. Houses would require dual
reticulation to enable recycled water to be plumbed into toilets and outdoor taps. The
benefit of a localized system is that both wastewater and the recycled water supply do not
need to be pumped large distances, as the sewer is pressurised, pipes are smaller and can be
buried in shallow trenches.
S7 – LOCAL WASTEWATER REUSE FOR NEW HOUSING DEVELOPMENTS WITH
NUTRIENT RECOVERY
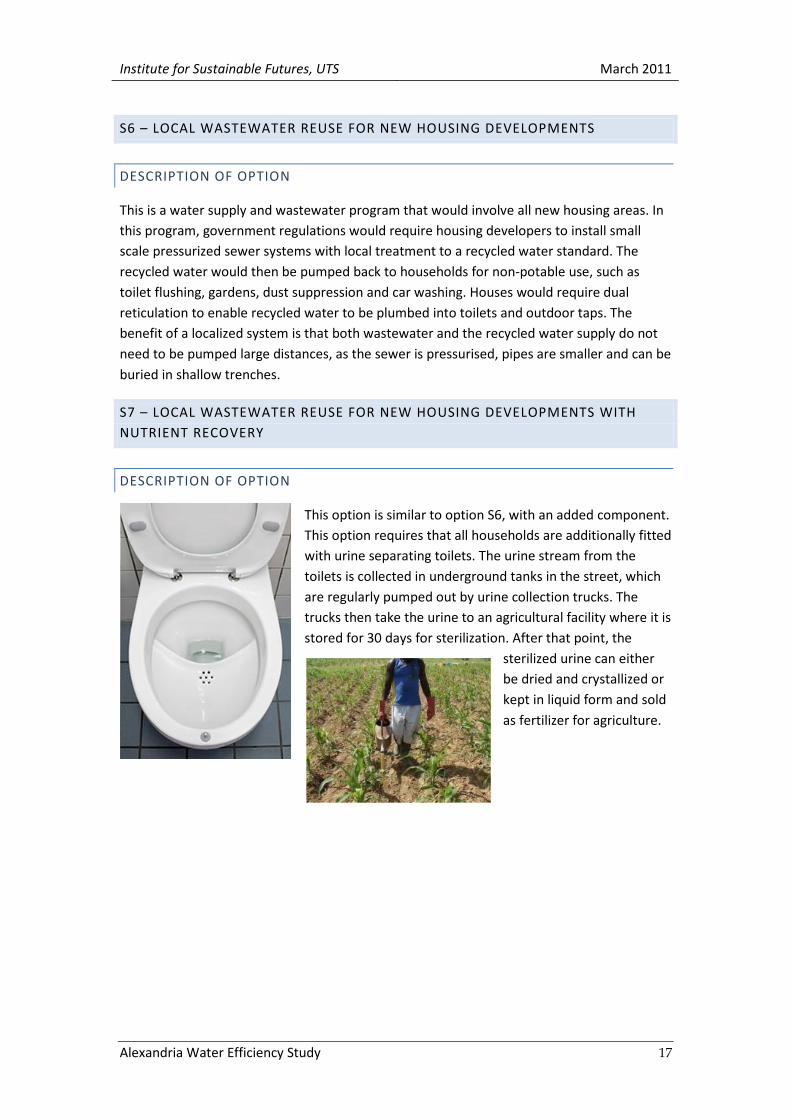
DESCRIPTION OF OPTION
This option is similar to option S6, with an added component.
This option requires that all households are additionally fitted
with urine separating toilets. The urine stream from the
toilets is collected in underground tanks in the street, which
are regularly pumped out by urine collection trucks. The
trucks then take the urine to an agricultural facility where it is
stored for 30 days for sterilization. After that point, the
sterilized urine can either
be dried and crystallized or
kept in liquid form and sold
as fertilizer for agriculture.
Institute for Sustainable Futures, UTS March 2011
Alexandria Water Efficiency Study 18
6 MODELLING THE SUPPLY-DEMAND BALANCE
An integrated supply-demand planning model was initially developed for Alexandria during
the SWITCH training workshop in 2008. This model has been modified to incorporate a range
of new information, including; a series of historical consumption data disaggregated by
sector, new consumption projections, end use data collated through the household end use
survey, new options and costing for options. The model has also been modified to make the
model more user friendly with easily identifiable assumptions and inputs. The intention is
that the model can now be used by Alexandria Water Company and any other relevant
authorities to assist with water planning.
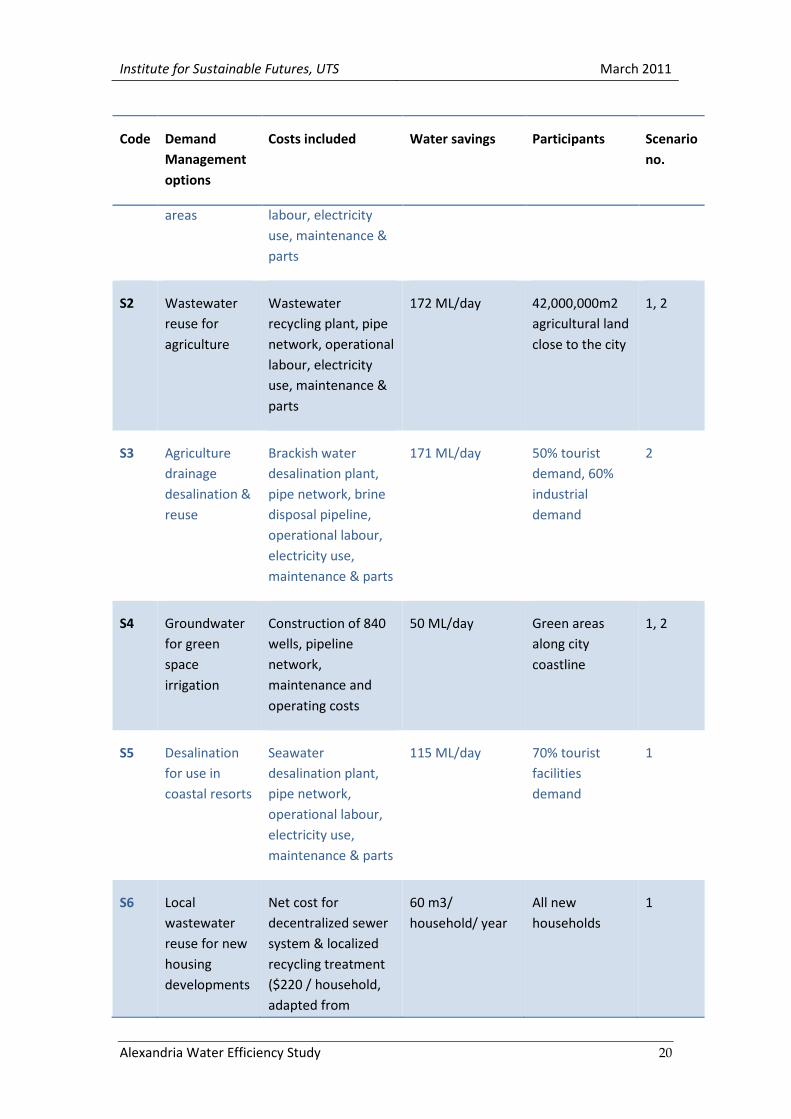
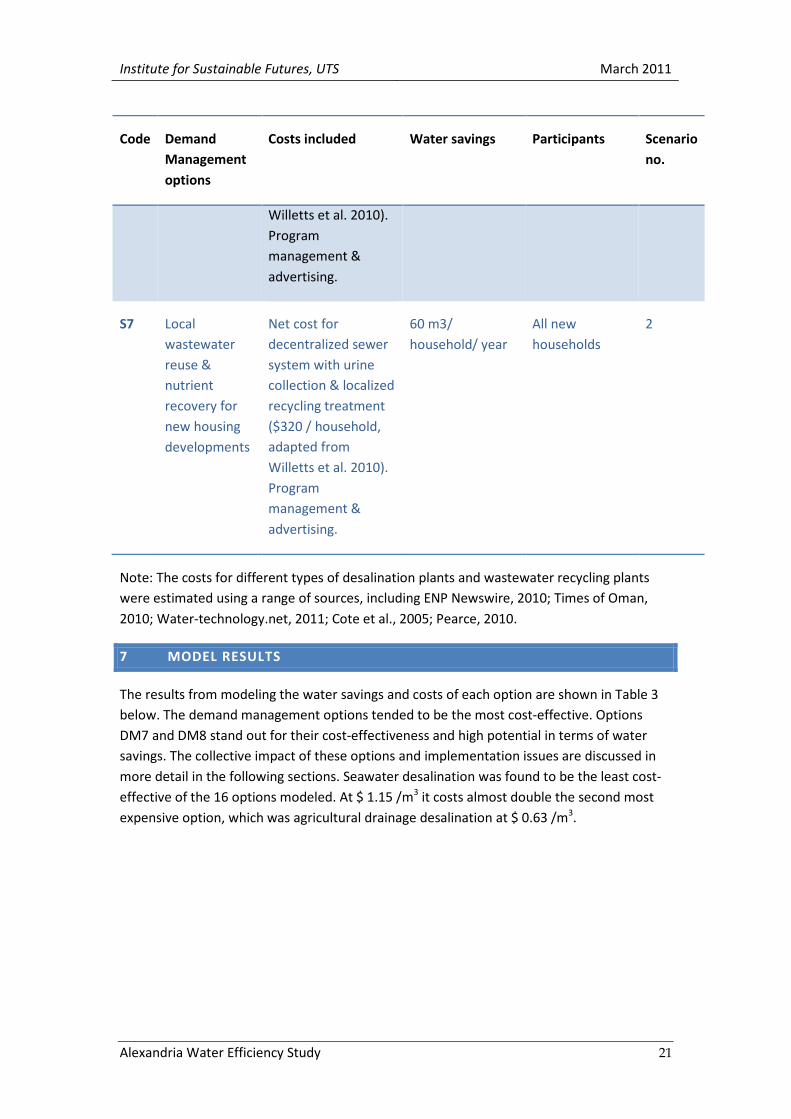
OPTION SUMMARY AND ASSUMPTIONS
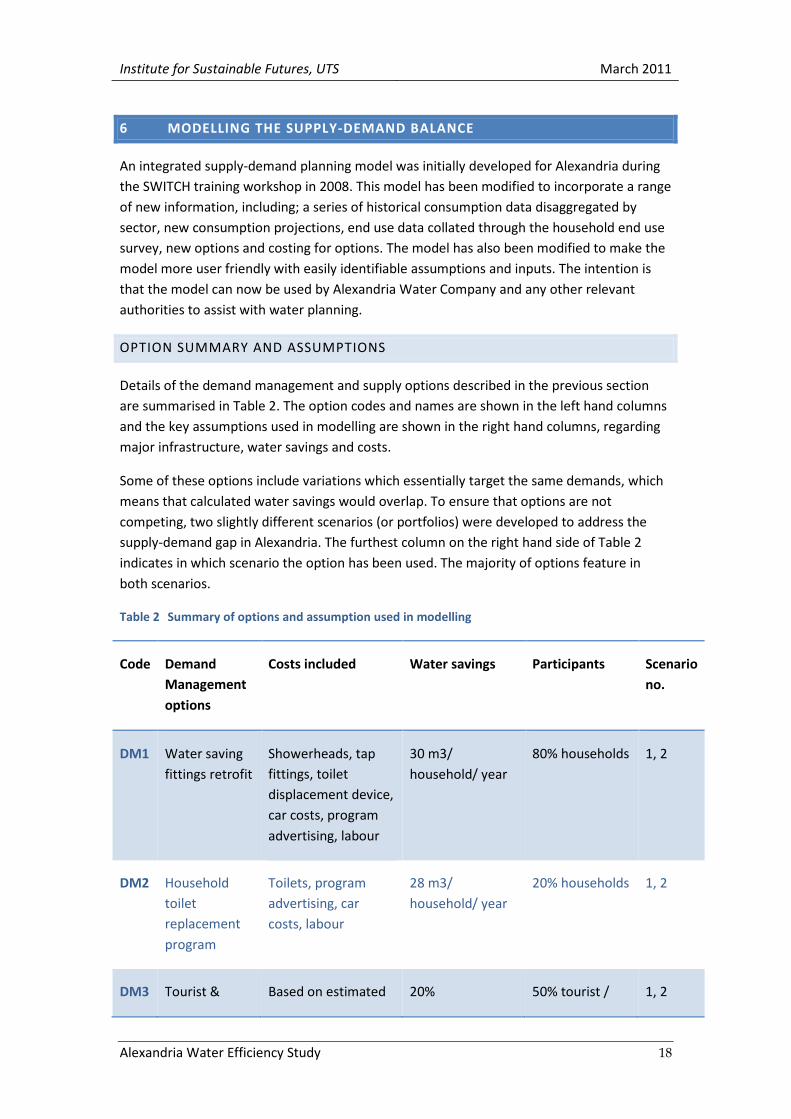
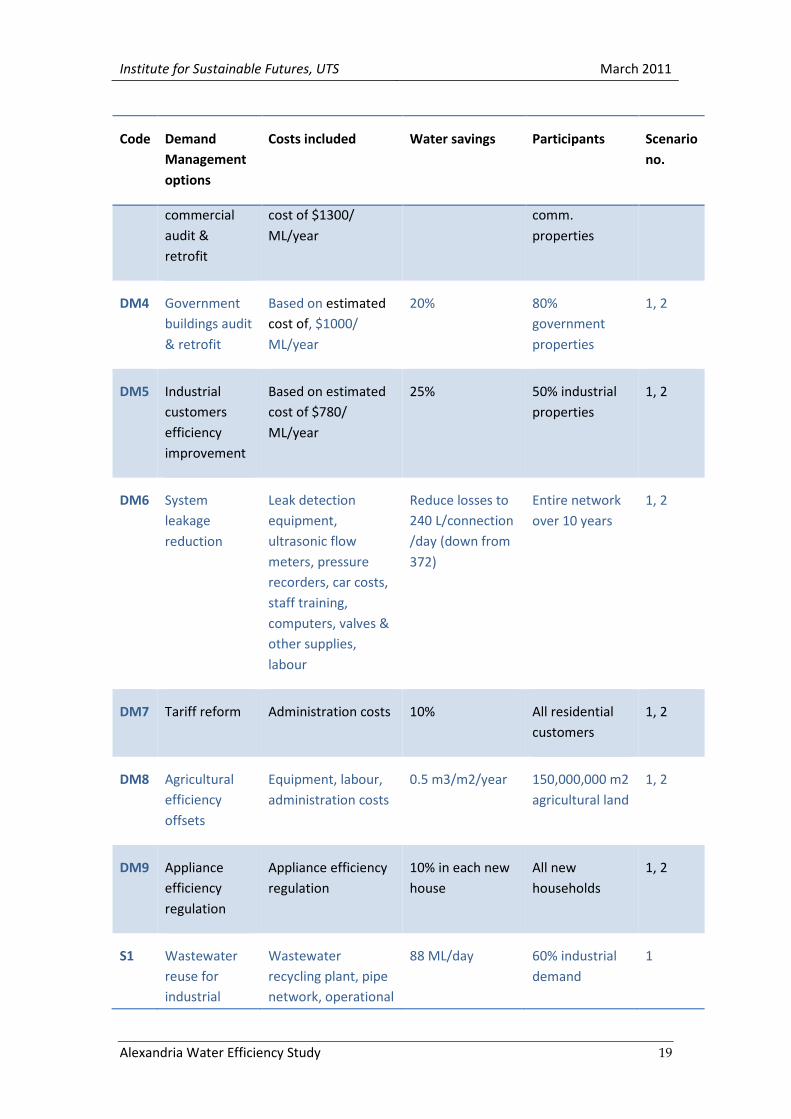
Details of the demand management and supply options described in the previous section
are summarised in Table 2. The option codes and names are shown in the left hand columns
and the key assumptions used in modelling are shown in the right hand columns, regarding
major infrastructure, water savings and costs.
Some of these options include variations which essentially target the same demands, which
means that calculated water savings would overlap. To ensure that options are not
competing, two slightly different scenarios (or portfolios) were developed to address the
supply-demand gap in Alexandria. The furthest column on the right hand side of Table 2
indicates in which scenario the option has been used. The majority of options feature in
both scenarios.
Table 2 Summary of options and assumption used in modelling
Code Demand
Management
options
Costs included Water savings Participants Scenario
no.
DM1 Water saving
fittings retrofit
Showerheads, tap
fittings, toilet
displacement device,
car costs, program
advertising, labour
30 m3/
household/ year
80% households 1, 2
DM2 Household
toilet
replacement
program
Toilets, program
advertising, car
costs, labour
28 m3/
household/ year
20% households 1, 2
DM3 Tourist & Based on estimated 20% 50% tourist / 1, 2
Institute for Sustainable Futures, UTS March 2011
Alexandria Water Efficiency Study 19
Code Demand
Management
options
Costs included Water savings Participants Scenario
no.
commercial
audit &
retrofit
cost of $1300/
ML/year
comm.
properties
DM4 Government
buildings audit
& retrofit
Based on estimated
cost of, $1000/
ML/year
20% 80%
government
properties
1, 2
DM5 Industrial
customers
efficiency
improvement
Based on estimated
cost of $780/
ML/year
25% 50% industrial
properties
1, 2
DM6 System
leakage
reduction
Leak detection
equipment,
ultrasonic flow
meters, pressure
recorders, car costs,
staff training,
computers, valves &
other supplies,
labour
Reduce losses to
240 L/connection
/day (down from
372)
Entire network
over 10 years
1, 2
DM7 Tariff reform Administration costs 10% All residential
customers
1, 2
DM8 Agricultural
efficiency
offsets
Equipment, labour,
administration costs
0.5 m3/m2/year 150,000,000 m2
agricultural land
1, 2
DM9 Appliance
efficiency
regulation
Appliance efficiency
regulation
10% in each new
house
All new
households
1, 2
S1 Wastewater
reuse for
industrial
Wastewater
recycling plant, pipe
network, operational
88 ML/day 60% industrial
demand
1
Institute for Sustainable Futures, UTS March 2011
Alexandria Water Efficiency Study 20
Code Demand
Management
options
Costs included Water savings Participants Scenario
no.
areas labour, electricity
use, maintenance &
parts
S2 Wastewater
reuse for
agriculture
Wastewater
recycling plant, pipe
network, operational
labour, electricity
use, maintenance &
parts
172 ML/day 42,000,000m2
agricultural land
close to the city
1, 2
S3 Agriculture
drainage
desalination &
reuse
Brackish water
desalination plant,
pipe network, brine
disposal pipeline,
operational labour,
electricity use,
maintenance & parts
171 ML/day 50% tourist
demand, 60%
industrial
demand
2
S4 Groundwater
for green
space
irrigation
Construction of 840
wells, pipeline
network,
maintenance and
operating costs
50 ML/day Green areas
along city
coastline
1, 2
S5 Desalination
for use in
coastal resorts
Seawater
desalination plant,
pipe network,
operational labour,
electricity use,
maintenance & parts
115 ML/day 70% tourist
facilities
demand
1
S6 Local
wastewater
reuse for new
housing
developments
Net cost for
decentralized sewer
system & localized
recycling treatment
($220 / household,
adapted from
60 m3/
household/ year
All new
households
1
Institute for Sustainable Futures, UTS March 2011
Alexandria Water Efficiency Study 21
Code Demand
Management
options
Costs included Water savings Participants Scenario
no.
Willetts et al. 2010).
Program
management &
advertising.
S7 Local
wastewater
reuse &
nutrient
recovery for
new housing
developments
Net cost for
decentralized sewer
system with urine
collection & localized
recycling treatment
($320 / household,
adapted from
Willetts et al. 2010).
Program
management &
advertising.
60 m3/
household/ year
All new
households
2
Note: The costs for different types of desalination plants and wastewater recycling plants
were estimated using a range of sources, including ENP Newswire, 2010; Times of Oman,
2010; Water-technology.net, 2011; Cote et al., 2005; Pearce, 2010.
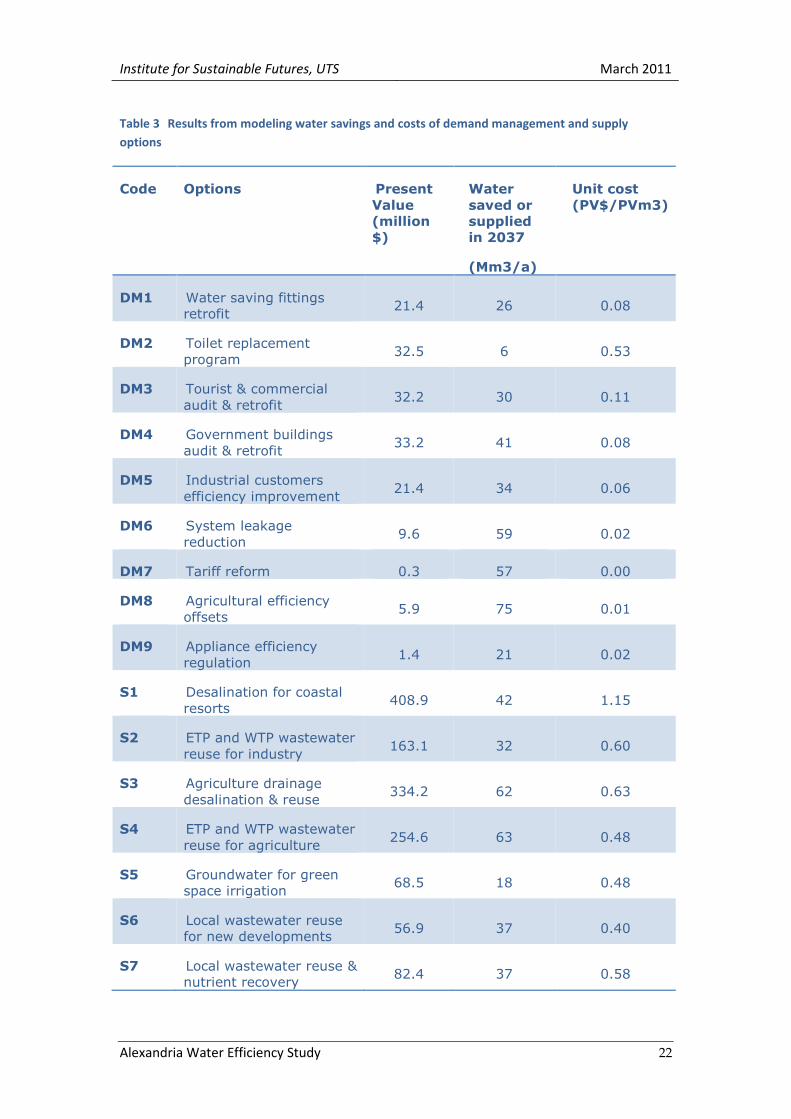
7 MODEL RESULTS
The results from modeling the water savings and costs of each option are shown in Table 3
below. The demand management options tended to be the most cost-effective. Options
DM7 and DM8 stand out for their cost-effectiveness and high potential in terms of water
savings. The collective impact of these options and implementation issues are discussed in
more detail in the following sections. Seawater desalination was found to be the least cost-
effective of the 16 options modeled. At $ 1.15 /m3 it costs almost double the second most
expensive option, which was agricultural drainage desalination at $ 0.63 /m3.
Institute for Sustainable Futures, UTS March 2011
Alexandria Water Efficiency Study 22
Table 3 Results from modeling water savings and costs of demand management and supply
options
Code Options Present
Value
(million
$)
Water
saved or
supplied
in 2037
(Mm3/a)
Unit cost
(PV$/PVm3)
DM1 Water saving fittings
retrofit 21.4 26 0.08
DM2 Toilet replacement
program 32.5 6 0.53
DM3 Tourist & commercial
audit & retrofit 32.2 30 0.11
DM4 Government buildings
audit & retrofit 33.2 41 0.08
DM5 Industrial customers
efficiency improvement 21.4 34 0.06
DM6 System leakage
reduction 9.6 59 0.02
DM7 Tariff reform 0.3 57 0.00
DM8 Agricultural efficiency
offsets 5.9 75 0.01
DM9 Appliance efficiency
regulation 1.4 21 0.02
S1 Desalination for coastal
resorts 408.9 42 1.15
S2 ETP and WTP wastewater
reuse for industry 163.1 32 0.60
S3 Agriculture drainage
desalination & reuse 334.2 62 0.63
S4 ETP and WTP wastewater
reuse for agriculture 254.6 63 0.48
S5 Groundwater for green
space irrigation 68.5 18 0.48
S6 Local wastewater reuse
for new developments 56.9 37 0.40
S7 Local wastewater reuse &
nutrient recovery 82.4 37 0.58
Institute for Sustainable Futures, UTS March 2011
Alexandria Water Efficiency Study 23
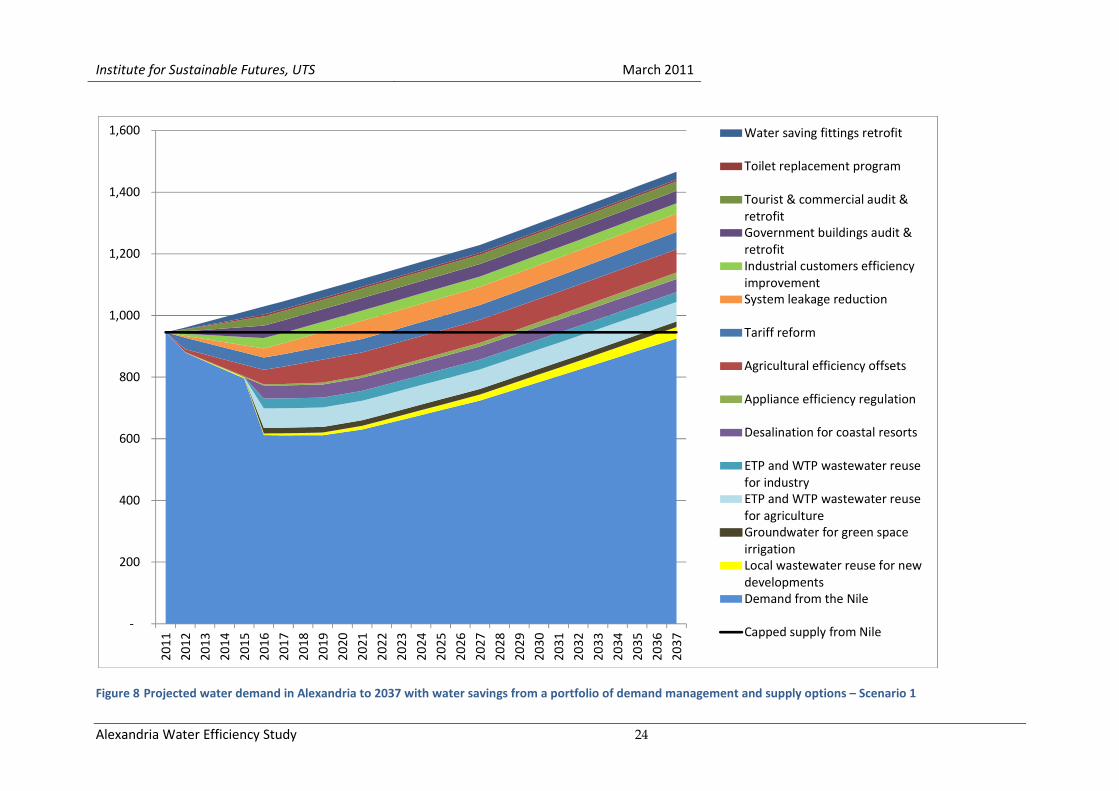
SCENARIO 1
The results from the water savings modeling for scenario 1 are shown in the graph in Figure
8. The top line of the graph shows the projected water demand to 2037, and each coloured
band represents the water savings that could be achieved with each option, together this
graph illustrates the cumulative water savings that can be achieved. The portfolio of options
combined in scenario 1 would provide sufficient water savings to close the supply-demand
gap in 2037. This would mean that the allocation of water from the Nile could officially
remain the same as in 2011, except for agricultural efficiency offsets, which would be gained
through water company sponsored efficiency in surrounding agricultural areas.
The key difference between scenario 1 and scenario 2 is that, for scenario 1 seawater
desalination is used to supply water to coastal resorts, and wastewater is recycled for
industrial areas. Total water savings of 541 million m3/year are projected for 2037 with
scenario 1.
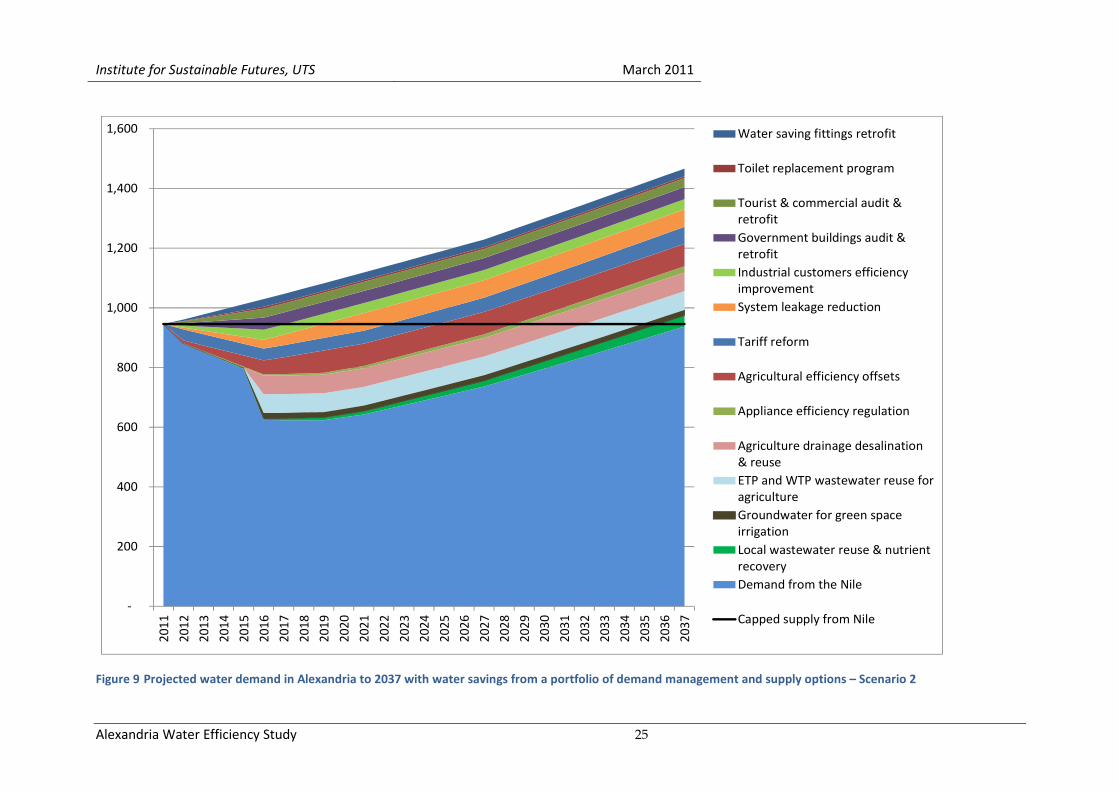
SCENARIO 2
The graph in Figure 9 displays the results from the water savings modeling for scenario 2.
The combination of options in scenario 2 would also provide sufficient water savings to close
the supply-demand gap in 2037. Total water savings of 529 million m3/year are projected
for 2037 with scenario 2.
The key point of difference in scenario 2 is that the desalination of brackish agricultural
water is undertaken to supply non-potable water to coastal resorts and industrial areas.
Institute for Sustainable Futures, UTS March 2011
Alexandria Water Efficiency Study 24
Figure 8 Projected water demand in Alexandria to 2037 with water savings from a portfolio of demand management and supply options – Scenario 1
-
200
400
600
800
1,000
1,200
1,400
1,600
20
11
20
12
20
13
20
14
20
15
20
16
20
17
20
18
20
19
20
20
20
21
20
22
20
23
20
24
20
25
20
26
20
27
20
28
20
29
20
30
20
31
20
32
20
33
20
34
20
35
20
36
20
37
Water saving fittings retrofit
Toilet replacement program
Tourist & commercial audit &
retrofit
Government buildings audit &
retrofit
Industrial customers efficiency
improvement
System leakage reduction
Tariff reform
Agricultural efficiency offsets
Appliance efficiency regulation
Desalination for coastal resorts
ETP and WTP wastewater reuse
for industry
ETP and WTP wastewater reuse
for agriculture
Groundwater for green space
irrigation
Local wastewater reuse for new
developments
Demand from the Nile
Capped supply from Nile
Institute for Sustainable Futures, UTS March 2011
Alexandria Water Efficiency Study 25
Figure 9 Projected water demand in Alexandria to 2037 with water savings from a portfolio of demand management and supply options – Scenario 2
-
200
400
600
800
1,000
1,200
1,400
1,600
20
11
20
12
20
13
20
14
20
15
20
16
20
17
20
18
20
19
20
20
20
21
20
22
20
23
20
24
20
25
20
26
20
27
20
28
20
29
20
30
20
31
20
32
20
33
20
34
20
35
20
36
20
37
Water saving fittings retrofit
Toilet replacement program
Tourist & commercial audit &
retrofit
Government buildings audit &
retrofit
Industrial customers efficiency
improvement
System leakage reduction
Tariff reform
Agricultural efficiency offsets
Appliance efficiency regulation
Agriculture drainage desalination
& reuse
ETP and WTP wastewater reuse for
agriculture
Groundwater for green space
irrigation
Local wastewater reuse & nutrient
recovery
Demand from the Nile
Capped supply from Nile
Institute for Sustainable Futures, UTS March 2011
Alexandria Water Efficiency Study 26
8 BUSINESS CASE FOR OPTIONS – COSTING ANALYSIS
In this section, the results from the cost effectiveness analysis are illustrated to show the
relative water savings and costs for each option.
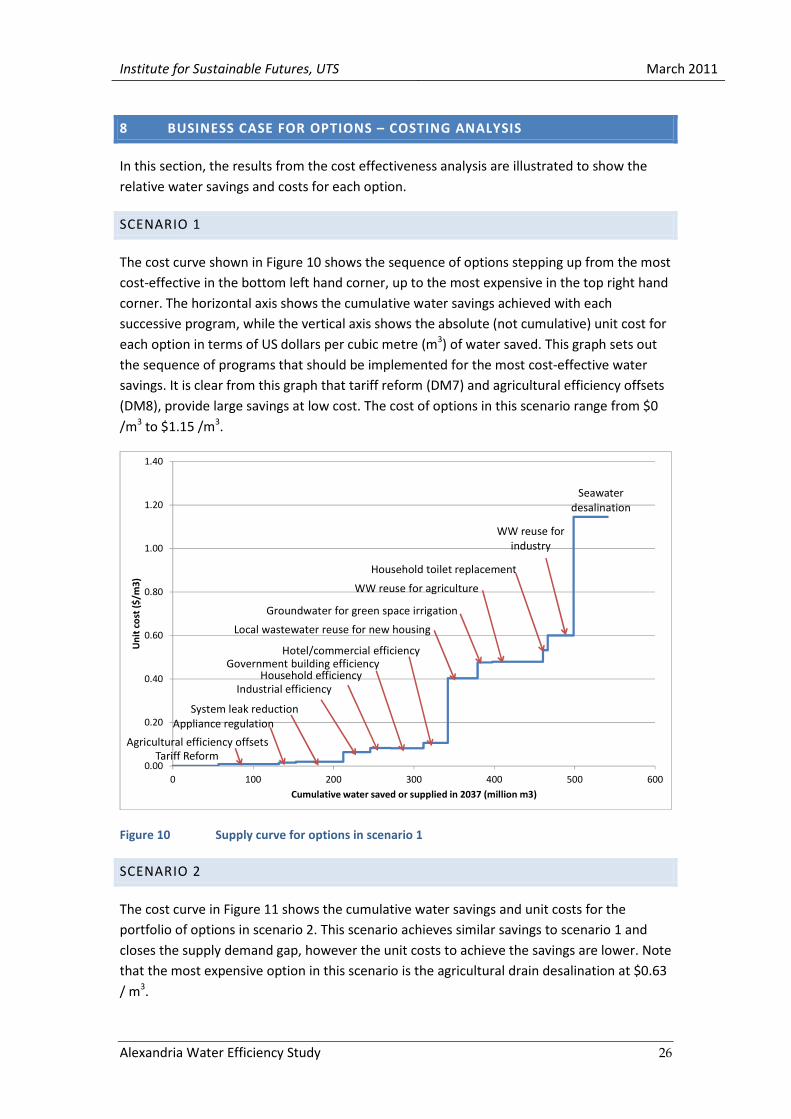
SCENARIO 1
The cost curve shown in Figure 10 shows the sequence of options stepping up from the most
cost-effective in the bottom left hand corner, up to the most expensive in the top right hand
corner. The horizontal axis shows the cumulative water savings achieved with each
successive program, while the vertical axis shows the absolute (not cumulative) unit cost for
each option in terms of US dollars per cubic metre (m3) of water saved. This graph sets out
the sequence of programs that should be implemented for the most cost-effective water
savings. It is clear from this graph that tariff reform (DM7) and agricultural efficiency offsets
(DM8), provide large savings at low cost. The cost of options in this scenario range from $0
/m3 to $1.15 /m3.
Figure 10 Supply curve for options in scenario 1
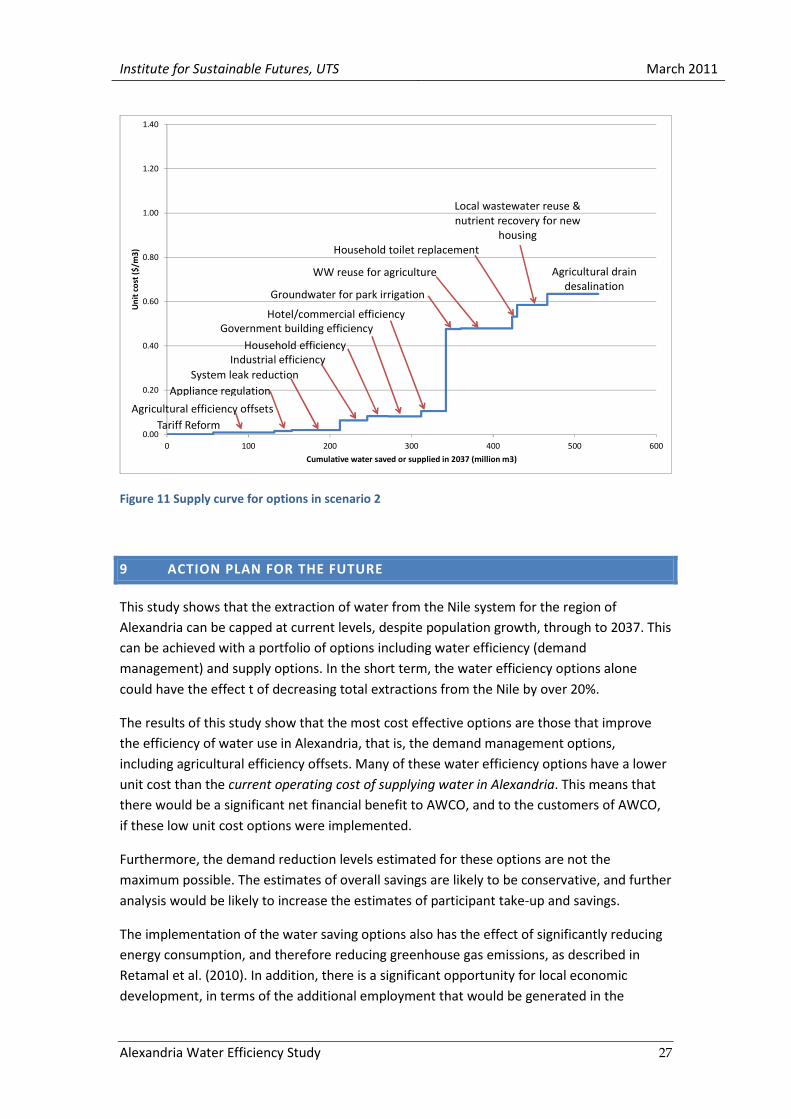
SCENARIO 2
The cost curve in Figure 11 shows the cumulative water savings and unit costs for the
portfolio of options in scenario 2. This scenario achieves similar savings to scenario 1 and
closes the supply demand gap, however the unit costs to achieve the savings are lower. Note
that the most expensive option in this scenario is the agricultural drain desalination at $0.63
/ m3.
Tariff Reform
Industrial efficiencyHousehold efficiency
WW reuse for
industry
Seawater
desalination
0.00
0.20
0.40
0.60
0.80
1.00
1.20
1.40
0 100 200 300 400 500 600
Un
it c
ost
($
/m3
)
Cumulative water saved or supplied in 2037 (million m3)
Agricultural efficiency offsets
Appliance regulation
WW reuse for agriculture
Household toilet replacement
Local wastewater reuse for new housing
System leak reduction
Government building efficiencyHotel/commercial efficiency
Groundwater for green space irrigation
Institute for Sustainable Futures, UTS March 2011
Alexandria Water Efficiency Study 27
Figure 11 Supply curve for options in scenario 2
9 ACTION PLAN FOR THE FUTURE
This study shows that the extraction of water from the Nile system for the region of
Alexandria can be capped at current levels, despite population growth, through to 2037. This
can be achieved with a portfolio of options including water efficiency (demand
management) and supply options. In the short term, the water efficiency options alone
could have the effect t of decreasing total extractions from the Nile by over 20%.
The results of this study show that the most cost effective options are those that improve
the efficiency of water use in Alexandria, that is, the demand management options,
including agricultural efficiency offsets. Many of these water efficiency options have a lower
unit cost than the current operating cost of supplying water in Alexandria. This means that
there would be a significant net financial benefit to AWCO, and to the customers of AWCO,
if these low unit cost options were implemented.
Furthermore, the demand reduction levels estimated for these options are not the
maximum possible. The estimates of overall savings are likely to be conservative, and further
analysis would be likely to increase the estimates of participant take-up and savings.
The implementation of the water saving options also has the effect of significantly reducing
energy consumption, and therefore reducing greenhouse gas emissions, as described in
Retamal et al. (2010). In addition, there is a significant opportunity for local economic
development, in terms of the additional employment that would be generated in the
Tariff Reform
Industrial efficiency
Household efficiency
0.00
0.20
0.40
0.60
0.80
1.00
1.20
1.40
0 100 200 300 400 500 600
Un
it c
ost
($
/m3
)
Cumulative water saved or supplied in 2037 (million m3)
Agricultural efficiency offsets
Appliance regulation
WW reuse for agriculture
Household toilet replacement
Local wastewater reuse &
nutrient recovery for new
housing
Agricultural drain
desalination
System leak reduction
Government building efficiency
Hotel/commercial efficiency
Groundwater for park irrigation
Institute for Sustainable Futures, UTS March 2011
Alexandria Water Efficiency Study 28
implementation of these options, and also the potential for local manufacture of water
saving fittings and fixtures.
RECOMMENDATIONS
The authors make the following recommendations based on the results of this study.
1. That this analysis and results be used as a business case for significant investment in
the water efficiency (demand management) options identified here, funded directly
by AWCO, the Egypt Holding Company and supplemented by multi-lateral finance
agencies.
2. That the results be shared with other water utilities and water resource agencies in
Egypt, with a view to identifying opportunities to share resources and expertise in
the design and implementation of options.
3. That further analysis of the potential for agricultural water use efficiency and
offsets, and the implementation pathways for this option be investigated.
4. That discussions at the national level be expedited to ensure the implementation of
a national scheme of water efficiency labelling and standards for appliances and
fixtures, including toilets, showers, taps, washing machines, dishwashers, cooling
towers, urinals and irrigation equipment.
5. That pricing reform be considered including raising water prices in line with the
recommendations of the Chemonics report, in association with a program of
household water efficiency investment targeted at low socio-economic areas as a
compensation.
6. That a best practice program of leak detection and repair, and pressure
management be implemented as soon as possible.
7. That new regulations be developed by AWCO in collaboration with the Governorate,
to require new housing, commercial and industrial developments and buildings,
including major refurbishments, to incorporate best-practice water efficiency and
localised reuse of wastewater as a condition of connection to the water supply and
sewerage system.
Institute for Sustainable Futures, UTS March 2011
Alexandria Water Efficiency Study 29
10 REFERENCES
AbuZeid, K.M, El Arabi, N., Fekry, A., Meneum, M.A., Taha, K. and El Karamany, S., Elrawady,
M. 2009. Assessment of Groundwater Potential in Alexandria Governorate, CEDARE and
Research Institute for Groundwater, November 2009.
AbuZeid, K.M., Assimacopoulos, D., Manoli, E., Donia, N., Sabry, N., Ramadan, A., Elrawady,
M. 2010a, Alexandria Urban Water System Modeling, CEDARE and National Technical
University of Athens, March 2010.
AbuZeid, K.M., Smout, I., Taha, H., Sabry, N., Elrawady, M. 2010b, Alexandria Water Demand
Management Study, CEDARE and Alexandria Water Company (AWCO), March 2010.
Chemonics Egypt, 2010, Affordability Assessment to Support the Integrated Urban Water
Management in Alexandria – Draft, 16 October 2010.
Cote, P., Siverns, S., Monti, S., 2005, Comparison of Membrane-based solution for water
reclamation and desalination, in Desalination, Vol 182, pg 251-257, April 2005.
ENP Newswire, 2010, Befesa is awarded the biggest desalination plant in Tunisia, July 16,
2010. http://www.allbusiness.com/construction/heavy-civil-construction/14821287-1.html
Pearce, G.K., 2010, The Challenge by the Mayor of London to Thames Water’s Desalination
Plant at Beckton [Presentation], Membrane Consultancy Associates at CIWEM Conference,
April 2010.
Retamal, M.L., Turner, A.J. & White, S. 2010, The water-energy-climate nexus: systems
thinking and virtuous circles, in Howe, C., Smith, J. and Henderson, J. (eds), Climate Change
And Water: International Perspectives on Mitigation and Adaptation, American Water
Works Association and IWA Publishing, Denver, USA and London, UK, pp. 99-109.
Sydney Water, 2010, Water Conservation and Recycling Implementation Report 2009-10,
http://www.sydneywater.com.au/Publications/Reports/WaterConservationAnnualReport.p
df
Times of Oman, 2010, Oman- Desalination plant comes up in Sur, in Middle East North Africa
Financial Network (MENAFN) - Times of Oman, 9/3/2010.
http://www.menafn.com/qn_news_story_s.asp?StoryId=1093312300
Turner, A.J., White, S., Smith, G., Al Ghafri, A., Aziz, A. & Al Suleimania, Z. 2005, 'Water
efficiency - a sustainable way forward for Oman', Stockholm Water Symposium, Stockholm,
Sweden, August 2005 in STOCKHOLM WATER SYMPOSIUM, WORKSHOP 5.
Turner, A.J., Willetts, J.R. & White, S. 2006, The International Demand Management
Framework Stage 1, [prepared for Canal de Isabel II], Institute for Sustainable Futures, UTS,
Sydney. http://www.isf.uts.edu.au/publications/turneretal2006idmf.pdf
Institute for Sustainable Futures, UTS March 2011
Alexandria Water Efficiency Study 30
Turner, A.J., White, S., Kazaglis, A. & Simard, S. 2007, 'Have we achieved the savings? The
importance of evaluations when implementing demand management', Water Science and
Technology, vol. 7, no. 5-6, pp. 203-210.
Turner, A.J., Willetts, J.R., Fane, S.A., Giurco, D., Kazaglis, A. & White, S. 2008, Guide to
Demand Management, [prepared for Water Services Association of Australia], Institute for
Sustainable Futures, UTS, Sydney.
Water-technology.net, 2011, Industry Projects - Magtaa RO Desalination Plant, Algeria,
http://www.water-technology.net/projects/magtaa-desalination, accessed 5/11/2010.
Willetts, J., Carrard, N., Retamal, M., Nguyen Dinh Giang Nam, Paddon, M., Do Xuan Thuy,
Nguyen Hieu Trung and Mitchell, C., 2010. Cost effectiveness and Sustainability of Sanitation
Options: A Case Study of South Can Tho – Technical Report. Institute for Sustainable Futures,
University of Technology, Sydney.
Yassin, A.A., 2010, Alexandria 2037 Integrated Urban Water Management Strategic Plan –
Towards a Water-Sustainable City of the Future (Draft), Faculty of Engineering - Alexandria
University, October 2010.