Embed Size (px)
Citation preview

February 2013
Investor
Presentation

2
Safe Harbor Statement
This document contains forward-looking statements that involve a number of assumptions, risks and uncertainties that could cause actual results to differ materially from those contained in the forward-looking statements. ATLS cautions readers that any forward-looking information is not a guarantee of future performance. Such forward-looking statements include, but are not limited to, statements about future financial and operating results, resource potential, ATLS’ plans, objectives, expectations and intentions and other statements that are not historical facts. Risks, assumptions and uncertainties that could cause actual results to materially differ from the forward-looking statements include, but are not limited to, assumptions and uncertainties associated with general economic and business conditions; changes in commodity prices; changes in the costs and results of drilling operations; uncertainties about estimates of reserves and resource potential; inability to obtain capital needed for operations; ATLS’ level of indebtedness; changes in government environmental policies and other environmental risks; the availability of drilling equipment and the timing of production; and tax consequences of business transactions. In addition, ATLS, Atlas Resource Partners, L.P., and Atlas Pipeline Partners, L.P. are subject to additional risks, assumptions and uncertainties detailed from time to time in the reports filed by ATLS and Atlas Resource Partners, L.P. with the U.S. Securities and Exchange Commission, including the risks, assumptions and uncertainties described in their quarterly reports on Form 10-Q, reports on Form 8-K and annual reports on Form 10-K. Forward-looking statements speak only as of the date hereof, and neither ATLS, Atlas Resource Partners, L.P., nor Atlas Pipeline Partners, L.P. assumes any obligation to update such statements, except as may be required by applicable law.

3
ATLS: Unique Business Model
• Atlas Energy’s general partner ownership in ARP & APL generates substantial cash flow growth without investment of capital
• Both E&P business (ARP) and midstream operations (APL) have strong balance sheets and significant growth opportunities
• ATLS has minimal leverage and capital requirements
• Management team holds a solid record of creating value through the Atlas entities

Atlas Organizational Structure
4
NYSE: ATLS
NYSE: APL NYSE: ARP
2.0% GP & 100% IDRs 2.0% GP & 100% IDRs 9% LP 44% LP

5
ATLS: Growth in GP Cash Flow Streams
Atlas should benefit from strong cash flow growth in its general and limited partner interests in both ARP and APL, without any additional
investment of its own capital
$0.50
$1.00
$1.50
$2.00
$2.50
$3.00
$3.50
$4.00
$4.50A
TLS
Cas
h F
low
/ U
nit
Annual Atlas Resource Distribution/Annual APL Annual Distribution
APL LP & IDR Distributions to ATLS
ARP LP & IDR Distributions to ATLS

6
ARP: A Different Approach
Strong Foundation of E&P Assets
Unconventional Business Model
• Long-lived reserves in desirable basins with high IRRs
• Highly-skilled senior management team with extensive US Basin experience
• Sell high, buy low o Sold to Chevron at top of the market o Strong Barnett position acquired at market “bottom”
• Strong Hedging Program o Substantially hedged through 2017 o Hedge immediately upon acquisition
• Direct Investment Programs o Allows ARP to develop basins with minimal net capital o ARP: upfront & ongoing management fees; working
interest in drilling o Investors: large upfront deductions and royalty
interests in wells
• Low Leverage

ARP Producing Assets & Drilling Activity
7
• Total Proved Reserves: 900 Bcfe • Percent Developed: 51% • PF 3Q12 Daily Production: > 130 Mmcfe/d • Reserve Life Index: 19 years • Producing Wells: Over 9,800
Oklahoma Mississippi Lime
Texas – Barnett Shale & Marble Falls
Pennsylvania/W. VA Marcellus Shale
Other Operating Areas: • Indiana/Michigan • Colorado • Tennessee • West Virginia
Pittsburgh Office Location
Fort Worth Office Location
Ohio Utica Shale

8
2012 Transactions
• 2012 Carrizo and Titan acquisitions combined to provide ARP with long-lived reserves at an average cost below $0.75/mcfe, while the DTE acquisition was approximately $7/Boe of reserves acquired
• Acquired production was ~90% hedged for the initial 12 months of production, 80% for the following 24 months and 40% for the outer years
• 2012 acquisitions financed with ~70% equity, preserving our conservative capital structure
CRZO Transaction DTE Transaction Equal Transaction Titan Transaction
• Provided ARP with an entry point into the core of the Barnett Shale
• $187MM transaction price: $67MM borrowed; $120MM equity private placement
• Accretive to 2H 2012 and FY 2013 common unit distributions
• 250 Bcfe of proved reserves; complementary to ARP’s first Barnett Shale acquisition
• $193MM transaction financed solely through equity issuance to seller
• Accretive to distributions even with 100% equity financing
• Titan assets include > 300 undeveloped well locations
• Approximately 20,000 net undeveloped acres in the oil and NGL area of the Mississippi Lime
• $59.3MM transaction financed through available borrowings under the revolving credit facility
• 35.2 MMBoe of reserves with 3,800 boe/d net production YTD 2012
• $255MM transaction financed through equity issuance and borrowings
• Accretive to distributions even with ~70% equity financing
• Complementary to existing Barnett Shale position
March 2012 November 2012 September 2012 May 2012

9
DTE Acquisition is complementary to ARP’s existing
Fort Worth Basin assets
• DTE had accumulated approximately 88,000 net acres in Jack, Clay, Denton, Wise, Erath, Parker, Hood and Palo Pinto Counties in Texas
• 75,000 net acres in the Marble Falls prone areas
• Approximately 40% held by production, 33% in continuous development
• Close proximity to ARP’s existing operations in the Ft. Worth Basin
• 261 producing wells, 100% operated; 99% WI; Average NRI 78%
• Approximately 3,800 Boe/d of net production
• 35 MMBoe proved reserves; ~28% oil, 31% NGL
• 700 identified undeveloped vertical locations in Marble Falls play
• 643 total leases
• The top 100 leases comprise 67% of total company net acres

10
Atlas Acreage Growth in Key Basins
Barnett
• 28,000 Acres
• 400+ Drill Sites
Marble Falls
• 88,500 Acres
• 700+ Drill Sites
Miss Lime
• 20,000 Acres
• 100+ Drill Sites
Utica
• 4,500 Acres
• 25+ Drill Sites
Marcellus
• 3,000 Acres
• 25 Drill Sites
0
20,000
40,000
60,000
80,000
100,000
120,000
140,000
160,000
Jan-12 Feb-12 Mar-12 Apr-12 May-12 Jun-12 Jul-12 Aug-12 Sep-12 Oct-12 Nov-12 Dec-12
MF
MS Lime
Barnett
Utica
Marcellus
ARP Acreage in Key Basins is Primarily Held by Production

11
Projected Distribution Growth
ARP is projecting distribution growth in 2013 superior to its peer group
Source : Wells Fargo Securities Peer companies: BBEP, EVEP, LGCY, LINE, LRE, MCEP, MMEP, PSE, QRE, VNR
0.0%
10.0%
20.0%
30.0%
40.0%
50.0%
A B C D E F G H I J ARP
Projected 2013 distribution growth

12
Strong Hedge Positions
• Significantly hedged future production, enhancing overall risk management:
• Barnett production was 90% hedged for the initial 12 months of production, 80% for the following 24 months and 40% for the outer years
• Disciplined and comprehensive hedge strategy enhances the stability of ARP’s future cash flow
• DTE properties hedged at 80% of production from PDP for 2013, 60% for the following 24 months and 30% for the outer years
Natural Gas1
0.0
50.0
100.0
150.0
200.0
250.0
300.0
350.0
400.0
2013 2014 2015 2016 2017
000’s
of barr
els
0.0
5.0
10.0
15.0
20.0
25.0
30.0
35.0
2013 2014 2015 2016 2017
Volu
mes H
edged (
Bcf)
$3.83
$3.02
Crude Oil
$90 – $116.40
$83.85 – $110.65
$91.93 $91.65 $88.62
Puts
Collars
Swaps
Collars
Swaps
$86.53 $84.60
$84.17 – $113.31
$4.43 – $5.48
$4.17
$4.25 – $5.16
$4.26 – $5.17
$4.26 $4.42 $4.68
(1) Excludes partnership’s estimated basis for the respective period

13
Direct Investment Program
• Substantial 1st year tax deduction (~94% of investment) against ordinary income
• Monthly royalties from production of wells
• Tax deductions beyond 1st year for depletion and depreciation
Value to Drilling Partners Value to Atlas Resource
Partners
• Upfront fees from fundraising; 15% over costs paid by partners
• Carried interest of 5-7% in production; total working interest of ~30%
• Ongoing monthly fees for life of the well
• Credit received for cost paid for leasehold acreage

14
Atlas Pipeline Partners, L.P. (NYSE: APL)
Assets located in enviable basins including Permian, Woodford Shale, and Mississippian Lime with access to other basins through newly acquired treating business
Units currently yielding approximately 7.0% to unitholders based on annualized recent distribution of $0.58 per unit for 4Q 2012*
Strong margin protection of cash flow through risk management program
Strong balance sheet versus midstream industry peers enables opportunistic pursuit of organic and external growth
As of 2Q 2013, overall processing capacity will double company-wide to almost 1.2 Bcf/d
Growth-Oriented Midstream Gathering & Processing MLP with 12 Processing Plants and over 10,100 miles of gathering pipelines
20% interest in WestTX LPG NGL pipeline (operated by Chevron)
Recently purchased Cardinal Midstream (named Arkoma) for $600 million to add a fourth major gathering and processing system as well as a treating business located in other enviable basins which could create incremental midstream opportunities
Completed significant expansions at WestOK and Velma and major expansions to come in 2013 at WestTX and Arkoma
Disciplined Approach to Managing our Business - Conservative Financially and Aggressive Operationally
* Market data as of 1/28/2013
15
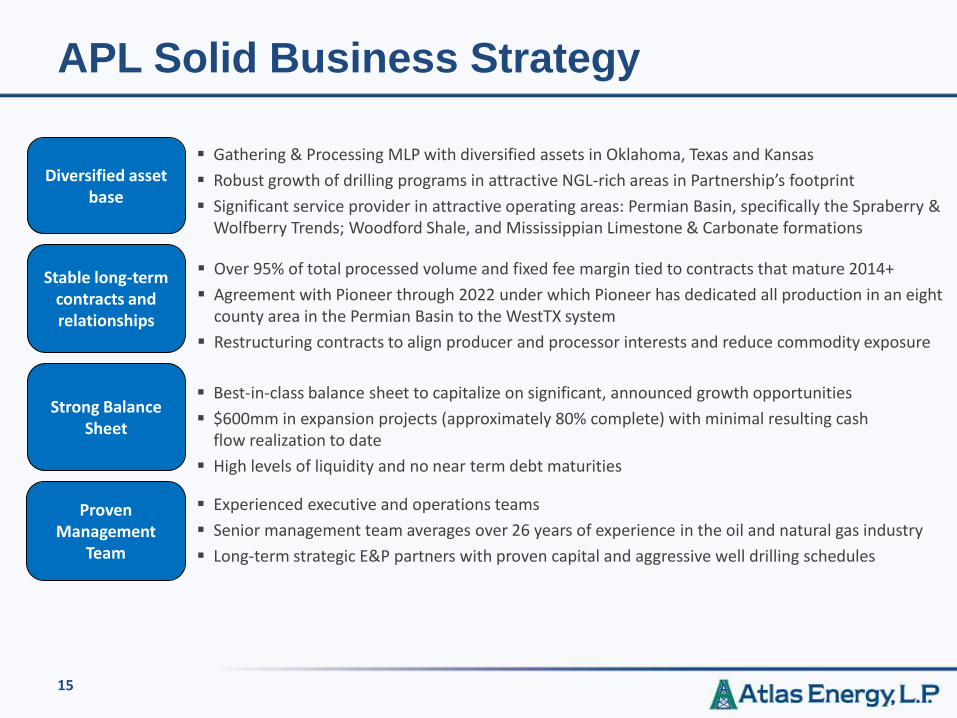
APL Solid Business Strategy
Diversified asset base
Stable long-term contracts and relationships
Strong Balance Sheet
Proven Management
Team
Gathering & Processing MLP with diversified assets in Oklahoma, Texas and Kansas
Robust growth of drilling programs in attractive NGL-rich areas in Partnership’s footprint
Significant service provider in attractive operating areas: Permian Basin, specifically the Spraberry & Wolfberry Trends; Woodford Shale, and Mississippian Limestone & Carbonate formations
Over 95% of total processed volume and fixed fee margin tied to contracts that mature 2014+
Agreement with Pioneer through 2022 under which Pioneer has dedicated all production in an eight county area in the Permian Basin to the WestTX system
Restructuring contracts to align producer and processor interests and reduce commodity exposure
Best-in-class balance sheet to capitalize on significant, announced growth opportunities
$600mm in expansion projects (approximately 80% complete) with minimal resulting cash flow realization to date
High levels of liquidity and no near term debt maturities
Experienced executive and operations teams
Senior management team averages over 26 years of experience in the oil and natural gas industry
Long-term strategic E&P partners with proven capital and aggressive well drilling schedules

16
Atlas Pipeline is Expanding its Entire Business
$1.2 Billion in Capital Expansions & Acquisitions Expected to Add Meaningful Cash Flow
System Previous Capacity
Expansion New Capacity
Timing Comment
Velma
100 mmcfd 60 mmcfd 160 mmcfd Online now Expansion is online and receiving meaningful volume
WestOK
258 mmcfd 200 mmcfd 458 mmcfd Online now Expansion is online and over 60% full already
WestTX
255 mmcfd 200 mmcfd 455 mmcfd Late 1Q 2013 or early 2Q 2013
Second half of expansion moved forward for 2nd time by 1 year for full instillation
Arkoma (purchased from Cardinal Midstream)
220 mmcfd (gross)
200 mmcfd 420 mmcfd (gross)
First 120 mmcfd in 4Q 2013, and is further scaleable to 200 mmcfd
Purchased in December 2012 for $600mm; $50mm net to APL for expansion

17
Arkoma Update (purchased from Cardinal Midstream)
Overview
Geographical Area: Woodford Shale/Arkoma Basin
Miles of Pipeline: Approx. 100
Processing Capacity: 220,000 mcfd (gross)
Capacity Utilization: 95%
Cash Flow Mix
Fixed Fee 80%
Commodity Exposed 20%
Wet Gas Gathering 80%
Dry Gas Gathering 10%
Gas Treating 10%
Atoka
Coalgate
Stonewall Tupelo
Atoka
Bryan
Caddo
Carter
Choctaw
Coal
Comanche
Cotton
Garvin
Grady
Hughes
Jefferson
Johnston
Love
McClain
Marshall
Murray
Pittsburg Pontotoc
Pottawatomie Seminole
Stephens
Archer
Clay
Cooke Fannin Grayson Lamar Montague
Wichita
Velma
Arkoma System
System Notes
Purchased Cardinal Midstream in December 2012 for $600 million, renamed the Arkoma system
Consists of 3 cryogenic processing facilities totaling 220 mmcfd (gross)
Serves liquids rich production in Arkoma Woodford complimented by dry gas gathering and lease treating facilities in other major shale plays
Capacity is at 95% utilization with plans for up to an additional 200 mmcfd expansion through Centrahoma JV with MarkWest Energy Partners in 2013-2014

Gross Margin Coverage for remaining 2013 is 82% including Hedges and Fee Business
Note: Hedges are at the corporate level and are not asset specific; Data is pro forma for recent Cardinal acquisition
Gross
Margin
Hedged 40%
Percentage of Proceeds 55%
Fixed Fee 33%
Keep-Whole 12%
Hedged 9%
Unhedged 3%
Unhedged 15%
82% of run-rate Gross Margin is under Fixed Fee arrangement or Hedged to Limit Commodity Price Exposure
APL intends to maintain a diversified contract portfolio across its systems
Fee-based component in processing contracts will be used to offset costs of connecting wells
APL continues to utilize a robust risk management strategy utilizing swap and options to prevent margin deterioration
18
Strong Hedge Positions
19
Summary
• Atlas Energy’s general partner ownership in ARP & APL generates substantial cash flow growth without investment of capital
• Both E&P business (ARP) and midstream operations (APL) have strong balance sheets and significant growth opportunities
• ATLS has minimal leverage and capital requirements
• Management team holds a solid record of creating value through the Atlas entities