Embed Size (px)
Citation preview
Loran C Monitor Collocation Tests
Robert D. Till Rob~rt Moore Norman Beauregard
February 1987
DOT /FAA/CT-TN86/43
Document is on file at the Technical Center Library, Atlantic City Airport, N.J. 08405
U.S. Oepartmenr ot TransportafiOn
Federal Avtatlon Adrn6nstratlon
Technocal Center Atlantic Coty Aorport. N.J. 08405
NOTICE
This document is disseainated under the sponsorship of the Department of Transportation in the interest of information exchange. The United States Govera.ent assumes no liability for the contents or use thereof.
The United States Government does not endorse products or manufacturers. Trade or manufacturer's names appear herein solely because they are considered essential to the object of this report.
1. Report No.
DOT/FAA/CT-TN86/43 4. Title oncl Subtitle
LORAN C MONITOR COLLOCATION TEST
T eclutical M.,ort Docu ... ntation Pat•
3. Recipient" 1 Cotoloe No.
5. Report l)oto February 1987
6. Porfo,..int Or..,.i1otion Coclo ACT-140
t--:;--:-::-'7'"':-1r.:::"t:"::':''%.""""1"1""--.I""':"'"T"T-""''r.::-r::"=~~==~-:::-:~--------4'· Porfo,.,int Oreoni10tion Report No. 7. Autho•'•l Kobert U. T111, Kooen: M.oore, ana Norman Beauregard
Federal Aviation Administration Technical Center Atlantic City International Airport, N.J. 08405
~1~2~.~.~on-.-o-ri~n-,~ .. ~.-.-"~-y~N-.. -.---.. ~.~~~,-.-•• --.----------------~ Department or Transportat1on Federal Aviation Administration Program Engineering and Maintenance Service Washington, D.C. 20590
16. Ab•troct
DOT/FAA/CT-TN86/43
10. Worl& Unit No. (TRAISI
13. Typo of Report oncl Periocl Covorocl
Technical Note September 1986
1• ...... orint Aeoncy Coclo
The Federal Aviation Administration (FAA) and other segments of the aviation community are becoming increasingly aware of the potential of Loran C navigation for use in en route flight and, more recently, for nonprecision approach operations. As part of an overall response to user's requirements, the FAA 1s planning to implement a network of approximately 100 Loran C monitors within the United States. These monitors will be designed to provide current status of Loran C stations for use by the aviation community. This information 1s necessary for conducting consistently reliable Loran C nonprecision approaches. For economic and logistical reasons, consideration 1s being given to collocating the planned Loran C monitors at existing very high frequency omnidirectional range tactical air navigation (VORTAC) sites. The purpose of this test was to perform an initial investigation of VORTAC/Loran C monitor collocation and VORTAC/remote communication air-to-ground (RCAG)/Loran C monitor collocation. The test results indicate that a Loran C monitor can be collocated at a VORTAC/RCAG site. The preferred monitor site locations are on top of the Tactical Air Navigation (TACAN) detector pole or remote from the VOR (250 feet from the VOR).
17. Key Worcl•
Loran C Nonprecision Approaches
19. Security Clouil. (of thi1 report)
Unclassified
Fo"" DOT F 1700.7 11-721
Document 1s on file at the Technical Center Library, Atlantic City Internationa Airport, New Jersey 08405
2D. S.wrlty Clo11if. (of thi1 , ... 1 21· No. of P.... 22. Price
Unclassified 69
Ret~M.,ctl• of c_,let041 , ... outhorlaecl
EXECUTIVE SUMMARY
INTRODUCTION
Objective Back&round Related Documentation
EQUIPMENT AND DATA COLLECTION
Ground Equipment Airborne Equipment
TEST PROCEDURES
Ground Airborne
TEST RESULTS AND ANALYSIS
Ground Airborne
CONCLUSION
APPENDICES
TABLE OF CONTENTS
Appendix A - VOR Monitor Data Appendix B - Spectrum Analyzer Data Appendix C - Loran C Monitor Test Data Plots
iii
Page
vii
1
1 1 1
2
2 4
8
8 12
12
12 13
17
Figure
1
2
3
4
5
6
7
8
9
Table
1
2
3
4
LIST OF ILLUSTRATIONS
FA-9969 VOR
Loran C Test Unit
RCAG Equipment
Loran c Antenna Test Sites
Loran c Antenna at Counterpoise
Loran c Antenna on TACAN Detector Pole
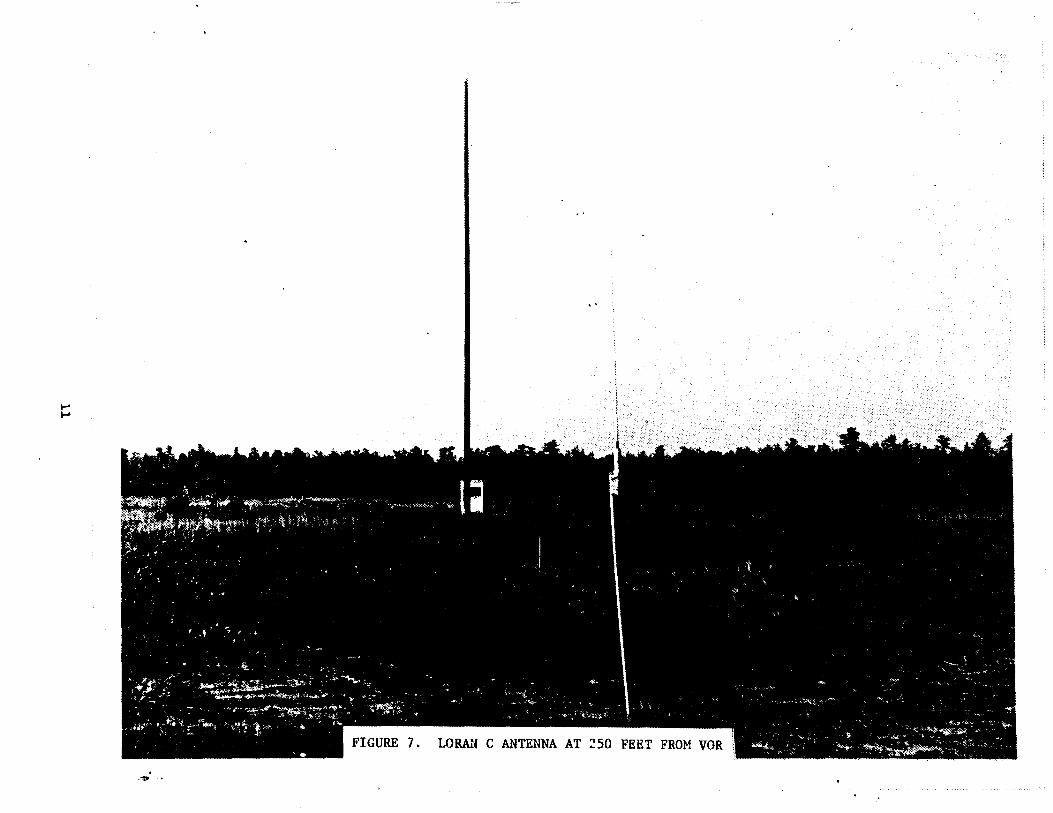
Loran c Antenna at 250 feet from VOR
Orbital Flight Test Data
Radial Flight Test Data
LIST OF TABLES
RCAG Frequencies
9960 GRI Loran C Transmitters Typical SNR's Measured at the Technical Center
Difference Statistics for VOR Cycled On/Off (Mean +2 Sigma)
Difference Statistics for RCAG Cycled On/Off (Mean +2 Sigma)
v
Page
3
5
6
7
9
10
11
15
16
Page
4
13
14
14
EXECUTIVE SUMMARY
The Federal Aviation Administration (FAA) and other segments of the aviation community are becoming increasingly aware of the potential of Loran C navigation for use in en route flight and, more recently, for nonprecision approach operations. As part of an overall response to user's requirements, the FAA is planning to implement a network of approximately 100 Loran C monitors within the United States. These monitors will be designed to provide current status of Loran C stations for use by the aviation community. This information is necessary for conducting consistently reliable Loran C nonprecision approaches. For economic and logistical reasons, consideration is being given to collocating the planned Loran C monitors at existing very high frequency omnidirectional range tactical air navigation (VORTAC) sites. The purpose of this test was to perform an initial investigation of VORTAC/Loran C monitor collocation and VORTAC/remote communication air-to-ground (RCAG)/ Loran C monitor collocation. The test results indicate that a Loran C monitor can be collocated at a VORTAC/RCAG site. The preferred monitor antenna site locations are on top of the tactical air navigation (TACAN) detector pole or remote from the VOR (250 feet from the VOR).
vii

INTRODUCTION
OBJECTIVE.
The objective of this project was to determine if a Loran C monitor could be collocated at a very high frequency omnidirectional range tactical air navigation (VORTAC) site.
BACKGROUND.
The Federal Aviation Administration (FAA) will install Loran C monitors at 102 locations across the United States to support Loran C nonprecision approaches. Loran C has been included in the National Airspace System (NAS) Plan. The monitor specifications are described in item 1 "Related Documentation."
In the interest of economics, the FAA plans to consolidate the location of airways navigation and communication facilities at a common site. For example, it is intended to collocate remote communication air-to-ground (RCAG) and very high frequency omnidirectional ranging (VOR) distance measuring equipment (DME) locations.
The purpose of the Loran C ·monitors are: to respond to the increasing use of Loran C by continuously monitoring Loran C signals and provide advisories on signal status to assure safe nonprecision approach operations. The monitor receives Loran signals from a single chain of stations and compares measured time differences (TD's) with expected TD's for the geographic position of the monitor. In the event observed TD's or signal-to-noise ratios (SNR's) exceed specified limits or other monitored parameters, such as blink or loss of signal occur, an alarm signal shall be sent to the Air Traffic Control Point (ATCP) and to the Remote Monitoring Subsystem (RMS) to advise Loran C users in the vicinity. The monitors will furnish TD correction values for nonprecision approaches. The TD correction values are necessary to resolve seasonal TD variations and reduce airborne receiver coordinate conversion biases.
RELATED DOCUMENTATION.
1. Loran C Monitor Specification, FAA-E-2762.
2. Luciani, V. J., NAFEC Range Instrumentation Systems, Report FAA-NA-79-32, February 1980.
3. VORTAC Siting Criteria, Handbook 67000.11.
4. United States Flight Inspection Manual, OP8200.1.
•
1
EQUIPMENT AND DATA COLLECTION
GROUND EQUIPMENT.
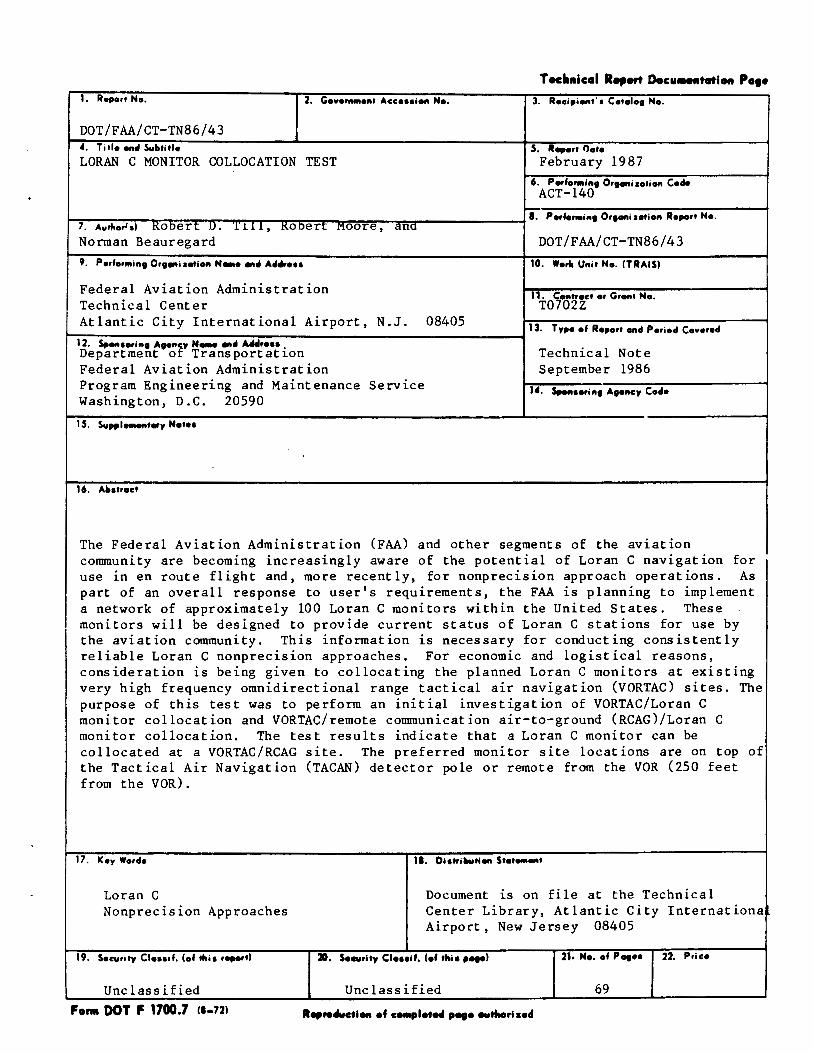
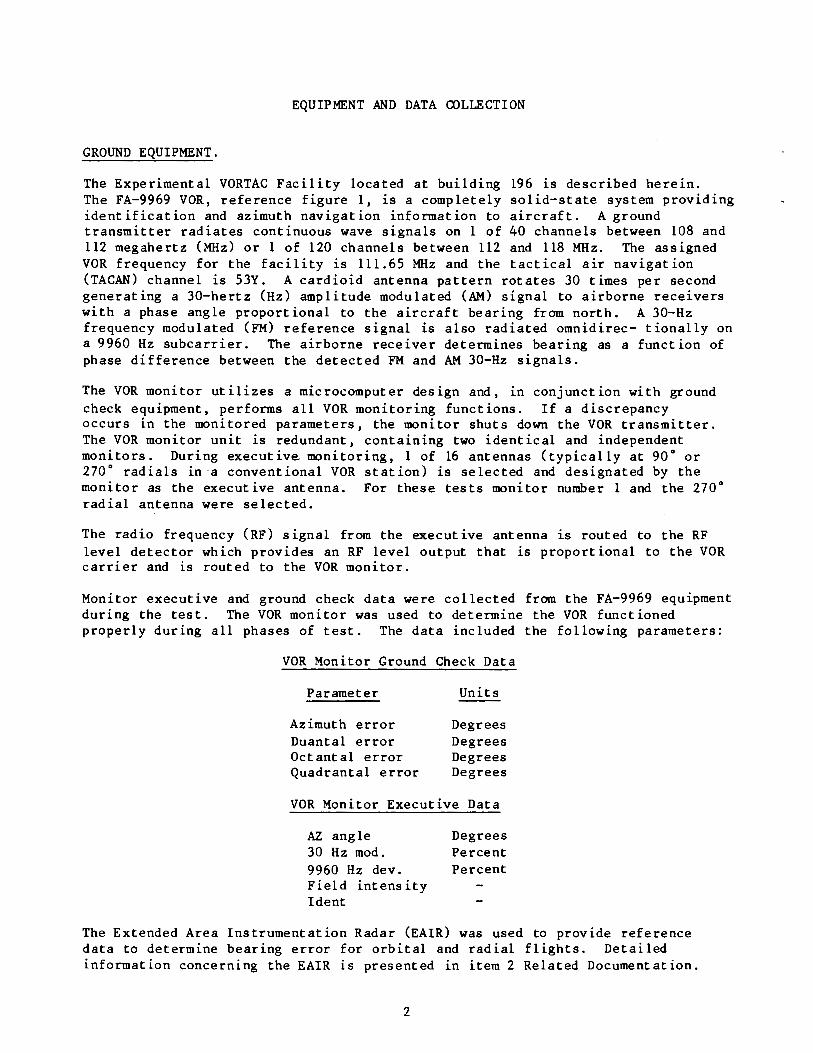
The Experimental VORTAC Facility located at building 196 is described herein. The FA-9969 VOR, reference figure 1, is a completely solid-state system providing identification and azimuth navigation information to aircraft. A ground transmitter radiates continuous wave signals on 1 of 40 channels between 108 and 112 megahertz (MHz) or 1 of 120 channels between 112 and 118 MHz. The assigned VOR frequency for the facility is 111.65 MHz and the tactical air navigation (TACAN) channel is 53Y. A cardioid antenna pattern rotates 30 times per second generating a 30-hertz (Hz) amplitude modulated (AM) signal to airborne receivers with a phase angle proportional to the aircraft bearing from north. A 30-Hz frequency modulated (FM) reference signal is also radiated omnidirec- tionally on a 9960Hz subcarrier. The airborne receiver determines bearing as a function of phase difference between the detected FM and AM 30-Hz signals.
The VOR monitor utilizes a microcomputer design and, in conjunction with ground check equipment, performs all VOR monitoring functions. If a discrepancy occurs in the monitored parameters, the monitor shuts down the VOR transmitter. The VOR monitor unit is redundant, containing two identical and independent monitors. During executive monitoring, 1 of 16 antennas (typically at 90° or 270° radials in-a conventional VOR station) is selected and designated by the monitor as the executive antenna. For these tests monitor number 1 and the 270° radial antenna were selected.
The radio frequency (RF) signal from the executive antenna is routed to the RF level detector which provides an RF level output that is proportional to the VOR carrier and is routed to the VOR monitor.
Monitor executive and ground check data were collected from the FA-9969 equipment during the test. The VOR monitor was used to determine the VOR functioned properly during all phases of test. The data included the following parameters:
VOR Monitor Ground Check Data
Parameter
Azimuth error Duantal error Octantal error Quadrantal error
Units
Degrees Degrees Degrees Degrees
VOR Monitor Executive Data
AZ angle 30 Hz mod. 9960 Hz dev. Field intensity !dent
Degrees Percent Percent
The Extended Area Instrumentation Radar (EAIR) was used to provide reference data to determine bearing error for orbital and radial flights. Detailed information concerning the EAIR is presented in item 2 Related Documentation.
2
rr---___ \ ..
I
·""'·
FIGURE l. FA-9969 VOR
3

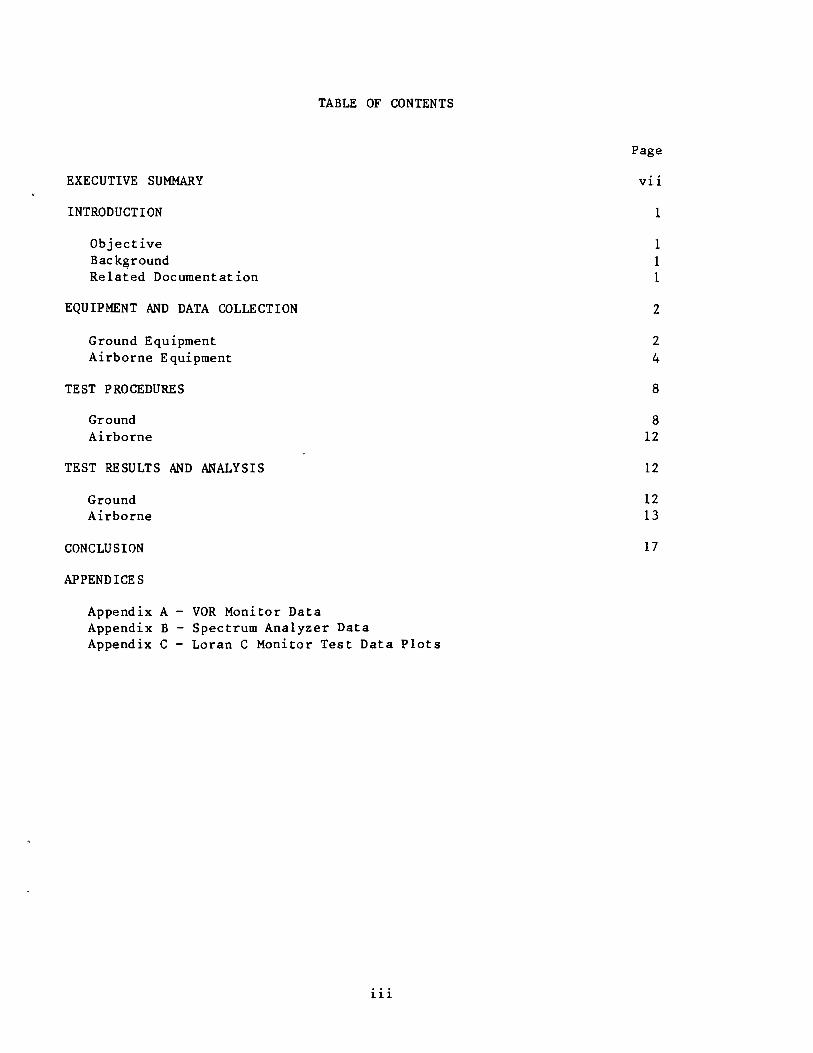
A Northstar 7000 Loran C receiver was used as the monitor receiver. A Northstar 7000 peripheral interface unit provided a 132-byte word every 3 seconds to an RS-232 serial port of a Zenith 152 personal computer (PC). The information was displayed on a monitor screen and recorded on a disk. A block diagram of the test equipment is shown in figure 2. Data reduction and plotting were accomplished post-test using a Hewlett Packard (HP) 1000 computer located in the Flight Operations building.
The following Loran C parameters were collected from the Loran C receiver during the ground and flight tests: master and secondary station TO's and SNR's for the dedicated triad MXY and any alarm indications.
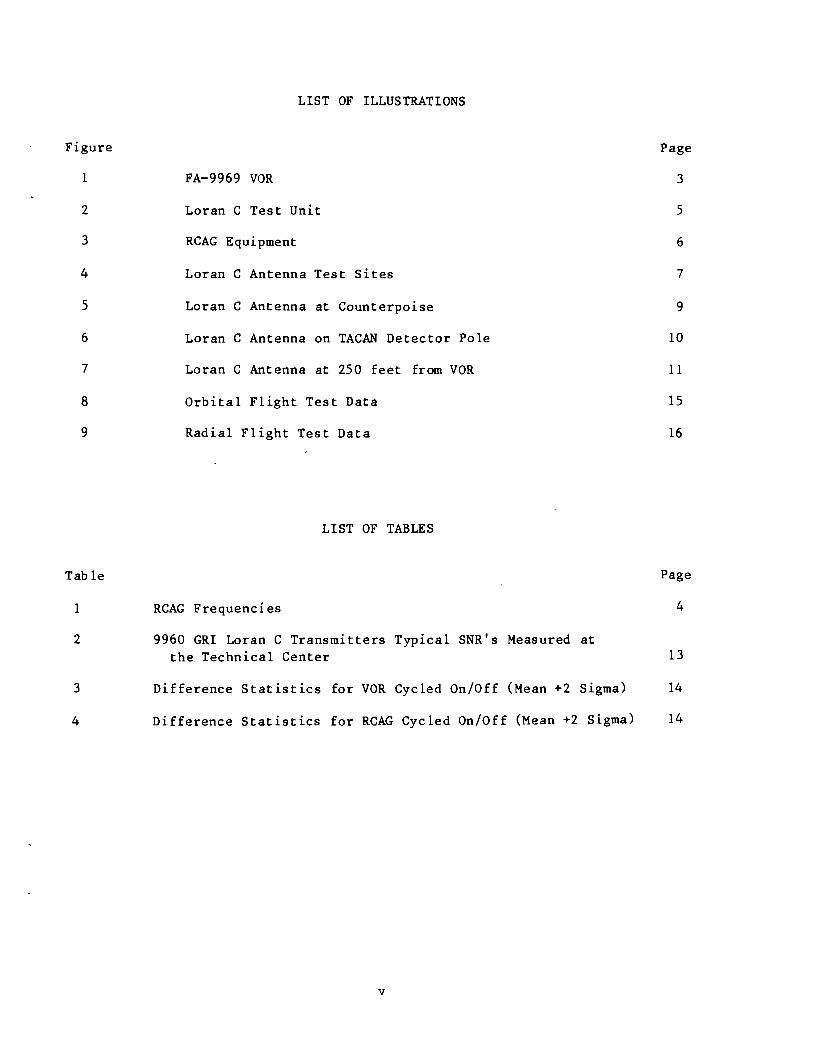
The RCAG installation contains 24 communications receiver/transmitter units operating on the assigned VHF and UHF frequencies listed in table 1 (see figure 3).
TABLE 1. RCAG FREQUENCIES
VHF UHF
~z ~z ---118.025 267.575 118.425 268.15 118.725 268.625 119.225 298.95 119.825 299.35 120.375 299.85 121.275 363.725 123.725 365.35 126.375 366.35 127.375 373.85 128.625 374.75 132.425 377.05
Each transmitter radiates power at 10 watts. There are two antenna poles, one for receive and one for transmit. Each antenna pole has six radiating elements. Each radiating element is interfaced to four receivers or transmitters through frequency combiners. The antennas are mounted on two fiberglass poles aligned with the VORTAC 270° (receiver antennas) and 90° radial (transmit antennas) approximately 70 feet from the center of the VOR and 30 feet high. The pole located on the 270° radial is shown in figure 4. The poles can be raised and lowered as required.
AIRBORNE EQUIPMENT.
Flight tests at the VORTAC site with the Loran C monitor antenna installed at different locations were accomplished using an FAA Convair 580 aircraft equipped with a flight inspection rack. The flight inspection console consisted of one
4

I
l11
RECEIVER ANTENNA
~7
\.! --- I r-- I ,
liSPE~~UM ~------~ -l I ANALYZER 1 nR-TESTO~UT ,
I REMOTE i I CONTROL 1.---.-L UNIT I - I
_______ j I
NORTHSTAR 7000
RECEIVER
! I
~ I j . I
--~ I I •so· R008 l __ _j I ANTENNA
COUPLER ------ PREAMP !
't-:ONITO~-~ I DISPLAY I I
~----~~ -! l I ~ I 1 i l i ZENITH 150 I I NORTHSTAR I ~---~ 7ooo 1
i p C I - l PERIPHERAL ! L_ I _lf'JTERF.A.CE BOX ! ______________ _j -----~---------- -- -- _ _j
FIGURE 2. LORAN C TEST UNIT
--l I
I I
I I
I
I
I
- ·- - - -- - - _j

RCAG EQUIPMENT
6

7
VOR receiver, an analog data recorder, and other related subunits. Bearing position reference for all flight testing was obtained from EAIR. Coordination for all testing was accomplished via a very high frequency (VHF) communications link.
VOR site parameters were measured with the flight inspection system and recorded manually on a strip chart recorder. Data collected included VOR course deviation, field strength, Automatic Gain Control (AGC), and modulation levels.
TEST PROCEDURES
GROUND.
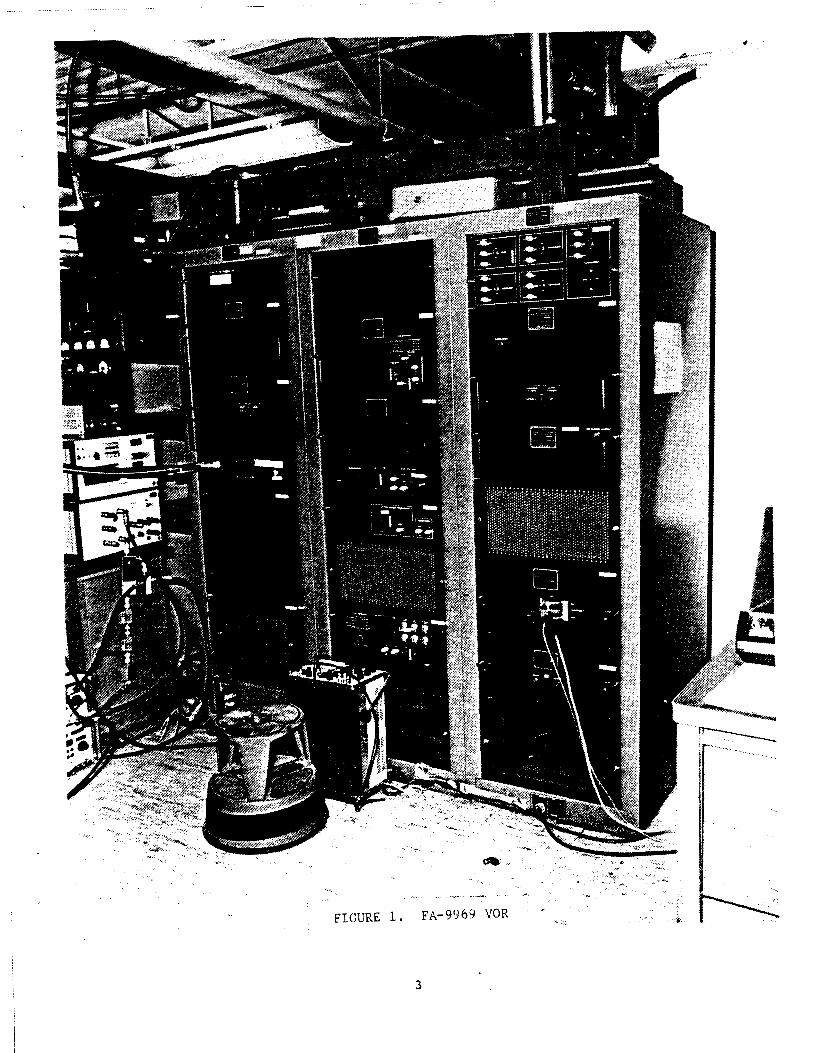
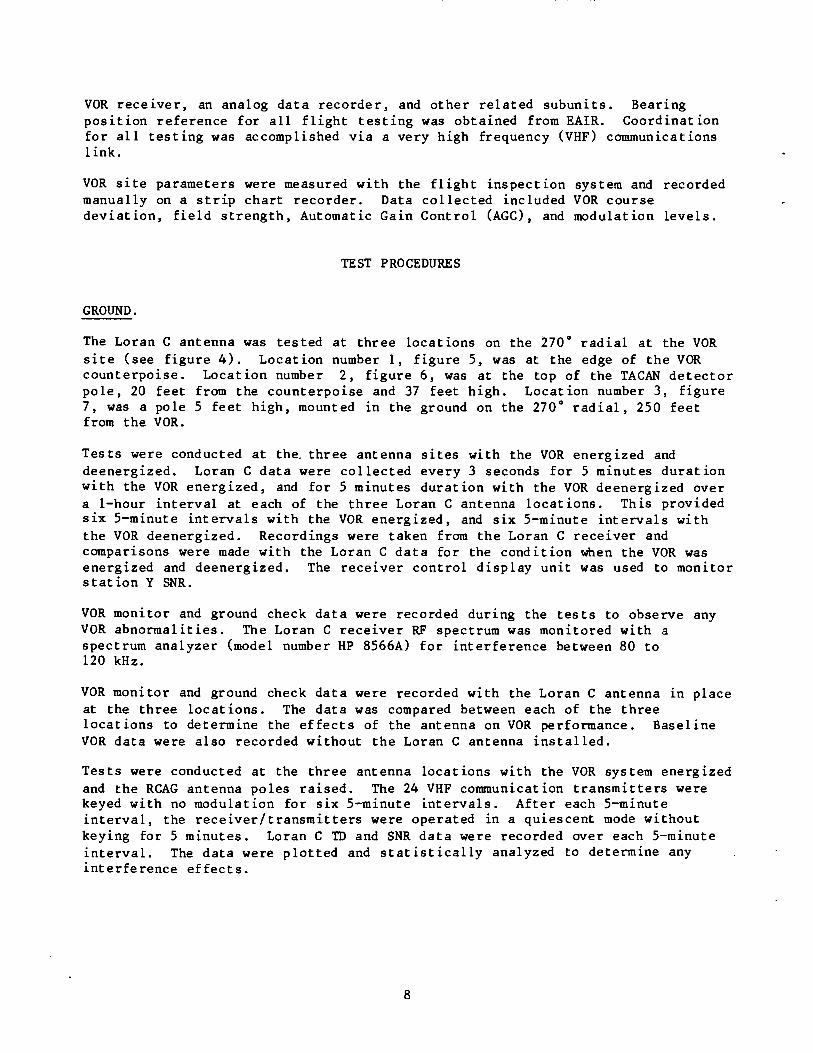
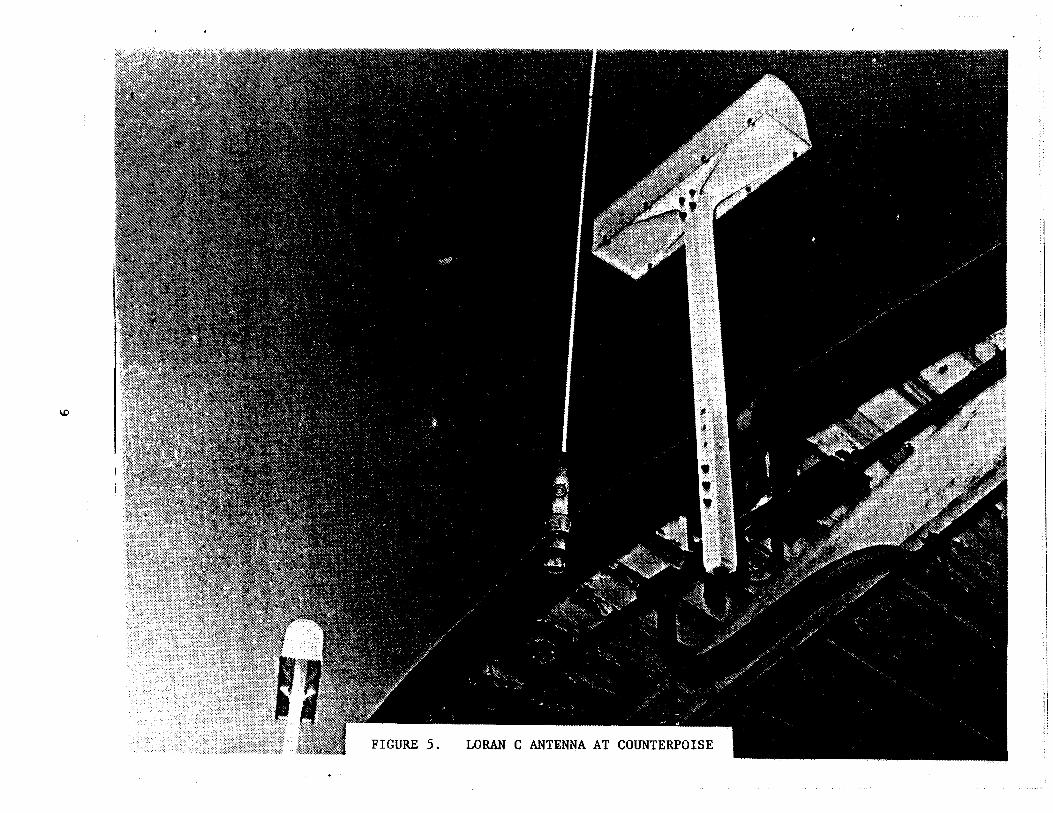
The Loran C antenna was tested at three locations on the 270° radial at the VOR site (see figure 4). Location number 1, figure 5, was at the edge of the VOR counterpoise. Location number 2, figure 6, was at the top of the TACAN detector pole, 20 feet from the counterpoise and 37 feet high. Location number 3, figure 7, was a pole 5 feet high, mounted in the ground on the 270° radial, 250 feet from the VOR.
Tests were conducted at the. three antenna sites with the VOR energized and deenergized. Loran C data were collected every 3 seconds for 5 minutes duration with the VOR energized, and for 5 minutes duration with the VOR deenergized over a 1-hour interval at each of the three Loran C antenna locations. This provided six 5-minute intervals with the VOR energized, and six 5-minute intervals with the VOR deenergized. Recordings were taken from the Loran C receiver and comparisons were made with the Loran C data for the condition when the VOR was energized and deenergized. The receiver control display unit was used to monitor station Y SNR.
VOR monitor and ground check data were recorded during the tests to observe any VOR abnormalities. The Loran C receiver RF spectrum was monitored with a spectrum analyzer (model number HP 8566A) for interference between 80 to 120 kHz.
VOR monitor and ground check data were recorded with the Loran C antenna in place at the three locations. The data was compared between each of the three locations to determine the effects of the antenna on VOR performance. Baseline VOR data were also recorded without the Loran C antenna installed.
Tests were conducted at the three antenna locations with the VOR system energized and the RCAG antenna poles raised. The 24 VHF communication transmitters were keyed with no modulation for six 5-minute intervals. After each 5-minute interval, the receiver/transmitters were operated in a quiescent mode without keying for 5 minutes. Loran C TD and SNR data were recorded over each 5-minute interval. The data were plotted and statistically analyzed to determine any interference effects.
8
9

10
ll
AIRBORNE.
A series of four flight checks were flown at the test VORTAC. An initial test was made with the VORTAC operating in its normal mode (without the Loran C antenna installed). This test is considered a control for the three tests involving installing the Loran C monitor antenna at the different locations specified in the ground test procedures at the VORTAC site. For all tests the RCAG antenna pole was left in the upright position. In order to maintain consistency with the number of test Loran C antenna locations, flight tests are listed as follows:
Test 1 VORTAC energized mode, Loran antenna at location No. 1 2 VORTAC energized mode, Loran antenna at location No. 2 3 VORTAC energized mode, Loran antenna at location No. 3 4 Control test, VORTAC energized, no Loran antenna.
Test 4 was flown first in order to insure that the VORTAC site was operating within the tolerances described in the Vortac Siting Criteria (Related Documentation item 3) and the United States Flight Inspection Manual (Related Documentation item 4). Each test was identical, consisting of one complete inbound and outbound radial of 270° (site reference valid) and one complete 15-mile orbit. All flight te&ting was accomplished at an altitude of approximately 2000-feet above mean sea level (m.s.l.). Data collection included analog recordings of the course deviation indicator (CDI) and signal strength.
Loran C monitor, VOR monitor, and ground check data were recorded during the flight tests.
TEST RESULTS AND ANALYSIS
GROUND.
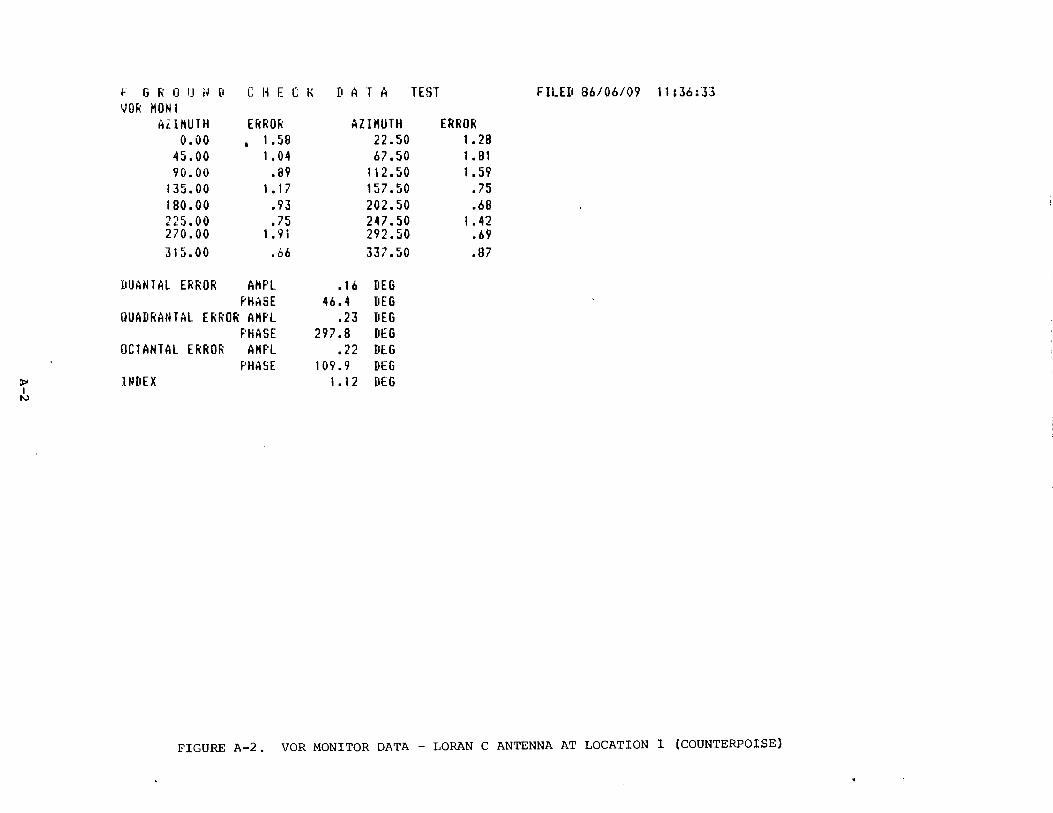
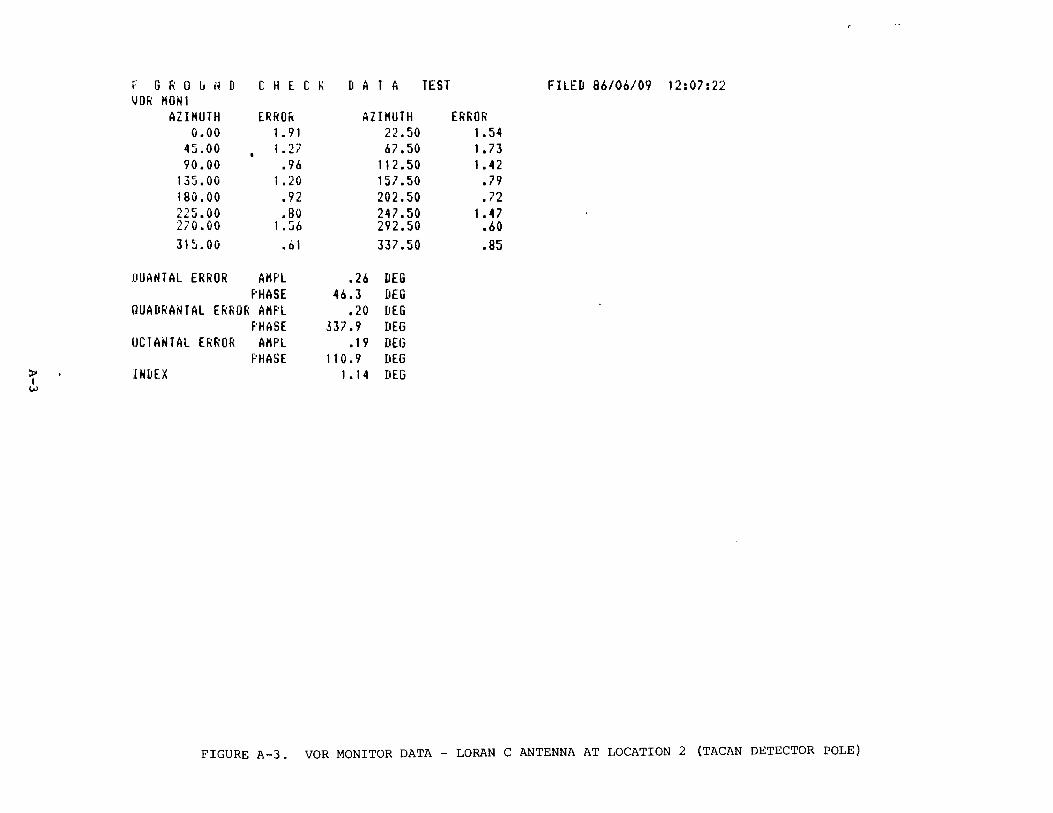
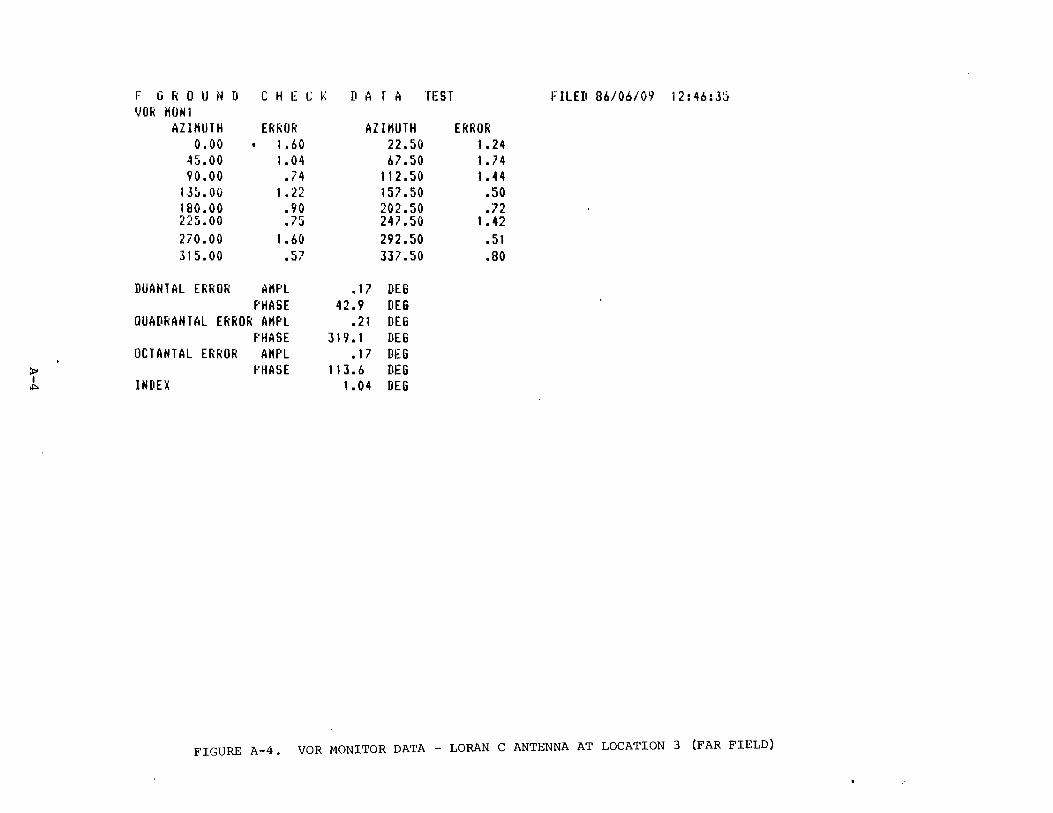
VOR MONITOR DATA. These are presented in appendix A. VOR monitor data with the RCAG off was recorded without a Loran C antenna installed, reference figure A-1; for the Loran C antenna installed at the three test locations, reference figures A-2 to A-4. The installation of the Loran C antenna did not cause the monitor to alarm. The Loran C antenna was installed on the 270° radial for all three antenna locations. No significant difference in VOR monitor azimuth error was observed with or without the Loran C antenna installed at locations 2 (TACAN detector pole) and 3 (250 feet from the VOR). However, a 0.4° increase in azimuth error at the 270° radial was observed when the Loran C antenna was located on the counterpoise.
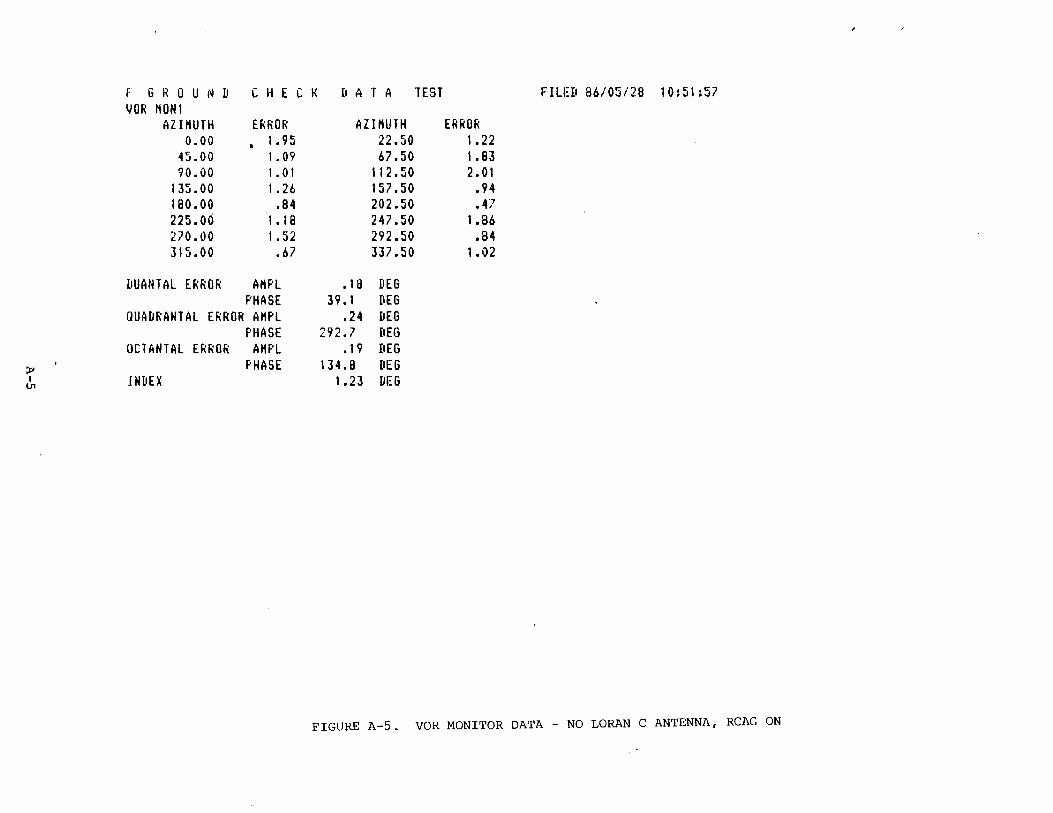
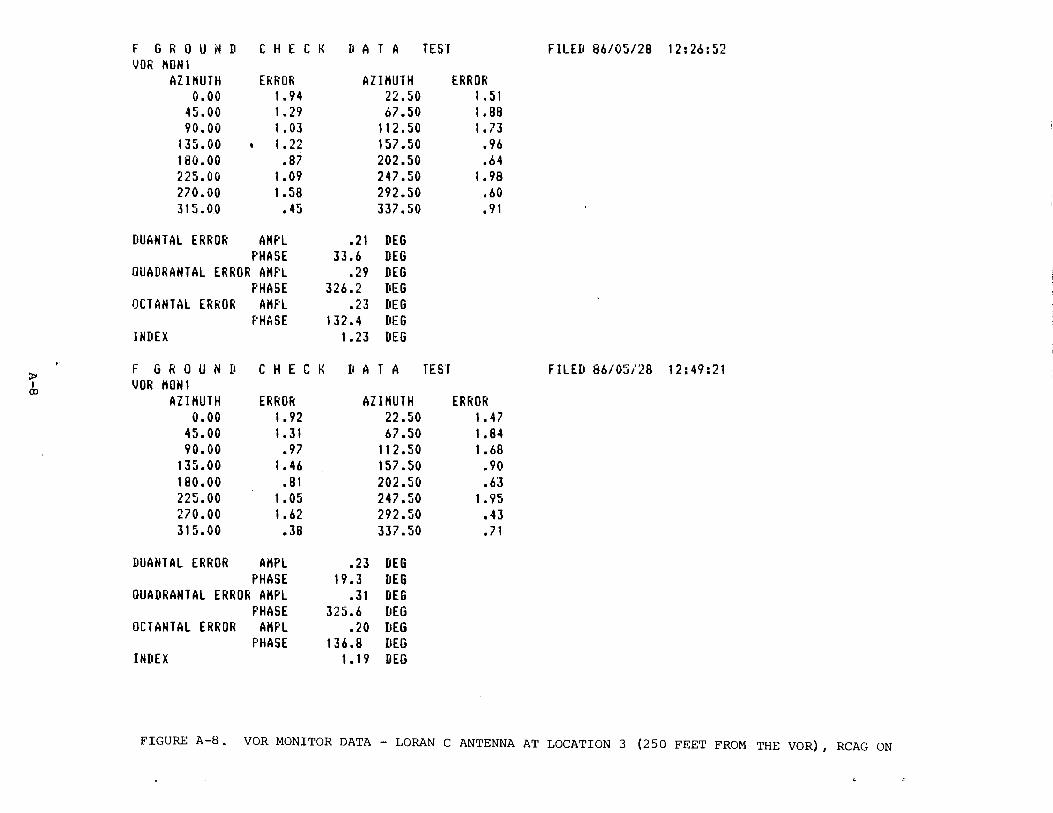
VOR monitor data with the RCAG on (transmitter keyed) was recorded without a Loran C antenna installed, reference figure A-5; for the Loran C antenna installed at the three test locations, reference figures A-6 through A-8. The data were recorded twice in figures A-6 through A-8. The installation of the Loran C antenna with the RCAG on (transmitter keyed) did not cause the monitor to alarm. No significant difference in VOR monitor azimuth error were observed at locations 2 (TACAN detector) and 3 (250 feet from the VOR). However, a 0.4° reduction in azimuth error at the 270° radial was observed when the Loran C antenna was located on the counterpoise.
12
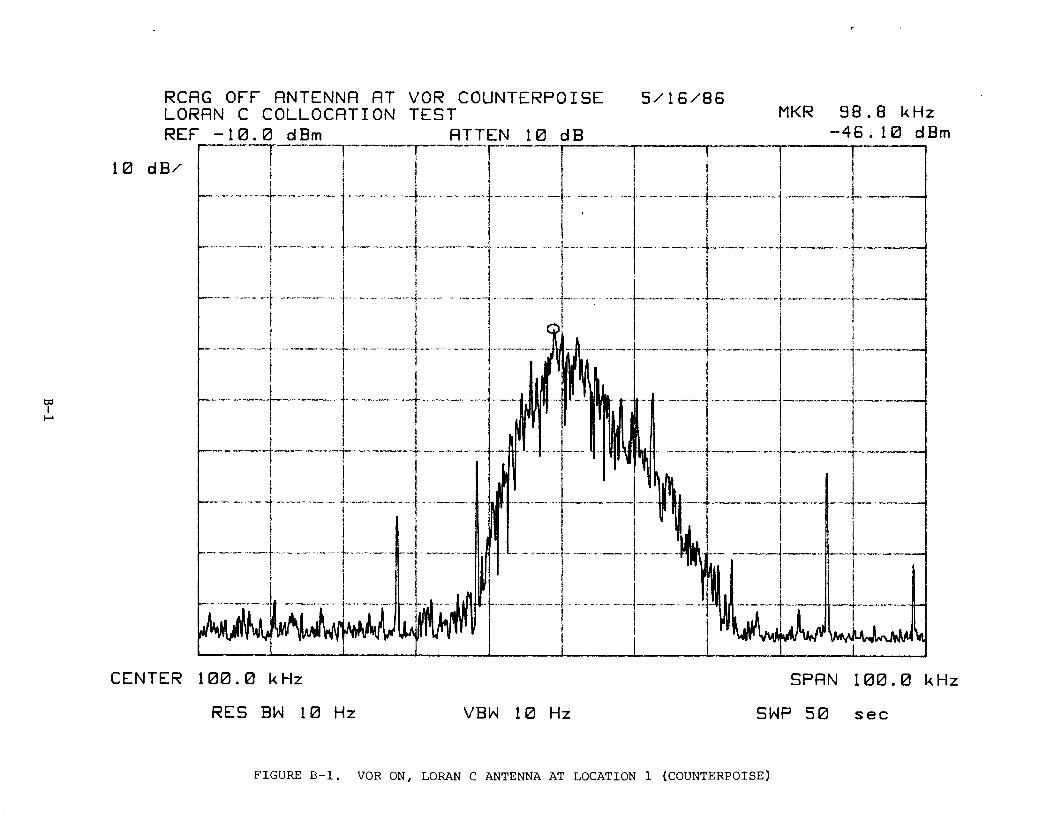
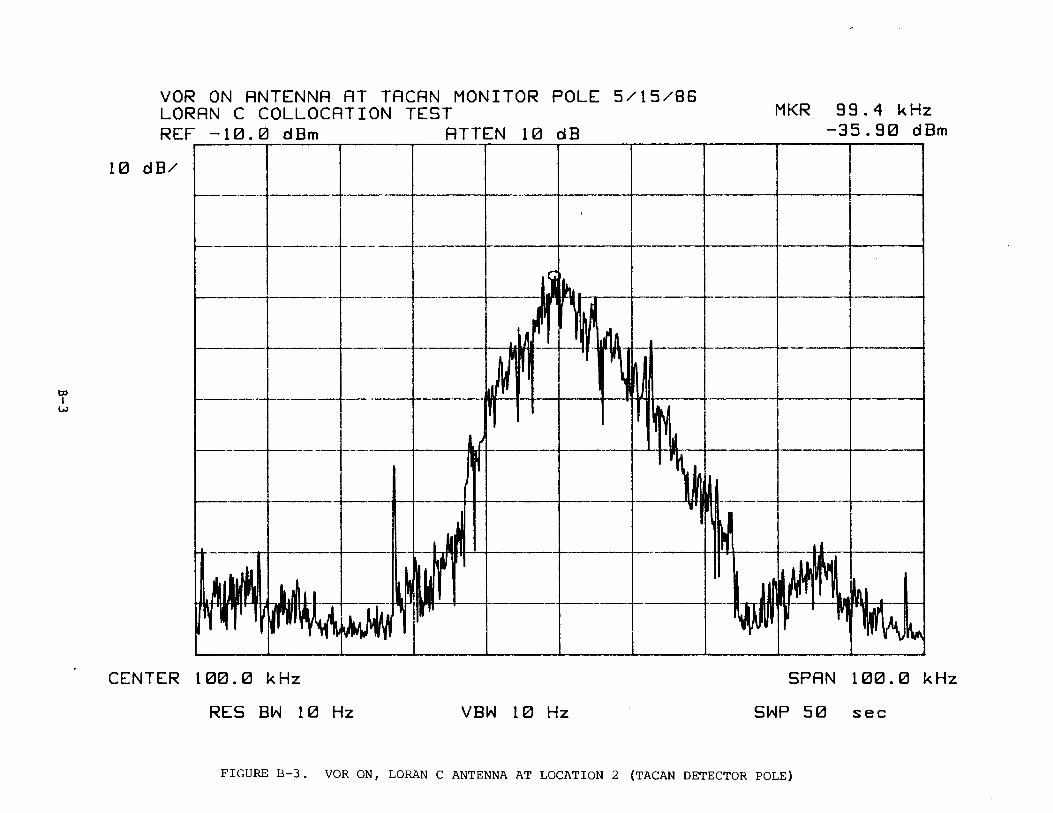
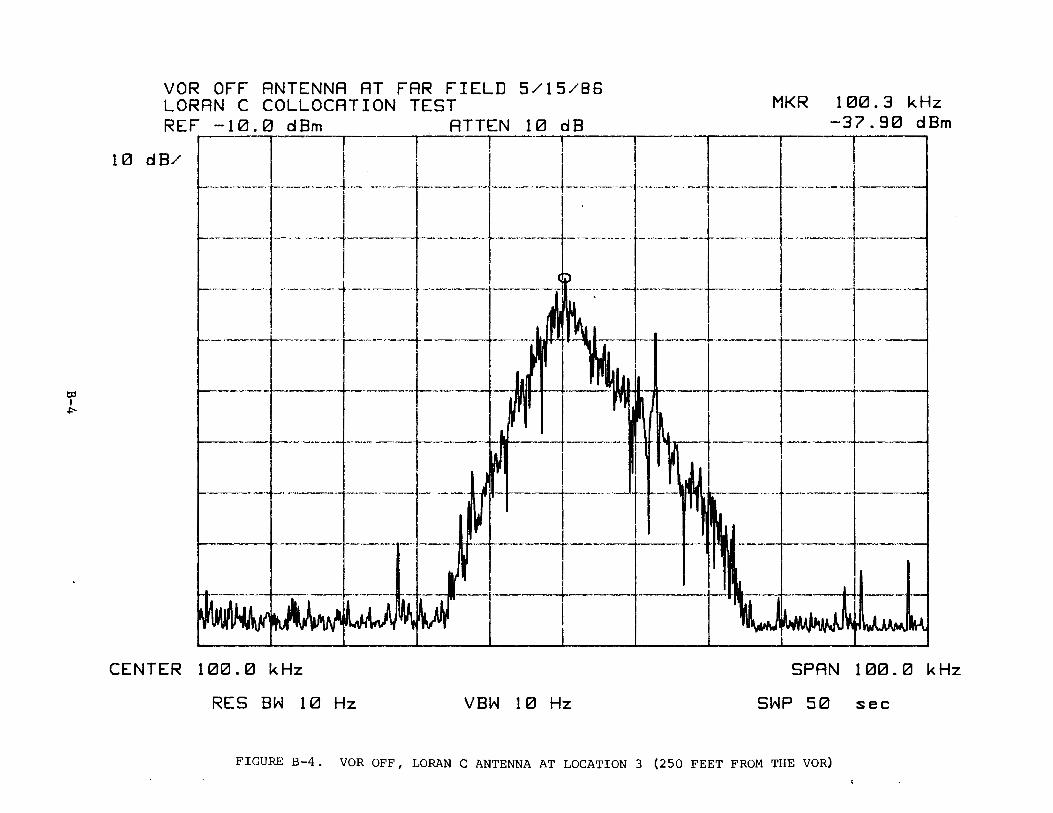
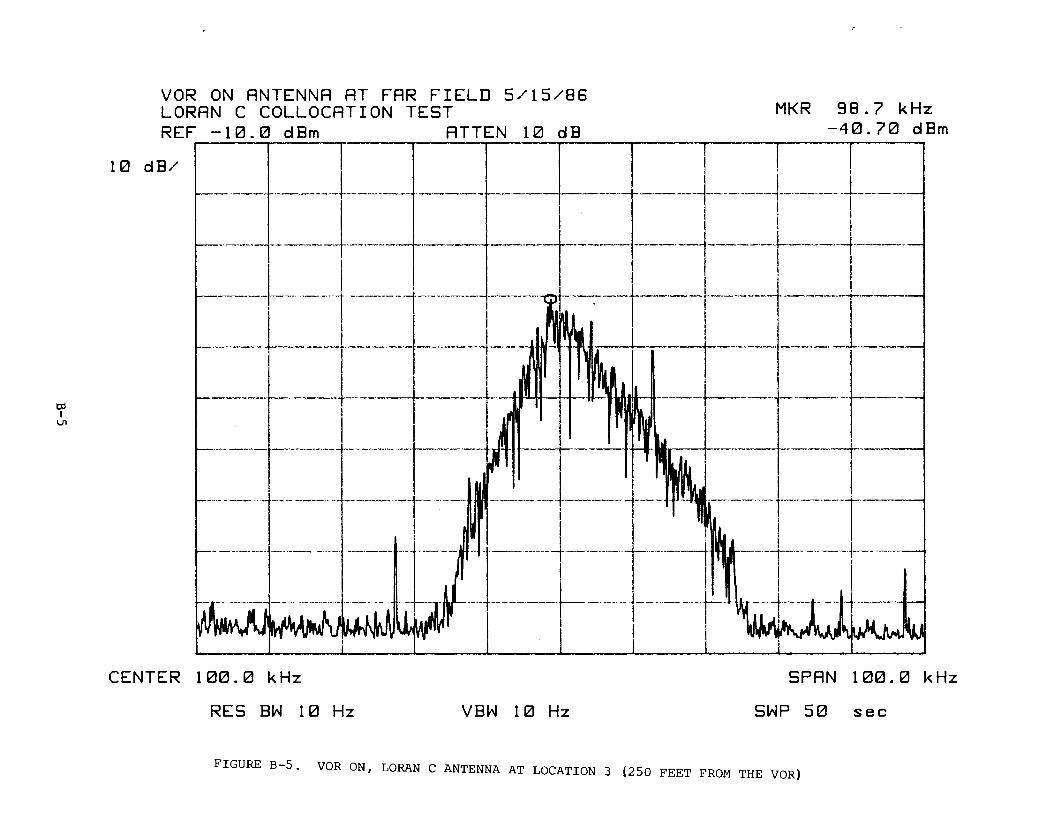
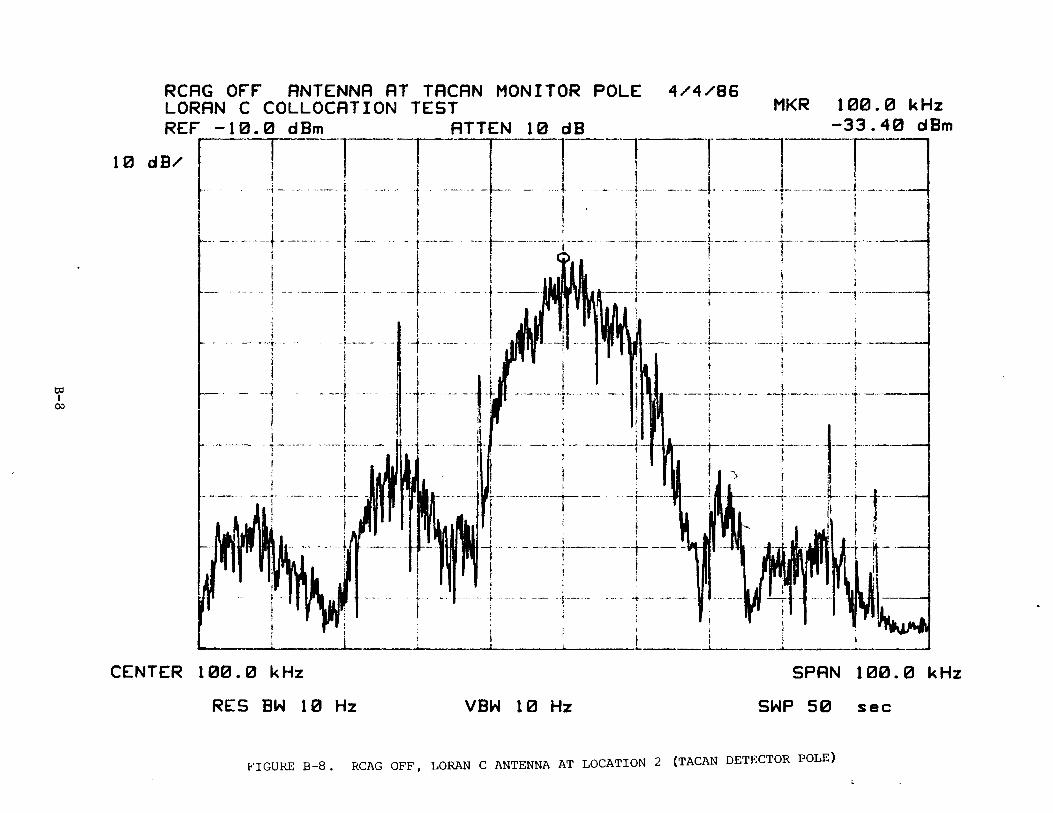
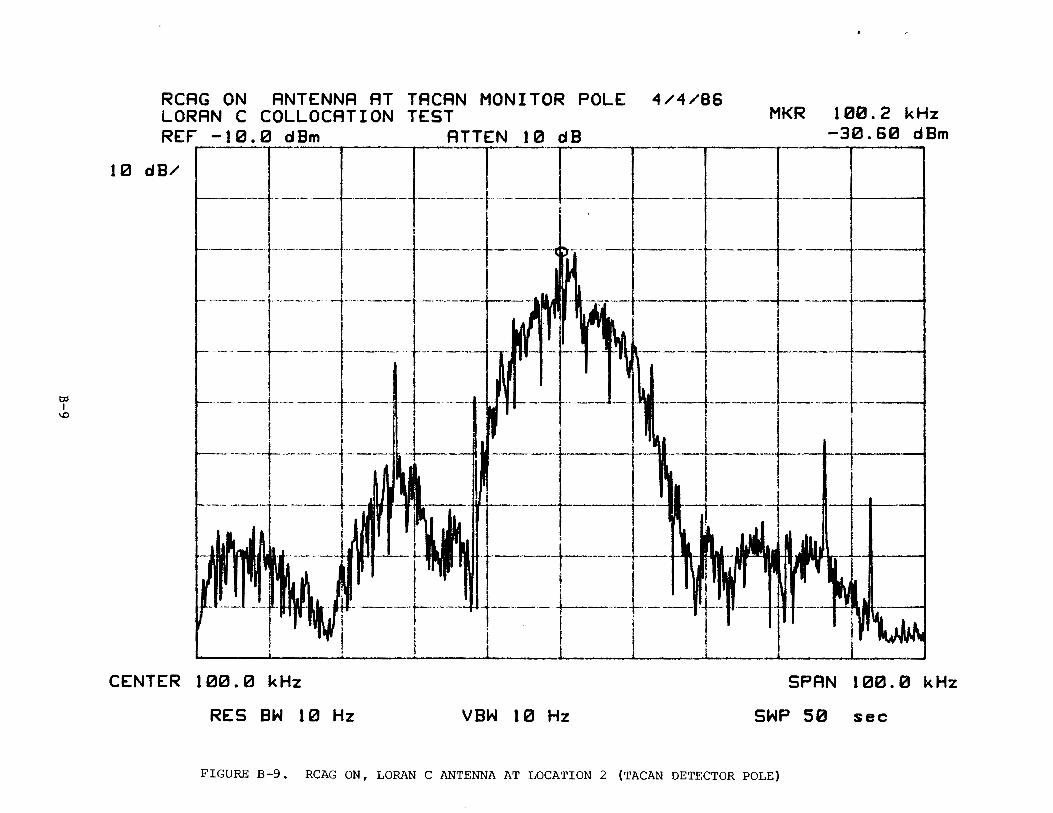
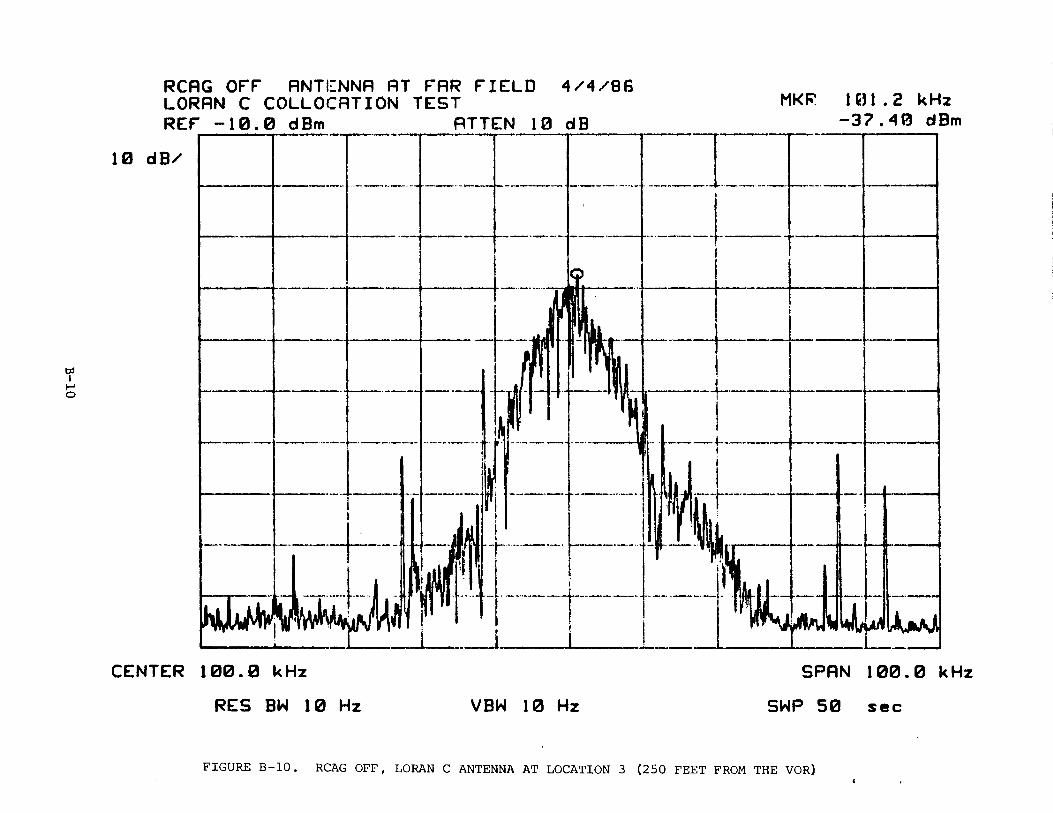
SPECTRUM ANALYZER DATA. These are presented in appendix B. Figures B-2 and B-4 are plots of the RF input spectrum of the Loran C receiver with the VOR off and RCAG deenergized at antenna locations 2 and 3. Figures B-1, B-3, and B-5 are plots of the RF input spectrum of the Loran C receiver with the VOR on and the RCAG deenergized at antenna locations 2 and 3. Figures B-6, B-8, and B-10 are plots of the RF input spectrum of the Loran C receiver with the VOR on and the RCAG off (RCAG energized but transmitters not keyed) at the three antenna locations. Figures B-7, B-9, and B-11 are plots of the RF input spectrum of the Loran C receiver with the VOR and the RCAG on (transmitter keyed) at the three antenna locations. Large amplitude, narrow bandwidth signals at approximately 77.5, 88, 112, 137, and 143 kilohertz (kHz), which are low frequency (LF) communication transmitters, can be seen on some of the plots. Figures B-1 (VOR on), B-6 (RCAG off), and B-7 (RCAG on) with the Loran C antenna at the counterpoise indicate a reduction of 5 to 8 decibels (dB) of the Loran C spectrum when compared to locations 2 (TACAN detector pole) and 3 (250 feet from the VOR). At location 2 (TACAN detector pole) the RF spectrum between SO to 87 kHz and 120 to 145 kHz was noticeably different than the spectrum at locations 1 (counterpoise) and 3 (250 feet from the VOR). The measured spectrum, which is nearly out of the Loran C band, except for the LF content (87kHz), is wide band, approximately 20 kHz. The cause of the near out of the Loran C band energy levels is unknown. The near out of the Loran C band spectrum was higher on the day the RCAG equipment was energized (reference figures B-8 (RCAG energized, transmitters not keyed) and B-9 (RCAG transmitter keyed). The RCAG antennas were mounted close to the detector pole and could possibly have affected the spectrum. This phenomena was not noti~ed at locations 1 (the counterpoise) or 3 (250 feet from the VOR) . -
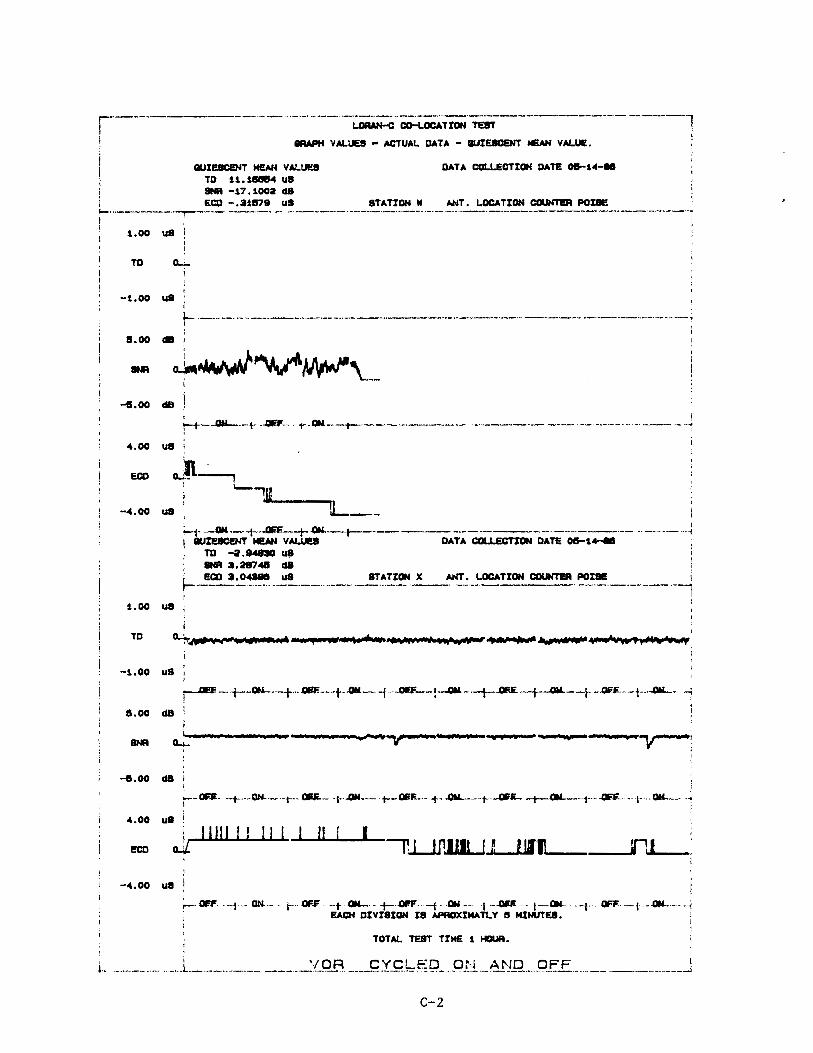
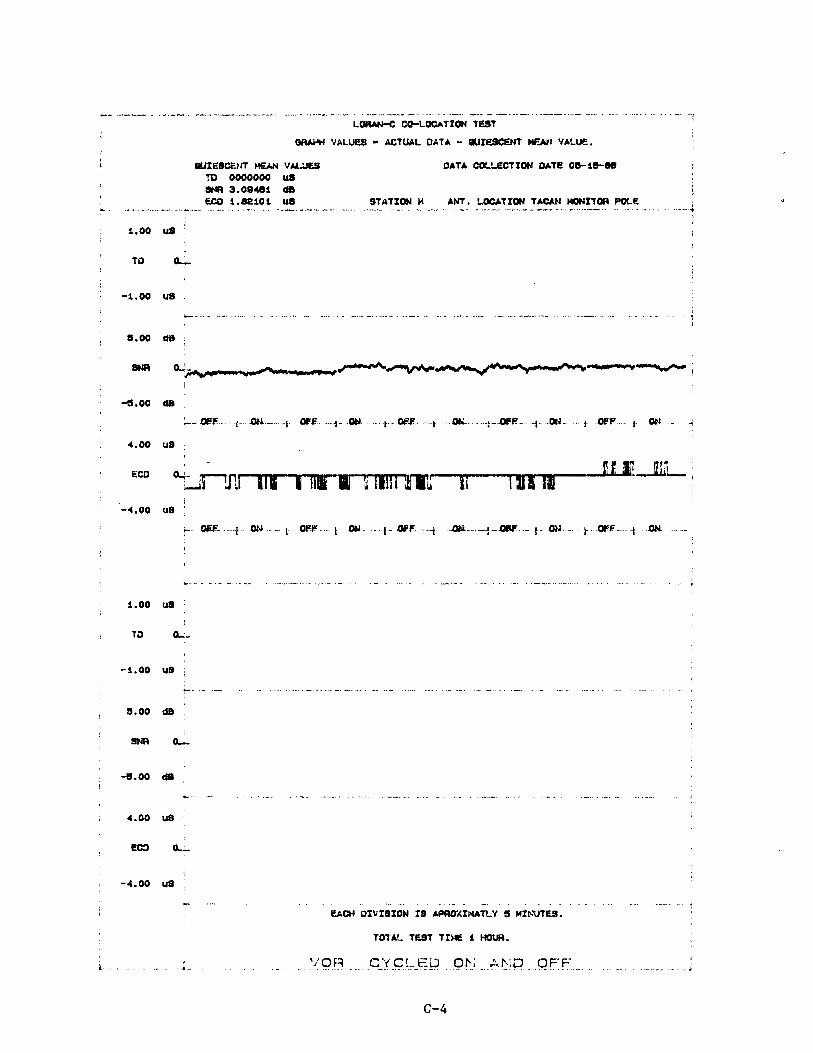
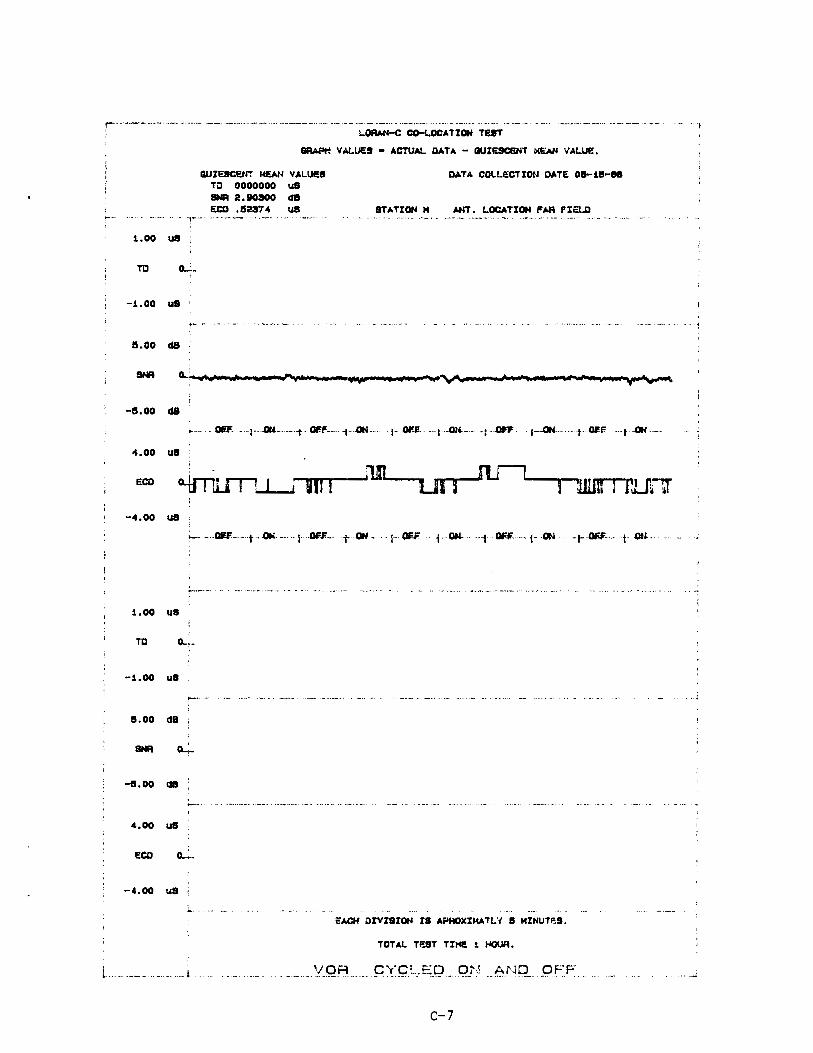
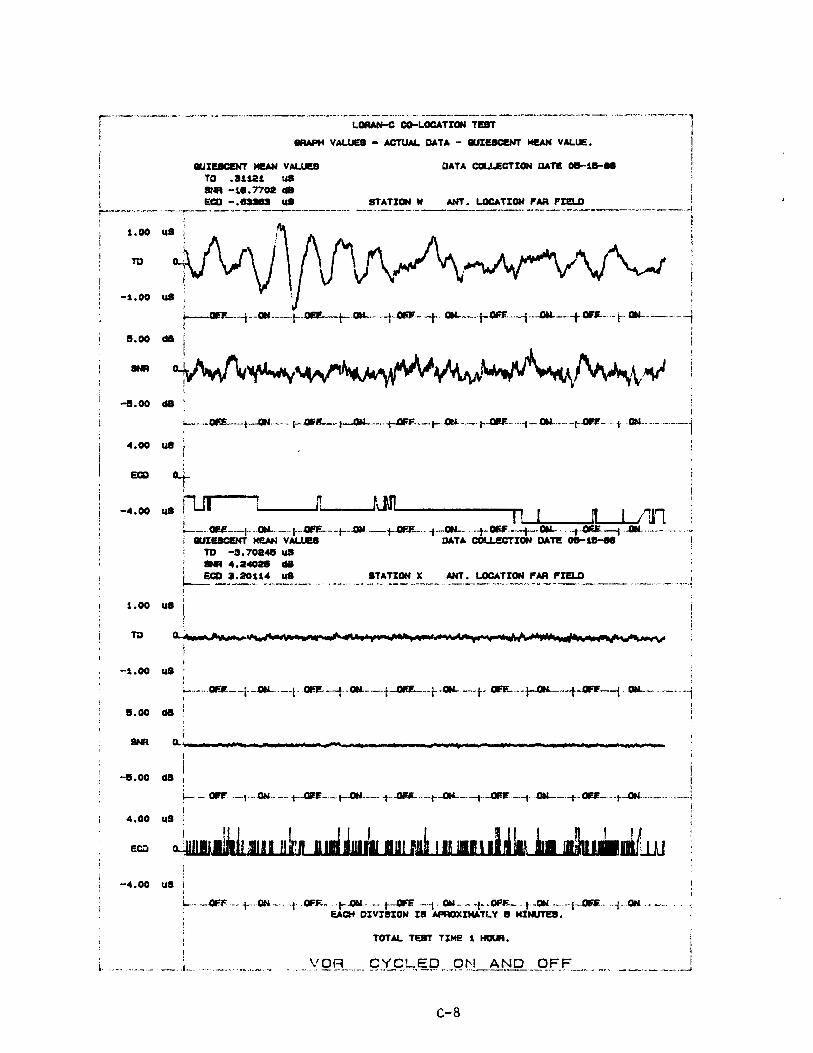
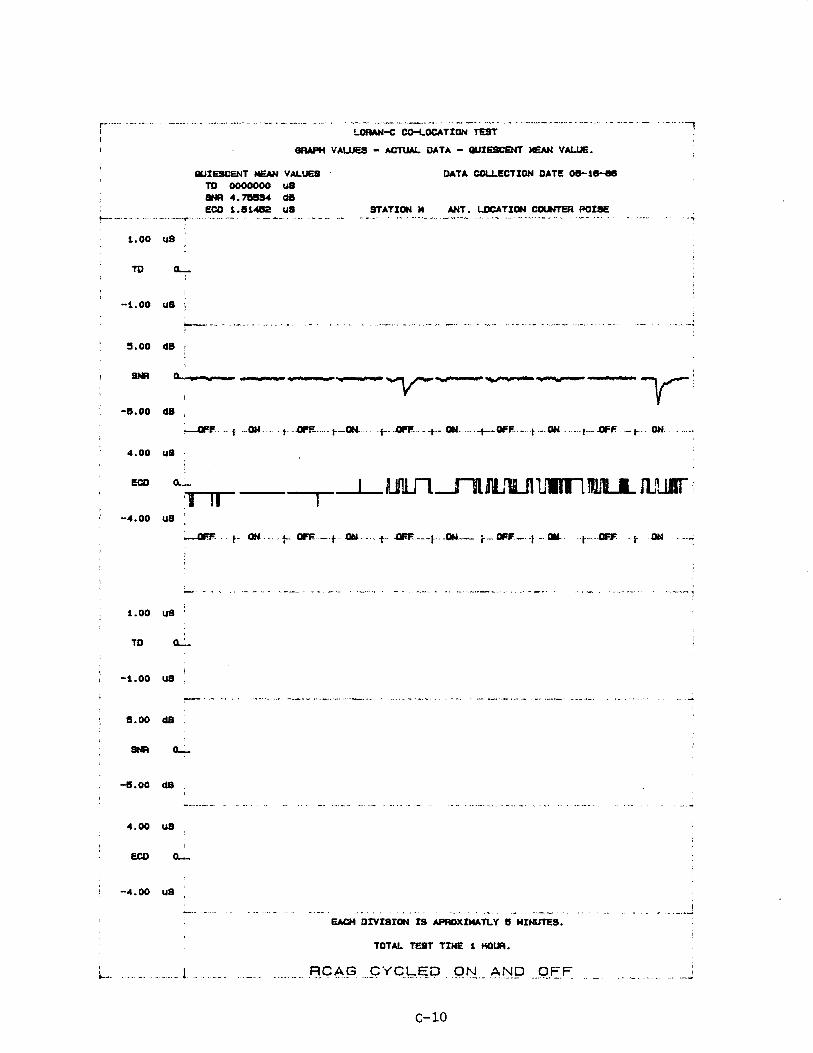
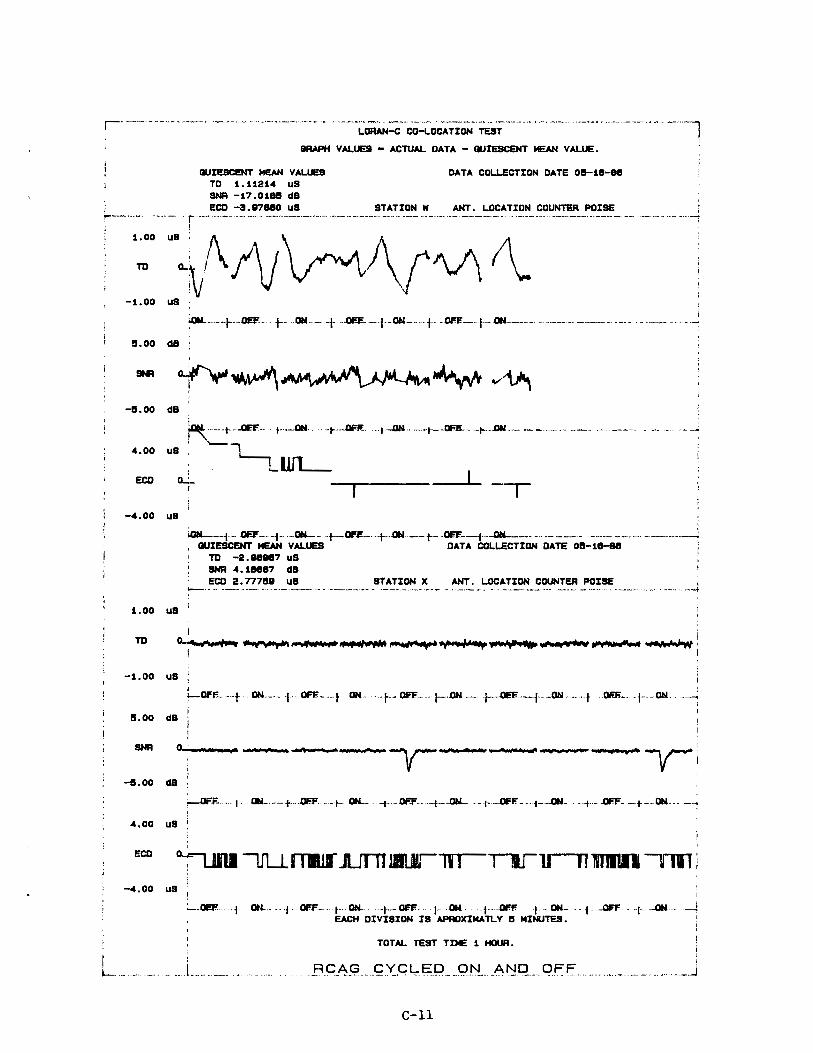
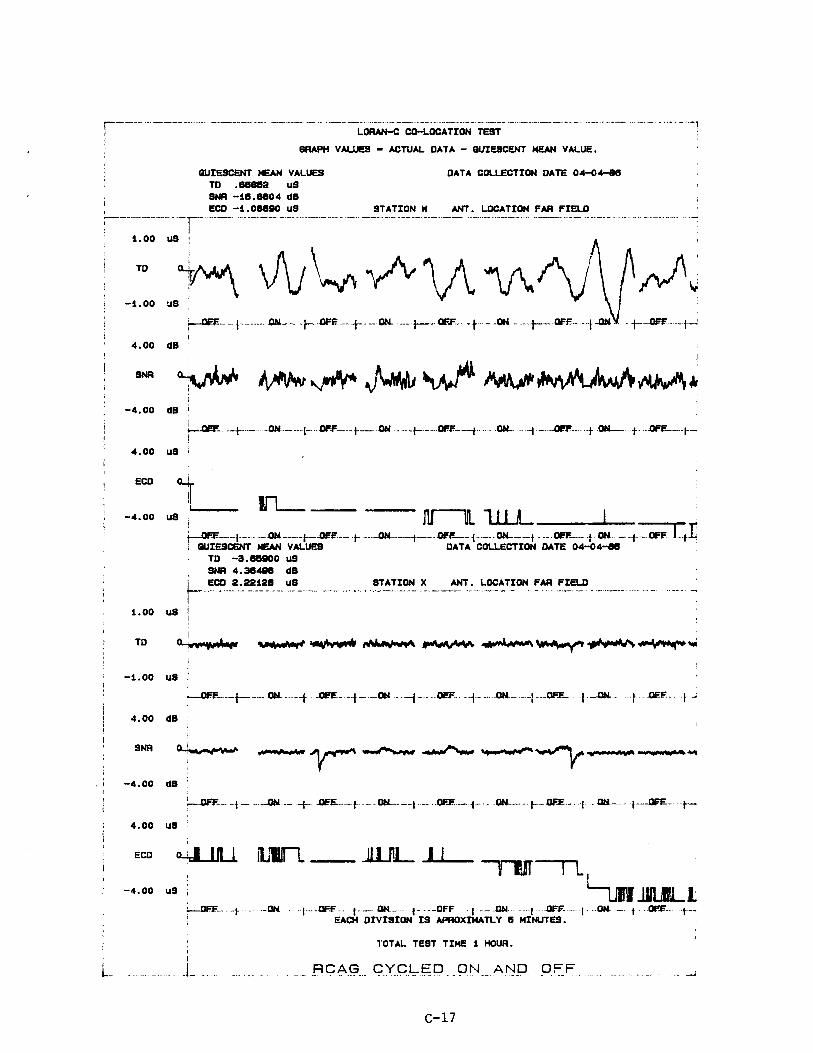
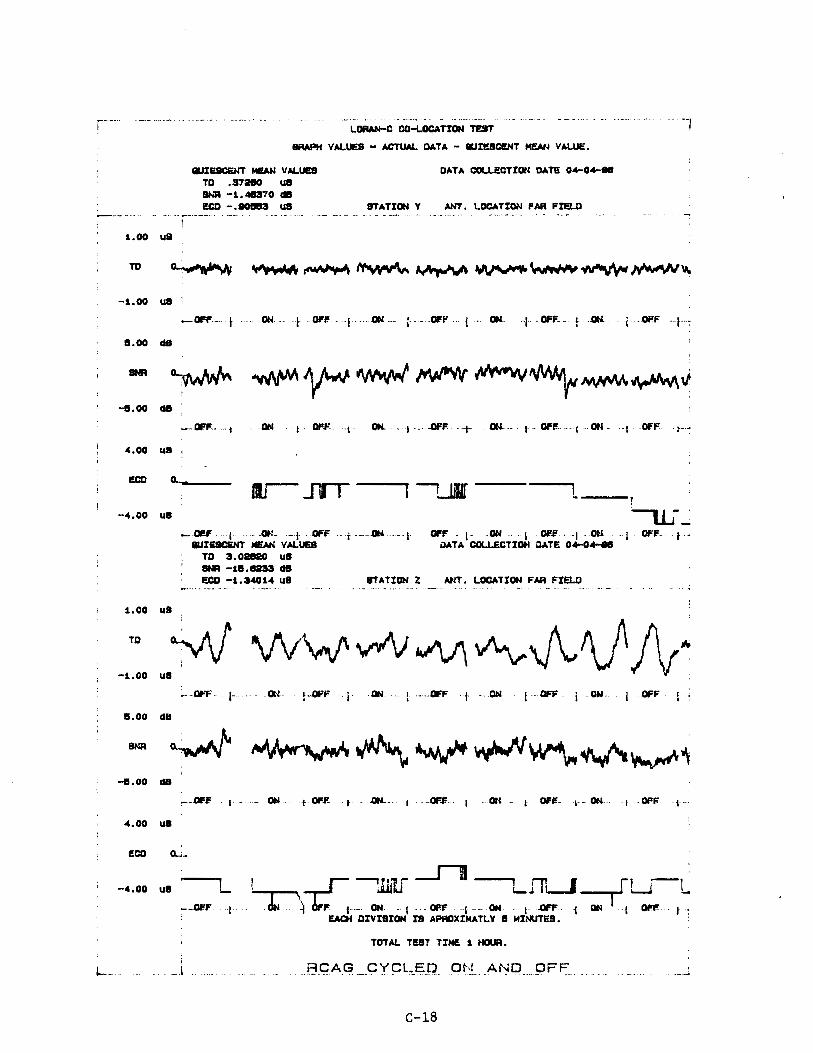
LORAN C MONITOR TEST DATA PLOTS. These are presented in appendix C. Change in TO's, SNR's, and ECD's are referenced to a 1-hour average plotted for the signals received from each transmitter. The preferred triad for the Northeast Chain 9960 GRI at the Technical Center is MXY.
Signals were received at times from all the Loran C transmitters in the GRI 9960 chain. Typical SNR's for the transmitters as measured at the Technical Center are listed in table 2. Stations M, X, andY are the only signals continuously received with a measured SNR greater than 0 dB. Therefore, the discussion of the test results will only be concerned with transmitters M, X, andY.
TABLE 2. 9960 GRI LORAN C TRANSMITTERS TYPICAL SNR' S MEASURED AT THE TECHNICAL CENTER
Station
*Preferred Triad
M* w X* Y* z
13
SNR dB
7
7 4
-15
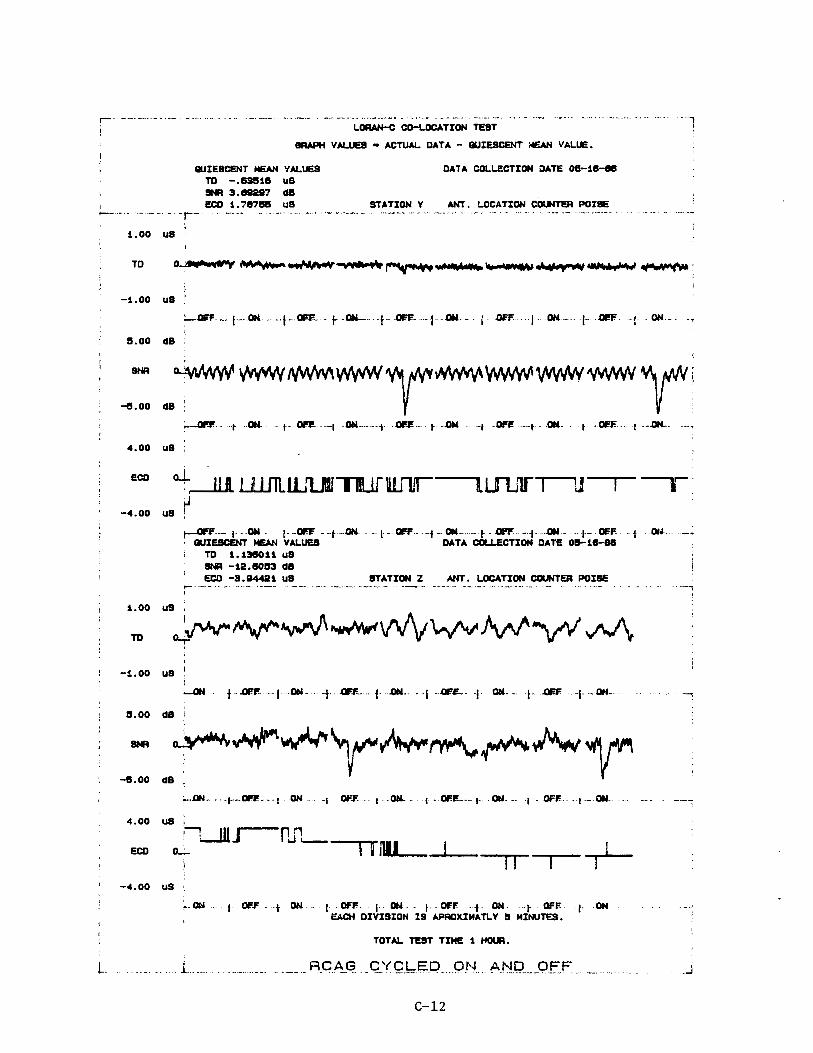
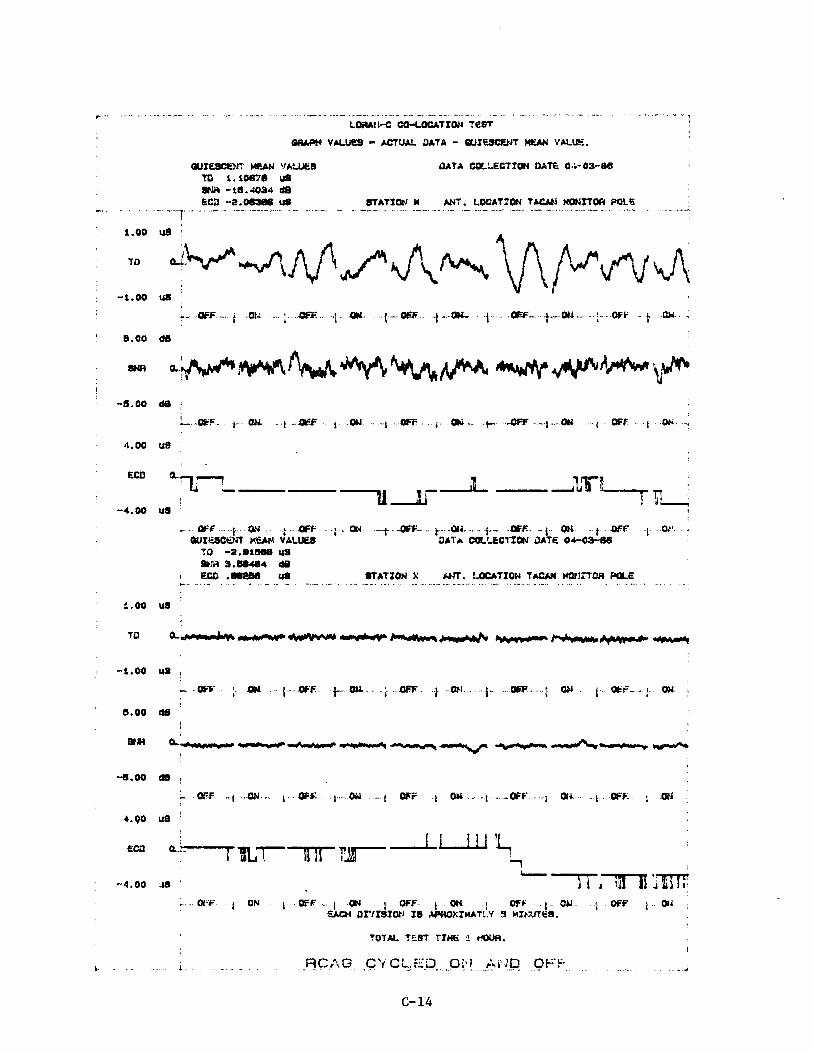
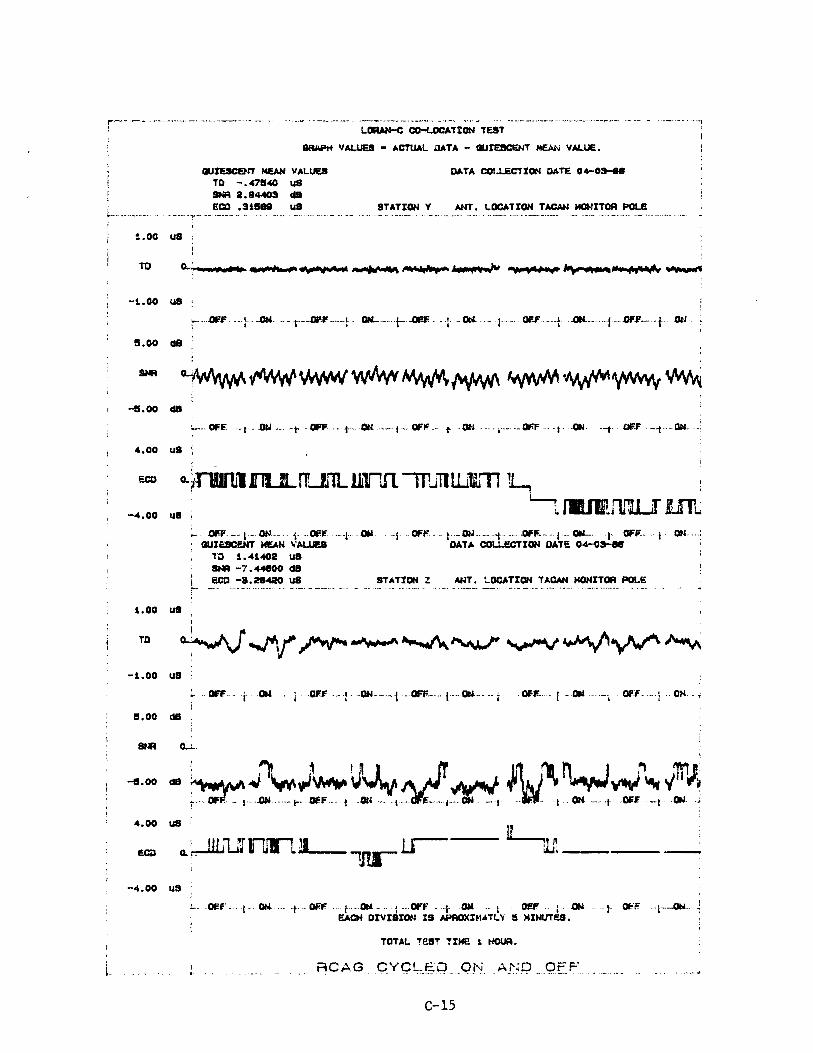
Figures C-1 through C-9 are plots of the Loran C monitor data with the Loran C antenna at the three locations for the VOR cycled on and off for 5-minute intervals over a 1-hour period. At all three antenna locations there appeared to be no relationship between signal perturbations and cycling on and off of the VOR. At the counterpoise there were two occasions where perturbations in ECD and SNR occurred coincidentally for stations M, X, andY. The cause of these perturbations is unknown. Mean and standard deviations (1 sigma) of the parameters were computed for the aggregate of the VOR off cycles and VOR on cycles, respectively. Mean +2 sigma values were arithmetically computed for the off and on cycles. The mean +2 sigma differences in the parameters between the on and off cycles for the data shown in figures C-1 through C-9 were calculated and are presented in table 3. The differences were small and did not affect the operation of the monitor receiver.
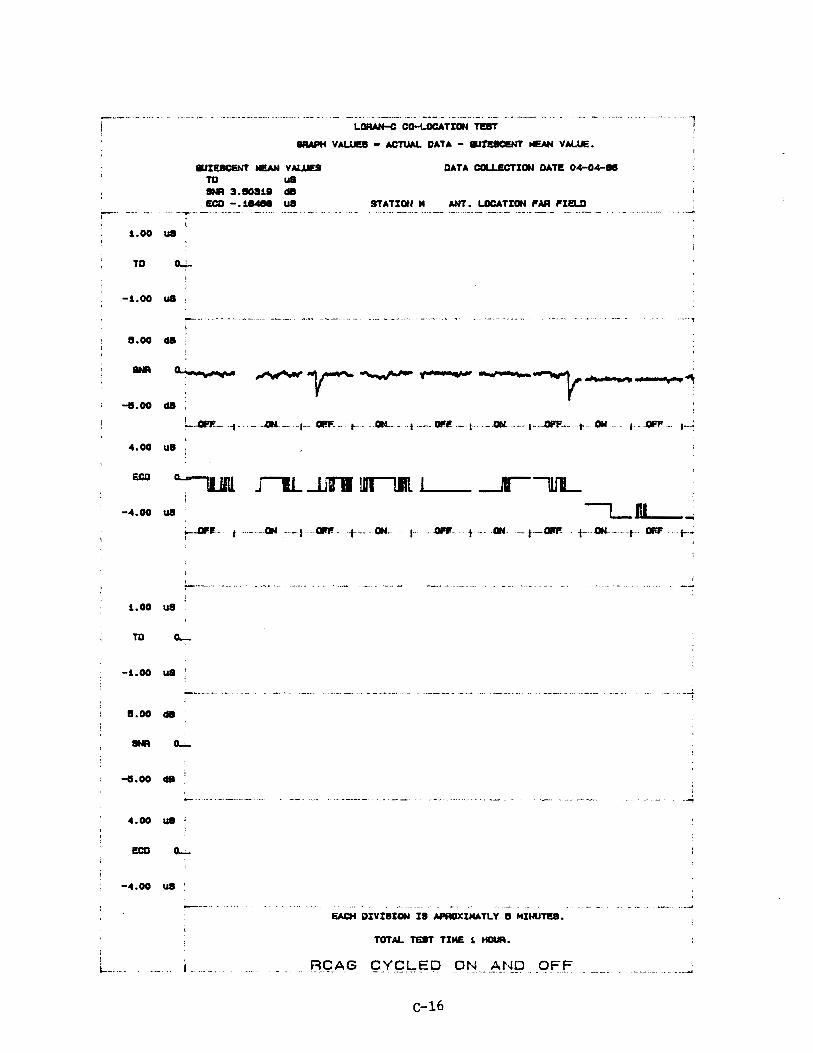
Figures C-10 through C-18 are plots of the monitor data with the Loran C antenna at the three locations with the VOR on and the RCAG cycled on (transmitters keyed) and off. At all three antenna locations there appeared to be no relationship between signal perturbations and cycling on and off of the RCAG. There were occasions where perturbations in envelope-to-cycle discrepancy (ECD) or SNR occurred at the three locations, but the occurrences were not coincidental with cycling on or off the RCAG equipment. The cause of these perturbations is unknown. Statistics as previously described are presented in table 4. The differences were small and did not affect the operation of the monitor receiver.
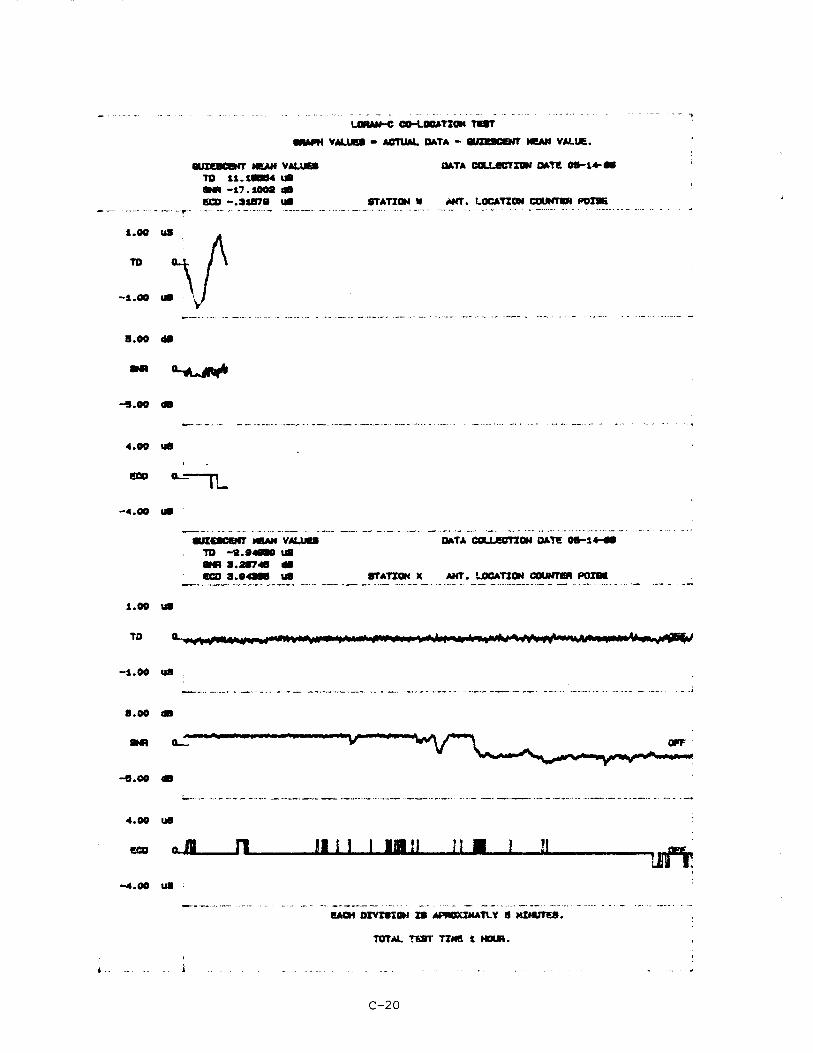
Figures C-19 through C-20 are plots of the monitor data with the Loran C antenna at the counterpoise. The VOR and the RCAG were off. The data indicate the quality of the site without interference from the VOR or RCAG. The TD's for stations X and Y are stable. Random fluctuations and a bias shift are evident 1n the SNR measurements for stations M, X, andY.
AIRBORNE.
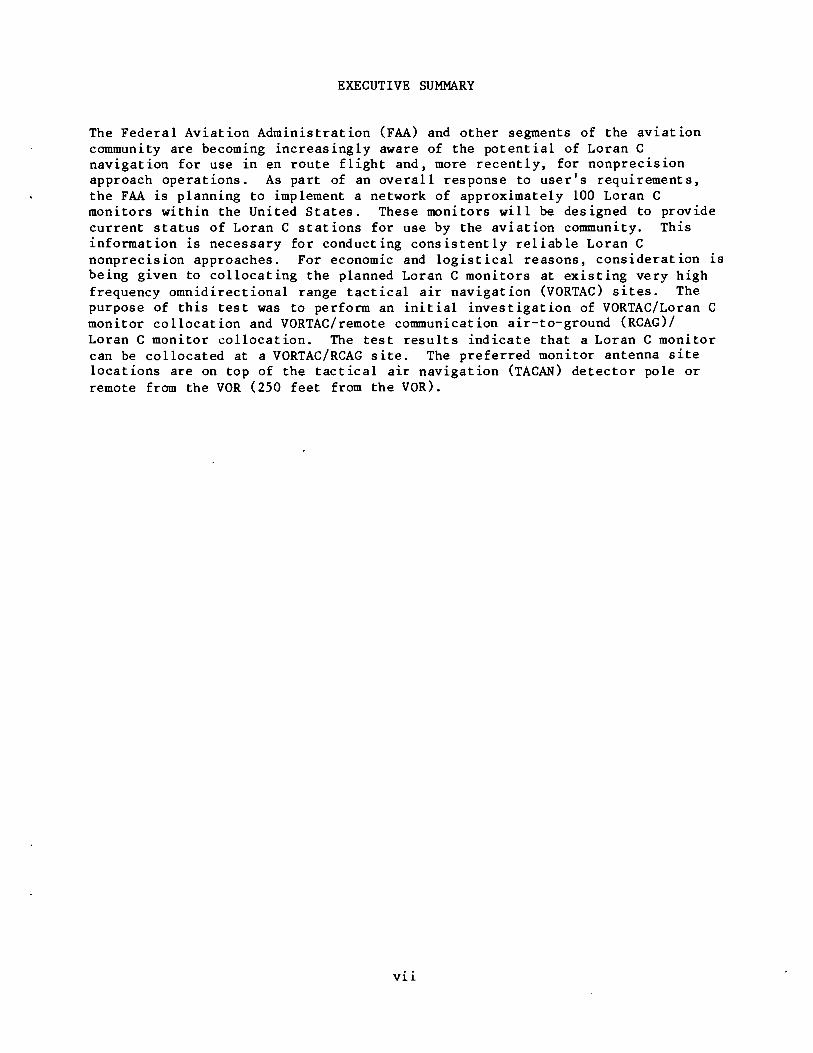
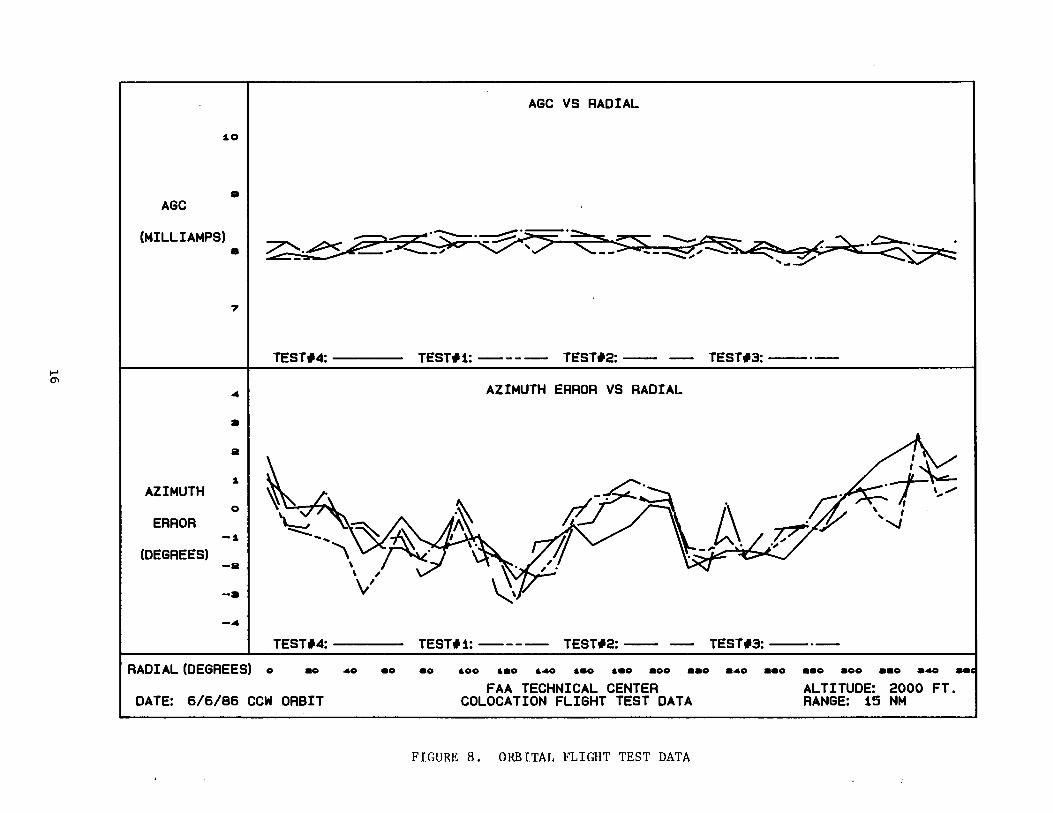
Orbital flight test data with the VOR energized for the Loran C antenna installed at the three test locations and the Loran C antenna removed are presented in figure 8. The orbits were 15 miles in radius and were flown counterclockwise at 2000 feet above m.s.l. Field Strength (AGC) and azimuth error (Related Documentation item 4) were plotted versus EAIR position reference. The field strength was essentially constant, approximately 8 milliamps, for all orbits. There were no disturbances to the VOR field strength attributable to the placement of the Loran C antenna at any location.
The azimuth error exceeded tolerances at several radials, with or without the Loran C antenna installed. The placement of the Loran C antenna appeared to make no difference in the characteristic azimuth error pattern. The percentage of modulation (30 Hz variable) exceeded tolerance (+2 percent) between 80° to 110° azimuth. The variation exceeded the criteria by-3 percent in the worst case for all tests.
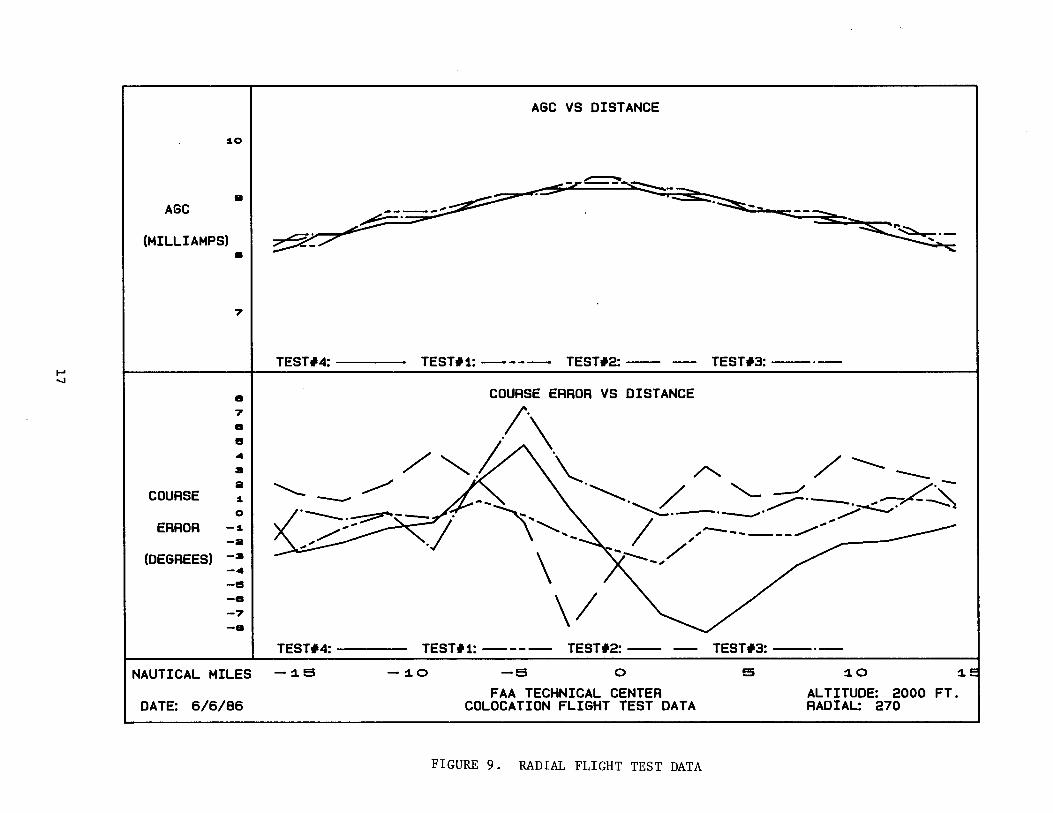
Inbound and outbound 270° radial flights were conducted at 2000 feet above m.s.l. Field strength (AGC) and course error as previously described are presented in figure 9. No unusual characteristics or perturbations were noted in the field strength data. The radial course error plots are inconclusive because of the characteristics of the site and the test flight altitude.
14
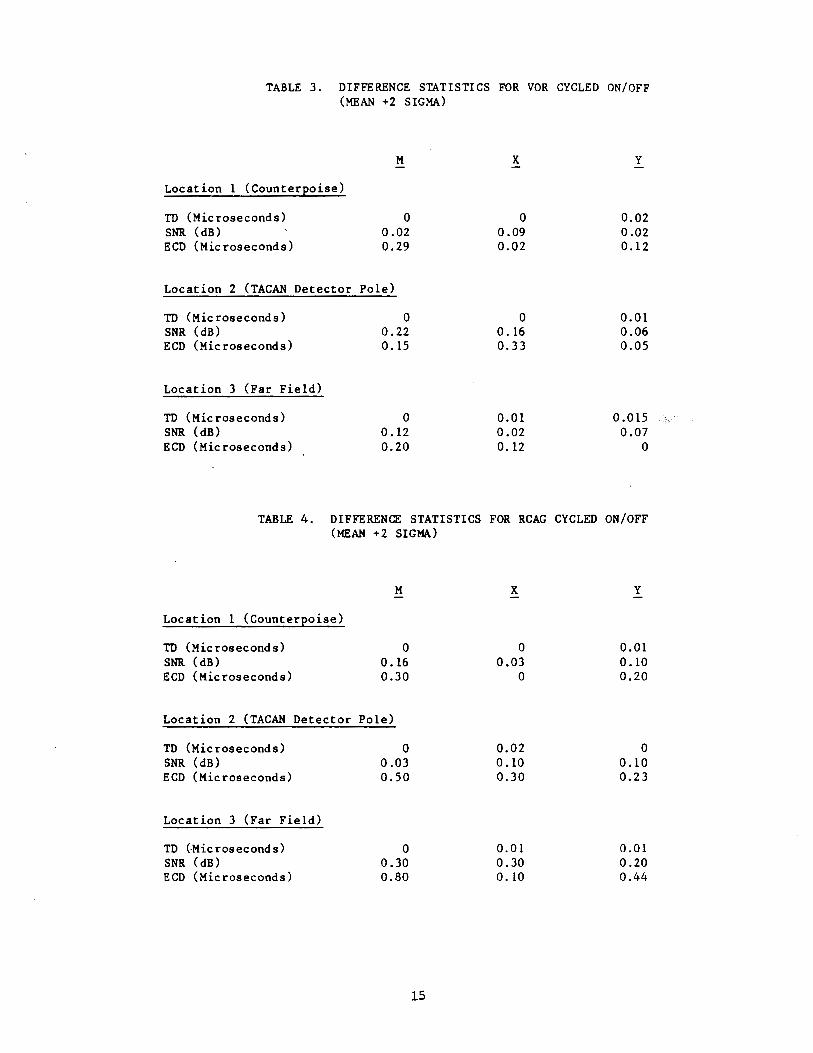
TABLE 3. DIFFERENCE STATISTICS FOR VOR CYCLED ON/OFF (MEAN +2 SIGMA)
M X y
Location 1 (Counteq~oise)
TO (Microseconds) 0 0 0.02 SNR (dB) 0.02 0.09 0.02 ECD (Microseconds) 0.29 0.02 0.12
Location 2 (TACAN Detector Pole)
TO (Microseconds) 0 0 0.01 SNR (dB) 0.22 0.16 0.06 ECD (Microseconds) 0.15 0.33 0.05
Location 3 (Far Field)
TO (Microseconds) 0 0.01 0.015 SNR (dB) 0.12 0.02 0.07 ECD (Microseconds) 0.20 0.12 0
TABLE 4. DIFFERENCE STATISTICS FOR RCAG CYCLED ON/OFF (MEAN +2 SIGMA)
M X y
Location 1 (Counter2oise)
TO (Microseconds) 0 0 0.01 SNR (dB) 0.16 0.03 0.10 ECD (Microseconds) 0.30 0 0.20
Location 2 (TACAN Detector Pole)
TD (Microseconds) 0 0.02 0 SNR (dB) 0.03 0.10 0.10 ECD (Microseconds) 0.50 0.30 0.23
Location 3 (Far Field)
TD (-Microseconds) 0 0.01 0.01 SNR (dB) 0.30 0.30 0.20 ECD (Microseconds) 0.80 0. 10 0.44
15
-,
:1.0
Iii AGC
(MILLIAMPS) •
7
I I TESTf4: 1-' 0\
I -4
a
a
:1. AZIMUTH
0
ERROR -:1.
(DEGREES) -a
-a
--4
I TESTf4:
RADIAL (DEGREES) 0 ao
DATE: 6/6/86 CCW ORBIT
40 ao
AGC VS RADIAL
TESTf1: ---- TESTf2: -- -- TESTf3: --·-
AZIMUTH ERROR VS RADIAL
TESTf1: ---- TESTf2: -- -- TESTf3: --·-
ao &oo &ao &40 &ao &ao aoo aao a4o aao aao aoo aao a4o ••
FAA TECHNICAL CENTER COLOCATION FLIGHT TEST DATA
FIGURE 8. ORBITAL FLIGHT TEST DATA
ALTITUDE: 2000 FT. RANGE: 15 NM
..... -...!
I
~0
Iii AGC
(MILLIAMPS) •
7
• 7
e IS
... a a
COURSE ~
0
ERROR -~
-a (DEGREES) -a _ ...
-IS
-e -7 -·
AGC VS DISTANCE
TESTf4: ---- TESTf1: ---- TESTf2: -- -- TESTf3: --·-
COURSE ERROR VS DISTANCE
;· ·\ / " l .\___ /'. / --._ -............... /' ........... / "- __/ /"' -- -.. ~. ~---. ...--;-,.r---,
·-..........-:;:::::::--- . ~... ~--·-· ............... --.., -/...... / \ '... I , ______ .,..... ... ...... • \ .. ..;o--.....,.. /" ---.. ,
\I TESTf4: ---- TESTf1: ---- TESTf2: -- TESTf3: --·-
NAUTICAL MILES - :1. E5 -:1.0 -ES 0 !5 :1.0 :1.
DATE: 6/6/86 FAA TECHNICAL CENTER
COLOCATION FLIGHT TEST DATA
FIGURE 9. RADIAL FLIGHT TEST DATA
ALTITUDE: 2000 FT. RADIAL: 270

CONCLUSIONS
1. Location 1 (Counterpoise). The very high frequency omnidirectional radio range (VOR) monitor data indicate that the Loran C antenna, when located at the counterpoise, may have a small effect on the monitor detector (0.4°); however, no effect could be determined in flight check because of the precision of the airborne measurement. The Loran C spectrum appeared to be reduced between 5 and 8 decibel (dB) at the counterpoise when compared to the signal at the tactical air navigation (TACAN) detector pole and the far field location. For these reasons it is recommended that a Loran C monitor antenna not be located on the counterpoise even though the Loran C receiver operated satisfactorily.
2. Location 2 (TACAN Detector Pole). The VOR monitor data and the flight check data were not affected by the placement of the Loran C antenna on the TACAN detector pole. Broad bandwidth energy above and below the Loran C band of 90 to 110 kHz were observed on the spectrum analyzer during the cycled on and off remote communications air/ground (RCAG) tests.
The broad monitor. The TACAN
band signals had no apparent effect on the operation of the Loran C The Loran C monitor operated satisfactorily for all test conditions. detector pole can be considered as an installation site for a Loran C
monitor antenna.
3. Location 3 (250 feet from the VOR). Location 3 appeared to be satisfactory with respect to VOR monitor data, spectrum data, Loran C monitor data, and flight check data. As far as collocation interference, it is the best location when compared to the other two locations. Site terrains and security restrictions may not permit consideration of this location for all very high frequency omnidirectional range tactical air navigation (VORTAC)/RCAG sites.
4. Locations 2 (TACAN Detector Pole and 3 (250 feet from the VOR). These are considered as acceptable sites for a Loran C monitor antenna.
18
APPENDIX A
VOR MONITOR DATA
Figure
A-1
A-2
A-3
A-4
A-5
A-6
A-7
A-8
VOR Monitor Data - No Loran C Antenna
VOR Monitor Data - Loran C Antenna at Location 1 (Counterpoise)
VOR Monitor Data - Loran C Antenna at Location 2 (TACAN Detector Pole)
VOR Monitor Data - Loran C Antenna at Location 3 (Far Field)
VOR Monitor Data - No Loran C Antenna, RCAG On
VOR Monitor Data - Loran C Antenna at Location 1 (Counterpoise), RCAG On
VOR Monitor Data - Loran C Antenna at Location 2 (TACAN Detector Pole), RCAG On
VOR Monitor Data - Loran C Antenna at Location 3 (250 feet from the VOR), RCAG On
A-i
Page
A-1
A-2
A-3
A-4
A-5
A-6
A-7
A-8

:I>' I
1-'
F G R 0 IJ IJ {I C H E ;' f~
'J OR tl ON 1 AZiMUTH i:~RROR
o.oo 1. 68 45.00 1. 31 90.00 ' 1. 02
135.00 1. 12 180.00 .97 225.00 .76 ~70.00 1. 49 315.00 .66
UUHNTAL ER~O~ AM?L PHASE
UUAORANTAL ERROR AMPL PHASE
OCTANTAL ERROR AMPL PHASE
INOU
0 A T A fbf ~ILED 86/06109 10:16:36
AZ Ii1UTH ERROR 22.50 1. 46 67.50 1. 82
112.50 1. 68 157.::iv .76 202.50 .69 247.50 1.49 292.50 .6tl 3 57. ::iO .80
"l 7 OEG .... , .. c .-. J, ._1. l' DEG
,~
• .:..J DEG 3i8.v OEG
.16 iiEG 105.4 HEG
1.14 liEG
FIGURE A-1. VOR MONITOR DATA - NO LORAN C ANTENNA
F G R 0 U N {I C H E C K II A l A lEST FILHt 86/06/09 11 :36:33 vor.: ttON1
ALIHUTH ERROR AZIKUTH ERROR 0.00 • 1. 58 22.50 1.28
45.00 1. 04 67.50 1.81 90.00 .89 112.50 1.59
135.00 1.17 157.50 .75 180.00 .93 202.50 .68 225.00 .75 247.50 1. 42 270.00 1. 91 292.50 .69 315.00 .66 337.50 .87
l.IUANTAL ERROR AKPL • 16 DEG F'Ht!SE 46.4 DEG
QUADRANTAL ERROR AKF'L .23 DEG PHASE 297.8 IIEG
OCTANTAL ERROR AHF'L .22 IIEG PHASE 109.9 [lEG
!J:" HHIEX 1.12 OEG I IV
FIGURE A-2. VOR MONITOR DATA- LORAN C ANTENNA AT LOCATION 1 (COUNTERPOISE)
F G R 0 u N li C H E C K D A T A TEST FILED 86/06/09 12:07:22 VOR liON1
AZIMUTH ERROR AZIKUTH ERROR 0.00 1. 91 22.50 1. 54
45.00 • 1. 27 67.50 1 • 73 90.00 .96 112.50 1. 42
135.00 1. 20 15?.50 .79 180.00 .92 202.50 .72 225.00 .80 247.50 1. 47 270.00 1. 56 292.50 .60 315.00 • 61 337.50 .85
HUANTAL ERROR AKF'L .26 DEG PHASE 46.3 [lEG
QUADRANTAL ERROR AKF'L .20 [1[6 PHASE 337.9 IIEG
OCTANTAL ERROR AKPL • 19 IIEG PHASE 11 0. 9 IIEG
):1 ' INDEX I 1 • 14 IIEG w
FIGURE A-3. VOR MONITOR DATA - LORAN C ANTENNA AT LOCATION 2 (TACAN DETECTOR POLE)
:x:-1 ~
F G R 0 U N D C H E C K II A f A TEST F ILEII 86/06/09 12:46:35 VOk HON1
AZIMUTH ERROR AZIMUTH ERROR 0.00 • 1.60 22.50 1. 24
45.00 1. 04 67.50 1. 74 90.00 .74 112.50 1.44
13::1.00 1. 22 157.50 .50 180.00 .90 202.50 .72 225.00 .75 247.50 1.42 270.00 1. 60 292.50 .51 315.00 .,..,
o ,} I 337.50 .ao
DUAtH Al ERROR AHF'l • 17 DEG PHASE 42.9 £lEG
OUADRANTAL ERROR AKF'l .21 [lEG PHASE 319. 1 DEG
OCTANTAL ERROR AKF'l • 17 [lEG ~·HASE 113.6 [lEG
lN[IEX 1. 04 DEG
FIGURE A-4. VOR MONITOR DATA -LORAN C ANTENNA AT LOCATION 3 (FAR FIELD)
F G R 0 U N D C H E C K II A T A TEST FILEII 86/05/28 10:51:57 VOR I'ION1
AZIHUTH ERROR AZIHUTH ERROR 0.00 • 1. 95 22.50 1 • 22
45.00 1 • 09 67.50 1. 83 90.00 1.01 112.50 2. 01
135.00 1. 26 157.50 .94 180.00 .84 202.50 4' • I
225.00 1 • 1 8 247.50 1 .86 270.00 1. 52 292. so .84 315.00 .67 337.50 1.02
IIUANTAL ERROR AHF'L • 1 B DEG PHASE 39.1 DEG
QUADRANTAL ERROR AHPL .24 DEG PHASE 292.7 [lEG
OCTANTAL ERROR AKF'L • 19 IIEG :x:- PHASE 134.8 IIEG I INDEX 1. 23 DEG l11
FIGURE A-5. VOR MONITOR DATA -NO LORAN C ANTENNA, RCAG ON

r G R 0 U N II C H E C K {I A T A TEST FILED 86/05/28 11:04:07 r
VOR HON1 AZIMUTH ERROR AZIHUTH ERROR
0.00 1 • 99 22.50 1.29 45.00 1.14 67.50 1. 82 90.00 1. 07 112.50 1. 93
135.00 • 1. 23 157.50 .95 180.00 .82 202.50 .52 22s.ov 1 • 16 247.50 1.86 270.00 1.16 292.50 .67 315.00 .67 337.50 .84
IIUANTAL ERROR AHPL .24 DEG PHASE 26.5 DEG
QUADRANTAL ERROR AMPL .22 DEG PHASE 311.9 DEG
OCTANTAL ERROR AHPL • 16 DEG PHASE 141 • 7 [lEG
IN[IEX 1.19 DEG
:t>' F GROUNII CHEC~: D A T A TEST FILEII 86/05/28 11:07:57 I
VOR HON1 Q)
AZIHUTH ERROk AZIHUTH ERROR 0.00 1.67 22.50 1. 28
45.00 1 • 15 67.50 1. 83 90.00 1.03 112.50 1 • 97
135.00 1. 28 157.50 .97 180.00 .85 202.50 .46 225.00 1 • 14 247.50 1.90 270.00 1.16 292.50 .77 315.00 .36 337.50 .96
IIUANTAL ERROR AHPL .24 DEG PHASE 1 3. 1 DEG
OUADRANTAL ERROR AHPL .25 IIEG PHASE 306.4 [lEG
OCTANTAL ERROR AHPL • 17 IIEG PHASE 146.6 [lEG
INIIEX 1.17 DEG
FIGURE A-6. VOR MONITOR DATA- LORAN C ANTENNA AT LOCATION 1 (COUNTERPOISE), RCAG ON

G R 0 U N D C H E C K {I A T A HST FILHI 86/05/28 12:15:50 1JOR HON 1
AZIMUTH ERROR AZHiUTH ERROR 0.00 I. 92 22.50 I. 45
45.00 I. 23 67.50 1.84 90.00 • I. 01 112.50 1.75
135.00 I. 23 157.50 .95 180.00 .87 202.50 .60 225.00 I. 11 247.50 1.97 270.00 1. 59 292.50 .53 315.00 .72 337.50 .88
OUANTAL ERROR AKF'L • 19 DEG PHASE 38.7 DEG
QUADRANTAL ERROR AKF'L .26 DEG f'HASE 319.9 IIEG
OCTANTAL ERROR AKF'L • 21 IIEG PHASE 140.0 DEG
INHX 1.22 DEG :J;< I
-..J F GROUNII C H E C I< I• A T A HST FILED 86i05i28 12:20:35 VOf\ KON1
AZIKUTH ERROR AZIKUTH ERROR 0.00 1. 95 22.50 1. 48
45.00 1. 31 67.50 1. 94 90.00 1.03 112.50 1.76
135.00 1 • 19 157.50 .97 180.00 .86 202.50 .60 225.00 1. 04 247.50 1 • 95 270.00 1. 55 292.50 .63 315.00 .45 337.50 .90
DUANTAL ERROR AHF'L .23 DEG PHASE 33.9 DEG
QUADRANTAL ERROR AHF'L .29 DEG f'HASE 323.6 DEG
OCTANTAL ERROR AKPL .23 DEG F'HASE 132.7 {lEG
INDEX 1. 22 DEG
FIGURE A-7. VOR MONITOR DATA- LORAN C ANTENNA AT LOCATION 2 (TACAN DETECTOR POLE), RCAG ON
F G R 0 U N D C H E C K II A T A TEST FILEII 86/05/28 12:26:52 VOR 110N1
AZHIUTH ERROR AZitiUTH ERROR 0.00 1 • 94 22.50 1.51
45.00 1 • 29 67.50 1. 88 90.00 1. 03 112.50 1. 73
135.00 • 1 • 22 157.50 .96 180.00 .87 202.50 .64 225.00 1. 09 247.50 1. 98 270.00 1. 58 292.50 .60 315.00 .45 337.50 .91
[IUANTAL ERROR AtiPL .21 DEG PHASE 33.6 DEG
QUADRANTAL ERROR AtiPL .29 DEG PHASE 326.2 IIEG
OCTANTAL ERROR Atlf'L .23 DEG PHASE 132.4 DEG
I NilE X 1 • 23 DEG
:x:- F GROUNII C H E C K D A T A TEST FILEII 86/05/28 12:49:21 I VOR 110N1
CXl AZitiUTH ERROR AZitiUTH ERROR
0.00 1 • 92 22.50 1. 47 45.00 1 • 31 67.50 1. 84 90.00 .97 112.50 1.68
135.00 1. 46 157.50 .90 180.00 .81 202.50 .63 225.00 1. 05 247.50 1.95 270.00 1. 62 292.50 .43 315.00 .38 337.50 .71
DUANTAL ERROR AtiPL .23 DEG PHASE 19.3 DEG
QUADRANTAL ERROR AHPL .31 DEG PHASE 325.6 [lEG
OCTANTAL ERROR AHPL .20 l1EG PHASE 136.8 l1EG
INIIEX 1.19 DEG
FIGURE A-8. VOR MONITOR DATA -LORAN C ANTENNA AT LOCATION 3 (250 FEET FROM THE VOR), RCAG ON

APPENDIX B
SPECTRUM ANALYZER DATA

Figure Page
B-1 VOR On, Loran C Antenna at Location 1 (Counterpoise) B-1
B-2 VOR Off, Loran C Antenna at Location 2 (TACAN Detector Pole) B-2
B-3 VOR On, Loran C Antenna at Location 2 (TACAN Detector Pole) B-3
B-4 VOR Off, Loran C Antenna at Location 3 (250 Feet from the VOR) B-4
B-5 VOR On, Loran C Antenna at Location 3 (250 feet from the VOR) B-5
B-6 RCAG Off, Loran C Antenna at Location 1 (Counterpoise) B-6
B-7 RCAG On, Loran C Antenna at Location 1 (Counterpoise) B-7
B-8 RCAG Off, Loran C Antenna at Location 2 (TACAN Detector Pole) B-8
B-9 RCAG On, Loran C Antenna at Location 2 (TACAN Detector Pole) B-9
B-10 RCAG Off, Loran C Antenna at Location 3 (250 Feet from the VOR) B-10
B-ll RCAG On, Loran C Antenna at Location 3 (250 Feet from the VOR) B-ll
B-i
o:l I
I-'
RCAG OFF ANTENNA AT VOR COUNTERPOISE 5/16/86 LORAN C COLLOCATION TEST MKR 98.8 kHz REF -10.0 dBm ATTEN 10 dB -46.10 dBm
10 dB/ ,-1---~--~---~-----~~-~ I I --· .. -···- ··i--··- ·-·-- ··-- t. -- .. -·· ··-··t··--. ---~---+·-···- ·- ....... -!-------~-----1--- ---- ·------·+- ····--·-··-··· --1·--------·-----1-- ----.-
1 I II ! ' I I I I I . I i I I ·-·---·-·--r·--- ------ r----- --·T·-- -··· -··r·~-- ---r-------- --· --~---r---- ---r-~-· -~-------
- - -- -~ ----- --.l-- __ j _____ j __ - -~ -, _J ___ --+--- ---~- ------~----· I I ll I i I II ,1' ! I : I . I ! I ' I . ------ --t ·-------~- -------·····+-·-· -.. --j--------- .... - ·-·-·----·f-··-~·----------t------------1-~------------·i-·------l I I I l I I I I - --~- --~ -j·-- t· ---+-- -- -- -- --- ---t- ----j-------j-· -· I I t I I I I ----------r----- ·----·-t· --------- --"·-----·-·t·-
1 · -·- ------+----.. -- .. i------·----·----r------
--- -~ ----- --- 1-------- ---- I ---t' -----~-- _J ____ J _____ _j_ __ _ ! · i · i 1 I ! I ! j I I I I I
-~-------··· --t· ----·-- -- ------·-----i---···-·-----~------- ! -- _____ _j_____ ---~----.. ----
1 l I I I I I I I --- --1-:rJ ·t;.t;-~ -r,: -- -----[ ---- -+- -- -t ----+ -- -+----
I I I
CENTER 100.0 kHz SPAN 100.0 kHz
RES BW 10 Hz VBW 10 Hz SWP 50 sec
FIGURE B-1. VOR ON, LORAN C ANTENNA AT LOCATION 1 (COUNTERPOISE)

o:l I
N
VOR OFF ANTENNA AT TACAN MONITOR POLE S/lS/86 LORAN C COLLOCATION TEST REF -10.0 dBm ATTEN 10 dB
I I I I 10 dB/
CENTER 100.0 kHz
RES BW 10 Hz VBW 10 Hz
MKR 99.8 kHz -33.70 dBm
SPAN 100.0 kHz
SWP 50 sec
FIGURE B-2. VOR OFF, LORAN C ANTENNA AT LOCATION 2 (TACAN DETECTOR POLE)
td I
w
VOR ON ANTENNA AT TACAN MONITOR POLE 5/15/86 LORAN C COLLOCATION TEST REF -10.0 dBm ATTEN 10 dB
10 dB/ .. - -
-~ ·-
ti~l -- ---~
.1 ~n ~
~A -·
tit '\ - -
--- r--( N~ ~ \ !------ ·-f---· 1
~~
.lj!J •. ~ I I l l~ , -
~ ~l' I~ r''~M ~-~ 111''
CENTER 100.0 kHz
RES BW 10 Hz VBW 10 Hz
MKR 99.4 kHz -35.90 dBm
! i I
I !
' --- ---
-·
-
~ ll
. ~~~LtAt WJ ~' ., I "I~~
SPAN 100.0 kHz
SWP 50 sec
FIGURE B-3. VOR ON, LORAN C ANTENNA AT LOCATION 2 (TACAN DETECTOR POLE)
td I ~
VOR OFF ANTENNA AT FAR FIELD 5/15/86 LORAN C COLLOCATION TEST MKR 100.3 kHz REF -10.0 dBm ATTEN 10 dB -37.90 dBm
10 dB/ I -- __ ] ___ - --l- -- - j ----i-----= ----1------- --1-------t --------t----1~-------·-- ---~---~--- --------r--------- ----------L------- ------- ----· --·----+--~--
- I I I I -------t-~---~---+-··--- ---1---~- -·--.---1·--·-·--·- -----,--.. --.-. -t--.. -·-
______ .. 1_~·-·----L- --+~·-t-·----- I --t--L----~-----~-~------·eot------·- ·- --- ----+--·-·---+-•
---r-------t-----~t----- I -----~-~--------~------t_~ -~~~t-~-~-- J.t ___ J
CENTER 100.0 kHz
RES BW 10 Hz
I r--~----·--
VBW 10 Hz
SPAN 100.0 kHz
SWP 50 sec
FIGURE B-4. VOR OFF, LORAN C ANTENNA AT LOCATION 3 (250 FEET FROM THE VOR)
o:l I
V1
VOR ON ANTENNA AT FAR FIELD 5/15/86 LORAN C COLLOCATION TEST MKR 98.7 kHz REF -10.0 dBm ATTEN 10 dB -40.70 dBm
10 dB/ I I I - I I i : '
-------~·---------t---------1--------- -- --L------t·--------lL·~-~~L----1 ' I I I I ' I -----·-·l---------t·--·--·- ·--- --- -------,----l-----t-----1------------~-------+---T,:-----t-·--1-----+----+-~-
l ____ ~----·------·-·--· .. - _l_ I I 1 I
------ ----~--- ____ __,_ _____ Jlt-------- itu.:.l --~---t------+------~--1 I I ' I I I ------·------~-~----~------ ---l--- . --t------+--~·--t--
1 I ' I I l I ---------------------~----~-wri----t---t~--- - ----~----- 1.--~----r-
' . r------1 __________ J ______ fll_[\ __ j ___ r---l+--
1 \tj ... I . - I
CENTER 100.0 kHz SPAN 100.0 kHz
RES BW 10 Hz VBW 10 Hz SWP 50 sec
FIGURE B-5. VOR ON, LORAN C ANTENNA AT LOCATION 3 (250 FEET FROM THE VOR}

l:d I
0\
RCAG OFF ANTENNA AT VOR COUNTERPOISE LORAN C COLLOCATION TEST REF -1121.121 dBm ATTEN 1121 dB
MKR 11210.121 kHz -45.90 dBm
'" dB/ ,------ -~------- _1 ___ T- --- -r- -T ---T -- ---r---r---- r---l~
I ' I ( : ! ' I ' •- ' L f · ' ' t - • -- --- ----1
I ' I I I I ' I i , , ! · r r !
: , i ' ' • . \
i :
t I . •
' '
I I
i f i
r-i I r
. --
t- -I
-- t -
I
-- i-I I
I' ~ ..
... I·
' II I I ' ,' ; : •i ; i
' -'
fl i :- - - il j, ' ll
!·., :~- - +Jt ;~:i:: I . ,
u . -!
\
' -
·- I l
------------·-----~ _______ j__ ______ ..!. •.. ----·--·--~----
CENTER 10121.0 kHz
RES BW 1121 Hz VBH 1121 Hz
I
~ - -- .. - .l.- .,._ - -·'"'
' . ·-
.......
I -·- -- .. - ·-·
SPAN 11210.0 kHz
SWP 50 sec
FIGURE B-6. RCAG OFF, LORAN C ANTENNA AT LOCATION 1 (COUNTERPOISE)

t::Jj I
........
RCAG ON ANTENNA AT LORAN C COLLOCATION REF -10.0 dBm r-------r- - -- - -,
10 dB/ j ! 1
I
' I I i ' I ~- • I
I I
I i i I • t-I
I I I ' ~ f
i
VOR COUNTERPOISE 4/4/86 TEST
ATTEN 10 dB MKR 100.2 kHz
-44.70 dBm 1 - ··- --l- ----- -- T-- --- ___ l ________ r ___ -·-r-·· ---- -- T-·--1 t t • l ; : j 1 I l . • , . ___ _
' : . : I
_,
! I ~ 'i L . -- ~ I ., !I :r 1 j, ; . ' I
I
I .. ---,
t , I . ---·-----·-t ~ -- ' . I
I ·-·--, I ! !
---1 I !
----1
I
I I ~
' I' I
I· l· - · J j; I I ' ~,~ I • I ~
1~\Jj·
I ----!
-~-· . r_ .. · -~ -· ,, I
.1 • · · ii I II ~ I i . -- -- ·-i
~ ~ . _~ . r: '
lA..J~ -----·--- .... .:. ·--···------ __ _j ---.-.J. ____ . --· ·- ··-·--·· .. .-_____ ._ ... -· ............... ---- ·--~·· ---~ .. ------- . ...- -·-- ....... - ---· ... - --- --
CENTER 100.0 kHz SPAN 100.0 kHz
RES BW 10 Hz VBW 10 Hz SWP 50 sec
FIGURE B-7. RCAG ON, LORAN C ANTENNA AT LOCATION 1 (COUNTERPOISE)
t:1::l I
Oj
RCAG OFF ANTENNA AT TACAN MONITOR POLE LORAN C COLLOCATION TEST
4/4/86 MKR 100.0 kHz
-33.40 dBm REF -10.0 dBm ATTEN 10 dB
10 dB/ 1-· _: . -,ii -=r~-]-~] ___ J ______ _ i f I I I ! I i I I I ~ t
! I ! l l ! -------+------ -! -- ---1------- ---~---------~---- ----·-r--·------~~------ ----r ------T-
. ___ L __ J_ ' ! I
! i
-· ---t - ..... I i
! ·- --1
I
' I I I
r J -~--- _ .I .J ___ . _____ .
i - --T
I . -~- --- -·--- r----- ---
~ -I
i
1
! . --;-- -
-r
! i I -----·- --r------- . _ ..... ! I ,
--~- ----r-------·- ~------··· ----~-r --1 I .
1 ;1~-l ! t ; ; ~ l ------ -- ______ j,_ - -1------+------------ ~----.. -- ..
' I
-· ...... .-----4---1
. - t--···
I I
~
--· -----1------- --+- ---; i ' ' I
-- --L------t -- . -·· --· -- ----i
I I
!
)
...........L...~--·-·
CENTER 100.0 kHz SPAN 100.0 kHz
RES BW 10 Hz VBW 10 Hz SWP 50 sec
FIGURE B-8; RCAG OFF, LORAN C ANTENNA AT LOCATION 2 (TACAN DETECTOR POLE)
t:d I
\0
RCAG ON ANTENNA AT TACAN MONITOR POLE 4/4/86 LORAN C COLLOCATION TEST MKR 100.2 kHz
-30.60 dBm REF -10.0 dBm ATTEN 10 dB
10 dB/ r r- I I I ·-r ~----------------+- --- -+-------~--------1-- -------t·--·--- --t--------1---
t-·------t----------t-··--------+--·-- ----+-----~--: --·-·· ---+------+---- -----+-----t
ti
f-- -------~-- ·- +--
...... -------· t·-------- -+-- ·------+--·-------+---
,_l\,\~_ -+-------+------4
I
t-----------f-~------+-----ll-+---·---f-f:-H+--f-·---~-J -----l---------f-----·-1-
t---·--··-+---··---t-· --I_ __
.----------t----------+ ---·~-4-.. o---
! ! I I I ! I
,wm,~-------1 - ---i- 1-··---t-------·-r-- - -1
!rllM~- : ___ j_ __ _ ___ L _____ L ____ t.. ____ _ !
~ )
1- ! I II - --- -- - _L_________ -----'----- -- ----- j_
CENTER 100.0 kHz SPAN 100.0 kHz
RES BW 10 Hz VBW 10 Hz SWP 50 sec
FIGURE B-9. RCAG ON, LORAN C ANTENNA AT LOCATION 2 (TACAN DETECTOR POLE)
t;d I
...... 0
RCAG OFF" ANTI::NNA AT FAR FIELD <4/4/86 LORAN C COLLOCATION TEST REF" -10.0 dBm RTTEN 10 dB
MKR
·-.,.--·-- - -- -10 dB/
1"1.2 kHz -37.40 dBm
.__.._ -t--·-·-+----f----- ---·- ····---f--r -+----4--·-· _j : ----+-, --t-
. -+-- ·--+--_L . ·-t---·
1------+-----·-
------i-·--. t~ r- ~. ~--t------· .. --·--·~u ·-~·~
I -i ! :I i l I . I i.,
~Jtd~JJ~~~ ·- -1·--·--·-t----t-----~~- :~~IJ,-. ~ I ·w~--
.J.---~-·-·-L _.._ __ _ CENTER 100.0 kHz SPAN 100.0 kHz
RES BW 10 Hz VBW 10 Hz SWP 50 sec
FIGURE B-10. RCAG OFF, LORAN C ANTENNA AT LOCATION 3 (250 FEET FROM THE VOR)

O;j I .... ....
RCAG ON ANTENNA AT FAR FIELD 4/4/86 LORAN C COLLOCATION TEST REF -10.0 dBm ATTEN 10 dB
MKR 100.2 kHz -39.00 dBm
10 dB/ ~------~-:~ ----•··---=~----[__ -t-~----·+--··--- --t--- -·
----··- -L---.. --.. ---------·-I
t-------t---·-----···-- -·--·--
-----+----···-.. ··--·--
t---11 -P1ntt-t------- J_ ____ _
--+--···-..l..--1 --+t-t-
i
CENTER 100.0 kHz SPAN 100.0 kHz
RES BW 10 Hz VBW !0 Hz SWP 50 sec
FIGURE B-11. RCAG ON, LORAN C ANTENNA AT LOCATION 3 (250 FEET FROH THE VOR)
APPENDIX C
LORAN C MONITOR TEST DATA PLOTS

,-------- --···----·--·-·-·----······· .......... ____ , ____ '·----- ···-.. ---···-··--·----··. ----·-··"·-------·---- --- . '
1 LOAAH-C CO-'-CICATION TEST i ! SRAPH VJ.I..\JES • ACTWd.. llATA - QUiesceNT Mt".ArJ VALUE. I
QlJIESCENT MI!AN V AL.Ul!S TO 0000000 uS !INA 3. 71240 d8 ECO 1. 781148 us
~------·--·----- .... --..,..----·-- --- - ... - -···-··--- ···-
' I 1.00 us :
TD o .. L
-1.00 us
STATION M
~-----·-·- -- ____ ,._ ·---------------- ----- -- __ ., ____ ,
IS.OO d8
DATA CO!..L.ECTION OATE 08-14-·88
ANT, LOCATION COUNTER POISE
I .. -·· ... .J
:..:..--ow,._.., ______ • __ ., ___ ,. __ ..,_~-... ..,. __ ..... ,..,_.,..,.------·---... ~ .... ...., ,.. ~~ ~ r i
-e.oo dB
-ui-Tln.rrrrn._, ;..._ __ _
llir -4.00 us
1.00 us
I TD 0-;....
-1.00 us
~-------.......... _ .................... -····----. ________ .... _ ................... "
15.00 dB
-e.oo d8
4.00 us
i ECO ~
-4.00
I
L---··
us i t-··
EACH OIVISION IS APAOXIMA TL Y 5 MINUTES.
TOUL TEST TllE 1 HOlln.
C-1
~lllill"lt[ I I
. - . ,
,_J
........ .J
QUIEBCl!NT MEN~ VA!..ueB DATA COLLECTION DATE 015-1+-88 TD U. US!J84 uS 8NR -17.1002 d8
I ECD -.3US79 US STATION W ANT. I..OCATION CDUNTI!R POISE ~--.. ------···-r--- ---·-· ·-·-----·--··-·····-----------------·-·"'"'_ ....... -----------·----·--------------~ ~ l.OO us ) I
i !
TD o..;.. I
-t..OO uS i ~-----_ ..... ·----------.. --.. ---.. ----------·-.. ·-·--------·· --·--·-·-··-----------.---.. ·-----·-,
IS.OO dB I
~~~~'----15.00 dB
' ! rt--...ON----t·-.lJI!F .. --r-GN.-----t--·- ----·--·---·- --·------·---- -·-·----- -·---· -·- ____ .,;
4.00 us
eco «411._:___, . ~..-..,_.u __ ___, L __ _
-4.00 us I
~i---DN-;-.-01$----t--'IM--+-----------------------·---------------··--·) 1 CilUIE8CI!NT MEAN VALUES DATA COI..U!CTION DATE 015-14-815 ·
TD -a. 84830 u• , SNA 3.28748 dB i I!CO 3.043118 uS STATION X Nlf. LOCATION COUHT!R P0%81! i t-------.. ----··------------- ·--------------·--· --·-·-- ----·-------- -~
1.00 us (
TO
-1.00 us
IS.OO d8
a-L~~~---.-~ ...... --.~~---~~~~~~~·~~==~•••-----~~•w•-·•~•~~~----·~~~-·~-u.-~~~~: -15.00 dB
4.00 us
ECO
I I!IIJIJlJI oJ.
II I I'LJ.nllll I ~ IIIJ1 ____ _.lllL.L.I _
-4.00 us
~- ,., ----1 -- au ... · i- .. llf'.E -t· 4N-- -t- .QI'F .. -t · ON-- ·I ---Oiil£ -- t--ON. --t· · aFF. -i- -.ON------; I!ACH DIVISION IS APAOXIMATt.Y IS NIMJTES.
TOTAL TEST TIME i HOUR.
C-2

r-·· ·-··-·- ... -· ... ·--·--·- -- .. ------.
1.00 us :
TO
-1.00 us
15.00
SNR
-15.00 d8
LORAN-C co-LOCATION T!!ST
aRArH VALUES w ACTUAL OATA - QUle9CENT ~AN VALUE.
QUIESCENT MEAI-l VALU£8 TO -.49-\U uS INA 2.30784 d8 ECO 1. 7!198.C. us STATION Y
DATA COLLECTION OATE 06-1~-88
ANT • LOCATION COUNTER POISE
r· Of'JL. ·i-· ON.--- I--OFF. t· .QN. ... ·-t··· Of.i"-. ·l--ON. .... ·t .QifF- • 1 .. ..QH .... i .. OFf: ... ·t .. QN .... ,
4.00 us .:·'·. __j. ·-,,...--.., ,.,-------, s-- \ j 11 .....__.... E::CD 0..... ..
:...1 ______ ___.'lJ.L._·----.., - - L1f.
-4.00 us
1.00 us
TO
; .... QFF ... 1-... 0fL .. ---t--Dl'f' ·1 ON----t--OF.i"-- ·j---ON----;---OFf' ... -t--.OW.·---·1· . .QFF ... l" 1»>1 QUUSCEHT ME»! VALUES OAlA CO"..J..eCTION OUE 08-14-88
TO 1.3~51 uS 8NR -18.34?8 d8 !CO -3.88433 us STATION Z ANT. LOCATION COUNTER POlS£
-LOO us I
·! - Of'J' .. i. Qt.!_
5.00 dB
-15.00 dB
:=•--Jiffl t· .. -- - lLr---; 4.00 us : ~---·----
-OW. .. --tOFF. i .... Qtl ..... : ... OFF ... , ... QtL--t---Of'f' ... t .. ~ -· ---·---
e.co a.......
--\.00 us
~-OF-I' - 1 ... Q.I -- l - OFF . ·t· QIL. t - Of;'!' 1 OU . 1 Of'F 1 ~~ 1· . OFF. .()N EACH DIVISION IS APROXIMATL'f B l-IIO'ItJ'ri!S.
TOTAL T~ST TII'IE 1 HOUR,
~ ..
C-3
i ,. --~-.I
1.00 us :
TO o+
-1.00 us
D.OO diS
-e.oo eta
-4.00 us
ECO
-'1.00 us
.......... ··--- - -····· ... ··- ·- ~- ··- .. . ... - ...... ~ .. -- ·----- ... -- . ----·······- -·~· .. ···- . ---- ....... -· ''! LOAAN-C Co-LOCATION T!!IT
GAioiltf VP.LUI!S .. ACTUAL O~on, - GUII!SCENT MF'..AI'I 'IAL&Je.
GUIESCEUT M£AN VAl.UES TO 0000000 uS SNA 3.09481 d8 ECO 1.82101 uS
DATA COL~ECTION DATE OD-18-88
STATION M ANT. LOCATION TACAN MONITOR POLE .... ~
;... OlifL . +· ON .. ·- I CIF.i". .• ~ Ql.l. • t·· OFF . ·i ..A»L--· -t- .QIIF ·- t . .OU - . r OFF- . i · Olll · .
1.00 us
TO CL-
-1.00 us
15.00 d8
SNR 0......
-tS.OO d8
-4.00 us
e:co 0-:-
-4.00 us
EACH DIVISION IS APADXINATLV D NINUTES.
T01 AL TEST TI)E t HOUR.
J. '/OF~
C-4

o ·- ··~-···· -·-·--· 0
•• -- _,., ·~·- 0 0 ----·ORo- ...... 0 0-V -·-··- 00°o 0 0° ··-···--·---- 0 ... _. ... ~--· -·-··· --·---·-· -,
LO~I-c CG-LOCA TION TEST
GAAPtf lfAI..U£9 • ACTUAL OATA - GUIESC'ENT 14EAN 'IALLJS.
QUIE..'ICENT MEAN VAI..UES TO 1.13202 uS ~ -1e.:mse dB F.CO -s. 038815 us
Oot.TA cou.ECTION OATE 0!1-18-··H
STATION N AtiT. LOCATION TACAI-l HOI'IITOA POLE ·--·-·- --·-·~. --·-·r-···-·-··--· ----- - ------·. ···--·
!
1.00
TO
-1.00 us
15.00 dB
•·5.00 da I
:..DF.F-- --~--QJ.. ... J--CIFl'-- .. 1 ... w.& -··t .QP.tL t·· 01. ·-·-t--OFf' .. -+-
... oo us
ECD o...;_
i
--4.00 us
' ..... .1 __ _, - r !T I
;_g,.,JL ... I -0.1..--.:· _Of.f.' .. -i .. ...OW.----i · QFJ<. ···t Cit~-- ·-l -4F.fl · + ········· .... · ····
1.00 us
GUIF.8Ct!NT MEAN VALUES OATA COt.LcCTIOtl !lATE 0!1-111-88 ro -a.at:r-43 us ~ a. 78871 dli ECD 2.98143 u8 - --····· ......... -··-'-·-··- --···
I
STATION X ANT. LOCATIOtl T.-C/>N z.tO.'II'"!"OR POLE
TO 0 .,....... ..,.._, 1 .,...~,_,~. •'ro.~;.,~...,._, l ... fl ~~""""'•"'..,
··~.00 us
'---OFF ~ ----j OP~ j--ON .. .tJF-E .. -·i·· .. .ou. ····I· tJFr; __ t---ON-.. ·f' -OE." ()),1.
15.00 d8 '
-e.oo dB
4.00 us
ECD 0,~.- ___11 m1 m Ul.I'J1JiL.Jll.L11LrUI .J
j -4.00 us
i --OFF . j·--CIN .. - ... ,
~-- Qr;JL t--ON . ~ OFF'- t C»J • 1 . Ot<'F- ... t ON -- i OfF. . i O~L - ·I OFF 1 - .4N--.. . ; E;l.CH DIVISION fS i!oi-'ROXIM>.Tl.Y e 1-!ll>I\ITES •
... i ..
C-5

r--- ---- --- -- - ------ -- --·--- ----- ----- -- -------L.QRAN.:.c-co:.LOCI.1io"N 1£8T---. --------·--. ·&RAPtf VALUES ,. ACTUAL DATA - QUIESCDIT MEAN ,/ALIJ£.
----------, !
QUIESCENT !olEAN VALUES TO -. 41U 415 uS SNA 1.715301 dB ECO 1. 9?'478 us STATION Y ANT. LOCATION TACAN MONITOR POt.E
r-----·~--·-····-~- --~-----~-~---· --- ----- .. ~---- ------- ~--- ·-------- #-·----i
1.00 us :
·-
TO
-t.OO uS
15.00 dB
-15.00 d8
4.00 us
I
r-----CifF ----I----ON--t--OFI-------t-- ON.---i-- ...Qf_fL -t--- . .otL----t- -Of!F- ----t--..CV-- --1---0l"F - ·t-· Dtl--------1 I
eco ~JJ--r-__,~Lll'ti!LJ_I ......-. I
i -4.00 uS I
1.00 us
-1.00 us
15.00 dB
-s.oo dB
4.00 us
~--OFF---+ -- --·-t- -OF.E- --1----'JN----t- Clli¥--. ;----Obl --1--0I!F.-- -t- . ..QN- --t-G!'L-- t--OtL ..... ! : laiJleac:EI-IT lEAN VAUJEII OI.TA COLU!CTION DATE 08-15-88 ·
TO 1.442811 uS SNR -3.01101!11 dB £CD -1.1311128 uS STATIC»< Z ANT. LOCATION TACAN MOiolnOR POLE ·------ ···- ------------ ---··----·----------------· ----------------- ------- ·-- ------- -----·---- --- .. --- ·-·-· ------------·
I Iii 11 ~----------~~ru -4. oo us L_1n__j I
-OFP- - t ON---- . t OF.£ -l -ON. - --;- on --t - .Oti--c 1- .OF.F -- + . ..QU. --. -~ ... 01"-¥- - 1- -ON---- ... ~ EACH DIVISION IS APROXIMAT~Y 15 MINUTeS.
! TOT AI.. TEST l'IME 1 HOUR.
--- -.1 .. _______ _;
C-6
r-··--·-------· --- -·· -----· --· ----------- .. , ---------- .... -- --0 0 ------0 -----·--· ........ ------ ...... _ ------LC~A~oH-c CCH..OCA TION TEST
&RAPt! V At.UE:S • ACTUAL llA T A - QUIESCENT !)(EN! V AL.U!:,
QUIESCENT HEAN VALUES TlJ 0000000 uS !INA 2.80300 dB ECD .!5237-4 uS
DATA COlLECTIOtl OATE OB-tB-88
STATION M ANT. LOCATION FAR FIELD ...... --- '""!-- ----------- ·----- 0
1.00 us :
TO L-'
-1.00 us
6,00 d8 I
G..~- J;r .. :w...,.....,..._"-ifftl. • ..,, _____ ,'ll.....,.~--,._-_..........,.,__,....,....,.~ a ........, ....--.... _,._. • It '~
-s.oo d8
-0'-F- ---1·--0N-------t-GF-F-----;---ON---- -1- Of'~----1·-0"--.. ·t---Of'F· .. 1--aN-----t-OIEF. --·t-OH----
4.00 us
ECO o.tfrJJTl .... L.i Ulll --4.00 u8
._ .. -· Qftf' ...... t .QO .•• --1- .Of'JL t-ON---i· OI<F- i· QN.. .. --t .OFF.----- {---ON . -J--Ol'F--- t- Ot.L. ...
1.00 us
TD o,,_
-1.00 us
~·- -· ··- ._ _____ ··---·· ·--- ·--- -~---~--·
8.00 dB ;
-ti.OO d8
4,00 us
-4.00 us
EACH DIVISION IS APROXIW.TL'{ S MINUT~S.
TOTAL TEST TilE l I-lOUR •
... --.. ---- ....... ----I . '!QA
c-7
.. l
r·-· ······--··-· -·-····- .. -·····--------······-·-·-···· ---....... ·--------.. ----------------·-- ............. ··-------·1 l LOAAN-C co-LOCATION TEST
; 8AAPH VALUES - ACTUAL DATA - QIJIESCeiT MEAN v Al..IJIE. I ! QIJIEIICENT MI!AN VALUES OATA COLLECTION OATE 01!1-111-88 ! : To .auas. us j St.A -S.S. 7702 d8
~----.. ·--·- --..... --~-::.:~~---------···.--~AT~-~--~--~~~-~-~-~~~----------- ---1 . I
_:: :rvv\fJV\ , t--OF.IL--f--CIN------j--CIW t .. QN... .... +lll'$.--+- C»L--.. ·j-GF.'F----i····.caL--+·CIF1-- ·t· '*-··-----1
15.00
-e.oo dB i r----ar.E---t-4N-- .. 1·-IJEI!-t---CIN----.. -t-Oi'~'··-·1- .(IN. ·----t---C-L ... -t-(Ill. .... -1--'JF.F.- .. t . ON ... - - --·i
4.00 us i I
ECD
' ~,· . n rJnc......._ ___ "T'1
-4.00 us , - I ! I n r '~1 ---CIU---1- . OtL -. ~--OFF.-- -t--.ar --01f'.JL. -t---ON- . -·t· CIU--+-a.L- ... ·-t·.QIQ!. --1 .ON ....... ·· -· . · -
1.00 us
-1.00 us
15.00 d8
i GIJII!SCENT MEAN VALUES OATA COI..U!CTICIN OATE 01!1-ill-88 I TD -3.70248 US
: SNA 4.a..oae d8 LECD_3.20U:'_~--- ........... -~~~!!!!' .. ~--- ~NT:_~~-I_C!_~~!I~----- ... - .... - ····i
8NA !
~~-~--·~··~·------~---~~~~~~~----------·--~Ar~.~-~~~·~~-~----~~------~-~-~~~-~--
-4.00 us I
L--.aFF .... +· QN- . ·!··""'~"- ---t-.GIL- -- t-...aFI!' ""i. OIIL--.+-Of'F-. t _QN ••. ·-I....QIQ!. ·+.art . --- .. i EACH DIVISION IS APAOXIMATLY 15 MINUTES.
TOTAL TesT TIME l HOUR. i i
1 I
L ..... _________ .L_ ····-··· ____ ... __ y Q8 _______ g_~C::.h.ED .... Qt_l _A ~g_ __ Q_f_f _________ ---·-- ....... J
C-8

t..OAAN-C co-LOCATION TEST
&RAPt! VALUES • ACTUAL OAT,!, - GIJIE!BCENT l4eAN 'IALUE.
GIJIESCEN'T lEAN 'IA!..UES
..----1
TO .ll2382 uS Sl<R • 11S81U dB ECD -. 31Jl41 uS
OATA CO~ECTION OATE OIS-tll-88
SUT:EOH Y ANT. LOCATION FAA I"IE!...O
·~-- h _ ••• ,
1.00 US I
TD
-1.00 us
15.00 dfJi
-15.00 dB 1
-4.00 us
--\.00 ua
l.OO uS
~--. -.Da'- ---1- .QN .• - t··-OFE. -t- 41-J. -·- t OF.F-- t .ow .... - t --~f' -·-- 2--0tl--- ·1 -OFF-- ... 1 -ON-.
IU
;.... . - OF.F --1·. ON .. --1 OF-F-- -J Otl- -l Olif'- -; ON----·t· ClfiF .... {-ON.- t Clf1$ .. t· 01-< QIJIESCalT l1t!NI VALUES tu.T;J, COU • .F.CTION OATE 05-S.IS-86
TD S. 43tJBI U8 I INA -l~.9882 dB 1 ECO -1.08088 US STATION Z ANT. LOCATION f'~ FIELD .... --·---·---··--· ... ----·- ........ -- - ... ·- ............. -- ----- .. ----- .. ... -.- -· -----· I
m ~JVVW~A..~>-v -1.00 US I
!
........ -OFF . [---0.0 .. -- i· OFF. -- t-01-L - -1- . .OFF. . -j . OK
8.00 d8
-8.00 dB
OP.f' ---t ON--- 1 OFF - 1· ON---· 1- OF-F- + .QN. 1--0F6 ----1- ON.- 1 OFF-- ·t· OtL ... --
4.00 us !
ECD 0
-4.00 u9
L..- Off' - t - ON.
i ..
a liD 1!1 •. _ ___, ' 'I ~~
l· .OFF . I ON I· -MF I -C»>. --{ .OF.f' .. l QH.. l OFF ~I .... EACH DIVISION IS APAOXIMJ>.TLY 15 MUIUT£".8.
TOTAL TEST TIHE ~ HOUR.
c-9
~-·-·- .. .. - - ··~·--r··
I
1.00 us :
TD o...f-
-1.00 us
LORAN-e co-LOCATION TEST
GRAPH VALUES - ACTUAL DATA - QUIESCENT MEAN VAUJE.
QUIESCENT MeAN VALUES TO 0000000 us SNR ... 7f5!134 em ECD 1.1514112 uS
DATA COLLECTION DATE 015-te-ae
STATION M ANT. LDCA TIDN COUNTER POISE
~-w--
!5.00 dB '
SNR a_ .. w ...... -.. --.. ·-·-·--.·------y-.. ...,,.. __ ~...........,_ -e.oo dB
4.00 us
. -~
ECD o.~ .. · ... - --.....- ______ ..__unJ.Il_f"ll.JLU1JIIIl mi1L1... IU..111r i
·1 II -4.00 us
·-·----, 1.00 us
TO ~
-t.OO uS
s.oo em
-15.00 dB
4.00 us
ECD G.-
-4.00 us
EACH DIVISION IS APADXIMATLY !S MINUTES.
TOT AI.. TEST TIME S HOUA.
. --·- l ' __ j
C-10
I
r· ---·· ---------···· ·---·-·-··· .. -·-··---····---·-- . ·---····-··· -------···- ···--·----·-·-··-····--···· ...... ----- ·----· .... --------·- _ .... -l LORAN-e CO-LOCATION TEST
. I
BRAPH VALUES • ACTUAL DATA - QUIESCENT MEAN VALUE. i QUIESCENT MEAN VALUES
TO 1.11214 uS SNA -17.018!1 dB ECO -a. 97880 uS STATION W
DATA COLLECTION DATE 0&-18-88
AHT. LOCATION COUNTER POISE . r··---..... -............ -----·----····· -··--···-----··-···· .. ---- --·--·-··---·-- ------ .. ·-------. -----------·---· --1
··--····---- -·- --; s..oo
···v~I\J \rtfvV\ 1\. TO
-s..oo us
i.DN..--·-·}· .QEF •. +-- .. QN ... _ + _.tJF.F_ -·j--01>1------t-- _OF£ _____ 1--.oN---------·----- -- -----· --·-· ----·- ...... -
!5.00 dB
-1!1.00 dB
i ~--t----Oa':-- . t-··-.4N-- .. -t----OF-1!'- ·-·t-...ON-----t'"··-OF-JL ... t- . ..DN -- -·-- _ ... ·------ ---·
4.00 ' .__...,
us .____, - .. JJ.fL_
I ECO 0..:..
-4.00 us
1.00 us
I
: i.ml---t·-· ~r'"--i--· • _Qil___. -~--DFE-----t-•.oN---- t-- .Of'F---J~-ON.-----·• ~- ---·- -·-~ -·--··-•· ·-~·-------•i , QUIESCENT MEAN VALUES DATA COLLECTION DATE 0!5-1&-85 !
TO -2.88987 uS SNA 4. 18887 dB ECO 2. n7158 uS STATION X ANT. L.OCATION COUNTER POISE
......._. .. - ·-----------·-·---------------·----- --------------------·------ -------------------------------
I . TO o .,_.....,,.,. ~~r•ntvf'A4~._.,..,. • ...,.,_.....,......,. • .,.w~·~\
i I
-s..oo us 1 I I-OFF..--+ ON---- f·· OFfL .. t ON ... -f--OFF---- r-.DN- j----4"-·-+·-0N-- ·t OF-JL +-ON-. _ ___,
!5.00 dB
o· ·'
-e.oo dB
I ¢ .,., ____ _._...,,_..., __ , __ ..... .,._ .... V'"'_,. ......... - ......... __ ,. . ..,._. U --·-.. ~ ... ---v~ I
i--OF.F. ..... I·· ON- -+--OfOF- - -t- 0tL -t·- OFF .. --·t-...DN.. - c-.-OFF.- ·-t--llN- ··-t·· .,._-t---ON-----~
4.00 us i
' ECO ilJIII --uu..rru L'TTf Jll.Jr 111 -4.00 us
:_.OEF .. 1 . on..···( OFF- ~- ON- . -(----~- -(- ow.. +--.!IF-F- +-·ON---f.-~- + .-ON .. _ _j EACH DIVISION IS APAOXIMATLY 5 MINUTES. '
I TOTAL TEST TIME 1 HOUR.
l-- --· ___ j _____ _
C-11
I ...... ··------. --· - ... ...... . .. . ... ---- .... --- ......... -· ............. ·-- ·--··-· .. -- ...................... - ---------- .. ·- -··· .... -· ..... . . .. . ... . . -·l i LOAAN-C co-I..OCATION TEST
L
8AAPH VALUES • ACTUAL DATA - QUIESCENT MEAN VALUE.
QUIESCENT MEAN 'I .ALUES TO -. 63t5tl5 us
LOO
-r:
us .
-1.00 us
15.00 dB
SNR 3 .88297 d8 ECD 1 • 787!HI uS
DATA COLLECTION OATE 08-16-88
STATION Y ANT. LOCATION COUNTeR POISE
-e.oo
•• ~ ~f{'NW\W/(W T,tMVv\W#«'w.t#/W#N Vi ;_-.Qf!F. .... t . .QN •. ·· t· 01$ ••. _1 -ON------·i· OFJL. t -.OW -1 .QFII! -+- .QN. t .C/EF ·r --.DN--
4.00 us
ECD ~ ,......Jll Ll111LllJUif"HJf llJlJr---.LLfU1f-r-'J ---"T'- --r. -4.00 us ~
r--4f<F-- t·. ON. f .. QF-f: -+--Gil .. --1- C/EF. -··i- QN .... -· ~ 4FF. -+ .J:IN- -·t·- OFF ... t - Ot.l-.
1.00
TD
-1.00 us
..-· I
i
QUIESCENT MEAN VALUES DATA cou.ECTION DATE 015-UI-88 TD i.1380H uS SNR -12.60153 dB ECO -3.84421 uS STATION Z ANT. LOCATION COUNTER POISE
..-4N . +· .QFI!" ..... f _J:IN. . ·+-- .QFJL. i- .oN.. --I a;:e-..... ·I· QN. ... I· .Qf!l! + -ON- . ... . ·-i
15.00 dB
~--ON- .. -t--OFF .... I -ON ... -1 . OF..F. ... I .. OM. . i . OF-1'--- I· . ON .... ·t .. 4f'F. ... I .... ON.
4.00 us h.___illj
ECD 0..:_ J1Jt_ -""T""'!"' 1 U11 ... 1.__ __ .....__ ---rT- -..,..--
11 -4.00 us '
~- 0111 .. 1 Of-F . -t ON t· OFF .. 1· ON .. t··· OFf" . -t 0.'11- --t- - OFF t· ON EACH DIVISION IS APROXIMATLY 5 MINUTES.
TOTAL TEST TIME 1 HOUR.
.L .....
C-12
i • ...J

r··---··-----··------- ----.. ·--·--··· ---···-----·-----------·--------------- --··-·--··----- ···- ., l ~OAAN-C co-LOCATION TEST ! 1
8AAPH VALUES - AC1UAL DATA - CWIESCI!.NT MEAN VALUE. 1
GIUIESceNT M£AN V .t.LIJE8 TD 0000000 uS SNA 4.U309 d8
DATA COU.ECTICIJ DATE 04-03-88
I ECD • U.ll38 uS STATION M 1oNT, LOCATION TACAN MONITOR POLE 1-----·---·---··· ------ .... - ..... ------------ .................. --------- ·----··---- .... - ·-- ----------------···· -···· --- ........ ..
! I
1.00 uS 1
TO
-1.00 us I
-----~---·--·--. ~----· ·-·--·· ------ ----- -·--·--------·---- ------······· --------~~------- ···-··--------------·-. -- .__J
e.oo d8
8NR
-5.00 cSB ' I I r---OFF---1 I
4.00 us
ECO oliWlllJIIUL 11!181
-4.00 us '
I
i .... ~
! i I I
~ I I liiilUJ mJJ1. -,__ __ ......__ ---.. _JjLJ_ ! -----,
i r--· .QF..F ----1 •. -~··· .• 1 .... Qf'F. .. --1--0itL -·· -t--4Rt-- t·- .ON.... -~- ..... OFF .... t- --ON-- --t--CIF-F-- .. i· ON ... 1
1.00 us '
TD Cl...J ..
-1,00 U8 I
r·--e.oo d8 1
I I
Sl'lA a...;-
-8.00 dB 1
I
------·----------- -~--- 0 ---------·••AOOoOo _____________ --- oO•••-~----·-----· 0000 ____ • OoO ---------------- o ----------
'
i----·-·•-• -•• •-•••••••• -- -···-· <o•• > -~ -------·-··--•·•-·-~·-·-·--- •••~··-·-·- -P ·-<-~~··-·••••••-•• ·-· ····-~ ··-·•• •·-·--·--··•- -·--- •f
4.00 us
eco o,__ I
-4.00 us
,.... ____ ·-· ------------· ·-1 EACH DJVISION IS APAOXIHATLY e MINUTES.
TOTAL TF..sT TIME 1 HOUR.
l._ __ _ L _____ _ ........ --· AGA.G_ CY._(;_L;,E;P .... 9l'J .... A NQ ___ Q_i:_f"_ .. ···-- ______ ..
C-13
~·-· ..
........
•·
LORAII-c co-LOCATIO» TEST
~PH vALues M ACTUAL aATA - aur~JT MEAN VALUE.
QUIESCE.m !*.AN '!M..IJES TD i. 10878 us II'~ -:US. 4034 d8 ECa -2.08388 u8
DATA cot.~.ECT!ON DATE 0•~-03-88
. . --T ..... --- .. --- .............. .
·:~ .. LL\v" -Af'J\ ~ J'\ ~ \J\('...rif'V ~ -1.00 us
' ~- .. QF.F ... i .OM --: .4f'.l'' ... ·t-- .QN. --{·--CJI;s;. -~--~ . ·i .. - .. QI!F_. +-ON--- :---OFf --I aw ....
5.00 dl!l
-15.00 dl!l
4.00 us
ECD a..tt-r_ ____ -u_.Jj--~J- ---~lJT"-~ _'T"
n • ·--4.00 us
i.OO us
-i.OO ua
15.00 d8
Stitt
OFf ..... ,.. OW . 1 . .OFf QIJI~CNT lEAf! VALUES
TO -2.1tUM8 US 81-:R 3.158484 4B ECD • 88288 uS
- . l .. ~ ·-t . ...Qf'f' .•... r-- .Qiol ..... t-- .fJEF-. -j· OH. . t . Off,' -l· Ot! DA1·.-. CCILt.EC1'ION OAT€ 0<6-03-86
STATIO~ X Nn". !..GCioTION TACAH MCtliTOil POLE
-5.00 d8 :
-OFF -t -mol-- 1--0F£. -1·-0111 --1 QF;:. ·!· lm---1---·-0fF .... l Oli.---·t· .Off':. .Qtl
4.QO uS
; --L-L-_._1 _II If £CD a..,:-._--,..., 1L r- n a r.r- ~ ...,
.... ON'. j ON
'---- -""T""r- .-..,..-, il 111 It TYITIT: l .. OfF ... I .CJN I OFF- l ON. i Of'f I· 0~
EACH OI'fiSIOI'I IS APRO>:IMATt.Y !! MII\-'UTES,
TOTAL T!::S'T TIME :1 rlOUA.
C-14
orr 1 . 01<
r---·---------·-··· -· --·-------·-- --·-! LOAAN-C co-LOCATrON TEST
SAAPtf VALUES • ACTUAL DATA - GUraiCalT MEAN VALUE.
IIUIESCEtll lEAH VALIJeS TD -.471!1<10 US SNR 2. 94«13 dB ECO .3U588 uS
DATA COI.LECTION DATE 04-03-88
"-·· ---··--- -- . -···-· ·-,.-· ... ·-·-- .. ~- - -···
L
i 1.0Cl us :
-1.00 1.18
s.oo d8
-!5.00 d8
~---Of.F -t-m.l·-···t- MF. ... , .... OL---··1-0F~- -t--OH·--··;··---OFF ..... I .. QN .• ·-t· OFF -1---0N.
4.00 us
o.~nuJlj1 f1LI.. rn..J.nL l.hlrJl --rrtJ11ILtrn ~ . _ . : us; .. rwumrmu_r Lm -4.00
S.OCl us
- .oF-F---1--0N--- i --Cirf' --···1··-o.&- -1 -OFF ... t··--01----t -- -OFF----j---0111----)- OFf'. -j· ON. .. :
I
caiJiaJC!NT MEAN •.-AUJEB DA11o COU.ECTION DATE 04-03-88 l"i) s. 41<102 us ~ -7 • ....eoo dB ECQ -3.28420 us STATION Z ANT. LOCATION TACAH MONITOR POt.E
TO ~ ""v ~~~~ ~~"""""~ -s.oo us
:. OFF - + ON . . .Of!~ ... ! C»>-- -j . Of'F---·j--- Dlll- --- i . QfJL. I . ON ... --· Of"F .. i . ON. .•
e.oo dB
4.00 us i
---~'" ; o.~1Jirliil.-~•--~u- i.U~-------:
-4.00 us
~- Of:r· .... 1 . Ql.l. -- ·t---DFF .. ~--Ott-- 1 ... OFf.'- l ON ... ~ Olif' ... :--ON -- -t· Of'l" ·!·---ON-
I .. EACH DIVISION IS APAOXIMAT~~ S ~INUTES.
TOTAL TEST TIME 1 HOUR.
RCAG CYGL_S.LJ_ .ON AND _Qf.:F
C-15
,.
I I
LOAAN-C Co-t.OCATICIN Tt!8T
8RAPH VAUJES • ACTUAL DATA - GUmec:eNT MEAN VALUE.
GURIICENT lEAN V~ TO u8 8NR 3.!10318 dB Eel) -.ie.488 u8
- ------,--·----~ - ... --
i.OO us 1 I
TD C.
-i.OO u8
DATA CCIL.U!CTICIN DATE 0-4-0-4--
STATIOtl M ANT. LOCATION f'AA FIELD
., I
-·- _j
....... --··--~~---~ .... _.~_ -----. --·- ------······ ----------- - -----~--------. -··· .•... --·---. ········-·-··- - ---· .. -- ---~,
i ' 8.00 dB
8NA ..... '1
-8.00 dB
L-GI'F-- -t- -- -a&-- - t-· CI!'F.- + - -QN.._ -···I --- Qlf~ --- I· -- ON. - -- ••• ..QFF.... t - ow - , ... OFF -- , .. ..:
-4.00 us
Eel)
-4.oo us --,_J._I __ ~ :--OFI!'.. t · --·- CIN ----1--·-~ · -+- -ON- - I·· - .QFF. t -- · -ON- -t-~F- - t--- 4N- - - -a-- OF-F
' ------- ---- .. --.- ...... " ----·- -. ----·--
i.OO us
TO Q.._
-t.OO u8 I
8.00 dB
-8.00 cl8
. ....,
-4.00 us
ECD CL-
--4.00 u8
EACH DIVISION IS APAOXlMATLY 8 MINUTES.
TOTAL TEST TIME S. HOUR.
L. .... L
c-16
!----··--·--···-· -·-----·---- --------·-·· ··--·-Lo;w.:cca:.:Loo;\1i(;N-;:!;.r··-·····-·------··--------- -------, i
i I
&RAPH VALUES - ACTUAL DATA - QUIESCENT MEAN VALUE,
QUIESCENT MEAN VALUES TO • 688152 uS SNR -16,8804 dB ECO -1. 06680 uS
DATA COLLECTION DATE 04-D4-88
STATION If ANT, l.OCA TION FAR FIELO :-----···----····-. --~-------
' 'i
L
1 1.00 us :
TO
-1.00
4.00 dB
.... ~ J.;Aiw~~~N/vit'~~~ '
-4.00 dB i
~- -+-- . ..oN.--·1--DF..F--+-- ON ····-t----DF..F---t-·- .. ON- . ;----OEF-- ·+ON-- t· . .DFF----(-...J I
4.00 us 1
ECO
-4.00 us
1.00 us
TO
-1.00 us
4.00 dB
J[L_ __
IlJll. llLL--~---.,-~--1--- . -- O!ol..---t-.Of'J; __ t- -- _..()N. _____ -t_. DFF---- i -- . ON-----t - -- OF.JL .. t- ON - ·-t--OFF L-tt : QUIESCENT MEAN VALUES DATA COLLECTION DATE 04-D4-88
TO -3, 88900 uS , SNA 4.38486 dB
i--~~-3:.~.~~·---U.~---· ----·-··---~_!~!~~~---~-----L~~TIOJII~A~.!~~- -·------ -·-1
1
-OF.F----t-·--- ON-----t -DEE- -·t---ON -·-1- . . OEF --+-- DN.- -+--OFJL I~- I -DEF- +-"
' ' SNR 0 !-. .. .....,__ ...
-4.00 dB i L-OFfL -·! -- .. --41'tl.-- -+- -DEE.--t-·---ON.----t·-- CIF-E--·-i-··· ON.-----r-OF.E----1 . ON-.•. ·t---Oe'E- -+-
4.00 us
1
ECD ~ iL'EL __ JlUL _1_1_ I l . -4.00 us 1 ~JJil.ILl
i...-OF..F .. --~ .. -DK-- -j---OFF .. t--OtL---t---OFF ., ..... ON .... , .OFF ... I _(lN. __ t--OF..F .. ·t--EACH DIVISION IS APROXIMATLY 6 MINUTES.
1'0TAL TEST TIME 1 HOUR. I
I
.L RCAG CYCLED ·- -· ---· -·- ON AND OFF
C-17
L.ORAN-C CO-l.CICA TION TEST
&RAPt! VALUES "' ACTUAL DATA - QUIESCENT MEAN VALUE.
liiUIESCaiT M1!AN V ALIJES DATA COI..Li!CTIOfl DATE 0+-0+--TO .37280 uS SNR -1.48370 dB ECD -.801183 US STATION Y ANT. LOCATION PAR FIELD
1.00 us
TO
-1.00 us
'-OFF- t .... ON-- r OFF.. -f ... 4N ... i· - OFr -·· i .. CIN. --J- .QFF •.. f .DN.
s.oo dB
BNR
-s.oo o -·- OFJf •• -- t
-4.00 us
a.__·----<6.00 us
1.00 us
~-~ -CI!F 1 .. QtL -J-OFF --t----0!4 -·t· OFF-I- ON--·1 OF~--1--0tl l OFF J·
liiUIESCEHT MEAN VALUES OATA COI...LECTICitl >lATE 0+-0.oHIB TD 3.02820 uS ... -18.8233 dB ECD -1.3-401-t uS STATION Z ANT. LOCATION FAR FIEUl
>"J ww- vv~v ~ 0v J\-V Jv· us .
TD
-1.00
___ Qf'J':- 1- ... - .ow. t--CIFF .. i· .QN. . f ----M'F . t ... ON. .. I--liFF- i . ON. I Of'F. I -~
s.oo diS
-s.oo dB
t OF.F- t .QIIl. • · -OF~- 1 . otl 1 OFIL 1· - ON. . . 1 -OFF -1 ..•
.c.oo us
ECD CL-
-4.00 us
TOTAL TEST TIME 1 HOUR.
8CA_G _CYCLEO Q~,: AND OFF
C-18

_ .... - .. ,_. ·--···--·--··--··-·-----·--- ------~--.. ·---..-·- ·--··--·----.--.... ~- ···-·----~ l..lfWt-0 co-LGDATDal TI8T i
I
...... Y.U. • ACTUAL DATA • ~ Ml!AN VALla. i -..z.-n MUN v..ua
TDO .. ... a.7ta40 •
t
i - l.,.... .. STAnGl II Mfr. LOCATIGN CIUf11!R ,.._ i !---·-· _ .. -·-·r .. - .......... --·--·--·-·-··-·-··-----·-- --------·--··-···- -------- .. - ... ---1
l.OO ue I l . j
lD .._
-l.OO ua
8.00 • ... -e.oo ..
I r-----·- -· --------- - ·---- __ .. _____ --.. - ... ·--· ....... _ .. ____ --- - .. -f
r--v--... -~--·-- ·--·---·~--··-- ---·-· ----·-- _____ ..._ -.--.. ·- .--...-~·--·- -··--i 4.00 U1 I
-4.00 Ul
L. ____ .. __ .- --·-----~----------------·- -------·-· .. ----·-· ___ . _________ j &.00 Ul
-a.oo .,. ' -----· ---- ·-· -·· -----·--· --- .. ----··-· ------ ·---- . -·---- ... ····---· ---t
11.00 .. I
-e.oo • 1
r·- ------- ---- ·····-----· ·-------.. !
... 00 ...
- 0......
-4.00 Ul
. --·· -·--- ···-----·------··" __ .. ___ -·---------- .. -.. - - .. -----· --· ...
_j __ . -- _____ ......... ·-- --------- ·-----·--- ----- -- ........ ------- ---- ___ .. ,_ ----· ·-- ....... .....
C-19
..
s.oo
TD
-s.oo
1!1.00 ..
-!1.00 ..
... oo ...
s.oo 1111
-s.oo ua
11.00 ..
-e.oo •
4.00 U8
t...GfWH: ~TION TaT
lfUIPH V.u...lllm • AC'1lW. DATA - 8IID!8CUIT ti!!AN YAl.UE. •
• llEBCI!tn' NUN VALI.D TD u.s-. ua ... -!7.1002 .. I!CD -.3&1178 U8
.aacetT *IAN VAI.l8 TD -a.•41110 U8 ... 3.287411 ... ..:0 a.OGIB U8
STATION W NIT. t..OCATl:ON ctUm!JI POnE
- _j
---· --~- .. ~ --·---- ---- -~-----·--·-- -·-. --- ---··-- ··------ ----·- ------- ---·--· -~-·-·--- ..... -~-- ----· - _;
a. Jl n II I J II U ll • lJ ~--~L-----YUU~~~--~~~~~-------~
-....oo ua
TOT At. '!'68'1' TIM!! l HDlll •
C-20

,..-----------·---------· ·-----------------·---------------------·-----, I UIWfo-G OCM OCATJCIN 'N8T I
! IIIMitl v-.... • loC1UAL DATA - IUI-.cT ..,., VAUII.
tiiDID8'T 11UH VIUB 1D - ...... " .. ..... .,.... i
-·--· r llCD '-·~--~---------!!ATJCIN _!_ IMT~.~-ZGN -~ ~--··----J &.00 ..
I
A r""""*''.,._,..,_ I
-&.00 ... •. oo • .,.
.... oo • 4.00 .. -
..... oo ..
s.oo ..
-t.OO U8
•. oo • -
1 r----·-------------------.. -------------·----------·--- -- .-.. ··-1 I ' I . '
\ .. , L----------·-------.. ---------------·-----.. --- __ J I I I I
I
=--__,tl,.*•r ' M !
I l t--- .. --·---· -----------··--· -·- --------- --- ...... ____ }
l' all-hT 111M Ylol.l8 DATA GDl.I.8J'm:ll OATa ... .,.._..
TD s . ..- • ' -___ ..,.. 1 1iCD -a...... .. 8TATJCIN Z NfT. l.GDATJCIN c:cumiR P0Da ~----------------- .. ·--·----·-·-·--·--- -----·-.. ·--- .. _____ _
t-·-------~----- ' ------·- ·--- -·--------·-----------·-. ------· ------ ·--~
1
.... oo • I ) r-·- ----·-· ·-· --- -··- ---------- ------· ·- -- ·----- ---.. ______________ , 4.oo • I
I
ir~,--~~~--'~'~~--·---··--~~._-T--~--r.~l ~·~f~: -4.00 .. I
r---·-'
i .... _-------.-~·a ~l.Y iMiNuta:·-- ----- ------ \
TOTAL. l8T TDe S HGUR.
' . t-----------1·--·-·-·---·--·------.. ·-----------.. -----------.. ------·-····--·-··-----j
C-21