Embed Size (px)
Citation preview
Looking for the Market Edge with MACD
LINC – Lund University Finance Society 2017-12-01
1
This series of articles explain how MACD works; the risk of using MACD, and how different variable inputs in the MACD settings affect the return of the strategy (And if such alterations affect the edge positively or negatively).The backtesting was first done with the standard settings for MACD on 30 different Swedish stocks, 10 from Large cap, Mid cap and Small cap. The test was based on the time period between 1st of January 2010 until the 22nd of november 2017. The stocks were bought as the EMA crossed the signal line from below, and as an exit criteria for our strategy we used a trailing stop of 5%. Throughout this series we will see the effects of changing the settings of the original MACD through testing it on the same stocks.
What is MACD
Moving average convergence divergence (MACD) is a trend-following indicator that shows positive and negative trend-momentum. This indicator functions with two moving averages. The MACD is calculated by subtracting the 26-day exponential moving average (EMA), from the 12 day EMA . The 9 day EMA in the MACD is called the signal line and is plotted on top of the MACD.
MACD -3 ground points
• Crossovers - As the MACD falls below the signal line it indicates a negative trend. Conversely, when the MACD rises above the signal line, that means a buy signal is triggered. This usually leads to a strong price momentum. • Divergence - This is where the stock price diverges from the instrument (MACD). This indicates that the current trend is positive or negative, and a trend shift or possible fake out could occur. • Dramatic rise - There will be times when the MACD will dramatically rise or fall. When the shorter moving average pulls away from the longer moving average it gives us a signal that the current stock is overbought, which often tends to return to regular levels soon.
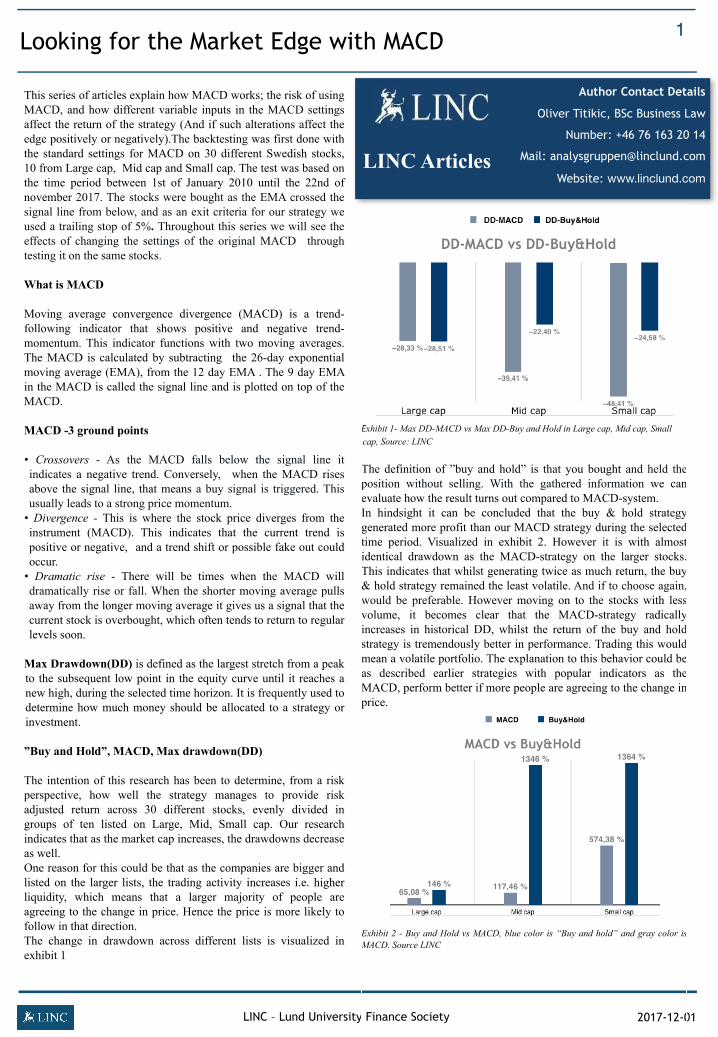
Max Drawdown(DD) is defined as the largest stretch from a peak to the subsequent low point in the equity curve until it reaches a new high, during the selected time horizon. It is frequently used to determine how much money should be allocated to a strategy or investment.
”Buy and Hold”, MACD, Max drawdown(DD)
The intention of this research has been to determine, from a risk perspective, how well the strategy manages to provide risk adjusted return across 30 different stocks, evenly divided in groups of ten listed on Large, Mid, Small cap. Our research indicates that as the market cap increases, the drawdowns decrease as well. One reason for this could be that as the companies are bigger and listed on the larger lists, the trading activity increases i.e. higher liquidity, which means that a larger majority of people are agreeing to the change in price. Hence the price is more likely to follow in that direction. The change in drawdown across different lists is visualized in exhibit 1
Author Contact Details
Oliver Titikic, BSc Business Law
Number: +46 76 163 20 14
Mail: [email protected]
Website: www.linclund.com LINC Articles
Exhibit 1- Max DD-MACD vs Max DD-Buy and Hold in Large cap, Mid cap, Small cap, Source: LINC
The definition of ”buy and hold” is that you bought and held the position without selling. With the gathered information we can evaluate how the result turns out compared to MACD-system. In hindsight it can be concluded that the buy & hold strategy generated more profit than our MACD strategy during the selected time period. Visualized in exhibit 2. However it is with almost identical drawdown as the MACD-strategy on the larger stocks. This indicates that whilst generating twice as much return, the buy & hold strategy remained the least volatile. And if to choose again, would be preferable. However moving on to the stocks with less volume, it becomes clear that the MACD-strategy radically increases in historical DD, whilst the return of the buy and hold strategy is tremendously better in performance. Trading this would mean a volatile portfolio. The explanation to this behavior could be as described earlier strategies with popular indicators as the MACD, perform better if more people are agreeing to the change in price.
Exhibit 2 - Buy and Hold vs MACD, blue color is “Buy and hold” and gray color is MACD. Source LINC
MACD with Halved Values
LINC – Lund University Finance Society 2017-12-01
2
Introduction
MACD as read in the previous article of this series uses the
standard values of (26, 12, 9). What this article will present is
how changes in the configuration of MACD to half of the
standard values will affect our results. The MACD values are
set to (13, 6, 5) despite the last number not playing a role in
our specific algorithm.
Exhibit 1: MACD with standard and halved values. Source: Hitta kursvinnare
The bottom part of Exhibit 1 is the MACD with halved values
and displays a more volatile character with tighter curves. This
means that our buy-signals will be triggered more often as
seen in the results from the backtesting.
Results
During the measured period 2010-date, 50% more trades were
executed per stock on average with the halved values.
However the amount of winning trades were 25% lower than
that of the standard MACD.
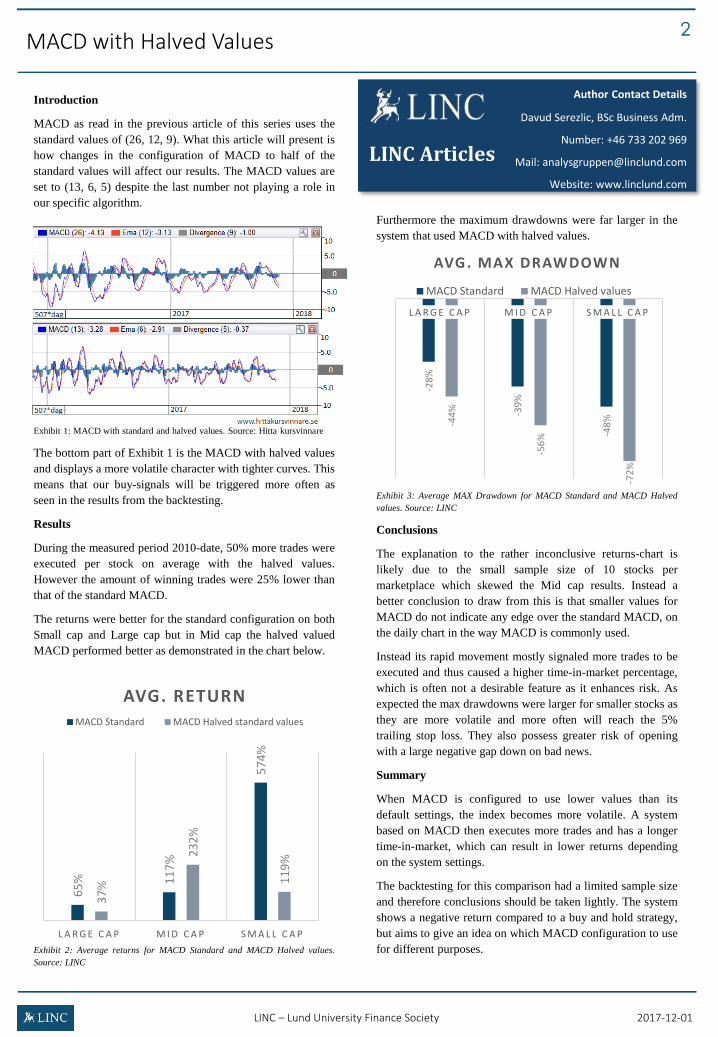
The returns were better for the standard configuration on both
Small cap and Large cap but in Mid cap the halved valued
MACD performed better as demonstrated in the chart below.
Exhibit 2: Average returns for MACD Standard and MACD Halved values.
Source: LINC
Furthermore the maximum drawdowns were far larger in the
system that used MACD with halved values.
Exhibit 3: Average MAX Drawdown for MACD Standard and MACD Halved
values. Source: LINC
Conclusions
The explanation to the rather inconclusive returns-chart is
likely due to the small sample size of 10 stocks per
marketplace which skewed the Mid cap results. Instead a
better conclusion to draw from this is that smaller values for
MACD do not indicate any edge over the standard MACD, on
the daily chart in the way MACD is commonly used.
Instead its rapid movement mostly signaled more trades to be
executed and thus caused a higher time-in-market percentage,
which is often not a desirable feature as it enhances risk. As
expected the max drawdowns were larger for smaller stocks as
they are more volatile and more often will reach the 5%
trailing stop loss. They also possess greater risk of opening
with a large negative gap down on bad news.
Summary
When MACD is configured to use lower values than its
default settings, the index becomes more volatile. A system
based on MACD then executes more trades and has a longer
time-in-market, which can result in lower returns depending
on the system settings.
The backtesting for this comparison had a limited sample size
and therefore conclusions should be taken lightly. The system
shows a negative return compared to a buy and hold strategy,
but aims to give an idea on which MACD configuration to use
for different purposes.
Author Contact Details
Davud Serezlic, BSc Business Adm.
Number: +46 733 202 969
Mail: [email protected]
Website: www.linclund.com
LINC Articles
65
% 11
7%
57
4%
37
%
23
2%
11
9%
L A R G E C A P M I D C A P S M A L L C A P
AVG. RETURNMACD Standard MACD Halved standard values
-28
%
-39
%
-48
%-44
%
-56
%
-72
%
L A R G E C A P M I D C A P S M A L L C A P
AVG. MAX DRAWDOWN
MACD Standard MACD Halved values
MACD – Expanding the spectrum
LINC – Lund University Finance Society 2017-12-01
3
- A comparison between old and new
- To evaluate whether an adjusted MACD where the
configuration has been doubled outperforms the original, a
comparison has been made on the identical stocks over the
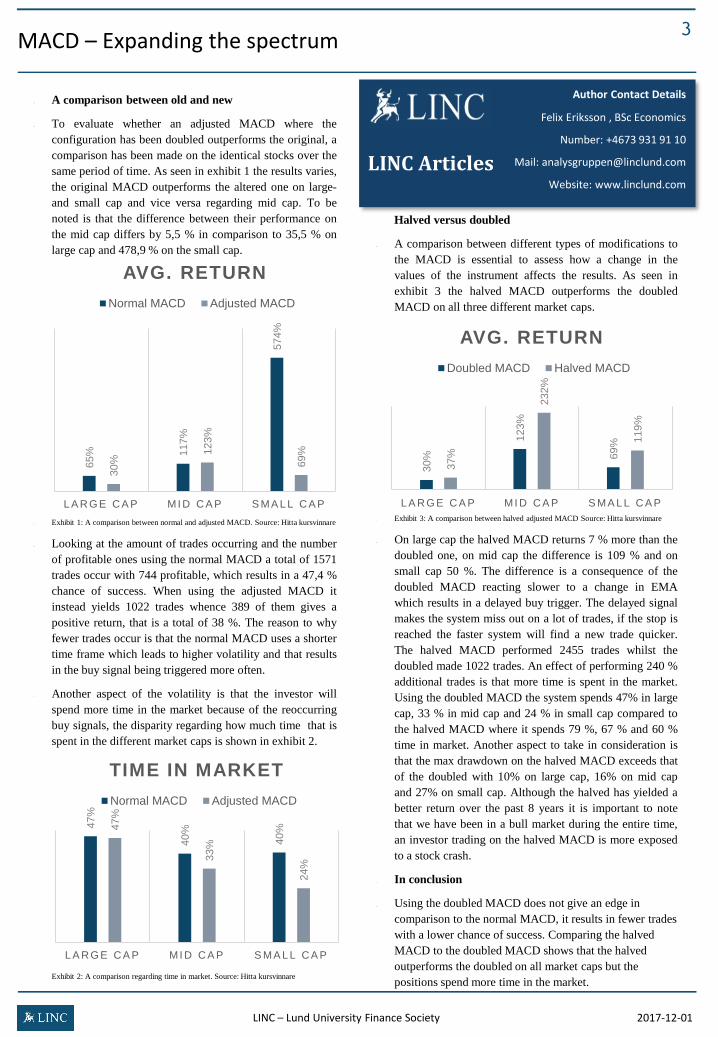
same period of time. As seen in exhibit 1 the results varies,
the original MACD outperforms the altered one on large-
and small cap and vice versa regarding mid cap. To be
noted is that the difference between their performance on
the mid cap differs by 5,5 % in comparison to 35,5 % on
large cap and 478,9 % on the small cap.
- Exhibit 1: A comparison between normal and adjusted MACD. Source: Hitta kursvinnare
- Looking at the amount of trades occurring and the number
of profitable ones using the normal MACD a total of 1571
trades occur with 744 profitable, which results in a 47,4 %
chance of success. When using the adjusted MACD it
instead yields 1022 trades whence 389 of them gives a
positive return, that is a total of 38 %. The reason to why
fewer trades occur is that the normal MACD uses a shorter
time frame which leads to higher volatility and that results
in the buy signal being triggered more often.
- Another aspect of the volatility is that the investor will
spend more time in the market because of the reoccurring
buy signals, the disparity regarding how much time that is
spent in the different market caps is shown in exhibit 2.
- Exhibit 2: A comparison regarding time in market. Source: Hitta kursvinnare
Halved versus doubled
- A comparison between different types of modifications to
the MACD is essential to assess how a change in the
values of the instrument affects the results. As seen in
exhibit 3 the halved MACD outperforms the doubled
MACD on all three different market caps.
- Exhibit 3: A comparison between halved adjusted MACD Source: Hitta kursvinnare
- On large cap the halved MACD returns 7 % more than the
doubled one, on mid cap the difference is 109 % and on
small cap 50 %. The difference is a consequence of the
doubled MACD reacting slower to a change in EMA
which results in a delayed buy trigger. The delayed signal
makes the system miss out on a lot of trades, if the stop is
reached the faster system will find a new trade quicker.
The halved MACD performed 2455 trades whilst the
doubled made 1022 trades. An effect of performing 240 %
additional trades is that more time is spent in the market.
Using the doubled MACD the system spends 47% in large
cap, 33 % in mid cap and 24 % in small cap compared to
the halved MACD where it spends 79 %, 67 % and 60 %
time in market. Another aspect to take in consideration is
that the max drawdown on the halved MACD exceeds that
of the doubled with 10% on large cap, 16% on mid cap
and 27% on small cap. Although the halved has yielded a
better return over the past 8 years it is important to note
that we have been in a bull market during the entire time,
an investor trading on the halved MACD is more exposed
to a stock crash.
- In conclusion
- Using the doubled MACD does not give an edge in
comparison to the normal MACD, it results in fewer trades
with a lower chance of success. Comparing the halved
MACD to the doubled MACD shows that the halved
outperforms the doubled on all market caps but the
positions spend more time in the market.
Author Contact Details
Felix Eriksson , BSc Economics
Number: +4673 931 91 10
Mail: [email protected]
Website: www.linclund.com
LINC Articles
65% 1
17%
574%
30%
123%
69%
L A R G E C A P MI D C A P S MA L L C A P
AVG. RETURN
Normal MACD Adjusted MACD
47%
40%
40%4
7%
33%
24%
L A R G E C A P MI D C A P S MA L L C A P
TIME IN MARKET
Normal MACD Adjusted MACD
30%
123%
69%
37%
232%
119%
L A R G E C A P MI D C A P S MA L L C A P
AVG. RETURN
Doubled MACD Halved MACD