Embed Size (px)
Citation preview

1
Looking for capacities rather than vulnerabilities: The moderating effect of health assets
on the associations between adverse social position and health
Mathieu Roy Ph.D. 1-2, Mélanie Levasseur Ph.D. 3-4, Isabelle Doré Ph.D. 5-6, France St-Hilaire
Ph.D. 7, Bernard Michallet Ph.D. 8, Yves Couturier Ph.D. 3,9, Danielle Maltais Ph.D. 10, Bengt
Lindström M.D., Ph.D., Dr.PH. 11, Mélissa Généreux M.D., M.Sc., FRCPC 12-13
1 Health Technology and Social Services Assessment Unit, Eastern Townships Integrated
University Health and Social Services Center, Sherbrooke, Quebec, Canada
2 Department of Family Medicine and Emergency Medicine, Faculty of Medicine and Health
Sciences, Université de Sherbrooke, Sherbrooke, Quebec, Canada
3 Research Center on Aging, Eastern Townships Integrated University Health and Social Services
Center, Sherbrooke, Quebec, Canada
4 School of Rehabilitation, Faculty of Medicine and Health Sciences, Université de Sherbrooke,
Sherbrooke, Quebec, Canada
5 Faculty of Kinesiology and Physical Education, University of Toronto, Toronto, Ontario,
Canada
6 CHUM Research Center/Montreal Hospital University Research Center, Montreal, Quebec,
Canada
7 Department of Management and Human Resources, Business School, Université de
Sherbrooke, Sherbrooke, Quebec, Canada
8 Department of Speech Language Therapy, Université du Québec à Trois-Rivières, Trois-
Rivières, Quebec, Canada
9 School of Social Work, Faculty of Letters and Human Sciences, Université de Sherbrooke,

2
Sherbrooke, Quebec, Canada
10 Department of Human and Social Sciences, Université du Québec à Chicoutimi, Saguenay,
Quebec, Canada
11 Department of Public Health and Nursing, Faculty of Social Sciences and Technology
Management, Norwegian University of Science and Technology, Trondheim, Norway
12 Eastern Townships Public Health Department, Eastern Townships Integrated University Health
and Social Services Center, Sherbrooke, Quebec, Canada
13 Department of Community Health Sciences, Faculty of Medicine and Health Sciences,
Université de Sherbrooke, Sherbrooke, Quebec, Canada
Please address correspondence to:
Mathieu Roy, Ph.D., HTA Unit, CIUSSS de l’Estrie - CHUS, Hôpital Hôtel-Dieu, 580 rue
Bowen, Local 5442, Sherbrooke, Quebec J1G 2E8, Canada. Phone: 001-819-780-2220 (ext.
25445).
Email: [email protected]
Word count of the abstract: 248/250
Word count of the main text: 349/3500
Number of pages: 29
Number of tables: 4
Conflict of interest: The authors declare no conflicts of interest

3
Abstract
To increase capacities and control over health, it is necessary to foster assets (i.e. factors
enhancing abilities of individuals or communities). Acting as a buffer, assets build foundations
for overcoming adverse conditions and improving health. However, little is known about the
distribution of assets and their associations with social position and health. In this study, we
documented the distribution of health assets and examined whether these assets moderate
associations between adverse social position and self-reported health.
A representative population-based cross-sectional survey of adults in the Eastern Townships,
Quebec, Canada (n = 8737) was conducted in 2014. Measures included assets (i.e. resilience,
sense of community belonging, positive mental health, social participation), self-reported health
(i.e. perceived health, psychological distress), and indicators of social position. Distribution of
assets was studied in relation to gender and social position. Logistic regressions examined
whether each asset moderated associations between adverse social position and self-reported
health.
Different distributions of assets were observed with different social positions. Women were more
likely to participate in social activities while men were more resilient. Resilience and social
participation were moderators of associations between adverse social position (i.e. living alone,
lower household income) and self-reported health.
Having assets contributes to better health by increasing capacities. Interventions that foster assets
and complement current public health services are needed, especially for people in unfavorable
situations. Health and social services decision-makers and practitioners could use these findings
to increase capacities and resources rather than focusing primarily on preventing diseases and
reducing risk factors.

4
Keywords: Public health; Health promotion; Health assets; Capacities; Resilience,
Psychological; Mental health; Adaptation, Psychological; Social participation.

5
Introduction
In 1986, the World Health Organization (WHO) defined health promotion as the process
by which individuals and communities increase control over their health.1 Thirty years later,
despite huge steps forward in public health, health promotion practices are often still directed at
diseases and risk factors. This pathogenic perspective must be complemented by a salutogenic
approach focusing on factors that create health.2-3 Health promotion is not about preventing
disease but about improving health. One way to promote health is to foster assets that help
individuals and communities increase control over their lives. As many have said2-6 it is time to
create a balance between assets and deficits in public health as this field has traditionally focused
more on vulnerabilities. Initiated by different public health entities and the Ottawa Charter for
Health Promotion,1 this shift toward building capacities in public health is relatively recent.
Actions and models are beginning to move away from diseases and toward health determinants
and capacities. Current health promotion should bring together such actions and models under a
unifying theory and translate it into concrete practices.7
Even though the concept of health as a set of capacities is quite recent in public health, it
is well established elsewhere. Over recent decades, many positive health concepts emerged in the
social sciences. For example, Bandura talked about self-efficacy8 and Cyrulnik about resilience9
while Antonovsky introduced the concept of sense of coherence.10 From Antonovsky's
salutogenic theory that views health along the ease-disease continuum,10 a salutogenic
orientation emerged.11 This orientation encompasses a sense of coherence and other positive
health concepts with a view to uniting approaches that focus on capacities rather than
vulnerabilities. This orientation provides a unifying theory for moving forward with health
promotion. To translate this theory into practice, on behalf of the WHO Morgan and Ziglio

6
developed the health assets model5 in which assets are factors enhancing abilities of individuals,
communities, systems or institutions.11 Such assets operate as capacities and act as buffers
against stresses.5 Like others, Morgan and Ziglio argued that public health focuses too much on
deficits. Even though knowledge of deficits is essential to identify problems, focusing on deficits
may increase dependence on limited services. To restore a balance, more knowledge about assets
must be produced and transferred to decision-makers to foster asset-based actions.5
There is increasing evidence that having more assets has a positive influence on
health.3,5,12 Studies point to two main ways in which assets help to increase capacities and
promote health. First, many studies identify direct associations between assets and better health.
For example, a systematic review of the literature which included 458 scientific publications and
13 doctoral theses showed that a stronger sense of coherence (SOC) is associated with better
health (especially mental health) among individuals and populations regardless of age, gender,
ethnicity, and study design.13 Other studies14-15 (including a 15-year prospective cohort study15)
highlighted direct associations between a stronger SOC and less likelihood of self-harming
behaviors15 and reduced alcohol, drug, and cigarette intake.14 Another recent systematic review
of the literature focusing on assets among seniors concluded that asset-based actions uncover the
skills, knowledge, and potentials of older adults and help to empower them.16 Assets in this
review were diverse and included being religious, social participation, control over one’s life,
self-achievement, life satisfaction, social ties, and others.16 Besides such direct associations
between a larger number of assets and positive health, studies also identified indirect
associations. In these studies, assets moderated effects between unhealthy states or behaviors and
undesirable outcomes. For example, a moderating effect of the SOC concept and resilience was
observed on stress and mental health.17-19 In other words, having more assets was linked to better

7
mental health, for equal levels of stress. Some studies on resilience indicated fewer depressive
symptoms among resilient adults who were exposed to trauma or abuse in their childhood.20
Social capital was also identified as a moderator of individual characteristics (i.e. income,
education) and health-related behaviors.21-23 Literature on indirect associations of assets between
adverse social conditions and health thus exists but is scarce in the public health arena. In fact,
there are few large high-quality surveys including assets and health outcomes anywhere in the
world.
To address this limitation, the regional public health authority in the Eastern Townships,
Quebec, Canada included assets in a survey of a large representative sample of adults to update
their monitoring data and tailor local actions. Using this survey, the objectives of this study were
to 1) document the distribution of health assets, and 2) examine whether these assets moderate
associations between adverse social position and self-reported health. The hypotheses were that
1) assets are available at a population level, and 2) the positive association between indicators of
adverse social position and poorer self-reported health would be weaker among people with
more assets.
Methods
The Eastern Townships Population Health Survey
The 2014 Eastern Townships Population Health Survey (ETPHS) is a cross-sectional
study representative of adults in the Eastern Townships, Quebec, Canada. This region includes a
mix of urban, semi-urban, and rural areas. Its population is around 300,000 and 93.4% is French-
speaking.24 About half of this population lives in Sherbrooke (Quebec’s 6th largest city25).
Study Sample and Missing Data for Analyses

8
The ETPHS involved 8737 adults aged 18 to 106 years (mean=54.9; SD=15.3). Based on
a random digit dialing procedure including cellular phones, respondents were randomly selected
according to age and gender. Respondents were selected in three steps: 1) random selection of
households, 2) confirmation of household eligibility (in Eastern Townships, with someone ≥18
years of age), and 3) random selection of a household member aged ≥18. The randomly selected
respondent in the household could not be substituted. If the respondent was not available,
reminders were sent to complete the interview at another time. To gather local estimates with
accuracy, around 800 participants living in residential units or private homes were surveyed in
each area of the Townships and boroughs of Sherbrooke. Businesses, people living in second or
nursing homes, and people without a private phone line were excluded. Respondents answered a
phone or online questionnaire. An independent firm trained to administer questionnaire surveys
collected the data. The Ethics Committee of the Eastern Townships Integrated University Health
and Social Services Center approved this study.
Missing data for analyses ranged from 0 to 144 among men (3.5%) and 0 to 272 among
women (5.9%). With the exception of women who were more likely not to report their household
income, the profile of adults with missing data did not differ from that of those with complete data.
Measures
Health assets. Four health assets were surveyed in the ETPHS (i.e. resilience, positive
mental health, social participation, sense of community belonging). All four assets were used to
test the research hypotheses.
Resilience. Resilience is the individual’s or community’s capacity to adapt positively
when faced with stressful or traumatic events.26 This asset was captured using the 10-item
Connor-Davidson Resilience Scale,27 which is designed to measure the ability to cope with

9
adversity based on 10 questions assessing the extent to which, over the previous month,
respondents felt able to deal with problems that arose.28 This measure gives a composite score
ranging from 0 to 40 (sum of 10 items scored between 0 and 4), with higher scores indicating
greater resilience.28 This measure has good construct validity and internal consistency (Cronbach
α=0.88) and has been used in large studies.29-30 Because of non-normal distribution and as other
authors did,31-33 total scores were categorized (0-10, 11-20, 21-30, 31-40) to look for non-linear
associations.
Positive mental health. Positive mental health was captured with the 14-item Mental
Health Continuum-Short Form questionnaire (MHC-SF) which provides a mental health
assessment based on hedonic (3 items) and eudemonic (11 items) approaches to well-being.34-35
This measure acknowledges that mental health is more than the absence of mental disorders as
people with such disorders are able to experience well-being and quality of life while people
without such disorders can experience low levels of mental health.36 Because it captures an asset
rather than negative health or vulnerabilities, this positive view of mental health differs from
outcomes used in this study, namely perceived health and psychological distress. Participants
indicated how often in the last month they experienced each item (e.g. happy, interested in life)
using a six-point Likert scale (i.e. never, rarely, a few times, often, most of the time, always). The
MHC-SF proposes three mental health levels: flourishing, moderate, and languishing.
Flourishing mental health is defined as answering “Always” or “Most of the time” to one of the
three hedonic dimension items and six of the 11 eudemonic dimension items. Languishing
mental health is defined as answering “Never” or “Rarely” to the same number of items in the
same dimensions. People whose mental health is neither flourishing nor languishing are
categorized as having moderate mental health. The MHC-SF has good reliability and was

10
validated with many languages37-38 including Canadian French.39 In this study, moderate and
languishing mental health levels were merged because the proportion of the latter was too small.
Social participation. Taken from Statistics Canada’s Participation and Activity
Limitation Survey,40 this measure is an eight-item scale assessing the frequency of involvement
in social activities (e.g. friends outside the home, church or religion, sports or physical).
Response options were converted into days per month.41 A composite score of social activities
per month between 0 and 160 was calculated by summing the scores on each item. Higher scores
indicate greater social participation. The internal consistency of this scale is adequate (Cronbach
α=0.72).42 Because of non-normal distribution, total scores were categorized in quartiles to look
for non-linear associations. While this measure can be used with people of various ages (i.e. ≥45
years old in the Statistics Canada survey40), the ETPHS used it with adults ≥60 years.
Sense of community belonging. Taken from the Statistics Canada General Social Survey-
Social Identity43 the sense of belonging to one’s local community was assessed on a four-point
Likert scale (i.e. very weak, quite weak, quite strong, very strong). This question presents good
face and content validity43 and was dichotomized in this study (weak vs. strong).
Indicators of social position. Social position was captured with eight indicators: age (18-
49, ≥ 50), highest completed education level (high school or less, college, university), annual
household income (<$30,000, ≥$30,000), living alone (yes, no), housing status (owner, renter),
working status (full- or part-time, other), marital status (single, in a relationship, other), and
geographic location (rural, urban). Urban areas were defined as municipalities with a population
of ≥1,000 and density of ≥400 inhabitants per square kilometre.
Self-reported health. Two measures of self-reported health were assessed. One
measured global health (i.e. perceived health) and another captured possible mental health
11
problems (i.e. psychological distress). Perceived health was assessed with the question: “In
general, would you say your health is excellent, very good, good, fair, or poor?” and categorized
as fair or poor versus excellent, very good or good. Psychological distress was assessed with the
six-item Kessler Scale and the question: “In the past six months, how often did you feel (nervous,
hopeless, restless, so depressed that nothing could cheer you up, that everything was an effort,
worthless)?” Answers were no time (0), a little time (1), sometimes, (2) most of the time (3), and
all the time (4). A composite score was created and a score of seven or more was used to define
psychological distress.44 These measures have both been used in large surveys and present good
content and face validity.42-43
Statistical Analysis
The proportion of each asset was examined, and its distribution according to each
indicator of social position was investigated. Chi-square analyses were used to look for
significant differences in the proportions of each asset as a function of gender and social
position. To examine the moderating effect of each asset on the associations between adverse
social position and self-reported health, logistic regression analyses were used with a two-step
modelling procedure. The main effect of each indicator of adverse social position on both
measures of self-reported health was tested as the first step of the modelling procedure. In the
second modelling step, interaction models were tested to examine the moderating effect of each
asset (only if the main effect of social position on self-reported health was significant in the first
step). To avoid multiple testing problems resulting from the use of seven indicators of adverse
social position to predict two self-reported health outcomes, a Spearman rank-order analysis was
used to select two specific indicators of adverse social position, one capturing economic
deprivation and the other social deprivation. P values of <0.05 were considered significant.

12
Analyses were carried out in 2015-2016 and were conducted separately for men and women
using SPSS Statistics V24.
Results
Participants Characteristics
With respect to social position and self-reported health, men were more likely to hold
university degrees, have higher household incomes, be homeowners, and work full- or part-time.
Women were more likely to live alone, be single, and show psychological distress (Table 1).
Frequency of Assets
A large amount of assets was frequent at the population level (Table 1). With the
exception of social participation, which was categorized in quartiles, the proportion of each asset
was above 50%. Women were more likely to report higher levels of social participation while
men were more likely to have higher resilience scores (Table 1).
[Table 1]
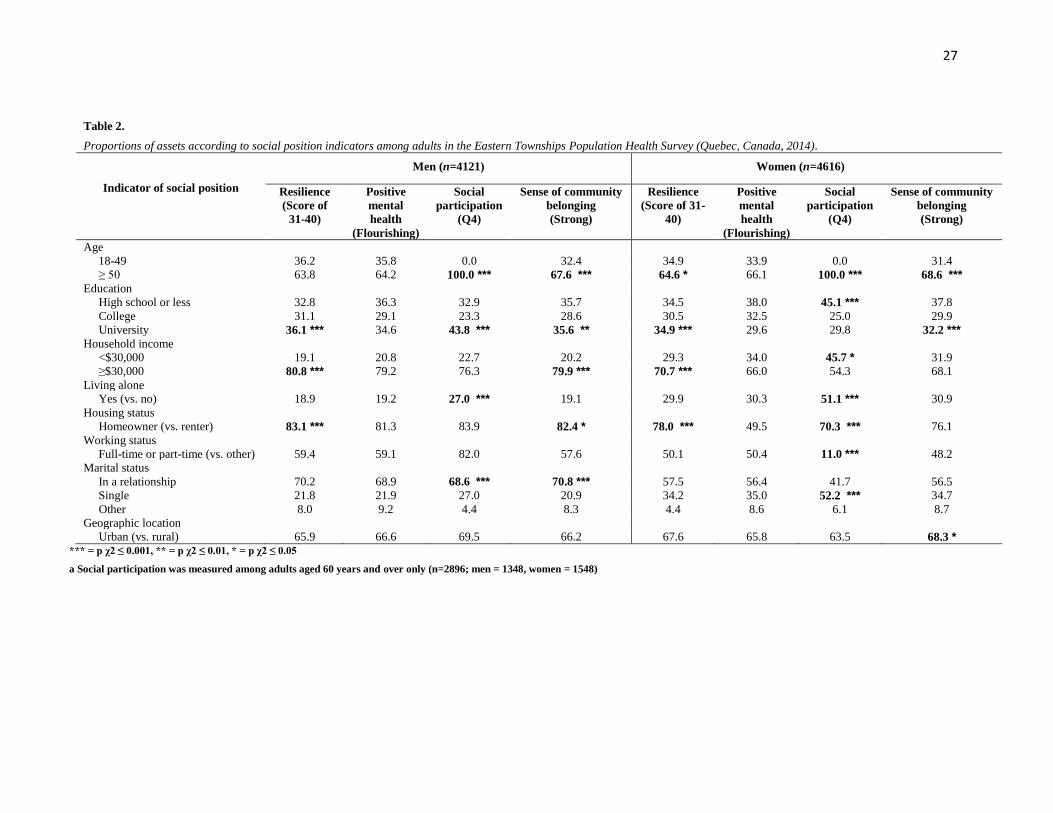
Distribution of Assets According to Social Position
Higher resilience scores were observed among homeowners, holders of university
degrees, people with higher incomes, and older women (Table 2). Different distributions of
social participation were observed with different indicators of social position. While living alone
was linked to greater social participation for both genders, lower income, being a renter, and not
working full- or part-time (e.g. being unemployed) were linked to greater social participation
among women only. More education and being in a relationship were associated with greater
social participation among men, as were less education and being single for women (Table 2). A
strong sense of community belonging was observed among older and educated adults as well as
among men with higher incomes, homeowners, and in a relationship. A strong sense of

13
community was observed among women in urban areas. Post-hoc analyses revealed that assets
were geographically distributed, with fewer assets in more deprived boroughs of Sherbrooke and
areas of the Eastern Townships.
[Table 2]
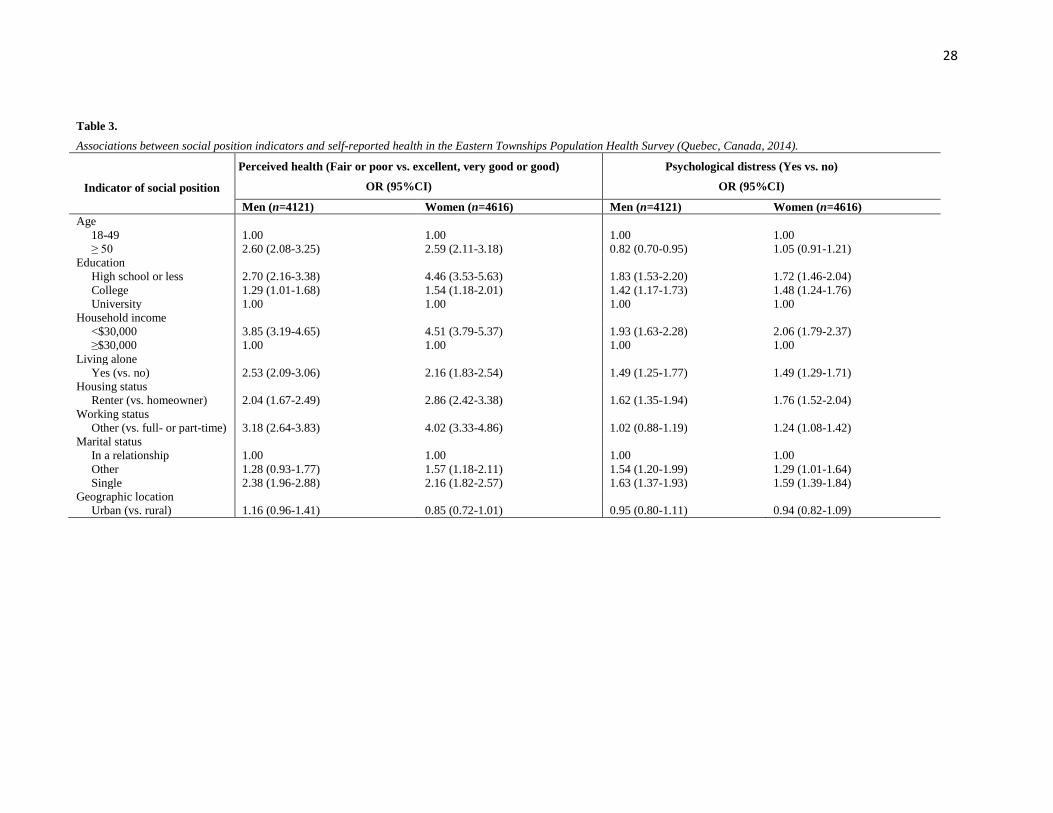
Main Effects of Social Position on Self-reported Health
With the exception of geographic location, all indicators of social position were
associated with both measures of self-reported health (Table 3). Older age was associated with
increased likelihood of fair or poor perceived health (for both genders) and protected against
psychological distress among men. These measures were also associated with less education,
lower income, living alone, being a renter, not working full- or part-time, and being single, for
both genders.
[Table 3]
Moderating Effect of Assets on Associations Between Social Position and Self-reported
Health
From the seven indicators of social position with a significant main effect on self-
reported health measures, two were retained for the interaction models, one capturing social
deprivation (i.e. living alone) and the other economic deprivation (i.e. household income). Living
alone, marital status, and age were highly correlated (0.68 < Spearman's rho < 0.84), as were
household income, working status, education, and homeownership (0.13 < Spearman's rho <
0.42). Interaction models were then run to examine whether each asset moderated the
associations between these two indicators of adverse social position and both measures of self-
reported health.

14
Moderating effects were observed for two of the four assets, namely social participation
and resilience (Table 4). These assets were found to influence the relationship between social
position and health. As expected, weaker associations were found between adverse social
position and self-reported health among people with more assets. The associations between
adverse social position (i.e. living alone, lower household income) and measures of self-reported
health (i.e. fair or poor perceived health, psychological distress) were all mitigated among
resilient adults of both genders. For example, compared to women with higher incomes, women
with lower incomes were almost four times more likely to report fair or poor health if they also
had a low resilience score (OR=3.91; 95%CI:2.01-7.60). Furthermore, the adverse influence of
living alone was not present in adults of either gender with greater social participation. No
moderating effects of positive mental health and sense of community belonging were observed.
[Table 4]
Discussion
This study documents the distribution of health assets at a population level and examines
whether assets moderate associations between adverse social position and self-reported health.
While some indicators of social position such as living alone and older age were linked to greater
social participation for both genders, others were gender-specific, namely lower income, less
education, being a renter, not working, or being single for women, and more education or being
in a relationship for men. Although results suggesting that older women are more likely to
participate in social activities corroborate previous findings,41,45-47 gender-specific results warrant
further investigation. Greater participation in social activities of single, less educated, not
working, and lower-income women might reflect their obligations, such as being a caregiver.48
Also, men with more education and in a relationship might participate more in social activities as

15
they might be more aware of the benefits of social participation and have been positively
influenced by the involvement of their significant others. Higher resilience scores (i.e. 31-40)
were frequent at the population level (men=60.1%, women=52.4%) but these results were similar
to those observed in samples examining the same asset in adults from different countries.29-30,49-51
These studies also pointed to greater resilience among men and people with higher social
positions (i.e. homeowners, holders of university degrees, higher income earners). About half of
the adults reported flourishing mental health. This high proportion at the population level is
similar to that in American studies with large samples of youth52 and adults.53 A strong sense of
community belonging was noted among older educated adults, men (with higher incomes,
homeowners, in a relationship), and urban women. These findings of high proportion of assets at
the population level suggest that resources to create health are available where people live, love
and work.
With respect to the moderating effect of assets, larger numbers of assets were linked to
weaker associations between adverse social position and self-reported health. Greater social
participation and greater resilience both decreased the adverse effect of social (living alone) and
material (lower household income) deprivation on perceived health and psychological distress.
Similar results were found in the field of psychology, where resilience is a moderator between
exposure to trauma53-55 or disaster56-57 and post-traumatic stress disorder. Assets such as
acceptance of change and spirituality have also been associated with lower rates of suicide
ideation, alcohol intake, and depression among U.S. veterans.58-60 These results with respect to
the buffering effect of assets on associations between adverse social position and self-reported
health should be considered when planning health promotion interventions.

16
According to these results, fostering assets is a complementary strategy to traditional
public health measures that could be employed by authorities to reduce inequalities for people
living in unfavorable situations. It is more feasible to develop an approach that fosters assets in
subpopulations than to create wealth in deprived areas. Because poverty cannot be completely
eliminated, practitioners can equip people living in unfavorable conditions with the capacity to
cope with adversity and improve control over their health while continuing existing efforts to
fight poverty.
Strengths and Limitations
The major strength of this study was the large representative sample. It included assets
that allowed for exploration of under-examined hypotheses in the field of public health. This
study, however, had some limitations. It was based on self-reported measures, which are subject
to misclassification. These measures increased the likelihood of social desirability and recall
biases. Because the ETPHS was cross-sectional, it was not possible to infer causality or
determine the direction of results (i.e. relationships between social participation and health may
be two-way). Some assets, such as social participation, were only measured on a subsample of
adults (i.e. ≥60 years). Finally, because this survey did not include people without a private
phone line, vulnerable people may have been excluded and the strength of the results may have
been reduced.
Conclusions
This study suggests that larger numbers of assets could act as a buffer and help increase
capacities that may, in turn, be associated with better health. The study informs practitioners and
decision-makers in the field of public health that assets are available at the population level and
that mobilizing such assets moderates associations between adverse social position and poorer

17
self-reported health. As a complement to current public health services, efforts should be
directed at fostering assets in individuals and communities in unfavorable situations. Future
studies should replicate these findings with longitudinal samples and co-construct or evaluate
upstream interventions with local communities or high-risk groups based on the use of assets.
Health authorities could use these findings to restore the balance between the current pathogenic
paradigm in the field of public health and a more salutogenic approach aimed at fostering assets
that create health.

18
Acknowledgements
The authors wish to thank the Public Health Department of the CIUSSS de l’Estrie-
CHUS and all Eastern Townships Population Health Survey participants. At the time of the
study, Mélanie Levasseur was a Junior 1 Fonds de recherche du Québec-Santé (FRQ-S)
Researcher (#26815). She is now a Canadian Institutes of Health Research (CIHR) New
Investigator (#360880). Danielle Maltais holds a research chair for traumatic events, mental
health, and resilience. Yves Couturier holds a Canada Research Chair for professional practices
in integrating gerontology services. Isabelle Doré holds a FRQ-S postdoctoral fellowship.

19
References
1. World Health Organization. Ottawa Charter for Health Promotion: an international
conference on health promotion, the move towards a new public health. Geneva (Switzerland):
World Health Organization; 1986.
2. Antonovsky A. The salutogenic model as a theory to guide health promotion. Health Promot
Int. 1996;11(1):11-18.
3. Lindstrom B, Eriksson M. The hitchhiker’s guide to salutogenesis: salutogenic pathways to
health promotion. Helsinki, Finland: Tuokinprint Oy; 2010.
4. Kretzmann J, Mcknight J. Building communities from the inside out: A path towards building
and mobilizing a community assets. Evanston (Illinois, USA): Institute for Policy Research;
1993.
5. Morgan A, Ziglio E. Revitalising the evidence base for public health: an assets model. Promot
Educ. 2007;2(Suppl. 2):17-22.
6. Hollnagel H, Malterud K. From risk factors to health resources in medical practice. Med
Health Care Philos. 2000;3(3):257-264.
7. Lindström B, Eriksson M. Contextualizing salutogenesis and Antonovsky in public health
development. Health Promot Int. 2006;21(3):238-244.
8. Bandura A. Social foundations of thought and action: a social cognitive theory. Englewood
Cliffs, NJ: Prentice-Hall; 1986.
9. Cyrulnik B. Resilience: how your inner strength can set you free from the past. New York,
USA: Tarcher/Penguin; 2011.
10. Antonovsky A. Unraveling the mystery of health: how people manage stress and stay well.
San Francisco, USA: Jossey-Bass; 1987.

20
11. Harrison D, Ziglio E, Levin L, Morgan A. Assets for health and development: developing a
conceptual framework. London (United Kingdom): World Health Organization European Office
for Investment for Health and Development; 2004.
12. Lindstrom B, Eriksson M. Bringing it all together: the salutogenic response to some of the
most pertinent public health dilemmas. In: Morgan A, Davies M, Ziglio E, eds. Health assets in
a global context: theories, methods, and actions. New York, USA: Springer; 2007:339-351.
13. Eriksson M, Lindström B. Antonovsky’s sense of coherence scale and the relation with
health: a systematic review. J Epidemiol Community Health. 2006;60(5):376-381.
14. Bergh H, Baigi A, Fridlund B, Marklund B. Life events, social support and sense of
coherence among frequent attenders in primary health care. Public Health. 2006;120(3):229-236.
15. Honkinen PL, Aromaa H, Suominen S, et al. Early childhood psychological problems predict
a poor sense of coherence in adolescents: a 15-year follow-up study. J Health Psychol.
2009;14(4):587-600.
16. Horny-Turner YC, Peel NM, Hubbard RE. Health assets in older age: a systematic review.
BMJ Open. 2017;7:e013226.
17. Albertsen K, Nielsen ML, Borg V. The Danish psychosocial work environment and
symptoms of stress: the main, mediating and moderating role of sense of coherence. Work Stress.
2001;15(3):241-253.
18. Korotkov D, Hannah E. Extraversion and emotionality as proposed superordinate stress
moderators: a prospective analysis. Pers Individ Dif. 1994;16(5):787-792.
19. Cederblad M, Pruksachatkunakorn P, Boripunkul T, et al. Sense of coherence in a Thai
sample. Transcult Psychiatry. 2003;40(6):585-600.

21
20. Wingo AP, Wrenn G, Pelletier J, et al. Moderating effects of resilience on depression in
individuals with a history of childhood abuse or trauma exposure. J Affec Disord.
2010;126(3):411-414.
21. Kim YC, Lim JY, Park Y. Effects of health literacy and social capital on health information
behavior. J Health Commun. 2015;20(9):1084-1094.
22. Shaw A, Ibrahim S, Reid F, Ussher M, Rowlands G. Patients’ perspectives of the doctor–
patient relationship and information giving across a range of literacy levels. Patient Educ Couns.
2009;75(1):114-120.
23. von Wagner C, Semmler C, Good A, Wardle J. Health literacy and self-efficacy for
participating in colorectal cancer screening: The role of information processing. Patient Educ
Couns. 2009(3);75, 352-357.
24. Statistics Canada. 2011 Canadian Census. Ottawa, Ontario: Statistics Canada; 2011.
25. Quebec municipalities by population.
https://fr.wikipedia.org/wiki/Liste_des_municipalit%C3%A9s_du_Qu%C3%A9bec_par_populatio
n. Accessed March 29, 2017.
26. Luthar SS, Cicchetti D, Becker B. The construct of resilience: a critical evaluation and
guidelines for future work. Child Dev. 2000;71(3):543-562.
27. Connor KM, Davidson JRT. Development of a new resilience scale: the Connor-Davidson
Resilience Scale (CD-RISC). J Depress Anxiety. 2003;18(2):71-82.
28. Campbell‐Sills L, Stein MB. Psychometric analysis and refinement of the Connor-Davidson
resilience scale (CD‐RISC): Validation of a 10‐item measure of resilience. J Trauma Stress.
2007;20(6):1019-1028.

22
29. Antunez JM, Navarro JF, Adan A. Circadian typology is related to resilience and optimism in
healthy adults. Chronobiol Int. 2015;32(4):524-530.
30. Jeste DV, Savia GN, Thompson WK, et al. Association between older age and more
successful aging: critical role of resilience and depression. Am J Psychiatry. 2013;170(2):188-
196.
31. Scali J, Gandubert C, Ritchie K, et al. Measuring resilience in adult women using the 10-
items Connor-Davidson resilience scale (CD-RISC): role of trauma exposure and anxiety
disorders. PLoS One. 2012;7(6):e39879.
32. Min JA, Yoon S, Lee CU, et al. Psychological resilience contributes to low emotional
distress in cancer patients. Support Care Cancer. 2013;21(9):2469-2476.
33. Rosenberg AR, Syrjala KL, Martin PJ, et al., Resilience, health, and quality of life among
long-term survivors of hematopoietic cell transplantation. Cancer. 2015;121(23):4250-4257.
34. Keyes CLM. Mental illness and/or mental health? Investigating axioms of the complete state
model of health. J Consult Clin Psychol. 2005;73(3):539-548.
35. Keyes CLM. The mental health continuum: From languishing to flourishing in life. J Health
Soc Behav. 2002;43(2):207-222.
36. Keyes CLM. Promoting and protecting mental health as flourishing: A complementary
strategy for improving national mental health. Am Psychologist. 2007;62(2):95-108.
37. Lamers SMA, Westerhof GJ, Bohlmeijer ET, ten Klooster PM, Keyes CLM. Evaluating the
psychometric properties of the Mental Health Continuum-Short Form (MHC-SF). J Clin
Psychol. 2011;67(1):99-110.
38. Westerhof GJ, Keyes CLM. Mental illness and mental health: The two continua model across
the lifespan. J Adult Dev. 2010;17(2),110-119.

23
39. Doré I, O’Loughlin J, Sabiston CM, Fournier L. Psychometric evaluation of the mental
health continuum–short form (MHC-SF) in French Canadian young adults. Can J Psychiatry.
2016;62(4):286-294.
40. Statistics Canada. Participation and Activity Limitation Survey. Ottawa, Ontario: Statistics
Canada; 2006.
41. Richard L, Gauvin L, Gosselin C, Laforest S. Staying connected: neighbourhood correlates of
social participation among older adults living in an urban environment in Montreal, Quebec.
Health Prom Int. 2009;24(1):46-57.
42. Naud D, Généreux M, Vanasse A, et al. Participation and barriers to community activities
among older Canadians: Differences and similarities according to gender and age. Arch Gerontol
Geriatr. Submitted.
43. Statistics Canada. General Social Survey-Social Identity. Ottawa, Ontario: Statistics Canada;
2013.
44. Kessler RC, Barker PR, Colpe LJ, et al. Screening for serious mental illness in the general
population. Arch Gen Psychiatry. 2003;60(2):184-189.
45. Levasseur M, Cohen AA, Dubois M-F, et al. Environmental factors associated with social
participation of older adults living in metropolitan, urban and rural areas, from the NuAge study.
Am J Public Health. 2015;105(8):1718-1725.
46. Levasseur M, Gauvin L, Richard L, et al. Associations between perceived proximity to
neighborhood resources, disability, and social participation among community-dwelling older
adults: results from the VoisiNuAge study. Arch Phys Med Rehabil. 2011;92(12):1979-1986.
47. Gilmour H. Social participation and the health and well-being of Canadian seniors. Health
Rep. 2012;23(4):23-32.

24
48. Naud D, Généreux M, Vanasse A, et al. Participation and barriers to community activities
among older Canadians: differences and similarities according to gender and age. Res Aging.
2017; Submitted.
49. Campbell-Sills L, Forde D, Stein MB. Demographic and childhood environmental predictors
of resilience in a community sample. J Psychiatric Res. 2009;43(12):1007-1012.
50. Lopes VR, Martins MCF. Valida çã o factorial da escala de resili ê ncia de Connor-Davidson
(CD-RISC-10) para Brasilieiros. Rev Psicol. 2011;11:36-50.
51. Goins RT, Gregg JJ, Fiske A. Psychometric properties of the Connor-Davidson resilience
scale with older American Indians: the Native Elder Study. Res Aging. 2012;35(2):123-143.
52. Keyes CLM. Mental health in adolescence: Is America's youth flourishing? Am. J.
Orthopsychiatry. 2006;76(3):395-402.
53. Ross A, Friedmann E, Bevans M, Thomas S. National survey of yoga practitioners: mental
and physical health benefits. Complement Med Res. 2013;21(4):313-323.
54. Salami SO. Moderating effects of resilience, self-esteem and social support on adolescents’
reactions to violence. Asian Soc Sci. 2010;6(12):101-110.
55. Sexton MB, Hamilton L, McGinnis EW, et al. The roles of resilience and childhood trauma
history: main and moderating effects on postpartum maternal mental health and functioning. J
Affec Disord. 2015;174(15):562-568.
56. Aslam N, Tariq N. Trauma, depression, anxiety, and stress among individuals living in
earthquake affected and unaffected areas. Pakistan J Psychol Res. 2010;25(2):131-148.
57. Lamet A, Szuchman L, Perkel L, et al. Risk factors, resilience, and psychological distress
among holocaust and nonholocaust survivors in the post-9/11 environment. Educ Gerontol.
2009;35(1):32-46.

25
58. Lee JEC, Sudom KA, Zamorski MA. Longitudinal analysis of psychological resilience and
mental health in Canadian military personnel returning from overseas deployment. J Occup
Health Psychol. 2013;18(3):327-337.
59. Green KT, Calhoun PS, Dennis MF. Mid-Atlantic Mental Illness Research Education and
Clinical Center Workgroup, Beckham JC. Exploration of the resilience construct in
posttraumatic stress disorder severity and functional correlates in military combat veterans who
have served since September 11, 2001. J Clin Psychiatry. 2010;71(7):823-830.
60. Pietrzak RH, Russo AR, Ling Q, Southwick SM. Suicidal ideation in treatment-seeking
veterans of operations Enduring Freedom and Iraqi Freedom: the role of coping strategies,
resilience, and social support. J Psychiatr Res. 2011;45(6):720-726.

26
Table 1.
Participants’ characteristics and proportions of assets in the Eastern Townships Population Health Survey
(Quebec, Canada, 2014).
Men (n=4121)
%
Women (n=4616)
%
Indicators of social position
Age
18-49 35.2 33.7
≥ 50 64.8 66.3
Education
High school or less 36.9 38.5
College 29.3 31.5
University 33.8 *** 30.0
Household income
<$30,000 21.4 33.2
≥$30,000 78.6 *** 66.8
Living alone
Yes (vs. no) 19.8 30.0 *** Housing status
Homeowner (vs. renter) 81.8 *** 75.4
Working status
Full-time or part-time (vs. other) 58.3 *** 49.1
Marital status
In a relationship 69.0 56.9
Single 22.5 34.5 ***
Other 8.6 8.6
Geographic location
Urban (vs. rural) 34.2 33.3
Measures of self-reported health
Perceived health
Excellent, very good or good (vs. fair or poor) 86.0 84.8
Psychological distress
Yes (vs. no) 21.8 25.5 ***
Health assets
Resilience
0-10 0.3 0.4
11-20 3.3 4.1
21-30 36.4 43.2
31-40 60.1 *** 52.4
Positive mental health
Flourishing 49.9 49.2
Not flourishing 50.1 51.8
Social participation a
Quartile 1 (≤ 8) 28.3 25.7
Quartile 2 (9-15) 24.3 23.3
Quartile 3 (16-25) 26.1 23.5
Quartile 4 (≥ 26) 21.4 27.5 ***
Sense of community belonging
Weak 40.7 43.4
Strong 59.3 56.6
*** = p 𝝌2 ≤ 0.001
a Social participation was measured among adults aged 60 years and over only (n=2896; men =
1348, women = 1548)
27
Table 2.
Proportions of assets according to social position indicators among adults in the Eastern Townships Population Health Survey (Quebec, Canada, 2014).
Indicator of social position
Men (n=4121)
Women (n=4616)
Resilience
(Score of
31-40)
Positive
mental
health
(Flourishing)
Social
participation
(Q4)
Sense of community
belonging
(Strong)
Resilience
(Score of 31-
40)
Positive
mental
health
(Flourishing)
Social
participation
(Q4)
Sense of community
belonging
(Strong)
Age
18-49 36.2 35.8 0.0 32.4 34.9 33.9 0.0 31.4
≥ 50 63.8 64.2 100.0 *** 67.6 *** 64.6 * 66.1 100.0 *** 68.6 *** Education
High school or less 32.8 36.3 32.9 35.7 34.5 38.0 45.1 *** 37.8
College 31.1 29.1 23.3 28.6 30.5 32.5 25.0 29.9
University 36.1 *** 34.6 43.8 *** 35.6 ** 34.9 *** 29.6 29.8 32.2 ***
Household income
<$30,000 19.1 20.8 22.7 20.2 29.3 34.0 45.7 * 31.9
≥$30,000 80.8 *** 79.2 76.3 79.9 *** 70.7 *** 66.0 54.3 68.1
Living alone
Yes (vs. no) 18.9 19.2 27.0 *** 19.1 29.9 30.3 51.1 *** 30.9
Housing status
Homeowner (vs. renter) 83.1 *** 81.3 83.9 82.4 * 78.0 *** 49.5 70.3 *** 76.1
Working status
Full-time or part-time (vs. other) 59.4 59.1 82.0 57.6 50.1 50.4 11.0 *** 48.2
Marital status
In a relationship 70.2 68.9 68.6 *** 70.8 *** 57.5 56.4 41.7 56.5
Single 21.8 21.9 27.0 20.9 34.2 35.0 52.2 *** 34.7
Other 8.0 9.2 4.4 8.3 4.4 8.6 6.1 8.7
Geographic location
Urban (vs. rural) 65.9 66.6 69.5 66.2 67.6 65.8 63.5 68.3 * *** = p χ2 ≤ 0.001, ** = p χ2 ≤ 0.01, * = p χ2 ≤ 0.05
a Social participation was measured among adults aged 60 years and over only (n=2896; men = 1348, women = 1548)
28
Table 3.
Associations between social position indicators and self-reported health in the Eastern Townships Population Health Survey (Quebec, Canada, 2014).
Indicator of social position
Perceived health (Fair or poor vs. excellent, very good or good)
OR (95%CI)
Psychological distress (Yes vs. no)
OR (95%CI)
Men (n=4121) Women (n=4616) Men (n=4121) Women (n=4616)
Age
18-49 1.00 1.00 1.00 1.00
≥ 50 2.60 (2.08-3.25) 2.59 (2.11-3.18) 0.82 (0.70-0.95) 1.05 (0.91-1.21)
Education
High school or less 2.70 (2.16-3.38) 4.46 (3.53-5.63) 1.83 (1.53-2.20) 1.72 (1.46-2.04)
College 1.29 (1.01-1.68) 1.54 (1.18-2.01) 1.42 (1.17-1.73) 1.48 (1.24-1.76)
University 1.00 1.00 1.00 1.00
Household income
<$30,000 3.85 (3.19-4.65) 4.51 (3.79-5.37) 1.93 (1.63-2.28) 2.06 (1.79-2.37)
≥$30,000 1.00 1.00 1.00 1.00
Living alone
Yes (vs. no) 2.53 (2.09-3.06) 2.16 (1.83-2.54) 1.49 (1.25-1.77) 1.49 (1.29-1.71)
Housing status
Renter (vs. homeowner) 2.04 (1.67-2.49) 2.86 (2.42-3.38) 1.62 (1.35-1.94) 1.76 (1.52-2.04)
Working status
Other (vs. full- or part-time) 3.18 (2.64-3.83) 4.02 (3.33-4.86) 1.02 (0.88-1.19) 1.24 (1.08-1.42)
Marital status
In a relationship 1.00 1.00 1.00 1.00
Other 1.28 (0.93-1.77) 1.57 (1.18-2.11) 1.54 (1.20-1.99) 1.29 (1.01-1.64)
Single 2.38 (1.96-2.88) 2.16 (1.82-2.57) 1.63 (1.37-1.93) 1.59 (1.39-1.84)
Geographic location
Urban (vs. rural) 1.16 (0.96-1.41) 0.85 (0.72-1.01) 0.95 (0.80-1.11) 0.94 (0.82-1.09)

29
Table 4.
Moderating effect of social participation and resilence on the associations between adverse social position indicators (i.e. living alone, household income) and self-reported health
(i.e. perceived health, psychological distress) among adults in the Eastern Townships Population Health Survey (Quebec, Canada, 2014).
Indicator of social position
Perceived health (Fair or poor vs. excellent, very good or good)
OR (95%CI)
Psychological distress (Yes vs. no)
OR (95%CI)
Men (n=4121) Women (n=4616) Men (n=4121) Women (n=4616)
Living alone (yes vs. no)
Social participation (Quartile 1)
Social participation (Quartile 2)
Social participation (Quartile 3)
2.29 (1.20-4.39)
1.84 (1.01-3.34)
1.51 (0.86-2.66)
1.77 (1.08-2.92)
1.71 (1.07-2.74)
1.05 (0.66-1.66)
1.35 (0.86-2.13)
1.98 (0.97-2.99)
1.54 (0.92-2.60)
1.67 (1.09-2.54)
1.56 (1.00-2.44)
1.49 (0.99-2.23)
Social participation (Quartile 4) 1.51 (0.98-2.29) 1.35 (0.93-1.97) 1.13 (0.60-2.12) 1.22 (0.83-1.79)
Resilience score between 0-20
Resilience score between 21-30
3.25 (1.69-6.25)
2.62 (1.99-3.46)
2.19 (1.84-2.61)
2.04 (1.70-2.80)
2.03 (1.04-3.95)
1.43 (1.10-1.87)
4.13 (3.47-5.00)
1.62 (0.89-2.77)
Resilience score between 31-40 2.33 (1.90-2.86) 1.32 (0.77-2.24) 1.24 (0.93-1.64) 1.30 (0.81-2.44)
Household income (<$30,000 vs. ≥$30,000)
Social participation (Quartile 1)
Social participation (Quartile 2)
Social participation (Quartile 3)
2.25 (1.49-3.40)
2.25 (1.44-4.53)
2.21 (1.82-5.31)
3.51 (2.04-6.04)
3.85 (2.83-8.33)
2.82 (1.72-4.64)
1.12 (1.01-1.76)
1.19 (0.65-2.19)
1.22 (0.63-2.38)
1.93 (1.25-2.97)
1.57 (0.93-2.35)
1.71 (1.12-2.60)
Social participation (Quartile 4) 2.27 (1.15-4.46) 2.90 (1.89-4.46) 1.23 (0.63-2.40) 1.82 (1.20-2.77)
Resilience score between 0-20
Resilience score between 21-30
3.70 (3.03-4.51)
3.50 (2.62-4.74)
3.91 (2.01-7.60)
3.71 (2.89-4.85)
1.72 (1.43-2.06)
1.65 (1.26-2.17)
1.90 (1.55-2.32)
1.85 (1.47-2.34)
Resilience score between 31-40 2.35 (1.20-4.60) 1.43 (1.23-1.66) 1.38 (0.74-2.60) 0.83 (0.45-1.54)