Embed Size (px)
Citation preview

Looking Back!Looking Back!
A review of the first 4 chaptersA review of the first 4 chapters

Quick Survey…

The “Monty Hall” Paradox
On “Let’s Make a Deal” a contestant is told that behind one of the 3 doors is a new, 2007 Mazda Miata. Behind the other 2 are lovely goats! You get what you choose! You are asked to select a door. The game show host then reveals a door behind which is one of the goats.
Question:Should the contestant change his or her initial choice?
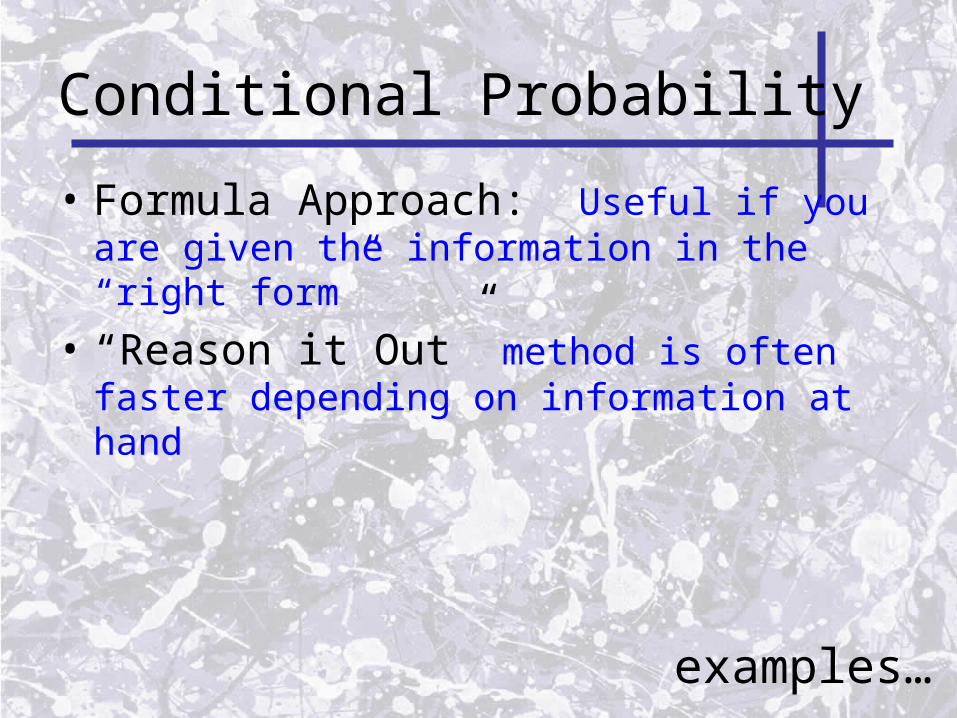
Conditional Probability
• Formula Approach: Useful if you are given the information in the “right form”
• “Reason it Out” method is often faster depending on information at hand
examples…

Example 1:
• 30% of police trainees pass both of their training exams and 65% passed their first exam. How many who passed the 1st exam also pass the 2nd exam?
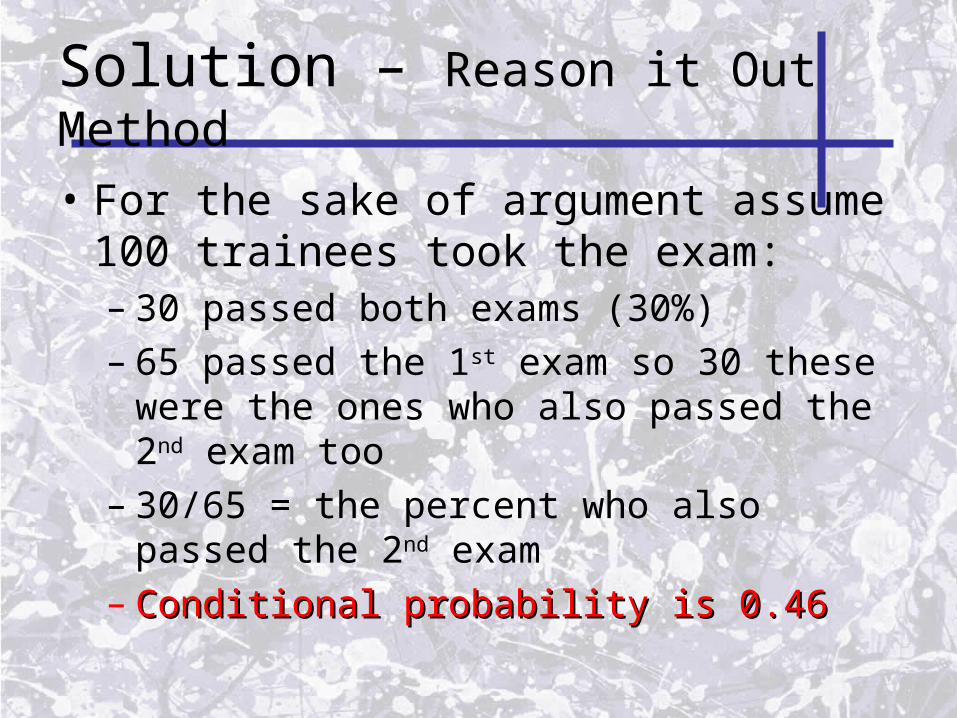
Solution – Reason it Out Method
• For the sake of argument assume 100 trainees took the exam:– 30 passed both exams (30%)– 65 passed the 1st exam so 30 these were the
ones who also passed the 2nd exam too– 30/65 = the percent who also passed the 2nd
exam– Conditional probability is 0.46Conditional probability is 0.46

Solution – Formula Method
• Identify what the “conditional” is. Re-state as: Find the probability of passing the 2nd exam given that you passed the 1st exam
• P(A and B) = passing both = 0.30• P(A) = probability of passing 1st = 0.65
B
A
( ) 0.30( | ) 0.46
( ) 0.65
P A BP B A
P A

Final comments on conditional probabilities…
• Try to re-phrase the information in the P(B|A) form
• Clearly identify what information you have – use either the “reasoning” or formula method
• Question: Is P(A|B) = P(B|A)?
Return to main menu

Scatter plots and Models
• Sometimes transforming the explanatory variable can “straighten” a scatter plot
• You can “straighten” by:– Raising explanatory variable to a power– Taking the log of both– Taking the log of the responding variable
• Regression line provides a model that links an explanatory to a responding variable
Return to main menu

Example .. In the Physics Lab
• Students measure the distance and object falls as a function of time…
Get Excel spreadhseet of this

This can be linearized by plotting distance wrt time2

A Cubic relation…
return

Why do we need this?
• Logarithms flatten AND compress data• Example…Question 2.105
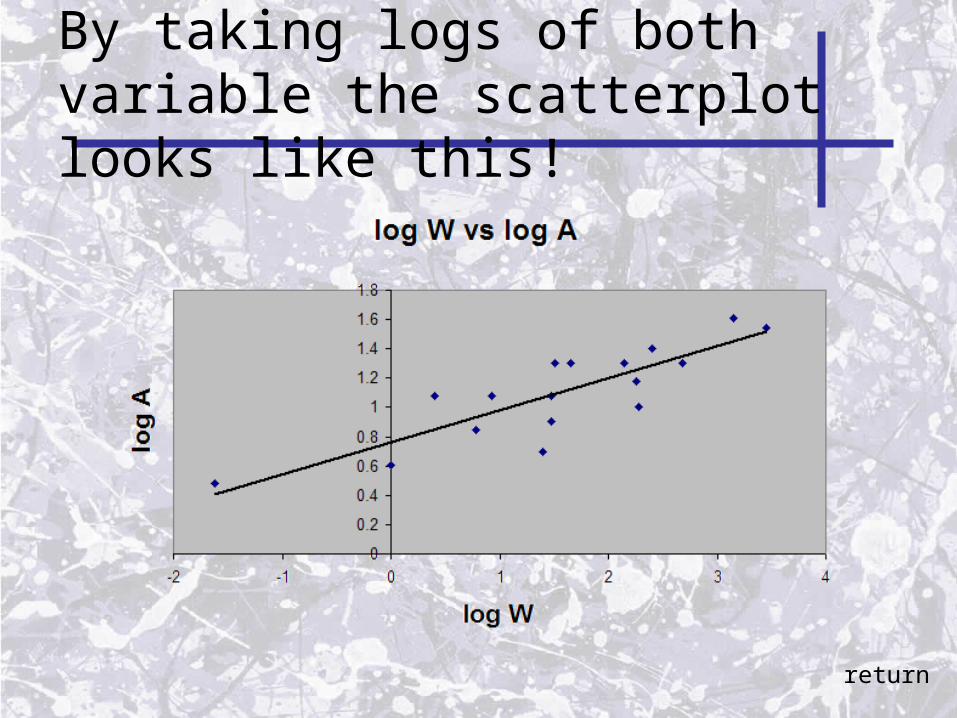
By taking logs of both variable the scatterplot looks like this!
return

return

Spread and Central Tendency
• Means, medians and modes are all different ways to evaluate the central tendency in data
• Variance and standard deviation measure scatter
• Interquartile spread and 1.5xIQR help detect outliers
• Normal distribution is a “key” distribution

The “Rule”
• Normally distributed data has the following critical property:
The 68-95-99.7 RuleThe 68-95-99.7 Rule
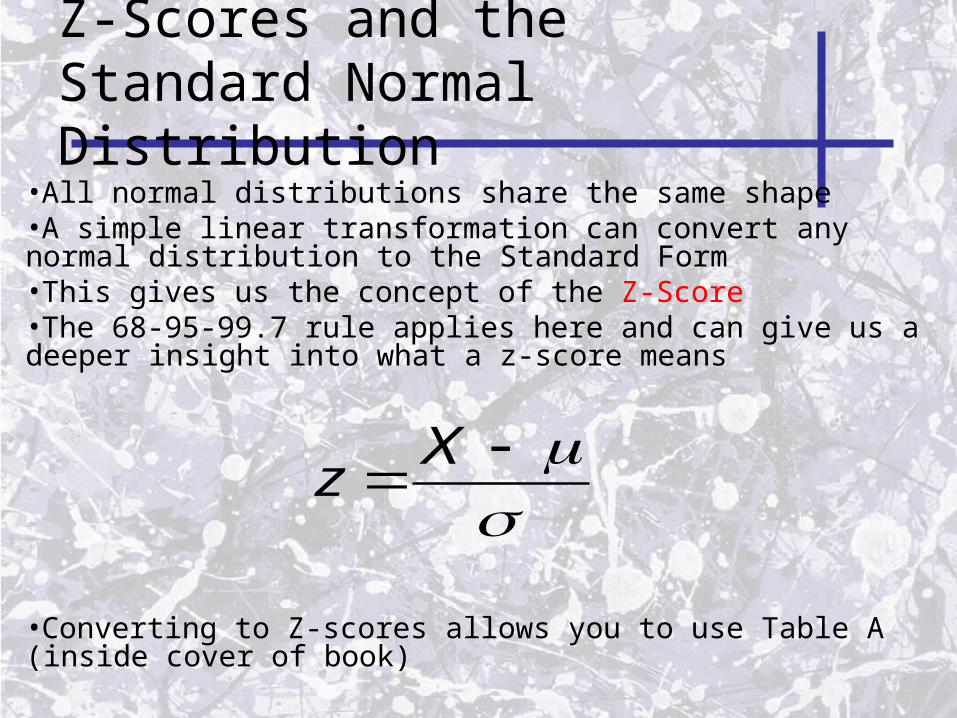
Z-Scores and the Standard Normal Distribution
•All normal distributions share the same shape•A simple linear transformation can convert any normal distribution to the Standard Form•This gives us the concept of the Z-Score•The 68-95-99.7 rule applies here and can give us a deeper insight into what a z-score means
•Converting to Z-scores allows you to use Table A (inside cover of book)
Xz

Using z-scores…
Z
If the z-score for a dataPoint is 1 then this means That 84.13% of the samplesIn the population are less thanThe value of this data point
How do you interpreta z-score of -1.71?

Who’s the Greatest?
Ty Cobb batted 0.420In 1911
N(0.266,0.0371)
Ted Williams batted0.406 in 1941
N(0.267,0.0326)
George Brett batted 0.390 in 1980
N(0.261,0.0317)
z = 4.15
z = 4.26
z = 4.07
Return to main menu