Embed Size (px)
Citation preview
Looking against the light: How perception of translucencydepends on lighting direction
Bei Xiao # $Department of Computer Science, American University,
Washington, DC, USA
Bruce Walter # $Department of Computer Science, Cornell University, Ithaca,
NY, USA
Ioannis Gkioulekas # $Harvard School of Engineering and Applied Sciences,
Cambridge, MA, USA
Todd Zickler # $Harvard School of Engineering and Applied Sciences,
Cambridge, MA, USA
Edward AdelsonDepartment of Brain and Cognitive Sciences,
Massachusetts Institute of Technology, Cambridge, MA, USA
Kavita Bala # $
Computer Science and Artificial Intelligence Laboratory,Massachusetts Institute of Technology, Cambridge, MA, USA
Department of Computer Science, Cornell University,Ithaca, NY, USA
Translucency is an important aspect of materialappearance. To some extent, humans are able toestimate translucency in a consistent way acrossdifferent shapes and lighting conditions, i.e., to exhibittranslucency constancy. However, Fleming and Bulthoff(2005) have shown that that there can be large failuresof constancy, with lighting direction playing an importantrole. In this paper, we explore the interaction of shape,illumination, and degree of translucency constancy moredeeply by including in our analysis the variations intranslucent appearance that are induced by the shape ofthe scattering phase function. This is an aspect oftranslucency that has been largely neglected. We usedappearance matching to measure how perceivedtranslucency depends on both lighting and phasefunction. The stimuli were rendered scenes thatcontained a figurine and the lighting direction wasrepresented by spherical harmonic basis function.Observers adjusted the density of a figurine under onelighting condition to match the material property of atarget figurine under another lighting condition. Acrossthe trials, we varied both the lighting direction and thephase function of the target. The phase functions weresampled from a 2D space proposed by Gkioulekas et al.
(2013) to span an important range of translucentappearance. We find the degree of translucencyconstancy depends strongly on the phase function’slocation in the same 2D space, suggesting that the spacecaptures useful information about different types oftranslucency. We also find that the geometry of an objectis important. We compare the case of a torus, which hasa simple smooth shape, with that of the figurine, whichhas more complex geometric features. The complexshape shows a greater range of apparent translucenciesand a higher degree of constancy failure. In summary,humans show significant failures of translucencyconstancy across changes in lighting direction, but theeffect depends both on the shape complexity and thetranslucency phase function.
Introduction
Many natural materials we encounter every day aretranslucent, including the food we eat, the liquids wedrink, and our skin. The translucent appearance of
Citation: Xiao, B., Walter, B., Gkioulekas, I., Zickler, T., Adelson, E., & Bala, K. (2014). Looking against the light: how perception oftranslucency depends on lighting direction. Journal of Vision, 14(3):17, 1–22, http://www.journalofvision.org/content/14/3/17,doi:10.1167/14.3.17.
Journal of Vision (2014) 14(3):17, 1–22 1http://www.journalofvision.org/content/14/3/17
doi: 10 .1167 /14 .3 .17 ISSN 1534-7362 ! 2014 ARVOReceived October 7, 2013; published March 13, 2014
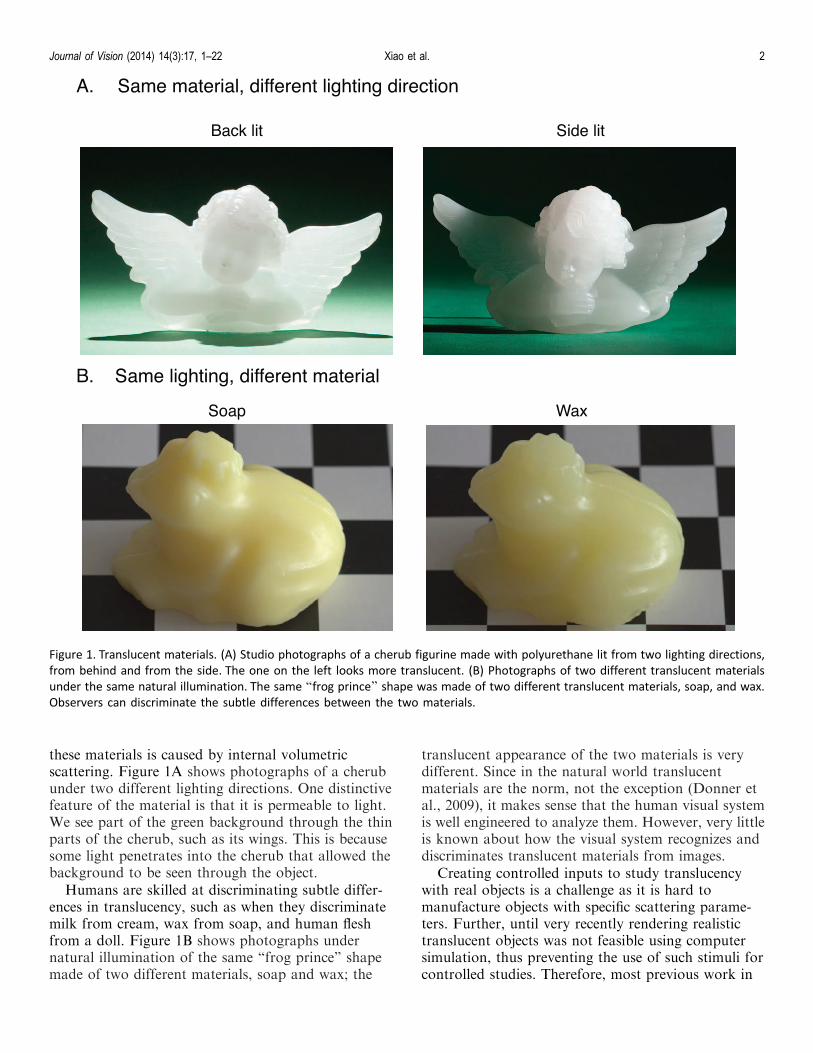
these materials is caused by internal volumetricscattering. Figure 1A shows photographs of a cherubunder two different lighting directions. One distinctivefeature of the material is that it is permeable to light.We see part of the green background through the thinparts of the cherub, such as its wings. This is becausesome light penetrates into the cherub that allowed thebackground to be seen through the object.
Humans are skilled at discriminating subtle differ-ences in translucency, such as when they discriminatemilk from cream, wax from soap, and human fleshfrom a doll. Figure 1B shows photographs undernatural illumination of the same ‘‘frog prince’’ shapemade of two different materials, soap and wax; the
translucent appearance of the two materials is verydifferent. Since in the natural world translucentmaterials are the norm, not the exception (Donner etal., 2009), it makes sense that the human visual systemis well engineered to analyze them. However, very littleis known about how the visual system recognizes anddiscriminates translucent materials from images.
Creating controlled inputs to study translucencywith real objects is a challenge as it is hard tomanufacture objects with specific scattering parame-ters. Further, until very recently rendering realistictranslucent objects was not feasible using computersimulation, thus preventing the use of such stimuli forcontrolled studies. Therefore, most previous work in
Figure 1. Translucent materials. (A) Studio photographs of a cherub figurine made with polyurethane lit from two lighting directions,from behind and from the side. The one on the left looks more translucent. (B) Photographs of two different translucent materialsunder the same natural illumination. The same ‘‘frog prince’’ shape was made of two different translucent materials, soap, and wax.Observers can discriminate the subtle differences between the two materials.
Journal of Vision (2014) 14(3):17, 1–22 Xiao et al. 2
translucency perception has focused on stimuli withsimple shapes, unnatural illumination, and a limited setof materials. These works hypothesized that image cuessuch as specular highlights, blur, image contrast, andcolor variation could influence the perception oftranslucency. However, to understand translucencyperception in the real world, we need to expand on eachof these three parameters: We need to consider complexshapes, realistic lighting, and a richer set of materials.
It is commonly observed that lighting has dramaticeffects on translucent objects: They tend to appearmore translucent under backlighting. For example,people often hold up a translucent object against a lightwhile studying it. This change in lighting direction alsocauses many of the measureable image properties (suchas image contrast, location of specular highlights, castshadows, luminance histograms, etc.) to change.Studying the effect of lighting direction on translucencycan be very informative of the images cues used by thevisual system. In addition, the lighting effect variesdepending on the 3D shapes and material properties ofobjects. For example, the translucent appearance of ajade bracelet might be more sensitive to a change oflighting direction than a bar of soap. Therefore,studying lighting on translucency perception with acontrolled 3D shape and material properties is impor-tant.
Changing lighting direction also influences theperception of 3D shape of an object, which indirectlyinfluences the perception of material properties (Ger-ardin, Kourtzi, & Mamassian, 2010; Koenderink & vanDoorn, 2001; Olkkonen & Brainard, 2011; Todd, 2004;Wijntjes & Pont, 2010). A previous study on the effectof lighting direction on translucency used a simpleshape, a torus (Fleming & Bulthoff, 2005). Byobserving translucent objects in real life, we findlighting direction influences objects that have avariation of thin and thick geometry, such as thecherub shown in Figure 1A, in a different way from anobject with a simple geometry, such as a torus (Xiao etal., 2012). Gkioulekas et al. (2013) showed thatchanging the shape of the spherical scattering distri-bution (which is called phase function; details areprovided in the section ‘‘Background and relatedwork’’) affected translucent appearance. This effect issmall for thick geometries because the appearance isdominated by high-order scattering. However, thephase function can impact appearance in a perceptuallyimportant way near thin geometric structures.
The present study aims to systematically understandhow lighting direction affects the perception oftranslucency of objects using natural shape, realisticlighting, and advanced rendering methods. Our resultshows that lighting direction has a different effect fordifferent phase functions, especially for 3D shapes thatcontain thin geometric structures.
Background and related work
We begin by introducing the physical process ofsubsurface scattering that is responsible for theappearance of the translucent objects, the phasefunction models, and current rendering methods fortranslucency. We will then review previous studies onmaterial perception and constancy, with an emphasison the effects of lighting environment and 3D shape.
Translucent materials
Subsurface scattering: Figure 2A illustrates how lightinteracts with translucent objects and the parameterscontrolling subsurface scattering. When light hits thesurface of an opaque object, it bounces back from thepoint that is illuminated. When light hits a translucentobject, only some of it bounces off from the surface.The rest penetrates into the object, refracts, andscatters multiple times within the body of the medium,until it re-emerges outside from a different location. Incomputer graphics, this process can be modeled usingthe radiative transfer equation (RTE) (Ishimaru, 1978).This approach models the material using three wave-length dependent functions, the scattering coefficient rs,the absorption coefficient ra, and the phase function p.For light at a single wavelength, rs and ra describe howrapidly the light is scattered and absorbed in themedium. When light is scattered, the phase function,which is a probability distribution over directions,describes the angular distribution of scattered light.The sum of the scattering and absorption coefficients iscalled the extinction coefficient, rt¼rsþ ra, also referredto as the density of the material, and the ratio rs/rt iscalled the albedo. The density controls the degree oftranslucency of the medium. A more translucentmedium has a low density while a less translucentmedium has a high density. When light interacts withthe medium, the albedo controls what fraction of thislight is scattered instead of being absorbed. Thescattered light then continues in new directionscontrolled by the phase function. In this paper, we usethe density, the albedo, and the phase function todescribe the scattering behavior.Phase function model: In this work, we focus on theeffect of phase function and study how the combinationof phase function and lighting direction affect perceivedtranslucency. We are motivated by the followingreasons. First, the phase function can impact appear-ance in perceptually important ways near thin geo-metric structures, where light undergoes only a handfulof scattering events before exiting towards the observer.Figure 2B illustrates how two different phase functionsaffect the appearance of translucent images, especiallynear thin edges. Second, since lighting direction oftenaffects the appearance of thin edges (see Figure 2B),
Journal of Vision (2014) 14(3):17, 1–22 Xiao et al. 3
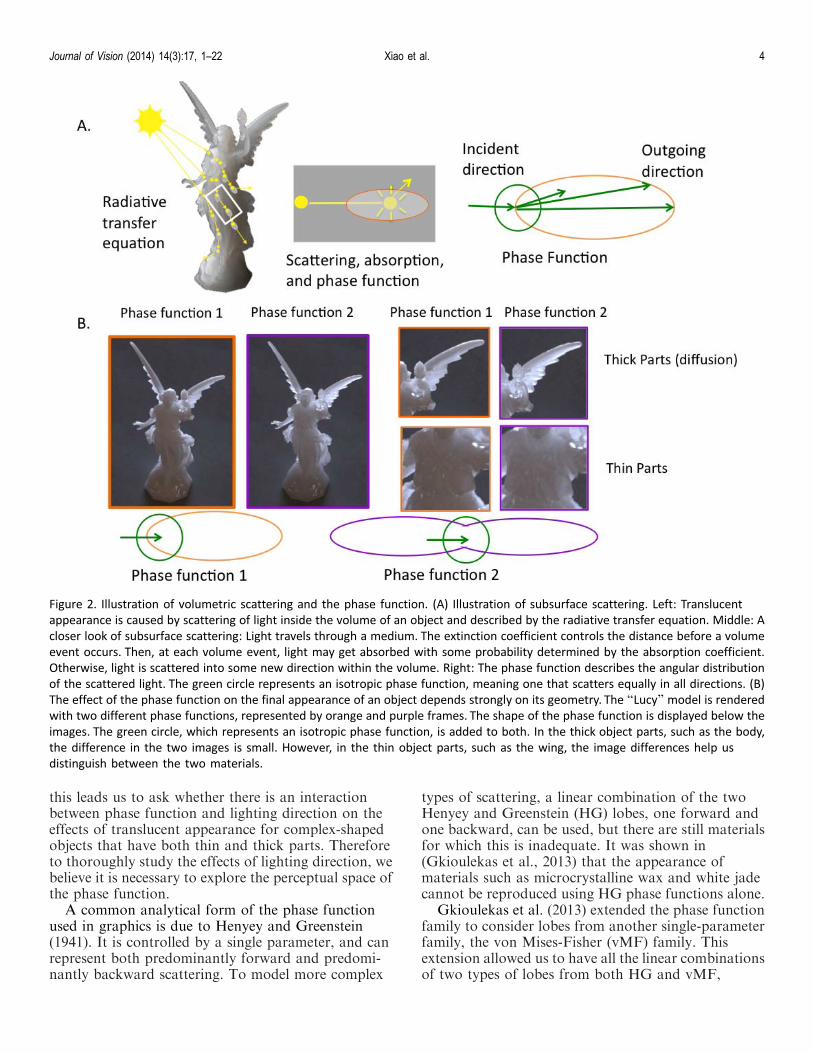
this leads us to ask whether there is an interactionbetween phase function and lighting direction on theeffects of translucent appearance for complex-shapedobjects that have both thin and thick parts. Thereforeto thoroughly study the effects of lighting direction, webelieve it is necessary to explore the perceptual space ofthe phase function.
A common analytical form of the phase functionused in graphics is due to Henyey and Greenstein(1941). It is controlled by a single parameter, and canrepresent both predominantly forward and predomi-nantly backward scattering. To model more complex
types of scattering, a linear combination of the twoHenyey and Greenstein (HG) lobes, one forward andone backward, can be used, but there are still materialsfor which this is inadequate. It was shown in(Gkioulekas et al., 2013) that the appearance ofmaterials such as microcrystalline wax and white jadecannot be reproduced using HG phase functions alone.
Gkioulekas et al. (2013) extended the phase functionfamily to consider lobes from another single-parameterfamily, the von Mises-Fisher (vMF) family. Thisextension allowed us to have all the linear combinationsof two types of lobes from both HG and vMF,
Figure 2. Illustration of volumetric scattering and the phase function. (A) Illustration of subsurface scattering. Left: Translucentappearance is caused by scattering of light inside the volume of an object and described by the radiative transfer equation. Middle: Acloser look of subsurface scattering: Light travels through a medium. The extinction coefficient controls the distance before a volumeevent occurs. Then, at each volume event, light may get absorbed with some probability determined by the absorption coefficient.Otherwise, light is scattered into some new direction within the volume. Right: The phase function describes the angular distributionof the scattered light. The green circle represents an isotropic phase function, meaning one that scatters equally in all directions. (B)The effect of the phase function on the final appearance of an object depends strongly on its geometry. The ‘‘Lucy’’ model is renderedwith two different phase functions, represented by orange and purple frames. The shape of the phase function is displayed below theimages. The green circle, which represents an isotropic phase function, is added to both. In the thick object parts, such as the body,the difference in the two images is small. However, in the thin object parts, such as the wing, the image differences help usdistinguish between the two materials.
Journal of Vision (2014) 14(3):17, 1–22 Xiao et al. 4
representing a much larger space of phase functionsand hence, a much more diverse set of materials. Thisextension increased the physical parameter space, butvery different phase functions could produce the samevisual appearance. This suggested the perceptual spaceof translucency was much smaller than this expandedphysical parameter space. That study established alower-dimensional embedding of the phase functionthat captures most of the variance in perception.
To achieve this goal, Gkioulekas et al. (2013)combined psychophysics with computational analysis.This involved three steps: First, we densely sampled thephysical parameter space of phase functions tocompute thousands of images, and employed anonmetric multidimensional scaling methods (Wills,Agarwal, Kriegman, & Belongie, 2009) with variousimage distance measures to find a two-dimensionalembedding of the space (Figure 3B). The two-dimen-sional embedding is consistent across different distancemetrics, shapes, and lighting. Second, we ran apsychophysical study, where observers performedpaired-comparisons between images. We found thatthese perceptual distances were consistent with a two-dimensional embedding that was similar to that foundcomputationally, thereby affirming the perceptualrelevance of that embedding. Thirdly, we performedstatistical analysis of the computationally obtained andperceptually consistent two-dimensional embedding, toinvestigate how its dimensions related to phase functionshape. We identified two linearly independent axes thatwere described as simple analytic expressions ofgeneralized first and second moments of the phasefunctions. We also obtained a learned distance metricthat could be used to compute an efficient approxi-mation to the perceptual distance between any twotabulated phase functions. (For details of the param-eterization of the 2D space, please see Gkioulekas et al.,2013.) The visualization of the 2D phase function wasprovided in Figure A1 in the Appendix.
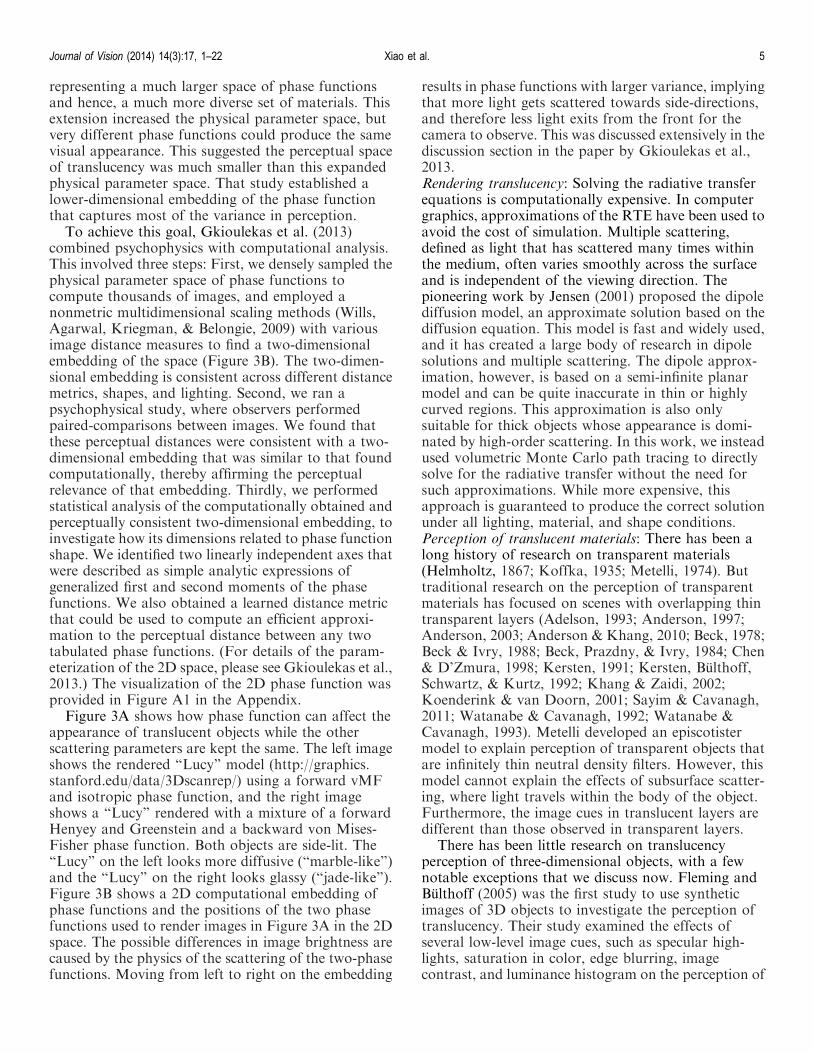
Figure 3A shows how phase function can affect theappearance of translucent objects while the otherscattering parameters are kept the same. The left imageshows the rendered ‘‘Lucy’’ model (http://graphics.stanford.edu/data/3Dscanrep/) using a forward vMFand isotropic phase function, and the right imageshows a ‘‘Lucy’’ rendered with a mixture of a forwardHenyey and Greenstein and a backward von Mises-Fisher phase function. Both objects are side-lit. The‘‘Lucy’’ on the left looks more diffusive (‘‘marble-like’’)and the ‘‘Lucy’’ on the right looks glassy (‘‘jade-like’’).Figure 3B shows a 2D computational embedding ofphase functions and the positions of the two phasefunctions used to render images in Figure 3A in the 2Dspace. The possible differences in image brightness arecaused by the physics of the scattering of the two-phasefunctions. Moving from left to right on the embedding
results in phase functions with larger variance, implyingthat more light gets scattered towards side-directions,and therefore less light exits from the front for thecamera to observe. This was discussed extensively in thediscussion section in the paper by Gkioulekas et al.,2013.Rendering translucency: Solving the radiative transferequations is computationally expensive. In computergraphics, approximations of the RTE have been used toavoid the cost of simulation. Multiple scattering,defined as light that has scattered many times withinthe medium, often varies smoothly across the surfaceand is independent of the viewing direction. Thepioneering work by Jensen (2001) proposed the dipolediffusion model, an approximate solution based on thediffusion equation. This model is fast and widely used,and it has created a large body of research in dipolesolutions and multiple scattering. The dipole approx-imation, however, is based on a semi-infinite planarmodel and can be quite inaccurate in thin or highlycurved regions. This approximation is also onlysuitable for thick objects whose appearance is domi-nated by high-order scattering. In this work, we insteadused volumetric Monte Carlo path tracing to directlysolve for the radiative transfer without the need forsuch approximations. While more expensive, thisapproach is guaranteed to produce the correct solutionunder all lighting, material, and shape conditions.Perception of translucent materials: There has been along history of research on transparent materials(Helmholtz, 1867; Koffka, 1935; Metelli, 1974). Buttraditional research on the perception of transparentmaterials has focused on scenes with overlapping thintransparent layers (Adelson, 1993; Anderson, 1997;Anderson, 2003; Anderson & Khang, 2010; Beck, 1978;Beck & Ivry, 1988; Beck, Prazdny, & Ivry, 1984; Chen& D’Zmura, 1998; Kersten, 1991; Kersten, Bulthoff,Schwartz, & Kurtz, 1992; Khang & Zaidi, 2002;Koenderink & van Doorn, 2001; Sayim & Cavanagh,2011; Watanabe & Cavanagh, 1992; Watanabe &Cavanagh, 1993). Metelli developed an episcotistermodel to explain perception of transparent objects thatare infinitely thin neutral density filters. However, thismodel cannot explain the effects of subsurface scatter-ing, where light travels within the body of the object.Furthermore, the image cues in translucent layers aredifferent than those observed in transparent layers.
There has been little research on translucencyperception of three-dimensional objects, with a fewnotable exceptions that we discuss now. Fleming andBulthoff (2005) was the first study to use syntheticimages of 3D objects to investigate the perception oftranslucency. Their study examined the effects ofseveral low-level image cues, such as specular high-lights, saturation in color, edge blurring, imagecontrast, and luminance histogram on the perception of
Journal of Vision (2014) 14(3):17, 1–22 Xiao et al. 5
translucency. Fleming and Bulthoff also studied theeffect of direction of illumination direction on trans-lucency perception. They used a simple torus-shapedobject and varied the illumination direction by rotatinga point light source. Their images were rendered usingan isotropic phase function and the dipole approxi-mation method (Jensen, 2001). They asked observers toadjust the scattering coefficient of a torus to match thetranslucency of a target torus under a different lightingdirection. They found that observers were bad atdiscounting the effect of lighting source direction and
objects tend to appear more translucent when illumi-nated from the back. In this paper, we use a similarmatching paradigm and extend their work by usingstate-of-the-art rendering to capture the translucentappearances of complex-shaped objects under differentlighting directions.
Motoyoshi (2010) found that manipulating thecontrast and blur of the nonspecular image componentof translucent objects could alter the translucentappearance. Nagai et al. (2013) used a psychophysicalreverse correlation method to extract spatial regions
Figure 3. Phase functions and translucent appearance. (A) ‘‘Lucy’’ rendered with two different phase functions but with the samedensity and albedo. (B) Two-dimensional computational embedding of phase functions constructed using a multi-dimensional scalingmethod (Gkioulekas et al., 2013). The purple dot marks the phase function used to render the left ‘‘Lucy’’ and the orange dot marksthe phase function that used to render the right ‘‘Lucy’’ in A. The gray dots represent full set of images used in the computationalembeddings (for details, please see (Gkioulekas et al., 2013, figure 7).
Journal of Vision (2014) 14(3):17, 1–22 Xiao et al. 6
related to translucency perception from renderedimages of objects. They show that the global root meansquare contrast within an entire rendered image wasnot related to perceptual translucency, but the localmean luminance of specific image regions within theimage correlates well with perceived translucency.
Recent work by Fleming, Jakel, and Maloney (2011)proposes image cues for thick transparent objects thathave irregular shapes. They discovered that imagedistortions that occur when a textured background isvisible through a refractive object are a key cue that thevisual system can use to estimate an object’s intrinsicmaterial properties.
Material constancy under variation of lighting direction
Humans are good and fast at perceiving materialproperties of objects from images (Sharan, Rosenholtz,& Adelson, 2009). Similar to color constancy, the visualsystem must be able to discount variation of lighting andviewpoint to achieve a stable representation of materialproperties (‘‘material constancy’’). There have beenmany studies on material constancy under variations ofillumination geometry, but most have focused on surfacegloss and roughness (for reviews, see Anderson, 2011;Maloney & Brainard, 2010). In a pioneering study,Fleming, Dror, and Adelson (2003) illustrated theimportance of real-world illumination on materialperception. Obein, Knoblauch, & Vieot (2004) examinedhow gloss perception is affected by illuminationdirection and find that gloss difference scales obtainedunder two different illuminations are very similar,implying that humans can achieve ‘‘gloss constancy.’’Ho, Landy, and Maloney (2006) and Ho, Maloney, andLandy (2007) studied how surface roughness perceptionwas affected by scene illumination and viewpoints, andfound that observers exhibited some constancy tovariation of viewpoint. Doerschner, Boyaci, and Malo-ney (2010) studied how perceived gloss could betransferred from one light field to another. Despite all ofthe progress, very little is known about how illuminationdirection affects translucency perception.
3D shape and material perception
It was previously found that the perception of 3Dshape interacted with the perception of materialproperties, though most results pertain to the percep-tion of surface gloss. Fleming, Torralba, and Adelson(2004); Norman, Todd, and Orban (2004); and Toddand Norman (2003) showed that specular reflectanceaided shape estimation. Muryy, Welchman, Blake, andFleming (2013) further demonstrated that disparity ofspecular highlights was important in shape estimation.Vangorp, Laurijssen, and Dutre (2007) showed theimportance of 3D shape in the estimation of surface
reflectance from images. However, a recent brainimaging study suggested that surface cues that con-tribute to object shape are processed separately fromsurface cues that are linked to an object’s materialproperties (Cant, Large, McCall, & Goodale, 2008).
In this paper, we expand the study of the perceptionof translucency to objects with natural and complexshapes, and with an expanded set of material param-eters from those that have been previously studied.Using complex shapes, spherical harmonic basisfunctions to represent light, physically accurate ren-dering techniques, and an expanded space of phasefunctions to render rich materials, we find that lightingdirection has a strong effect on translucent appearancefor some phase functions but not others. This effect canbe predicted from the position of the phase function ona 2D perceptual phase function space established inGkioulekas et al. (2013).
Method
We conduct an appearance-matching task to mea-sure how perceived translucency depends on bothlighting direction and phase function. We use the‘‘Lucy’’ model from the Stanford 3D scanning repos-itory as the 3D shape and spherical harmonicillumination of varying dominant direction.
Stimuli
Rendering
Figure 4 shows an example trial. The scene containsa ‘‘Lucy’’ angel, which is roughly 7 cm tall standing ona dark gray floor. The interior of the angel is modeledas a volumetric homogeneous scattering medium withan index of refraction of 1.5. As mentioned before,these media can be characterized by three parameters:density, albedo, and phase function. In our experi-ments, observers adjust the density of the medium usinga logarithmic (base ¼ 2) scale. We used an albedo of0.99 in our experiments and 12 different phasefunctions chosen from Gkioulekas et al. (2013).
The surface of the ‘‘Lucy’’ is modeled as a roughrefractive surface (Walter, Marschner, Li, & Torrance,2007) with Beckmann roughness of 0.1. This choiceaffects the highlights and refraction. We use therougher appearance of the surface so that the ‘‘Lucy’’appears to be more natural.
Spherical harmonic basis lighting
Our goal is to create lighting while controlling itsdirection: front, back, and side-lit. The illumination has
Journal of Vision (2014) 14(3):17, 1–22 Xiao et al. 7
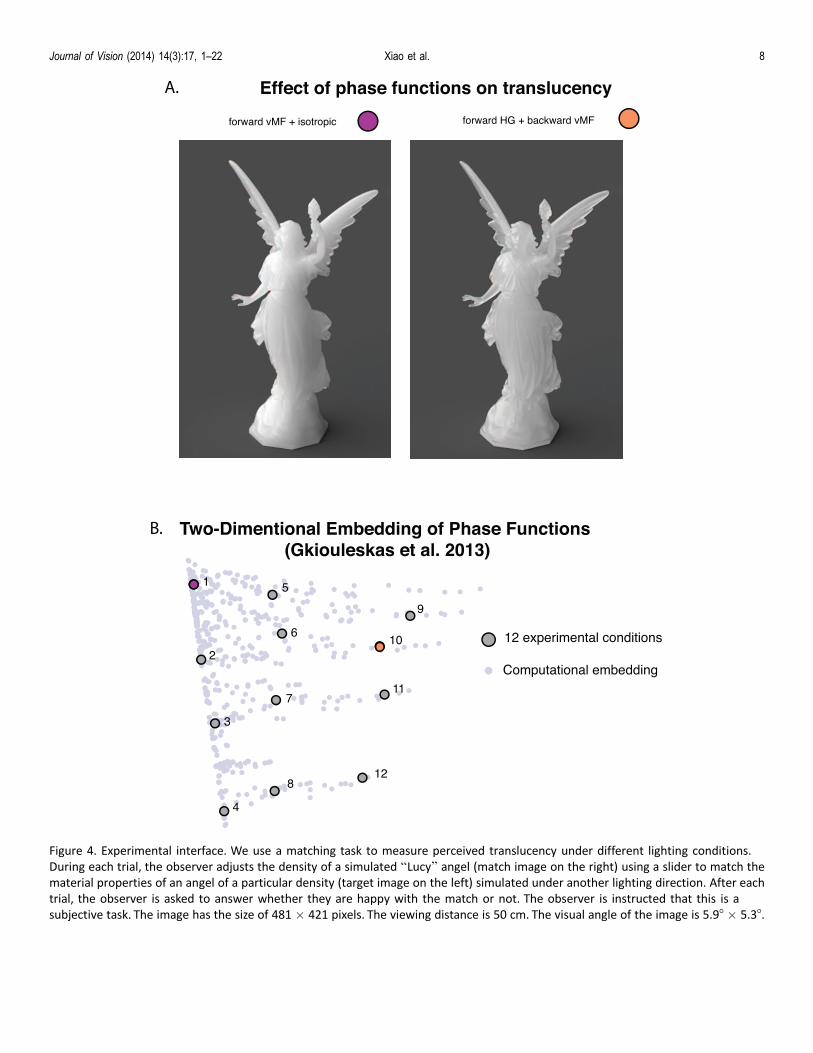
Figure 4. Experimental interface. We use a matching task to measure perceived translucency under different lighting conditions.During each trial, the observer adjusts the density of a simulated ‘‘Lucy’’ angel (match image on the right) using a slider to match thematerial properties of an angel of a particular density (target image on the left) simulated under another lighting direction. After eachtrial, the observer is asked to answer whether they are happy with the match or not. The observer is instructed that this is asubjective task. The image has the size of 481 · 421 pixels. The viewing distance is 50 cm. The visual angle of the image is 5.98 · 5.38.
Journal of Vision (2014) 14(3):17, 1–22 Xiao et al. 8
its maximum value in one direction, and decreasesmonotonically to zero in the opposite direction. Moreprecisely, its value is proportional to ð1þ coshÞ3 where his the angle to the maximal direction of the illuminationpattern. This simulates a relatively large area of lightingwhile also providing a strong sense of lighting direc-tionality (such as side- or front-lit). We can represent thispattern using 16 spherical harmonic coefficients, and thisrepresentation also allows arbitrarily rotating theillumination from a single volumetric simulation. In ourexperiments, we chose to use only a small set ofpreselected illumination directions. The lighting direc-tion is controlled by the polar and the azimuthal anglesso that the maximum brightness can occur at anydirection we want (to get front-lit, side-lit, back-litconditions, etc.). For more details about the sphericalharmonic representation of lighting, please see Ram-amoorthi and Hanrahan (2001).
2D embedding of phase functions
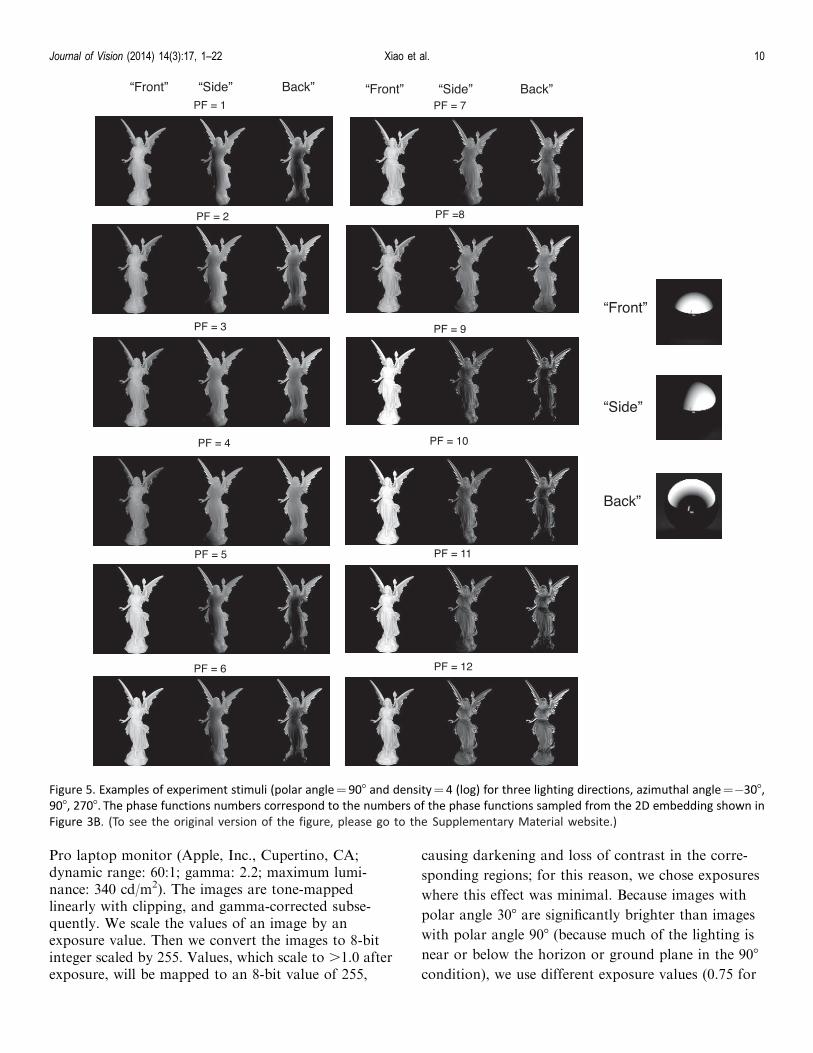
In this experiment, we uniformly sample 12 phasefunctions from the perceptually uniform two-dimen-sional embedding established in our previous study(Gkioulekas et al., 2013), which we then use in all of ourexperiments. Figure 5 shows example images renderedusing the 12 phase functions and their correspondingpositions in the 2D embedding. Doing the sampling thisway means that the set of phase functions we select isrepresentative of all of the perceptually importantappearance effects phase functions can produce. Previ-ous studies used phase functions lying only on a one-dimensional slice concentrated to the leftmost part ofthis appearance space. Consequently, they neglectedmany perceptual effects that can be critical foraccurately reproducing the appearance of differentclasses of translucent materials, such as jade. As ourresults demonstrate, it is necessary to study the full spaceof phase functions, as the magnitude of the effects weobserve varies considerably depending on the phasefunction in the appearance space. The details of the fullembedding of the phase functions can be seen in figures7, 8, and 11 in Gkioulekas et al., 2013. The parametersof the 12 phase functions are provided in the Appendixat the end of the paper.
Procedure
An asymmetric matching task is used to measurechanges in perceived translucency caused by variationsof lighting direction and phase function parameters.Figure 4 shows the interface of the experiment. Theimage on the left is the target image. The one on theright is the match image. The target image is renderedunder a specific lighting direction and with a specific
phase function at each trial. The match image isrendered with the same phase function as the target andunder the ‘‘side’’ lighting direction (azimuthal angle ¼0). The observer’s task is to use the slider to adjust thetranslucent appearance of the ‘‘Lucy’’ on the right side(match image) so that it appears to be made of the samematerial as the ‘‘Lucy’’ on the left side (target image).Before the experiment, the observer confirms thatchanging from 0 to 10 in logarithmic density scale (leftto right in Figure 4 on the sliding bar) makes the‘‘Lucy’’ change from appearing transparent (‘‘glassy’’)to opaque (‘‘marble’’). During the trial, the observercan adjust the apparent translucency of the match‘‘Lucy’’ through 40 values in its densities, in a rangefrom 0 (log) to 10 (log) with a step of 0.25 (log). Theobserver has unlimited viewing time. After the observerfinishes the adjustment, he or she is asked to press aradio button to indicate whether the match issatisfactory. Then the observer can move to the nexttrial in the sequence by pressing the ‘‘Next’’ button onthe graphical user interface.
Experimental conditions
Figure 5 shows target images of the ‘‘Lucy’’ renderedwith 12 phase functions and three different lightingdirections at density¼ 4(log). In the experiment, thedensity of the target ‘‘Lucy’’ can be one of the fourvalues, 3, 4, 5, and 6 in the logarithmic density scales.
The lighting directions of both target and matchimages are controlled by changing the polar and theazimuthal angles. To vary the lighting direction only inone dimension, at each trial, the polar angle is fixed ateither 908 (horizon lighting) or 308 (overhead lighting).The azimuthal angle can be one of three conditions:front lighting (2708), side-back lighting (%308), andback lighting (908). The lighting conditions were chosenbased on pilot studies. There are a total of 288conditions (12 phase functions, six lighting conditions,and four densities).
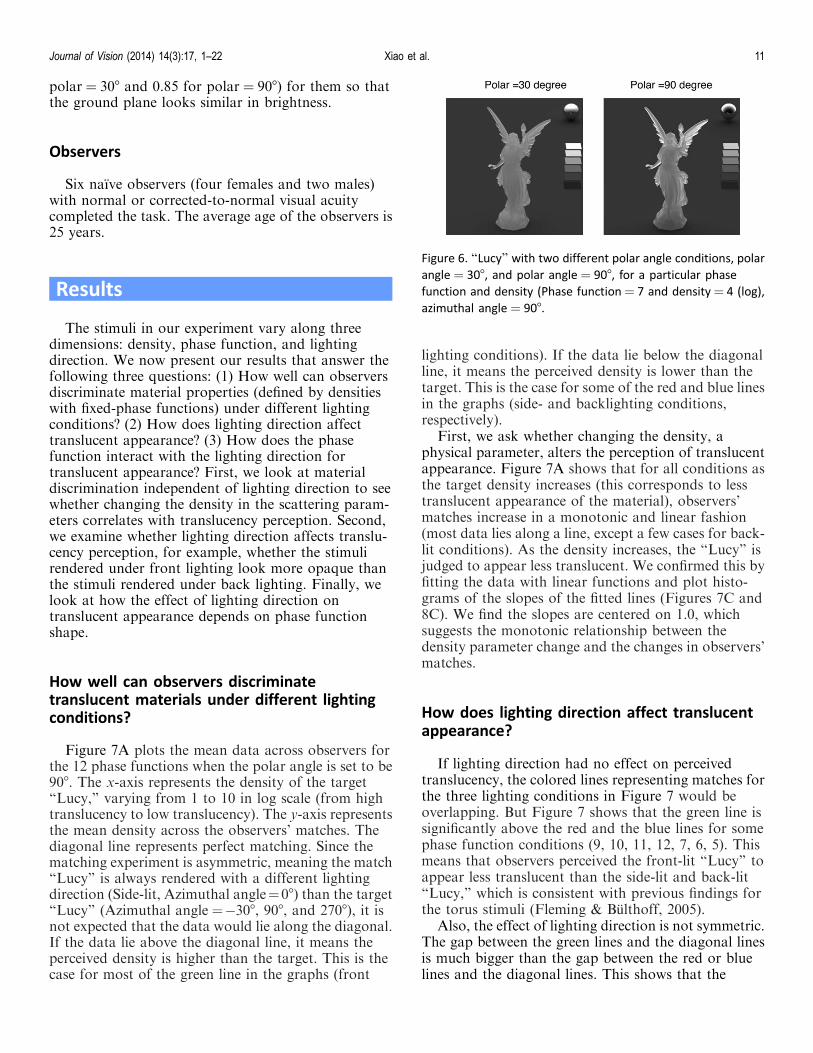
Figure 6 shows example images rendered with polarangle 908 and 308. The match ‘‘Lucy’’ has the samepolar angle as the target ‘‘Lucy.’’ But the lightingdirection of the match is always at zero (side-lit). Wechose the azimuthal angle to be zero to avoid havingthe same direction as one of the target lightingdirections. The complete sets of target images and theparameter files used in the experiment are provided inthe supplementary website.1
Display
Observers perform the experiments in a dark roomand the images are displayed on a 13-inch MacBook
Journal of Vision (2014) 14(3):17, 1–22 Xiao et al. 9
Pro laptop monitor (Apple, Inc., Cupertino, CA;dynamic range: 60:1; gamma: 2.2; maximum lumi-nance: 340 cd/m2). The images are tone-mappedlinearly with clipping, and gamma-corrected subse-quently. We scale the values of an image by anexposure value. Then we convert the images to 8-bitinteger scaled by 255. Values, which scale to .1.0 afterexposure, will be mapped to an 8-bit value of 255,
causing darkening and loss of contrast in the corre-
sponding regions; for this reason, we chose exposures
where this effect was minimal. Because images with
polar angle 308 are significantly brighter than images
with polar angle 908 (because much of the lighting is
near or below the horizon or ground plane in the 908condition), we use different exposure values (0.75 for
Figure 5. Examples of experiment stimuli (polar angle¼ 908 and density¼ 4 (log) for three lighting directions, azimuthal angle¼%308,908, 2708. The phase functions numbers correspond to the numbers of the phase functions sampled from the 2D embedding shown inFigure 3B. (To see the original version of the figure, please go to the Supplementary Material website.)
Journal of Vision (2014) 14(3):17, 1–22 Xiao et al. 10
polar¼ 308 and 0.85 for polar ¼ 908) for them so thatthe ground plane looks similar in brightness.
Observers
Six naıve observers (four females and two males)with normal or corrected-to-normal visual acuitycompleted the task. The average age of the observers is25 years.
Results
The stimuli in our experiment vary along threedimensions: density, phase function, and lightingdirection. We now present our results that answer thefollowing three questions: (1) How well can observersdiscriminate material properties (defined by densitieswith fixed-phase functions) under different lightingconditions? (2) How does lighting direction affecttranslucent appearance? (3) How does the phasefunction interact with the lighting direction fortranslucent appearance? First, we look at materialdiscrimination independent of lighting direction to seewhether changing the density in the scattering param-eters correlates with translucency perception. Second,we examine whether lighting direction affects translu-cency perception, for example, whether the stimulirendered under front lighting look more opaque thanthe stimuli rendered under back lighting. Finally, welook at how the effect of lighting direction ontranslucent appearance depends on phase functionshape.
How well can observers discriminatetranslucent materials under different lightingconditions?
Figure 7A plots the mean data across observers forthe 12 phase functions when the polar angle is set to be908. The x-axis represents the density of the target‘‘Lucy,’’ varying from 1 to 10 in log scale (from hightranslucency to low translucency). The y-axis representsthe mean density across the observers’ matches. Thediagonal line represents perfect matching. Since thematching experiment is asymmetric, meaning the match‘‘Lucy’’ is always rendered with a different lightingdirection (Side-lit, Azimuthal angle¼08) than the target‘‘Lucy’’ (Azimuthal angle ¼%308, 908, and 2708), it isnot expected that the data would lie along the diagonal.If the data lie above the diagonal line, it means theperceived density is higher than the target. This is thecase for most of the green line in the graphs (front
lighting conditions). If the data lie below the diagonalline, it means the perceived density is lower than thetarget. This is the case for some of the red and blue linesin the graphs (side- and backlighting conditions,respectively).
First, we ask whether changing the density, aphysical parameter, alters the perception of translucentappearance. Figure 7A shows that for all conditions asthe target density increases (this corresponds to lesstranslucent appearance of the material), observers’matches increase in a monotonic and linear fashion(most data lies along a line, except a few cases for back-lit conditions). As the density increases, the ‘‘Lucy’’ isjudged to appear less translucent. We confirmed this byfitting the data with linear functions and plot histo-grams of the slopes of the fitted lines (Figures 7C and8C). We find the slopes are centered on 1.0, whichsuggests the monotonic relationship between thedensity parameter change and the changes in observers’matches.
How does lighting direction affect translucentappearance?
If lighting direction had no effect on perceivedtranslucency, the colored lines representing matches forthe three lighting conditions in Figure 7 would beoverlapping. But Figure 7 shows that the green line issignificantly above the red and the blue lines for somephase function conditions (9, 10, 11, 12, 7, 6, 5). Thismeans that observers perceived the front-lit ‘‘Lucy’’ toappear less translucent than the side-lit and back-lit‘‘Lucy,’’ which is consistent with previous findings forthe torus stimuli (Fleming & Bulthoff, 2005).
Also, the effect of lighting direction is not symmetric.The gap between the green lines and the diagonal linesis much bigger than the gap between the red or bluelines and the diagonal lines. This shows that the
Figure 6. ‘‘Lucy’’ with two different polar angle conditions, polar
angle ¼ 308, and polar angle ¼ 908, for a particular phase
function and density (Phase function¼ 7 and density¼ 4 (log),
azimuthal angle ¼ 908.
Journal of Vision (2014) 14(3):17, 1–22 Xiao et al. 11
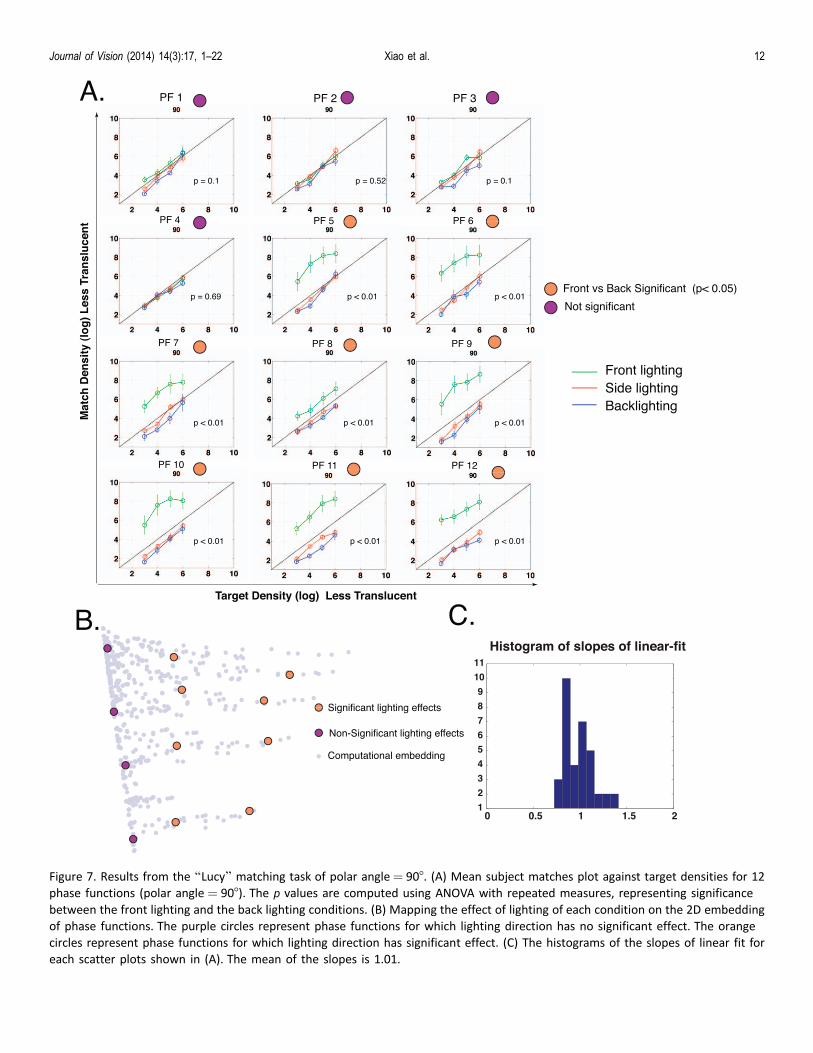
Figure 7. Results from the ‘‘Lucy’’ matching task of polar angle¼ 908. (A) Mean subject matches plot against target densities for 12
phase functions (polar angle ¼ 908). The p values are computed using ANOVA with repeated measures, representing significance
between the front lighting and the back lighting conditions. (B) Mapping the effect of lighting of each condition on the 2D embedding
of phase functions. The purple circles represent phase functions for which lighting direction has no significant effect. The orange
circles represent phase functions for which lighting direction has significant effect. (C) The histograms of the slopes of linear fit for
each scatter plots shown in (A). The mean of the slopes is 1.01.
Journal of Vision (2014) 14(3):17, 1–22 Xiao et al. 12
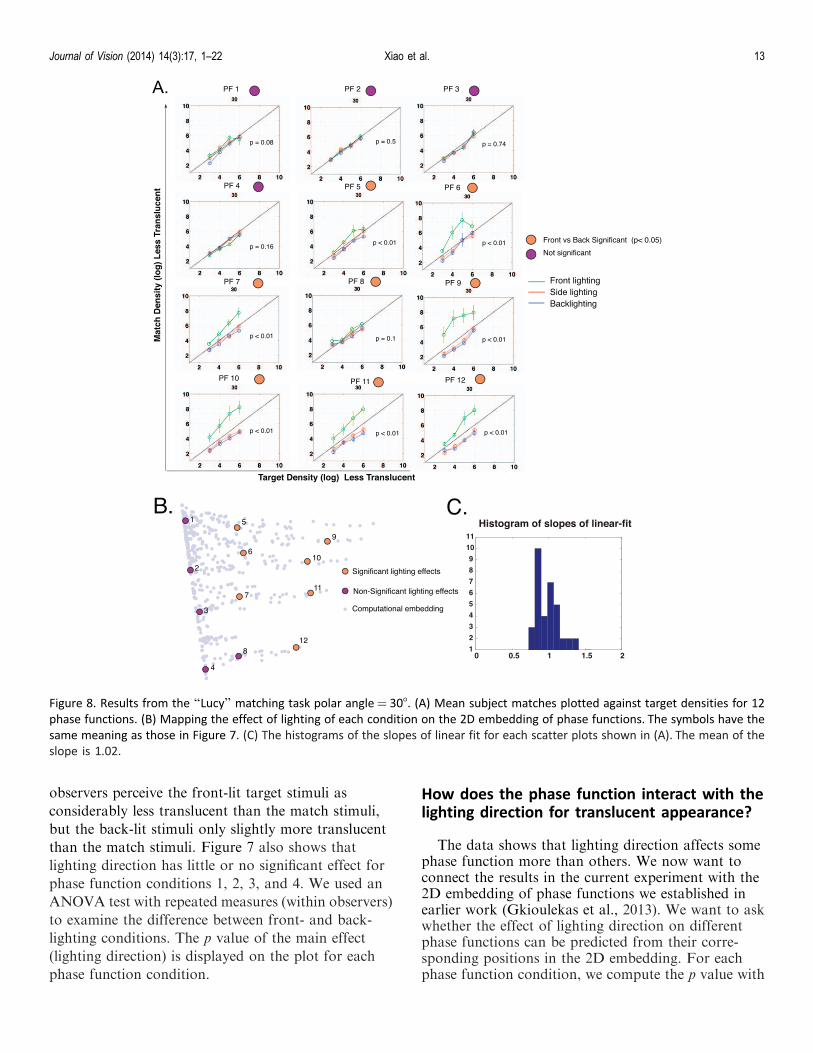
observers perceive the front-lit target stimuli asconsiderably less translucent than the match stimuli,but the back-lit stimuli only slightly more translucentthan the match stimuli. Figure 7 also shows thatlighting direction has little or no significant effect forphase function conditions 1, 2, 3, and 4. We used anANOVA test with repeated measures (within observers)to examine the difference between front- and back-lighting conditions. The p value of the main effect(lighting direction) is displayed on the plot for eachphase function condition.
How does the phase function interact with thelighting direction for translucent appearance?
The data shows that lighting direction affects somephase function more than others. We now want toconnect the results in the current experiment with the2D embedding of phase functions we established inearlier work (Gkioulekas et al., 2013). We want to askwhether the effect of lighting direction on differentphase functions can be predicted from their corre-sponding positions in the 2D embedding. For eachphase function condition, we compute the p value with
Figure 8. Results from the ‘‘Lucy’’ matching task polar angle¼ 308. (A) Mean subject matches plotted against target densities for 12phase functions. (B) Mapping the effect of lighting of each condition on the 2D embedding of phase functions. The symbols have thesame meaning as those in Figure 7. (C) The histograms of the slopes of linear fit for each scatter plots shown in (A). The mean of theslope is 1.02.
Journal of Vision (2014) 14(3):17, 1–22 Xiao et al. 13
a within-observer ANOVA on the difference betweenthe front- and the back-lighting conditions.
In Figure 7B, the phase function that has asignificant p value is marked with an orange dot ontop of each panel and the phase function withnonsignificant p value is marked with a purple dot oneach panel. We then label the corresponding testphase functions in the 2D embedding of phasefunctions. We can see in Figure 7B that the purpledots lie on the leftmost column of the phase functionspace (single-lobe Henyey-Greenstein or isotropicphase functions), whereas all the orange dots lie onthe right-hand side of the phase function space(double lobe combining HG and von Mises-Fisherfunctions). This shows that the strength of the effectof the lighting direction on translucent materials canbe predicted by the position of the correspondingphase function on the 2D space. The lightingdirection has a strong effect on phase functions thathave two lobes, with either HG þHG or HG þ vMFphase functions (see figure 11 in Gkioulekas et al.,2013) for the locations of different types of phasefunction on the 2D embedding). In fact, the strength
of lighting direction becomes stronger as we movefrom the left to the right on the 2D space. Note thatphase functions in the right part of the embedding canyield relatively sharp (glassy) appearances, whereasthe leftmost column phase functions yield diffusiveappearances.
Figure 8 shows the results from the conditions wherethe polar angle is set to be 308. The data is plotted in thesame fashion as in Figure 7 for the same group ofobservers. The results for polar angle 308 are qualita-tively the same as for 908, except that unlike before, theeffect of lighting direction for phase function 8 is notsignificant (ANOVA test with repeated measure, p¼0.1). Note that the effect of lighting direction for thisphase function is also relatively small in Figure 7.
Observers’ confidence
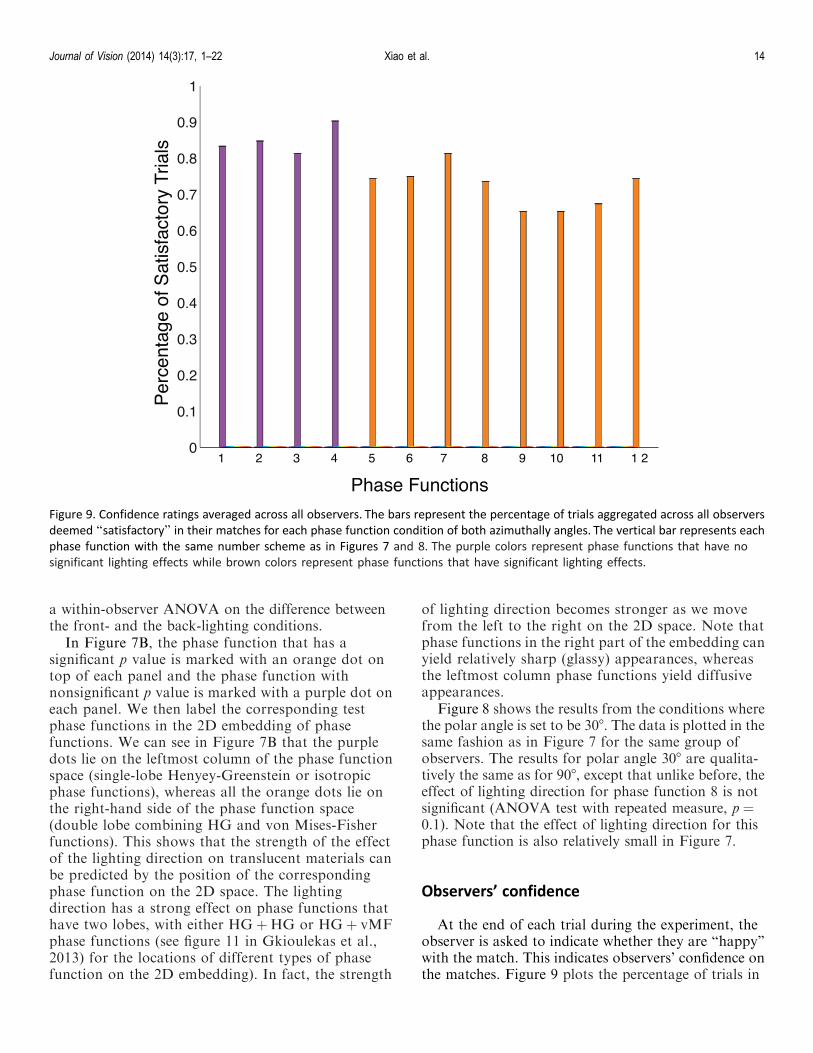
At the end of each trial during the experiment, theobserver is asked to indicate whether they are ‘‘happy’’with the match. This indicates observers’ confidence onthe matches. Figure 9 plots the percentage of trials in
Figure 9. Confidence ratings averaged across all observers. The bars represent the percentage of trials aggregated across all observersdeemed ‘‘satisfactory’’ in their matches for each phase function condition of both azimuthally angles. The vertical bar represents eachphase function with the same number scheme as in Figures 7 and 8. The purple colors represent phase functions that have nosignificant lighting effects while brown colors represent phase functions that have significant lighting effects.
Journal of Vision (2014) 14(3):17, 1–22 Xiao et al. 14
which all observers indicated they were ‘‘satisfied,’’versus the total number of trials for each phasefunction condition. On average, the percentage is about78%, suggesting observers are overall confident in theirmatches. The plot also shows that observers haveslightly higher confidence for the conditions that haveno significant effects of lighting direction on thematches than the conditions that have significanteffects of lighting direction (mean confidence rating ofthe purple conditions is 0.84; mean confidence rating ofthe brown-yellow conditions is 0.73).
Discussion
In this paper we explore the interaction of shape,illumination, and level of translucency. More impor-tant, we also consider the type of translucency, asspecified by the scattering phase function. We useappearance matching to assess the degree of perceivedtranslucency. We find that the degree of translucencyconstancy depends strongly on the phase function’slocation in the 2D perceptual space discovered inGkioulekas et al., 2013, suggesting that the space
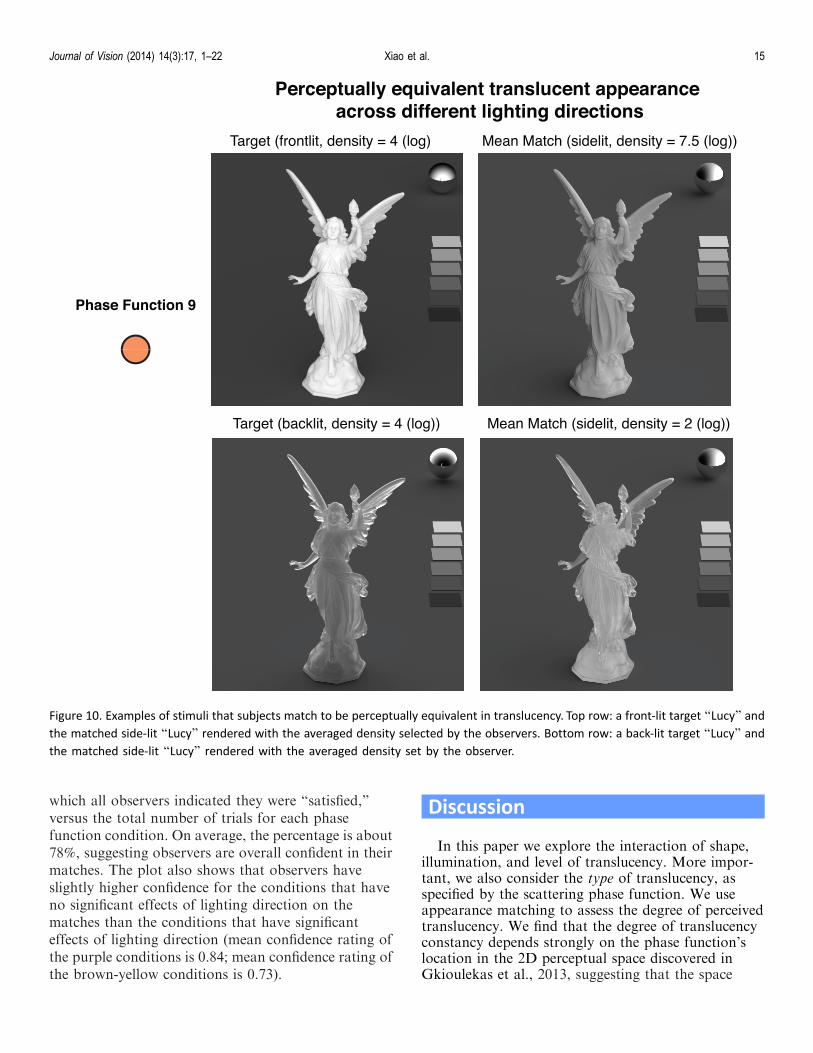
Figure 10. Examples of stimuli that subjects match to be perceptually equivalent in translucency. Top row: a front-lit target ‘‘Lucy’’ and
the matched side-lit ‘‘Lucy’’ rendered with the averaged density selected by the observers. Bottom row: a back-lit target ‘‘Lucy’’ and
the matched side-lit ‘‘Lucy’’ rendered with the averaged density set by the observer.
Journal of Vision (2014) 14(3):17, 1–22 Xiao et al. 15
captures genuinely useful information about differenttypes of translucency.
Translucency discrimination and lightingdirection
From a material design point of view, it is interestingto ask whether lighting direction affects materialdiscrimination. Our data show that observers candiscriminate translucent appearance simulated withdifferent densities under all lighting directions: All the
lines in Figures 7 and 8 have similar slopes to thediagonal, indicating that the physical change in densitycan predict perceptual discrimination, except for a fewcases in front-lighting conditions (Figures 7C and 8C).Fleming and Bulthoff (2005) show that when the torusis illuminated from the front, the image does notchange very much as a function of the degree oftranslucency. Stated another way, the image informa-tion is not sufficiently discriminative using the imageinformation alone; there is little basis for a visualsystem to distinguish between translucent and opaque
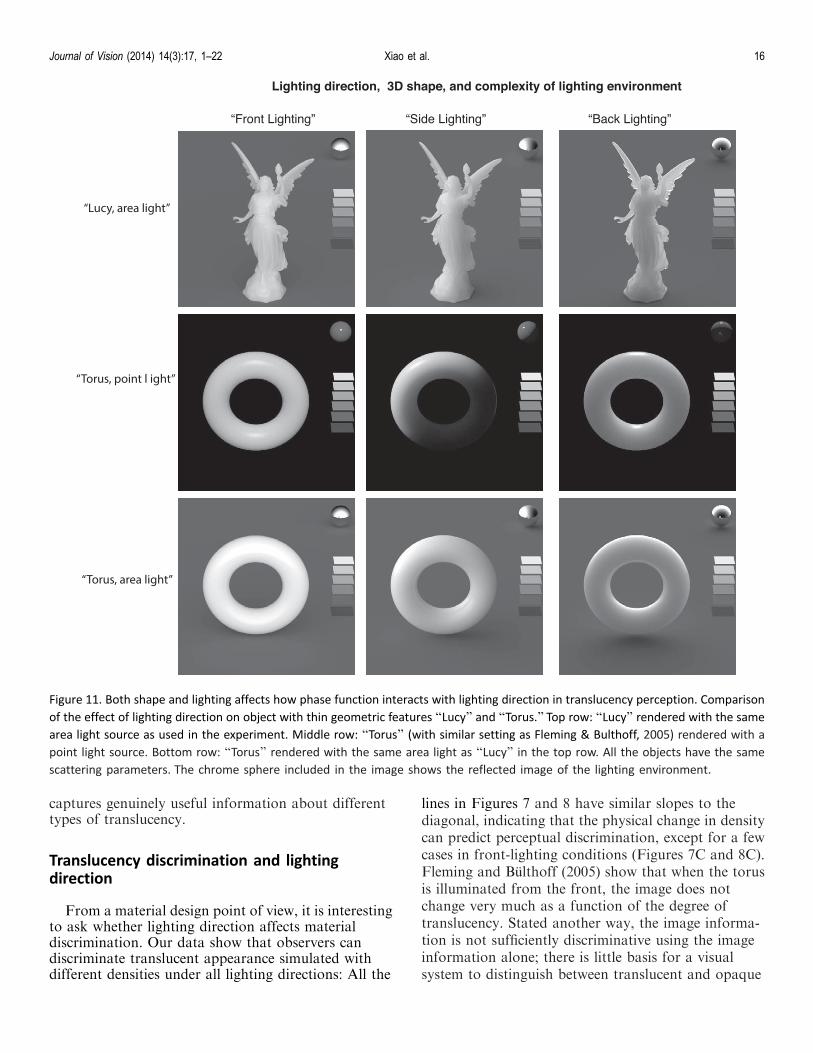
Figure 11. Both shape and lighting affects how phase function interacts with lighting direction in translucency perception. Comparison
of the effect of lighting direction on object with thin geometric features ‘‘Lucy’’ and ‘‘Torus.’’ Top row: ‘‘Lucy’’ rendered with the same
area light source as used in the experiment. Middle row: ‘‘Torus’’ (with similar setting as Fleming & Bulthoff, 2005) rendered with a
point light source. Bottom row: ‘‘Torus’’ rendered with the same area light as ‘‘Lucy’’ in the top row. All the objects have the same
scattering parameters. The chrome sphere included in the image shows the reflected image of the lighting environment.
Journal of Vision (2014) 14(3):17, 1–22 Xiao et al. 16
objects. It is possible that this problem is idiosyncraticof the particular stimuli Fleming chose. Our data showsthat even for the front-lit ‘‘Lucy,’’ the effect of densityon translucent appearance is strong and mostlymonotonically related to density changes (Figures 7and 8, green line). It is possible that the ‘‘Lucy’’ hasmore features than the torus, providing enough imagecues for the observers to distinguish between objectswith different degrees of translucency in front-litconditions.
Which image regions are important?
Since the ‘‘Lucy’’ has a complex shape, which partsof the image are the most important for perception?Figure 10 compares the ‘‘Lucy’’ rendered with theaverage matched value from all observers and thetarget ‘‘Lucy.’’ The two stimuli are perceptuallyequivalent in terms of translucency based on the data.The top row in Figure 10 shows that on averageobservers matched a front-lit ‘‘Lucy’’ with a muchlower density to a side-lit ‘‘Lucy’’ with much higherdensity (almost double the density). This confirms theresults of Figure 7 that front lighting makes the objectappear less translucent than the side and backlighting.The bottom row in Figure 10 shows the averageobservers’ match of the object under the backlightingcondition. The two ‘‘Lucy’’ images look very differentin image contrast, but the ‘‘thin’’ parts of the object,such as the wings and hands of the ‘‘Lucy,’’ appear tobe almost transparent in both of the images. Thissuggests that the thin geometric parts such as the edgescontribute most to the overall translucent appearanceof the ‘‘Lucy.’’
This observation is consistent with a recent study byNagai et al. (2013), which shows that certain regionscontribute more strongly to the translucent appearanceof rendered images than other regions. Most of theregions extracted from the psychophysical reversecorrelation method used by the authors are thin partsnear the objects’ edges or delicate structures, andregions that have high contrast shading patterns (seefigure 7 in Nagai et al., 2013). Fleming and Bulthoff(2005) also show similar results.
Comparison with the findings in Fleming andBulthoff (2005)
The phase function in the top left corner of the 2Dspace (phase function 1) exhibits little effect of lightingdirection in translucent appearance in the currentstudy. However, Fleming and Bulthoff (2005) showedstrong lighting effects on translucent appearance. Here,we speculate that the main causes of the difference in
the results could be the different geometry of the stimuliand the rendering methods. Lucy provides far moredensity cues than the torus does especially for front-litconditions. Also, Fleming and Bulthoff (2005) useJensen’s BSSRDF approximation, where we used amore accurate method in our study. Jensen usessimilarity theory, which potentially generates errorsfrom approximated refraction in single-scatter for side-lit conditions, which is what Fleming and Bulthoff(2005) used for the target images. The difference in themethods generates different translucent appearance. Inaddition, Fleming and Bulthoff (2005) use a point-lightsource and there is a strong cast shadow on the torus,which affects translucent appearance. We use arealights and there is not much shadow. Figure 11demonstrates the effects of 3D shape and lighting onappearances.
Importance of the complexity of the lightingenvironment
Most previous studies used a simple lightingenvironment such as a point light source (Fleming &Bulthoff, 2005; Motoyoshi, 2010; Nagai et al., 2013).The bottom row in Figure 11 shows the same ‘‘torus’’as in the middle row in Figure 11, but illuminated withthe area lights we use in our ‘‘Lucy’’ experiment(generated by spherical harmonics up to the fourthorder). We observe that the effect of lighting ontranslucent appearance is less dramatic in the imagesshown in the bottom row than those in the middle rowin Figure 11. The back-lit ‘‘torus’’ appears lesstranslucent in the area lights than the backlit torusunder a point light source. This observation indicatesthat the complexity of the lighting environment plays arole in how lighting affects translucency. It is possiblethat more realistic lighting with a combination of bothlow and high (infinite) frequencies in the sphericalharmonics could result in less dramatic effects oflighting direction on translucent appearance.
Implications for material constancy
Translucent objects interact with light in a complexway. In this work, we find that for some translucentmaterials, lighting direction has a significant effect onappearance. Thus, for these conditions, the visualsystem cannot completely discount the lighting direc-tion in material perception. On the other hand, thereare also conditions where observers can indeeddiscount lighting direction changes. However, previ-ous work has found humans are good at materialdiscrimination and recognition (Sharan et al., 2009).Even for translucent objects, in order to have a stable
Journal of Vision (2014) 14(3):17, 1–22 Xiao et al. 17
percept of material properties, the visual system hasto, at least to an extent, discount the changes causedby rotating the light source. To draw an analogy withstudies of human color constancy, constancy is goodin complex scenes where there are enough cues aboutthe illuminant, such as nearby surfaces and specularhighlights on shinny surfaces. But color constancy ispoor when the scene context is reduced (Kraft,Maloney, & Brainard, 2002). For translucency, wehypothesize that complex lighting and shape make itpossible for observers to discount lighting for simplematerials (isotropic phase functions). But observershave a hard time discounting the effects of lightingwhen the object has both the complex 3D shape and ismade of complex materials (for example, having adouble-lobe phase functions with two types ofdistributions [e.g., vMF þHG]). However, thisspeculation of the relationship between complexity ofshape and of phase function in translucency constancyneeds more experimental support. In addition, most ofthe cues to the illuminant in our scenes are from theobject itself. Though we believe there are sufficientcues to the illumination direction in the image (e.g.,contrast between the wings and the body of the Lucy),the absence of cues to the illuminant could play a rolein poor constancy. Examining how adding additionalcues to the illuminant would affect the results is aninteresting future direction.
Conclusion and future work
In conclusion, using a natural scene with a complex3D shape, we find that lighting direction has a strongeffect on translucent appearance simulated with somephase functions but not others. This effect can bepredicted by the position of the phase functions in a2D perceptual embedding established in a previouspublication (Gkioulekas et al., 2013). The phasefunctions that are associated with the strong lightingdirection effect can simulate materials that appearglassy with sharp details. On the other hand, the phasefunctions that are associated with weak lightingdirection effect can simulate materials with a diffusiveappearance. Our results suggest that more consider-ation should be given to the richness of materialproperties, such as rich sets of phase function, whenexamining the effects of lighting direction on translu-cency perception.
We also find that the geometry of an object isimportant. We compare the case of a torus, which hasa simple smooth shape, with that of a figurine, whichhas more complex geometry with thick and thinsections and features at multiple scales. The complexshape shows a greater range of apparent translucen-
cies, which allows observers to discriminate differentdegrees of translucency. But it also resulted in a higherdegree of constancy failure. Although the complexfigure offers more cues to drive translucent appear-ance, those cues do not necessarily increase theconstancy.
The focus of this paper has been on the phasefunction, but in order to fully understand how lightingaffects translucency perception and constancy, weneed to explore other dimensions of scatteringparameters, such as scattering coefficient, albedo, andtheir spectral variations. Also, in this work, we usedsynthetic images. In the real world, there is higherdynamic range and observers have stereoscopic cues,which might also help with translucency constancy. Inaddition, we only take an initial step towardsunderstanding the role of 3D shape in translucencyperception. Future experiments should systematicallystudy how varying 3D shape affects translucencyperception using a rich set of material parameters.From a computational view, we would like to buildmodels that quantify scene complexities and predicthuman translucency discrimination and constancybased on scene parameters such as shape, material,and lighting geometry. Such models would be useful inmaterial design applications, guiding what scenes oneshould use to exhibit certain translucent appearanceeffects, and in user interfaces for rendering translucentmaterials.
Keywords: translucency, material perception, lighting,phase functions, 3D shape
Acknowledgments
We want to thank Cathy Tingle for the photographsof the cherubs in Figure 1 and other photographs thatinspired the experiment in this work. We wish to thankShuang Zhao and Asher Dunn for their support ofrendering and useful discussions, and Professor RolandFleming for sharing with us his rendering parametersand very useful discussions. We also want to thank theStanford 3D Scanning Repository for providing theLucy. This research is supported by NSF awards116173 (K. B., T. Z., E. A.) and 1161645 (K. B.) andAmazon Web Services in Education grant awards toI. G. and T. Z.
Commercial relationships: none.Corresponding author: Bei Xiao.Email: [email protected]: Department of Brain and Cognitive Sciences,Massachusetts Institute of Technology, Cambridge,MA, USA.
Journal of Vision (2014) 14(3):17, 1–22 Xiao et al. 18
Footnote
1Supplementary website: http://people.csail.mit.edu/beixiao/Supplementary_BX/.
References
Adelson, E. H. (1993). Perceptual organization and thejudgment of brightness. Science, 262(5142), 2042–2044.
Anderson, B. L. (1997). A theory of illusory lightnessand transparency in monocular and binocularimages: The role of contour junctions. Perception,26, 419–454.
Anderson, B. L. (2003). The role of occlusion in theperception of depth, lightness, and opacity. Psy-chological Review, 110(4), 785.
Anderson, B. L. (2011). Visual perception of materialsand surfaces. Current Biology, 21(24), R978–983.
Anderson, B. L., & Khang, B. G. (2010). The role ofscission in the perception of color and opacity.Journal of Vision, 10(5):26, 1–16, http://www.journalofvision.org/content/10/5/26, doi:10.1167/10.5.26. [PubMed] [Article]
Beck, J. (1978). Additive and subtractive color mixturein color transparency. Attention, Perception, &Psychophysics, 23(3), 265–267.
Beck, J., & Ivry, R. (1988). On the role of figuralorganization perceptual transparency. Perception &Psychophysics, 44(6), 585–594.
Beck, J., Prazdny, K., & Ivry, R. (1984). The perceptionof transparency with achromatic colors. Perception& Psychophysics, 35(5), 407–422.
Cant, J. S., Large, M.-E., McCall, L., & Goodale, M.A. (2008). Independent processing of form, colour,and texture in object perception. Perception, 37, 57–78.
Chen, V. J., & D’Zmura, M. (1998). Test of conver-gence model for color transparency perception.Perception, 27(5), 595–608.
Doerschner, K., Boyaci, H., & Maloney, L. T. (2010).Estimating the glossiness transfer function inducedby illumination change and testing its transitivity.Journal of Vision, 10(4):8, 1–9, http://www.journalofvision.org/content/10/4/8, doi:10.1167/10.4.8. [PubMed] [Article]
Donner, C., Lawrence, J., Ramamoorthi, R., Hachi-suka, T., Jensen, H. W., & Nayar, S. An empiricalBSSRDF model. (2009). ACM Transactions on
Graphics (TOG) Proceedings of ACM SIGGRAPH,28(3).
Fisher, R. (1953). Dispersion on a sphere. Proceedingsof the Royal Society of London. Series A. Mathe-matical and Physical Sciences, 217(1130), 295–305.
Fleming, R. W., & Bulthoff, H. (2005). Low-level imagecues in the perception of translucent materials.ACM Transactions on Applied Perception (TAP),2(3), 346–382.
Fleming, R. W., Dror, R. O., & Adelson, E. H. (2003).Real-world illumination and the perception ofsurface reflectance properties. Journal of Vision,3(5):3, 347–368, http://www.journalofvision.org/content/3/5/3, doi:10.1167/3.5.3. [PubMed] [Article]
Fleming, R. W., Jakel, F., & Maloney, L. T. (2011).Visual perception of thick transparent materials.Psychological Science, 22(6), 812–820.
Fleming, R. W., Torralba, A., & Adelson, E. H. (2004).Specular reflections and the perception of shape.Journal of Vision, 4(9):10, 798–820, http://www.journalofvision.org/content/4/9/10, doi:10.1167/4.9.10. [PubMed] [Article]
Gerardin, P., Kourtzi, Z., & Mamassian, P. (2010).Prior knowledge of illumination for 3D perceptionin the human brain. Proceedings of the NationalAcademy of Sciences, 107(37), 16309–16314.
Gkioulekas, I., Xiao, B., Zhao, S., Adelson, E. H.,Zickler, T., & Bala, K. (2013). Understanding therole of phase function in translucent appearance.ACM Transaction of Graphics (TOG), 32, 5.
Helmholtz, H. V. (1867). LXIII. On Integrals of thehydrodynamical equations, which express vortex-motion. The London, Edinburgh, and Dublin Phil-osophical Magazine and Journal of Science, 33(226),485–512.
Henyey, L. G., & Greenstein, J. L. (1941). Diffuseradiation in the galaxy. The Astrophysical Journal,93, 70–83.
Ho, Y.-X., Landy, M. S., & Maloney, L. T. (2006).How direction of illumination affects visuallyperceived surface roughness. Journal of Vision, 6(5):8, 634–648, http://www.journalofvision.org/content/6/5/8, doi:10.1167/6.5.8. [PubMed] [Article]
Ho, Y.-X., Maloney, L. T., & Landy, M. S. (2007). Theeffect of viewpoint on perceived visual roughness.Journal of Vision, 7(1):1, 1–16, http://www.journalofvision.org/content/7/1/1, doi:10.1167/7.1.1. [PubMed] [Article]
Ishimaru, A. (1978). Wave propagation and scatteringin random media and rough surfaces. Proceedingsof IEEE, 79(10), 1359–1368.
Jensen, H. W. (2001). A practical model of sub-surface
Journal of Vision (2014) 14(3):17, 1–22 Xiao et al. 19
transport. Proceedings of SIGGRAPH 2001, 511–518.
Kersten, D. (1991). Transparency and the cooperativecomputation of scene attributes. ComputationalModels of Visual Processing, 209–228.
Kersten, D., Bulthoff, H. H., Schwartz, B. L., & Kurtz,K. J. (1992). Interaction between transparency andstructure from motion. Neural Computation, 4(4),573–589.
Khang, B.-G., & Zaidi, Q. (2002). Accuracy of colorscission for spectral transparencies. Journal ofVision, 2(6):3, 451–466, http://www.journalofvision.org/content/2/6/3, doi:10.1167/2.6.3. [PubMed] [Article]
Koenderink, J. J., & van Doorn, A. J. (2001). Shadingin the case of translucent objects. In B. E. Rogowitz& T. N. Pappas (Eds.), Proceedings of SPIE (pp.312–320). Bellingham, WA: SPIE.
Koffka, K. (1935). Principles of Gestalt psychology.London: Lund Humphries.
Kraft, J. M., Maloney, S. I., & Brainard, D. H. (2002).Surface-illuminant ambiguity and color constancy:Effects of scene complexity and depth cues.Perception, 31(2), 247–263.
Maloney, L. T., & Brainard, D. H. (2010). Color andmaterial perception: Achievements and challenges.Journal of Vision, 10(9):19, 1–6, http://www.journalofvision.org/content/10/9/19, doi:10.1167/10.9.19. [PubMed] [Article]
Metelli, F. (1974). The perception of transparency.Scientific American, 230, 90–98.
Motoyoshi, I. (2010). Highlight-shading relationship asa cue for the perception of translucent andtransparent materials. Journal of Vision, 10(9):6, 1–11, http://www.journalofvision.org/content/10/9/6,doi:10.1167/10.9.6. [PubMed] [Article]
Muryy, A. A., Welchman, A. E., Blake, A., & Fleming,R. W. (2013). Specular reflections and the estima-tion of shape from binocular disparity. Proceedingsof the National Academy of Sciences, USA, 110(6),2413–2418.
Nagai, T., Ono, Y., Tani, Y., Koid, K., Kitazaki, M., &Nakauchi, S. (2013). Image regions contributing toperceptual translucency: A psychophysical reverse-correlation study. i-Perception, 6, 407–429.
Norman, J. F., Todd, J. T., & Orban, G. A. (2004).Perception of three-dimensional shape from spec-ular highlights, deformations of shading, and othertypes of visual information. Psychological Science,15(8), 565–570.
Obein, G., Knoblauch, K., & Vieot, F. (2004).Difference scaling of gloss: Nonlinearity, binocu-
larity, and constancy. Journal of Vision, 4(9):4, 711–720, http://www.journalofvision.org/content/4/9/4,doi:10.1167/4.9.4. [PubMed] [Article]
Olkkonen, M., & Brainard, D. H. (2011). Joint effectsof illumination geometry and object shape in theperception of surface reflectance. i-Perception, 2(9),1014–1034.
Ramamoorthi, R., & Hanrahan, P. (2001). A signal-processing framework for inverse rendering. Pro-ceedings of SIGGRAPH 2001, 117–128.
Sayim, B., & Cavanagh, P. (2011). The art oftransparency. i-Perception, 2(7), 679.
Sharan, L., Rosenholtz, R., & Adelson, E. (2009).Material perception: What can you see in a briefglance? Journal of Vision, 9(8): 784, http://www.journalofvision.org/content/9/8/784, doi:10.1167/9.8.784. [Abstract]
Todd, J. T. (2004). The visual perception of 3D shape.Trends in Cognitive Sciences, 8(3), 115–121.
Todd, J. T., & Norman, J. F. (2003). The visualperception of 3-D shape from multiple cues: Areobservers capable of perceiving metric structure?Perception & Psychophysics, 65(1), 31–47.
Vangorp, P., Laurijssen, J., & Dutre, P. (2007). Theinfluence of shape on the perception of materialreflectance. ACM Transactions on Graphics, 26(3),77.
Walter, B., Marschner, S. R., Li, H., & Torrance, K. E.(2007). Microfacet models for refraction throughrough surfaces. Rendering Techniques 2007 (Pro-ceedings of the Eurographics Symposium on Ren-dering).
Watanabe, T., & Cavanagh, P. (1992). Depth captureand transparency of regions bounded by illusoryand chromatic contours. Vision Research, 32(3),527–532.
Watanabe, T., & Cavanagh, P. (1993). Transparentsurfaces defined by implicit X junctions. VisionResearch, 33(16), 2339–2346.
Wijntjes, M. W. A., & Pont, S. C. (2010). Illusory glosson Lambertian surfaces. Journal of Vision, 10(9):13,1–12, http://www.journalofvision.org/content/10/9/13, doi:10.1167/10.9.13. [PubMed] [Article]
Wills, J., Agarwal, S., Kriegman, D., & Belongie, S.(2009). Toward a perceptual space for gloss. ACMTransactions on Graphics (TOG), 28(4), 105.
Xiao, B., Gkioulekas, I., Dunn, A., Zhao, S., Adelson,E., Zickler, T., & Bala, K. (2012). Effects of shapeand color on the perception of translucency.Journal of Vision, 12(9): 948, http://www.journalofvision.org/content/12/9/948, doi:10.1167/12.9.948. [Abstract]
Journal of Vision (2014) 14(3):17, 1–22 Xiao et al. 20
Appendix
A. Phase function models and the parameters
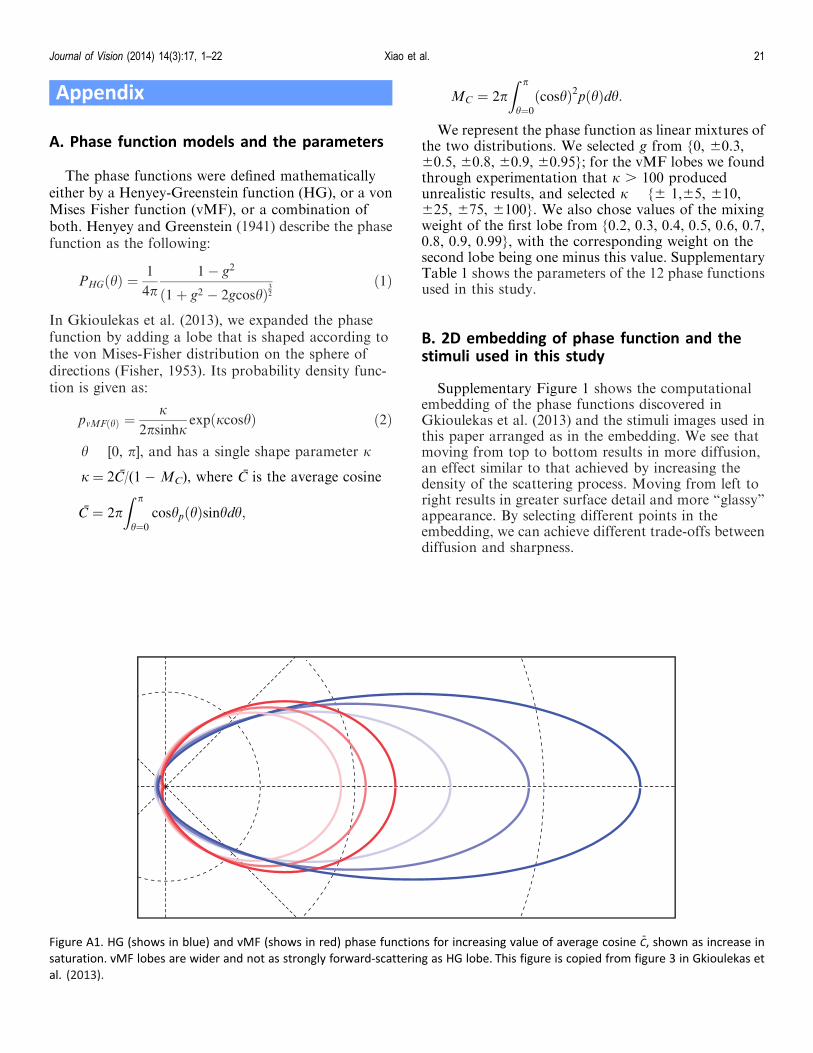
The phase functions were defined mathematicallyeither by a Henyey-Greenstein function (HG), or a vonMises Fisher function (vMF), or a combination ofboth. Henyey and Greenstein (1941) describe the phasefunction as the following:
PHGðhÞ ¼1
4p1% g2
ð1þ g2 % 2gcoshÞ32
ð1Þ
In Gkioulekas et al. (2013), we expanded the phasefunction by adding a lobe that is shaped according tothe von Mises-Fisher distribution on the sphere ofdirections (Fisher, 1953). Its probability density func-tion is given as:
pvMFðhÞ ¼j
2psinhjexpðjcoshÞ ð2Þ
h ! [0, p], and has a single shape parameter j
j¼ 2C/(1 % MC), where C is the average cosine
C ¼ 2pZ p
h¼0coshpðhÞsinhdh;
MC ¼ 2pZ p
h¼0ðcoshÞ2pðhÞdh:
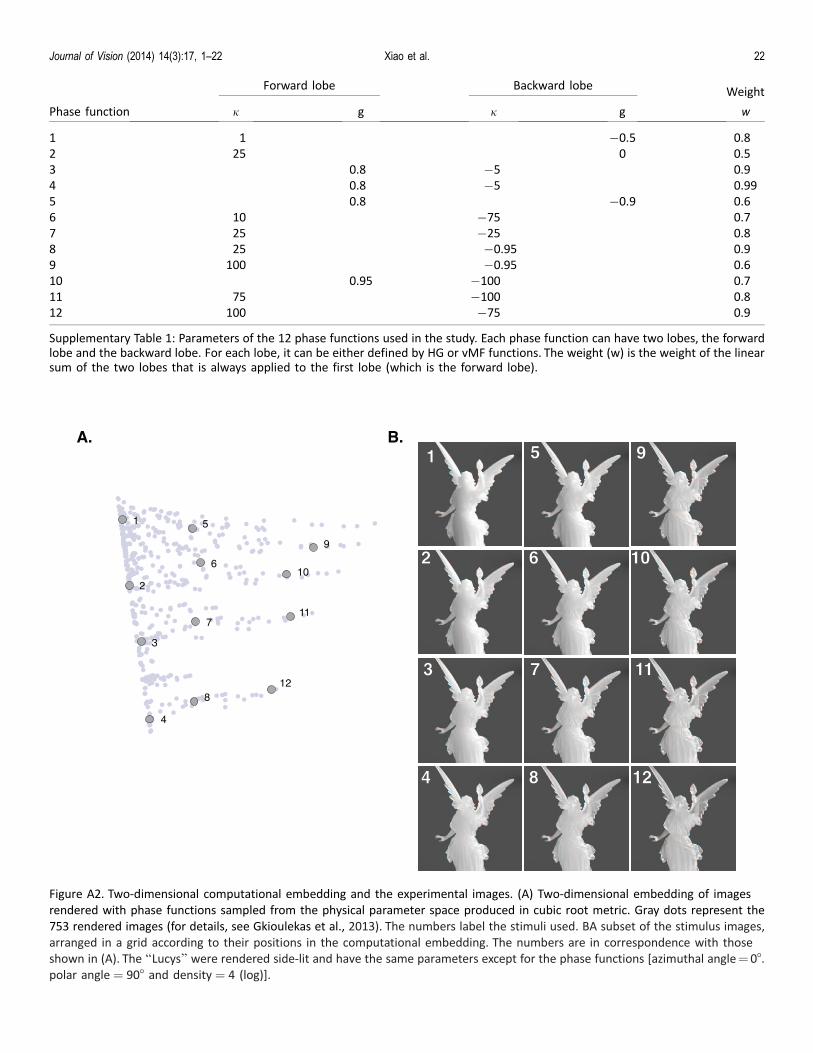
We represent the phase function as linear mixtures ofthe two distributions. We selected g from {0, 60.3,60.5, 60.8, 60.9, 60.95}; for the vMF lobes we foundthrough experimentation that j . 100 producedunrealistic results, and selected j ! {6 1,65, 610,625, 675, 6100}. We also chose values of the mixingweight of the first lobe from {0.2, 0.3, 0.4, 0.5, 0.6, 0.7,0.8, 0.9, 0.99}, with the corresponding weight on thesecond lobe being one minus this value. SupplementaryTable 1 shows the parameters of the 12 phase functionsused in this study.
B. 2D embedding of phase function and thestimuli used in this study
Supplementary Figure 1 shows the computationalembedding of the phase functions discovered inGkioulekas et al. (2013) and the stimuli images used inthis paper arranged as in the embedding. We see thatmoving from top to bottom results in more diffusion,an effect similar to that achieved by increasing thedensity of the scattering process. Moving from left toright results in greater surface detail and more ‘‘glassy’’appearance. By selecting different points in theembedding, we can achieve different trade-offs betweendiffusion and sharpness.
Figure A1. HG (shows in blue) and vMF (shows in red) phase functions for increasing value of average cosine C, shown as increase in
saturation. vMF lobes are wider and not as strongly forward-scattering as HG lobe. This figure is copied from figure 3 in Gkioulekas et
al. (2013).
Journal of Vision (2014) 14(3):17, 1–22 Xiao et al. 21
Phase function
Forward lobe Backward lobe Weight
j g j g w
1 1 %0.5 0.82 25 0 0.53 0.8 %5 0.94 0.8 %5 0.995 0.8 %0.9 0.66 10 %75 0.77 25 %25 0.88 25 %0.95 0.99 100 %0.95 0.610 0.95 %100 0.711 75 %100 0.812 100 %75 0.9
Supplementary Table 1: Parameters of the 12 phase functions used in the study. Each phase function can have two lobes, the forwardlobe and the backward lobe. For each lobe, it can be either defined by HG or vMF functions. The weight (w) is the weight of the linearsum of the two lobes that is always applied to the first lobe (which is the forward lobe).
11
2
3
4
5
6
7
8
9
1010
1111
1212
1
2
3
4
5
6
7
8
9
10
11
12
A. B.
Figure A2. Two-dimensional computational embedding and the experimental images. (A) Two-dimensional embedding of images
rendered with phase functions sampled from the physical parameter space produced in cubic root metric. Gray dots represent the
753 rendered images (for details, see Gkioulekas et al., 2013). The numbers label the stimuli used. BA subset of the stimulus images,
arranged in a grid according to their positions in the computational embedding. The numbers are in correspondence with thoseshown in (A). The ‘‘Lucys’’ were rendered side-lit and have the same parameters except for the phase functions [azimuthal angle¼ 08.polar angle ¼ 908 and density ¼ 4 (log)].
Journal of Vision (2014) 14(3):17, 1–22 Xiao et al. 22