Embed Size (px)
Citation preview
Meteor Berichte 05
Mid-Atlantic Expedition 2005
Cruise No. 64, Leg 2
Longterm study of hydrothermalism and biologyat the Logatchev field, Mid-Atlantic Ridge at
14°45’N (revisit 2005; HYDROMAR II)6 May – 6 June 2005, Fortaleza (Brazil) – Dakar (Senegal)
K.S. Lackschewitz, M. Armini, N. Augustin, N. Dubilier, D. Edge, G. Engemann, M.Fabian, J. Felden, P. Franke, A. Gärtner, D. Garbe-Schönberg, H.-H. Gennerich, D.Hüttig, H. Marbler, A. Meyerdierks, T. Pape, M. Perner, M. Reuter, G. Ruhland, K.Schmidt, T. Schott, M. Schroeder, G. Schroll, C. Seiter, J. Stecher, H. Strauss, M.Viehweger, S. Weber, F. Wenzhöfer, F. Zielinski
Project Leader: Heiner Villinger
Leitstelle MeteorInstitut für Meereskunde der Universität Hamburg
2005
Content
SUMMARY..................................................................................................................................................... 1
2.1 PARTICIPANTS................................................................................................................................. 22.2 RESEARCH PROGRAM ...................................................................................................................... 42.3 NARRATIVE OF THE CRUISE.............................................................................................................. 52.4 PRELIMINARY RESULTS ................................................................................................................... 9
2.4.1 Detailed geological studies of the Logatchev-1 hydrothermal field.............................................. 92.4.2 ROV deployments..................................................................................................................... 122.4.3 OFOS deployments .................................................................................................................. 142.4.4 Description of rocks and hydrothermal precipitates .................................................................. 172.4.5 Environmental parameters and longterm monitoring ................................................................ 192.4.6 Physico-chemical characterization of the Logatchev hydrothermal field (LHF) ......................... 262.4.7 Fluid chemistry ........................................................................................................................ 332.4.8 Marine microbiology................................................................................................................ 422.4.9 Hydrothermal symbioses .......................................................................................................... 452.4.10 Fluid dynamic and microbial processes.................................................................................... 482.4.11 Metagenomics.......................................................................................................................... 512.4.12 Marine zoology........................................................................................................................ 53
2.5 WEATHER CONDITIONS.................................................................................................................. 602.6 ACKNOWLEDGMENTS .................................................................................................................... 602.7 REFERENCES ................................................................................................................................. 61
APPENDIX 62
Summary 1
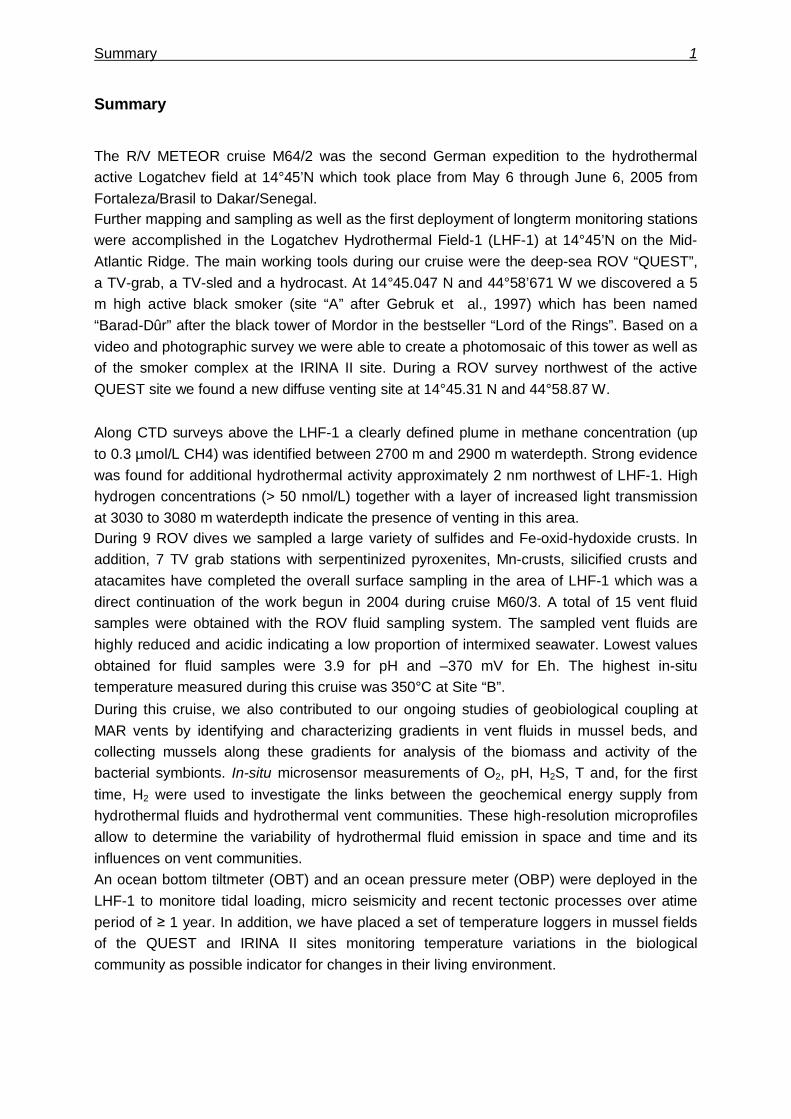
Summary
The R/V METEOR cruise M64/2 was the second German expedition to the hydrothermalactive Logatchev field at 14°45’N which took place from May 6 through June 6, 2005 fromFortaleza/Brasil to Dakar/Senegal.Further mapping and sampling as well as the first deployment of longterm monitoring stationswere accomplished in the Logatchev Hydrothermal Field-1 (LHF-1) at 14°45’N on the Mid-Atlantic Ridge. The main working tools during our cruise were the deep-sea ROV “QUEST”,a TV-grab, a TV-sled and a hydrocast. At 14°45.047 N and 44°58’671 W we discovered a 5m high active black smoker (site “A” after Gebruk et al., 1997) which has been named“Barad-Dûr” after the black tower of Mordor in the bestseller “Lord of the Rings”. Based on avideo and photographic survey we were able to create a photomosaic of this tower as well asof the smoker complex at the IRINA II site. During a ROV survey northwest of the activeQUEST site we found a new diffuse venting site at 14°45.31 N and 44°58.87 W.
Along CTD surveys above the LHF-1 a clearly defined plume in methane concentration (upto 0.3 µmol/L CH4) was identified between 2700 m and 2900 m waterdepth. Strong evidencewas found for additional hydrothermal activity approximately 2 nm northwest of LHF-1. Highhydrogen concentrations (> 50 nmol/L) together with a layer of increased light transmissionat 3030 to 3080 m waterdepth indicate the presence of venting in this area.During 9 ROV dives we sampled a large variety of sulfides and Fe-oxid-hydoxide crusts. Inaddition, 7 TV grab stations with serpentinized pyroxenites, Mn-crusts, silicified crusts andatacamites have completed the overall surface sampling in the area of LHF-1 which was adirect continuation of the work begun in 2004 during cruise M60/3. A total of 15 vent fluidsamples were obtained with the ROV fluid sampling system. The sampled vent fluids arehighly reduced and acidic indicating a low proportion of intermixed seawater. Lowest valuesobtained for fluid samples were 3.9 for pH and –370 mV for Eh. The highest in-situtemperature measured during this cruise was 350°C at Site “B”.During this cruise, we also contributed to our ongoing studies of geobiological coupling atMAR vents by identifying and characterizing gradients in vent fluids in mussel beds, andcollecting mussels along these gradients for analysis of the biomass and activity of thebacterial symbionts. In-situ microsensor measurements of O2, pH, H2S, T and, for the firsttime, H2 were used to investigate the links between the geochemical energy supply fromhydrothermal fluids and hydrothermal vent communities. These high-resolution microprofilesallow to determine the variability of hydrothermal fluid emission in space and time and itsinfluences on vent communities.An ocean bottom tiltmeter (OBT) and an ocean pressure meter (OBP) were deployed in theLHF-1 to monitore tidal loading, micro seismicity and recent tectonic processes over atimeperiod of 1 year. In addition, we have placed a set of temperature loggers in mussel fieldsof the QUEST and IRINA II sites monitoring temperature variations in the biologicalcommunity as possible indicator for changes in their living environment.
2
2.1 Participants
Name Discipline Institution1. Lackschewitz, Klas, Dr. / Chief
ScientistMineralogy IFM-GEOMAR
2. Amini, Marghaleray Fluid Chemistry IFM-GEOMAR3. Augustin, Nico Mineralogy IFM-GEOMAR4. Dubilier, Nicole, Dr. Microbiology MPI Bremen5. Edge, Dave ROV SOC6. Engemann, Greg ROV ASR7. Fabian, Markus, Dr. Geophysics GeoB8. Felden, Janine Microbiology IFM-GEOMAR9. Franke, Philip ROV MARUM10. Gärtner, Andrea Microbiology IFM-GEOMAR11. Garbe-Schönberg, Dieter, Dr. Fluid Chemistry IfG Kiel12. Gennerich, Hans-Hermann, Dr. Geophysics GeoB13. Hüttig, Daniel ROV MARUM14. Marbler, Herwig, Dr. Fluid Chemistry IUB15. Meyerdierks, Anke, Dr. Microbiology MPI Bremen16. Pape, Thomas, Dr. Gas Chemistry IfBM Hamburg17. Perner, Mirjam Microbiology IFM-GEOMAR18. Reuter, Michael ROV MARUM19. Ruhland, Götz ROV MARUM20. Schmidt, Katja Fluid Chemistry IUB21. Schott, Thorsten Technican IFM-GEOMAR22. Schröder, Marcel ROV MARUM23. Schroll, Gunnar Gas Chemistry IfBM Hamburg24. Seiter, Christian ROV MARUM25. Stecher, Jens, Dr. Zoology Senckenberg26. Strauss, Harald, Prof. Dr. Geochemistry GPI Münster27. Viehweger, Marc Microbiology MPI Bremen28. Weber, Stefan Gas Chemistry IfBM Hamburg29. Wenzhöfer, Frank, Dr. Microbiology MPI Bremen30. Zielinski, Frank Microbiology MPI-Bremen
ASR Alstom Schilling Robotics201 Cousteau PlaceDavis, CA 95616 / USA
GeoB Universität BremenFB GeowissenschaftenPostfach 33044028334 Bremen / Germany
GPI Geologisch-Paläontologisches InstitutWestfälische Wilhelms-Universität MünsterCorrensstraße 2448149 Münster / Germany
IfBM Universität Hamburg
3
Institut für Biogeochemie und MeereschemieBundesstr. 55D-20146 Hamburg / Germany
IfM-GEOMAR Leibniz-Institut für MeereswissenschaftenDüsternbrooker Weg 20D-24105 Kiel / GermanyWischhofstr. 1-3D-24148 Kiel / Germany
IfG Universität KielInstitut für GeowissenschaftenOlshausenstr. 40D-24098 Kiel / Germany
IUB International University BremenGeosciences and AstrophysicsP.O. Box 750561D-28725 Bremen / Germany
MARUM Zentrum für Marine UmweltwissenschaftenUniversität BremenPostfach 330440D-28334 Bremen / Germany
MPI-Bremen Max-Planck-Institut für Marine MikrobiologieCelsiusstr. 1D-28359 Bremen / Germany
Oktopus GmbH Kieler Str. 51D-24594 Hohenwestedt / Germany
RCOM Forschungszentrum Ozeanränder an der Universität BremenPostfach 330440D-28334 Bremen / Germany
Senckenberg Forschungsinstitut SenckenbergSenckenberganlage 25D-60325 Frankfurt a. M. / Germany
SOC Southampton Oceanography Centre, European Way,Southampton SO14 3ZH, U.K.
4
2.2 Research Program
(K. S. Lackschewitz, H. Villinger)
The investigations of this cruise are a continuation of the program started between 14°45’Nand 15°05’N on the Mid-Atlantic Ridge in 2004 (cruise M60/3). While in the 2004 cruise basicgeochemical and biological studies were carried out in the Logatchev hydrothermal field, theemphasis of the 2005 cruise lies on the temporal variability of fluid emanations, fluidtemperature and chemistry, microbial activities and associated fauna at selectedhydrothermal vent sites. The overall goal of the proposed cruise is to advance the integratedstudy of the 14°45’N hydrothermal sites further through multi-disciplinary characterizationand sampling at several sites. Biological, mineralogical and hydrological samples are to betaken in a well-characterized thermal environment so that the results on the samples can beinterpreted in terms of the influence of the important environmental parameter temperature.The cruise is the second in a number of cruises within the 6-year SPP program, dedicated toa long-term study in this area to investigate medium-term variability in the hydrothermallyactive sites and the related geochemical and biological consequences.Long-term monitoring of all relevant environmental parameters is essential to assess thetemporal variability observed in the biogeochemistry of the hydrothermal field. Theparameters are (a) temperature, (b) absolute pressure, (c) mean micro seismicity and (d)local sea floor tilt. We will observe correlation and coupling between hot fluid outflow,hydrothermal activity, tidal loading, micro seismicity and recent tectonic processes with highresolution of amplitudes and time. Additionally, a plume temperature profiler for mapping theextend of the hydrothermal plume, a distributed temperature sensing system for monitoring inparticular biological communities at the sea floor, a ROV temperature lance with online datatransfer over the ROV communication system up to the ship and a temperature calibrationfacility for the temperature sensors is provided. Temperature measurements, the use ofsensors and the sampling of fluids to determine the chemical composition of the fluids,material fluxes and spatial and temporal gradients give the basic information to characterizethe environment in which the ecosystem develops. Three groups are mainly interested in thecharacterization of free living microorganisms, which are involved in carbon and sulfurcycling in hydrothermal vent areas. Methane consuming communities are studied inhydrothermal fluids, sediments and crusts with a special focus on the process of anaerobicoxidation of methane and in close cooperation with the gas geochemistry group. Anothergroup is predominantly interested in sulfur bacteria and in the influence of temperature onmicrobial communities, cooperating closely with the groups analyzing sulfur species andisotopes. Environmental genomics are applied to investigate the metabolic capabilities ofthese microbial communities, thereby focusing on the finding of new genes and unexpectedmetabolic properties. The development of symbiotic communities (bacteria and host fauna) isdirectly related to the chemical content and energy of the fluids. However, the pathway ofinteractions does not only involve influence of the fluids on the development of organismcommunities, but microorganisms and fauna also change the fluid chemistry due to theiruptake and excretion of chemical compounds.Samples for the biologists are chosen in cooperation with the geochemists measuring thedifferent abiotic parameters. The samples are shared between the different groups, analyzed
5
in close collaboration and the results will be finally evaluated in the context of all geochemicaland microbiological findings with respect to the bio-geo coupling. The aim is to develop anoverall model for the temporal and spatial development of the Logatchev hydrothermalecosystem, which also includes control by general environmental parameters such as waterdepth and geological conditions.
2.3 Narrative of the cruise
(K.S. Lackschewitz)
The final preparations for cruise M64/2 were completed onboard the R/V METEOR in theharbour of Fortaleza (Brazil) between May 3 and 6. All 22 scientists of Leg M64/2 boardedthe ship on May 5. A test of the ROV vehicle in the harbour was successfully carried out atmidday on May 6.The R/V METEOR cleared the port of Fortaleza in the afternoon of May 6 and began hertransit to 13°30’N and 45°00’W. The scientists used the five-day transit to set up thelaboratories and to test their sensors and water sampling equipment. Scientific work startedin the afternoon of May 10 with a reference CTD hydrocast station at 13°30'N/45°00’W forsampling seawater from different waterdepths. Hydrosweep mapping along the ridge axiswas carried out during the night. A 90 minute transit to our main working area, the Logatchevhydrothermal field (LHF-1; 14°45.20’N/44°58.80’S), was followed by a CTD hydrocast stationto investigate the hydrothermal plume over the LHF-1.In the morning of May 11 the first ROV station failed shortly after deployment due tocommunication problems between the ROV and the control container. Therefore, a hydrocaststation was carried out SW of LHF-1 to investigate the hydrothermal plume dispersal in thewater column. A TV-grab (222GTV) was taken about 300m SW of LHF-1 in order to samplethe periphery. The samples comprised of serpentinized ultramafics, partly covered with Mn-crusts, and one rock with atacamite. The night of May 12 was filled with a MAPR (miniaturautonomous plume recorder) string jo-jo (5 MAPP’s and 20 temperature loggers) to trace theturbidity anomalies of the hydrothermal plume in the area of LHF-1.4.On May 12 another attempt of a ROV dive failed again due to communication problems. ATV-grab station taken ca. 50 m southwest of IRINA II sampled ultramafics and Mn crusts. Inthe afternoon we started our first successful ROV dive (224) during our cruise M64-2. Afterreaching the seafloor we obtained an acoustic signal from the homer beacon 12 which weset up as a reference station during the cruise M60-3 at the QUEST site. We set up anotherbeacon (Nr. 14; 14°45,199’N/44°58,783’W) and an ocean bottom tilt meter (OBT) ca. 42 msouthwest of beacon 12. Fluid samples and temperature measurements were taken at asmall active black smoker close to the IRINA-II smoker complex.We continued our geological program with a TV-sled track from the NE to the SW over theLHF-1 in order to find hydrothermal precipitates and map the distribution of ultramafics in thisarea. Another hydrocast station should further map the distribution of the hydrothermal plumein the water column, whereas a stationary MAPR string over this area should map thetemporal variations of the proximal hydrothermal plume.During May 13 a ROV deployment was not possible due to a high sea swell.
6
The night to the May 14 was filled with two TV-grab stations and one hydrocast station. 229GTV was taken ca. 50 m west of ANNA LOUISE. The samples comprised of weaklyindurated to higher indurated brownish sediment, dark grayish sediment with fine dispersedpyrite crystals, and several Mn-crusts . At station 230 GTV south of „A“ the samples consistof altered coarse-grained to pegmatoid orthopyroxenites. The hydrocast station (231CTD)sampled the hydrothermal plume ca. 200 m northwest of the QUEST site.During dive 232ROV on May 14 biological and fluid samples were taken from a mussel fieldat the southern rim of the IRINA II compex. A special objective was a mussel transplantexperiment. In this experiment we are investigating how the removal of the mussels from thevent fluids will influence them and their symbiotic bacteria. Before collecting the mussels,insitu measurements of several physico-chemical parameters were taken (oxygen,temperature, sulfide, hydrogen, pH) with a profiler module. In addition, fluid samples weretaken.Plume mapping with the CTD was carried out during the night of May 14 to 15. Thenorthernmost CTD station detected three turbidity anomalies at 2700 m, 2900 m and 3050 mca. 1.5 km NNW of the LHF-1 suggesting at least one other unknown hydrothermal source. ATV-grab (station 239) was taken ca. 250 m northeast of IRINA-II in order to sample theperiphery of the LHF-1. Beside much sediment, crusts covered with atacamite and severalpieces of talc were detected. On the sediment surface we found several mussel shells ofBathymodyolus and Phymorhynchus.
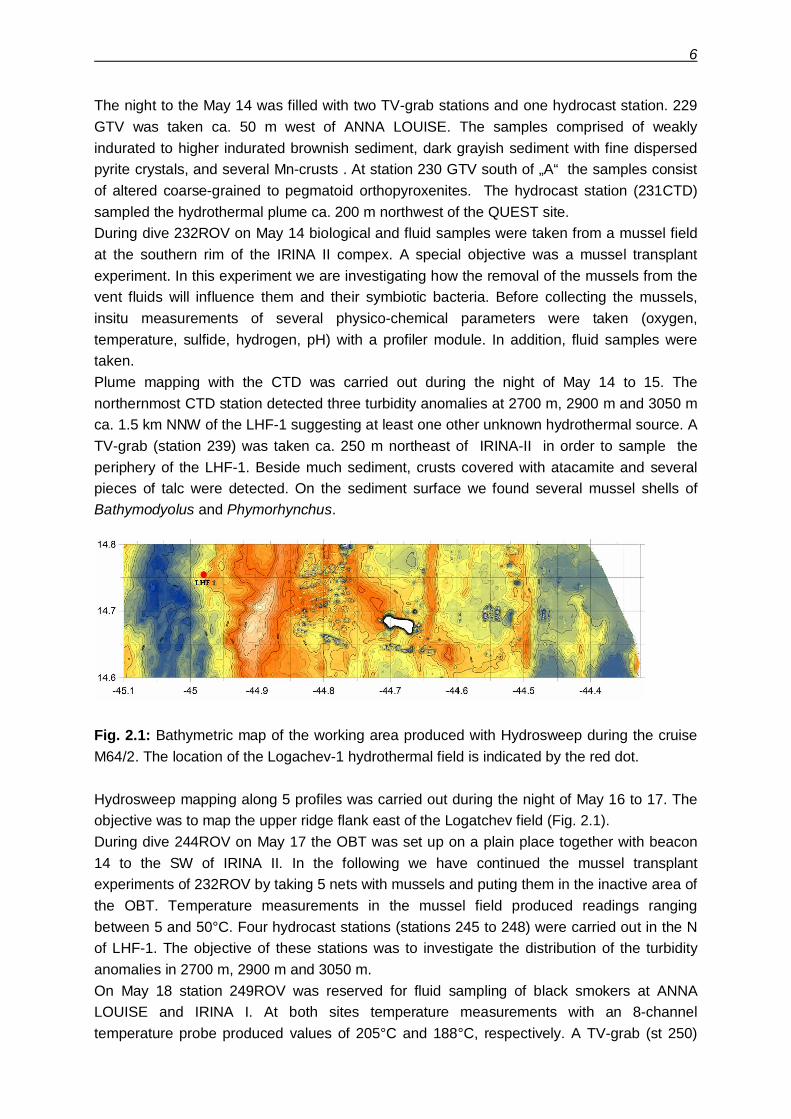
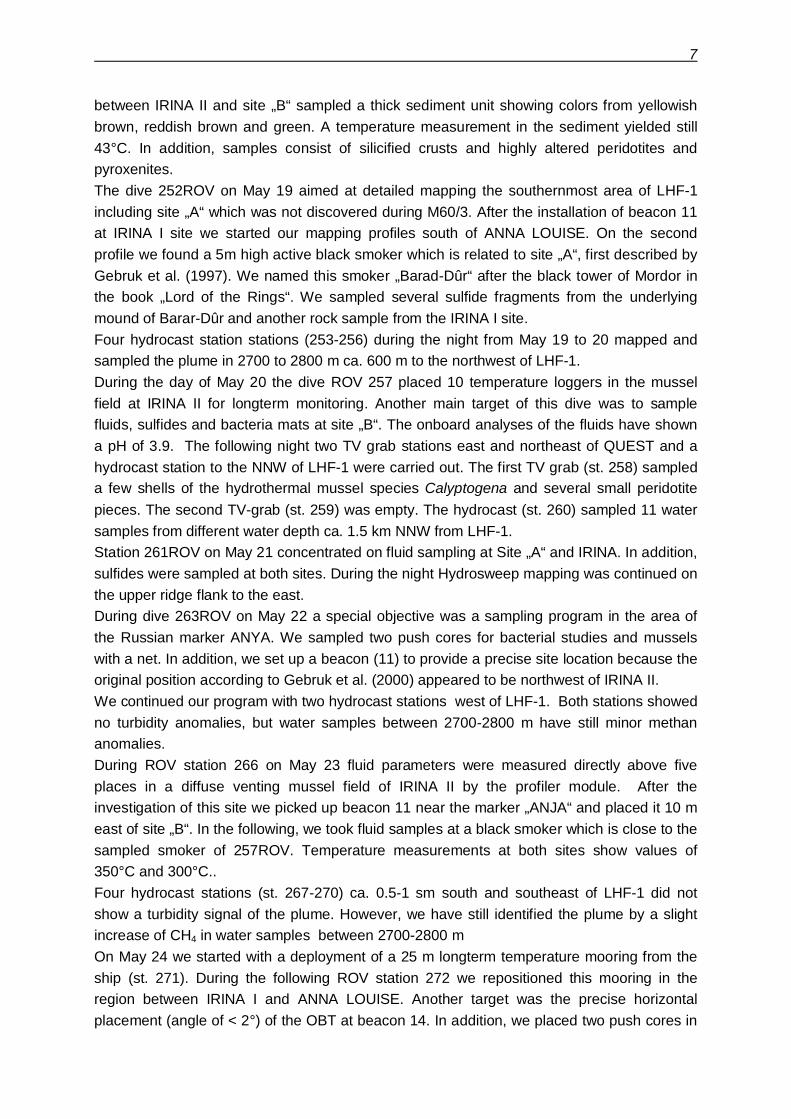
Fig. 2.1: Bathymetric map of the working area produced with Hydrosweep during the cruiseM64/2. The location of the Logachev-1 hydrothermal field is indicated by the red dot.
Hydrosweep mapping along 5 profiles was carried out during the night of May 16 to 17. Theobjective was to map the upper ridge flank east of the Logatchev field (Fig. 2.1).During dive 244ROV on May 17 the OBT was set up on a plain place together with beacon14 to the SW of IRINA II. In the following we have continued the mussel transplantexperiments of 232ROV by taking 5 nets with mussels and puting them in the inactive area ofthe OBT. Temperature measurements in the mussel field produced readings rangingbetween 5 and 50°C. Four hydrocast stations (stations 245 to 248) were carried out in the Nof LHF-1. The objective of these stations was to investigate the distribution of the turbidityanomalies in 2700 m, 2900 m and 3050 m.On May 18 station 249ROV was reserved for fluid sampling of black smokers at ANNALOUISE and IRINA I. At both sites temperature measurements with an 8-channeltemperature probe produced values of 205°C and 188°C, respectively. A TV-grab (st 250)
7
between IRINA II and site „B“ sampled a thick sediment unit showing colors from yellowishbrown, reddish brown and green. A temperature measurement in the sediment yielded still43°C. In addition, samples consist of silicified crusts and highly altered peridotites andpyroxenites.The dive 252ROV on May 19 aimed at detailed mapping the southernmost area of LHF-1including site „A“ which was not discovered during M60/3. After the installation of beacon 11at IRINA I site we started our mapping profiles south of ANNA LOUISE. On the secondprofile we found a 5m high active black smoker which is related to site „A“, first described byGebruk et al. (1997). We named this smoker „Barad-Dûr“ after the black tower of Mordor inthe book „Lord of the Rings“. We sampled several sulfide fragments from the underlyingmound of Barar-Dûr and another rock sample from the IRINA I site.Four hydrocast station stations (253-256) during the night from May 19 to 20 mapped andsampled the plume in 2700 to 2800 m ca. 600 m to the northwest of LHF-1.During the day of May 20 the dive ROV 257 placed 10 temperature loggers in the musselfield at IRINA II for longterm monitoring. Another main target of this dive was to samplefluids, sulfides and bacteria mats at site „B“. The onboard analyses of the fluids have showna pH of 3.9. The following night two TV grab stations east and northeast of QUEST and ahydrocast station to the NNW of LHF-1 were carried out. The first TV grab (st. 258) sampleda few shells of the hydrothermal mussel species Calyptogena and several small peridotitepieces. The second TV-grab (st. 259) was empty. The hydrocast (st. 260) sampled 11 watersamples from different water depth ca. 1.5 km NNW from LHF-1.Station 261ROV on May 21 concentrated on fluid sampling at Site „A“ and IRINA. In addition,sulfides were sampled at both sites. During the night Hydrosweep mapping was continued onthe upper ridge flank to the east.During dive 263ROV on May 22 a special objective was a sampling program in the area ofthe Russian marker ANYA. We sampled two push cores for bacterial studies and musselswith a net. In addition, we set up a beacon (11) to provide a precise site location because theoriginal position according to Gebruk et al. (2000) appeared to be northwest of IRINA II.We continued our program with two hydrocast stations west of LHF-1. Both stations showedno turbidity anomalies, but water samples between 2700-2800 m have still minor methananomalies.During ROV station 266 on May 23 fluid parameters were measured directly above fiveplaces in a diffuse venting mussel field of IRINA II by the profiler module. After theinvestigation of this site we picked up beacon 11 near the marker „ANJA“ and placed it 10 meast of site „B“. In the following, we took fluid samples at a black smoker which is close to thesampled smoker of 257ROV. Temperature measurements at both sites show values of350°C and 300°C..Four hydrocast stations (st. 267-270) ca. 0.5-1 sm south and southeast of LHF-1 did notshow a turbidity signal of the plume. However, we have still identified the plume by a slightincrease of CH4 in water samples between 2700-2800 mOn May 24 we started with a deployment of a 25 m longterm temperature mooring from theship (st. 271). During the following ROV station 272 we repositioned this mooring in theregion between IRINA I and ANNA LOUISE. Another target was the precise horizontalplacement (angle of < 2°) of the OBT at beacon 14. In addition, we placed two push cores in
8
the mussel field of IRINA II for microbial experiments and we took some samples from aninactive smoker ENE of IRINA II.Another four hydrocast stations (st. 273-276) have indicated that the eastern ridge flank actsas a boundary for the distribution of hydrothermal plume to the east and northeast.During dive 277ROV on May 25 we placed again the profiler module in the diffuse ventingmussel field at IRINA II. Temperature measurements showed values up to 140°C. Inaddition, a baited trap was deployed on the mussel bed close to the chimney complex.Detailed video images were recorded along two horizontal profiles of the eastern part of thechimney complex for constructing a photomosaic of this whole structure. Diffusely ventingfluids were sampled at the chimney complex close to the area which was already sampledduring M60-3 (st. 38ROV). Hydrothermal fauna were collected here also. At the end of thedive we mapped the area east of IRINA II along two profiles.A TV-sled track (st. 278) was carried out 2 sm north of LHF-1 in order to find indications of anactive vent field creating the hydrothermal plume in 3050 m water depth. Due to an electricfailure this station was aborted shortly after the first profile. In following two hydrocast stationwere carried out above the QUEST vent site and ca. 3 sm NW of LHF-1.The main target of dive 281ROV was a sampling program at the QUEST site. First we placeda benthic chamber on a mussel bed at IRINA II to measure H2 and S2- for several hours. AtQUEST site we sampled fluids and a net of hydrothermal fauna at a diffuse venting musselbed. At this site we placed also 9 longterm temperature monitoring loggers. In addition, wetook fluid samples, temperatures and sulfide samples from a hot venting black smoker.During the following night Hydrosweep mapping was continued on the upper eastern ridgeflank.At dive 283ROV on May 27 we continued our work at QUEST site. We deployed two 8-channel temperature loggers in the main mussel bed and sampled diffuse fluids with 3 Niskinbottles. A camera survey over the mussel bed was made to produce a photomosaic. Next weplaced the OPT on more stable ground and took the last net for the mussel bed experiment.In the following we finished our sampling program in IRINA II taking another fluid samples,temperatures at two vents and a net with shrimps. At the end of the dive we picked up thebeacon 13 and the baited trap. The night to May 28 was filled with another TV-sled station(st. 284) which investigated the area northwest of LHF-1 along several profiles searchingunknown hydrothermal sites.After this TV-sled track our last ROV station (285ROV) explored and mapped the areanorthwest of QUEST site in order to find an unknown vent site. After several profiles wefound a new diffuse venting site with several highly altered crusts ca. 150 m northwest ofQUEST site.Station work of cruise M64/2 was finished after this station and R/V Meteor started her transitto Dakar. R/V Meteor arrived the port of Dakar on June 4, at 06:00 am. All containers werebrought to the pier and loaded there by the scientific and technical crew. The scientists ofcruise M64/2 disembarked until the early evening of June 6, 2005.
9
2.4 Preliminary Results2.4.1 Detailed geological studies of the Logatchev-1 hydrothermal field (K.S. Lackschewitz, N. Augustin)
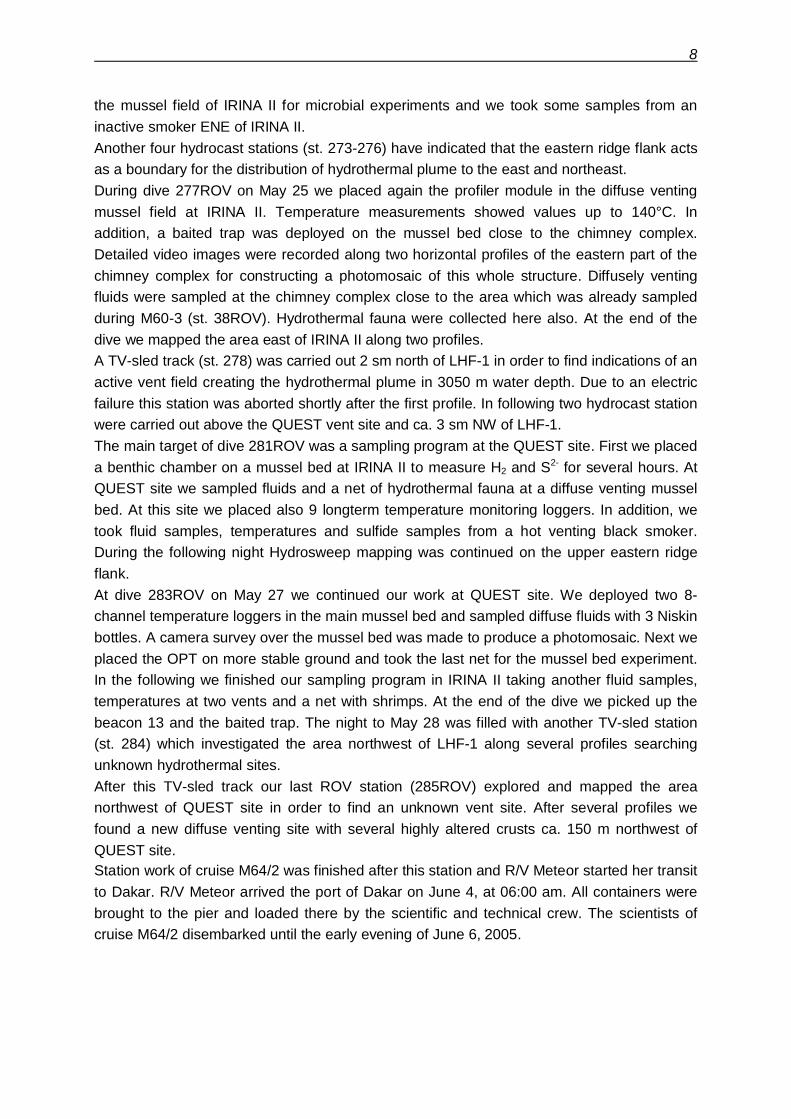
The geological setting and structure of the Logatchev-1 hydrothermal field (LHF-1), situatedon a small plateau on the eastern flank of the inner rift valley at 14°45’ N, has been describedby several workers (e.g., Krasnov et al. 1995; Gebruk et al., 1997). Extensive bathymetricand video mapping of the LHF during the first RV Meteor cruise M60/3 have revealed themain factors of its tectonic control (Kuhn et al., 2004). Detailed sampling has allowed study ofthe interrelationship of geological, geochemical and biological processes of an ultramafic-hosted hydrothermal system.The present detailed work carried out during the second RV Meteor cruise M64/2 resulted ina further mapping and sampling as well as the first deployments of long term monitoringstations (Fig. 2.2).
Fig. 2.2: Logatchev-1 hydrothermal field with long-term monitoring and TV-Grab stations(GTV) carried out during M64/2. A new diffuse venting-site is located NW of QUEST.
The LHF-1 extends at least 800 m in a NW-SE and probably more than 400 m in a SW-NEdirection as previously described by Kuhn et al. (2004). At the southeastern end of LHF-1 wediscovered the 5m high black smoker of Site“ A“ which was previously identified by Gebruk et
10
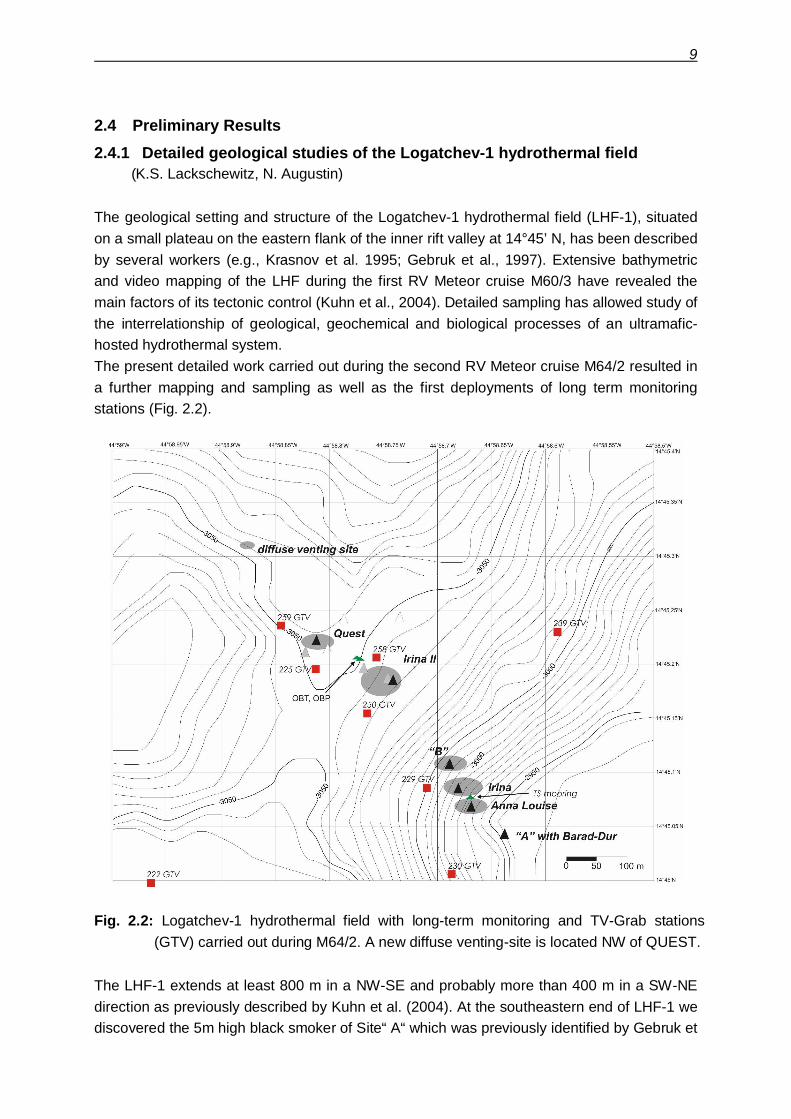
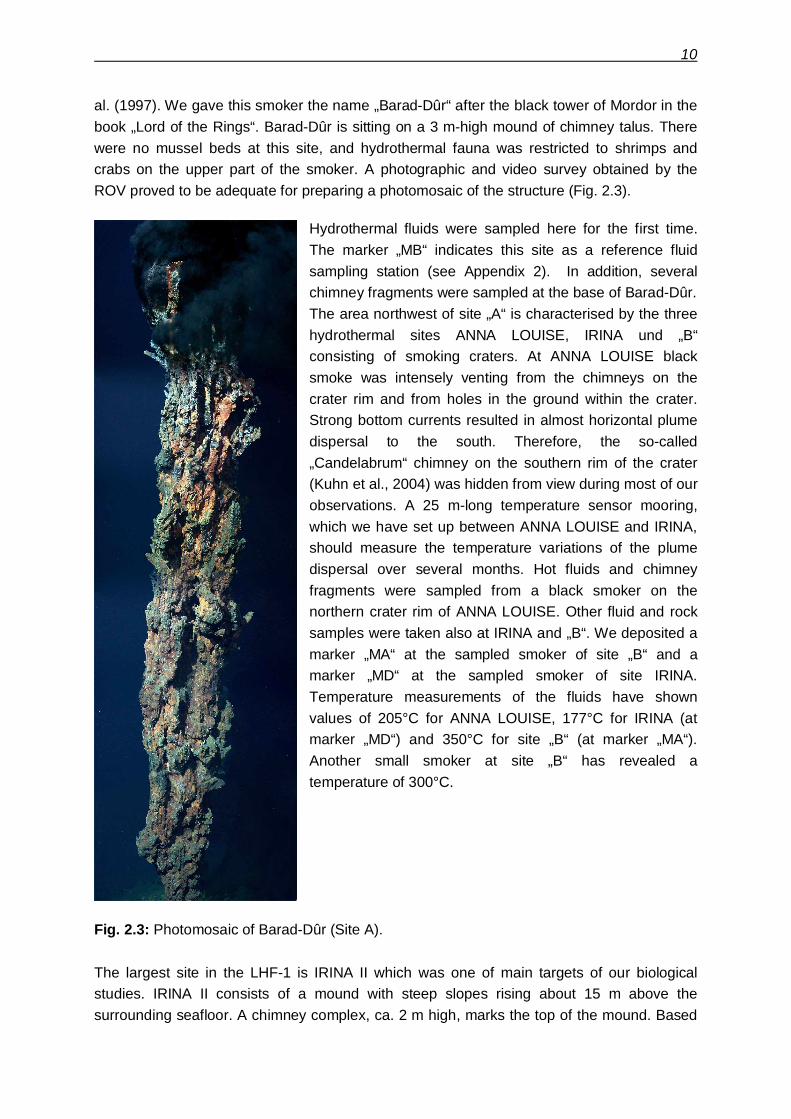
al. (1997). We gave this smoker the name „Barad-Dûr“ after the black tower of Mordor in thebook „Lord of the Rings“. Barad-Dûr is sitting on a 3 m-high mound of chimney talus. Therewere no mussel beds at this site, and hydrothermal fauna was restricted to shrimps andcrabs on the upper part of the smoker. A photographic and video survey obtained by theROV proved to be adequate for preparing a photomosaic of the structure (Fig. 2.3).
Hydrothermal fluids were sampled here for the first time.The marker „MB“ indicates this site as a reference fluidsampling station (see Appendix 2). In addition, severalchimney fragments were sampled at the base of Barad-Dûr.The area northwest of site „A“ is characterised by the threehydrothermal sites ANNA LOUISE, IRINA und „B“consisting of smoking craters. At ANNA LOUISE blacksmoke was intensely venting from the chimneys on thecrater rim and from holes in the ground within the crater.Strong bottom currents resulted in almost horizontal plumedispersal to the south. Therefore, the so-called„Candelabrum“ chimney on the southern rim of the crater(Kuhn et al., 2004) was hidden from view during most of ourobservations. A 25 m-long temperature sensor mooring,which we have set up between ANNA LOUISE and IRINA,should measure the temperature variations of the plumedispersal over several months. Hot fluids and chimneyfragments were sampled from a black smoker on thenorthern crater rim of ANNA LOUISE. Other fluid and rocksamples were taken also at IRINA and „B“. We deposited amarker „MA“ at the sampled smoker of site „B“ and amarker „MD“ at the sampled smoker of site IRINA.Temperature measurements of the fluids have shownvalues of 205°C for ANNA LOUISE, 177°C for IRINA (atmarker „MD“) and 350°C for site „B“ (at marker „MA“).Another small smoker at site „B“ has revealed atemperature of 300°C.
Fig. 2.3: Photomosaic of Barad-Dûr (Site A).
The largest site in the LHF-1 is IRINA II which was one of main targets of our biologicalstudies. IRINA II consists of a mound with steep slopes rising about 15 m above thesurrounding seafloor. A chimney complex, ca. 2 m high, marks the top of the mound. Based
11
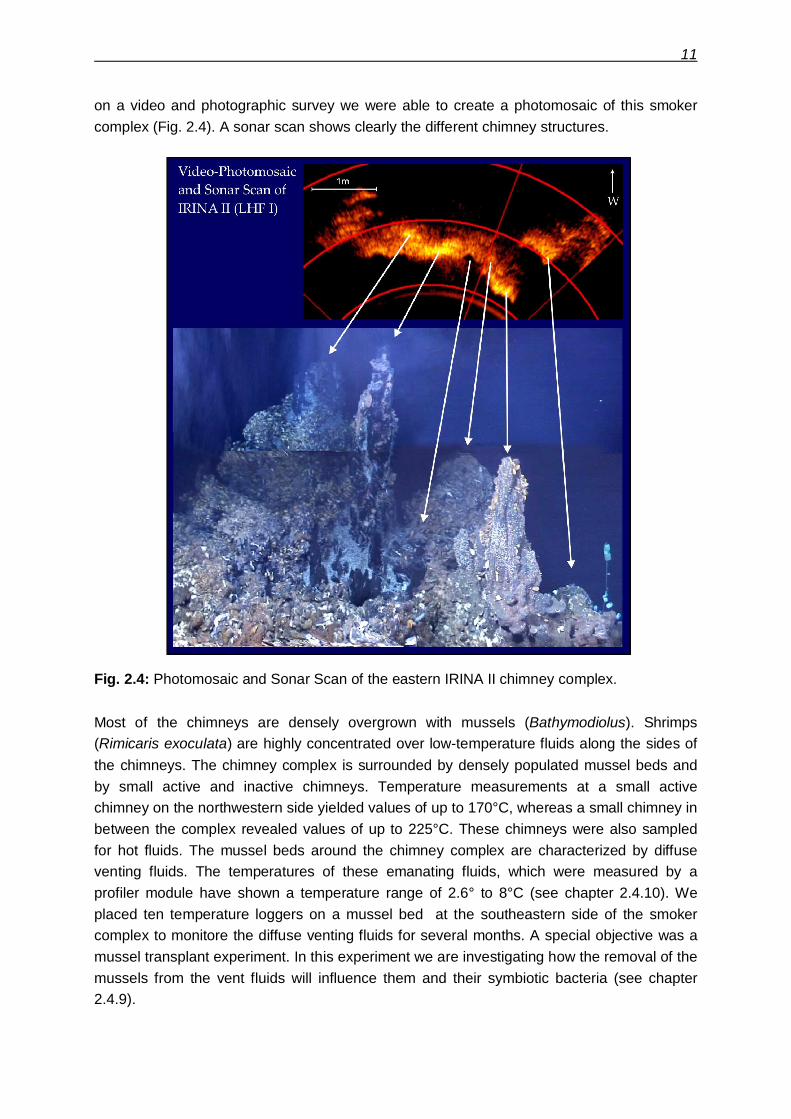
on a video and photographic survey we were able to create a photomosaic of this smokercomplex (Fig. 2.4). A sonar scan shows clearly the different chimney structures.
Fig. 2.4: Photomosaic and Sonar Scan of the eastern IRINA II chimney complex.
Most of the chimneys are densely overgrown with mussels (Bathymodiolus). Shrimps(Rimicaris exoculata) are highly concentrated over low-temperature fluids along the sides ofthe chimneys. The chimney complex is surrounded by densely populated mussel beds andby small active and inactive chimneys. Temperature measurements at a small activechimney on the northwestern side yielded values of up to 170°C, whereas a small chimney inbetween the complex revealed values of up to 225°C. These chimneys were also sampledfor hot fluids. The mussel beds around the chimney complex are characterized by diffuseventing fluids. The temperatures of these emanating fluids, which were measured by aprofiler module have shown a temperature range of 2.6° to 8°C (see chapter 2.4.10). Weplaced ten temperature loggers on a mussel bed at the southeastern side of the smokercomplex to monitore the diffuse venting fluids for several months. A special objective was amussel transplant experiment. In this experiment we are investigating how the removal of themussels from the vent fluids will influence them and their symbiotic bacteria (see chapter2.4.9).
12
As already described by Kuhn et al. (2004) the area around the Russian marker ANJA islocated at a slope approximately 30 m northwest of the IRINA II-complex. This markeridentifies a site called ANJA’S GARDEN in Gebruk et al. (2000) and these authors describedthat it occurs a 100 m northwest of IRINA-II. Based on our precise DVL navigation, weassume that the Gebruk et al. (2000) description of the ANJA marker location is incorrect. Atthe ANJA marker we found clusters of living and dead Bathymodiolus shells together withshimmering water. Visual observations during our dives in this area indicated that vesicomyidclams might be present. However, a ROV sample taken from the area of an old marker „C“,which is located close to the ANJA marker, revealed only Bathymodiolus shells.Just north of the IRINA II mound we placed an Ocean Bottom Tiltmeter (OBT) and an OceanBottom Pressuremeter (OBP) as longterm monitoring stations (see chapter 2.4.5) close tothe new LHF-1 reference beacon 14 (14°45.199’N / 44°58.783’W).The QUEST site, which was newly discovered during our first Meteor cruise M60/3 (Kuhn etal., 2004), is situated ca. 130 m WNW of the chimney complex of IRINA II. It is characterizedby a smoking crater surrounded by several small active chimneys. Fluids and chimneyfragments were sampled from a small black smoker on the northeastern side of the craterindicated by the marker „MC“. We have measured here fluid temperatures up to 285°C.Elongated clusters of mussels occur southeast of the smoking crater. ROV samples revealedthat the mussels consists of abundant juvenile forms which is in contrast to the highabundance of adult forms at IRINA II. A temperature logger (#3), which we deployed here onthe M60/3 cruise, showed values of up to 12°C. Therefore, we placed here nine 1-channeltemperature loggers and two 8-channel temperature loggers for longterm measurements.Mapping the area north of QUEST site with the ROV revealed sediments with ripple marksintercalated by several ultramafic outcrops. At ca. 150 m northwest of the QUEST site wefound a diffuse venting site with highly altered ultramafics confirming a larger extent of LHF-1similar to the observation made by Kuhn et al. (2004).
2.4.2 ROV deployments (G. Ruhland and ROV-Team)
The remotely operated deep diving robot QUEST is an electrical 4000 m rated, work classROV, which is operated by MARUM, University of Bremen, since May 2003. The vehicle hasbeen manufactured by Schilling Robotics, Davis, USA. The total QUEST system weights 45tons (including the vehicle, control van, workshop van, winch, 5000 m umbilical, launch-and-recovery-frame, and two transportation vans, all 20-feet-size). The 5000 m of 17.6mm NSWumbilical is stored and managed by an electrical MacArtney Cormac winch. No hydraulicconnections have to be installed during mobilisation.QUEST’s first use within SPP1144 took place during Rv METEOR leg M60/3 in January 2004.The leg M64/2 is the second task of QUEST in the Logachev Hydrothermal Vent Field. Thetechnical innovations of the ROV provided a flexible and highly adaptable platform forscientific sampling and observation tasks and therefore played a major role to the scientificsuccess aboard RV METEOR. Since the previous leg new features have been additionallyinstalled including the highly integrated USBL positioning system, based on the French
13
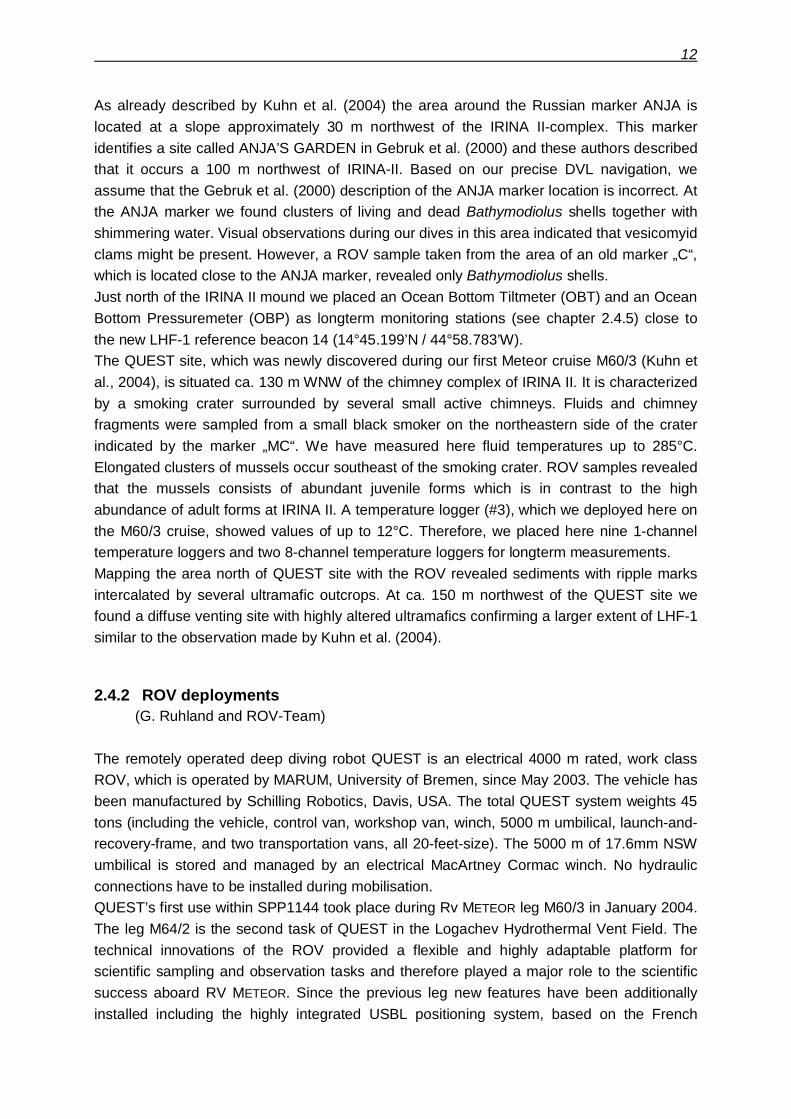
IXSEA-GAPS inertial Navigation and Positioning system. However, due to a malfunction ofthe GAPS system Inertial Navigation and Positioning could be used only very limited. Inaddition, QUEST uses a Doppler velocity log (DVL) to perform StationKeep or Displacementmode, automatically controlled 3D positioning, and other auto control functions. Navigationalpurposes were supported by an array of Sonardyne HF beacons set in the vent field. Anadditional frame installed in the ship’s A-frame enables much smoother and safe handling ofthe ROV during launch and recovery.
Fig. 2.5: Launching of the ROV with an additional frame at the aft (Photo: D. Garbe-Schönberg).
The QUEST system can be precisely controlled with its 60 kW electric propulsion system andis operated as free-flying vehicle. No tether management system (TMS) has to be operatedat the same time the ROV is working. The collection of biological and geological samples andthe pumping of fluids could be done with two installed robotic arms. While the RIGMASTER
manipulator can lift and handle devices or samples up to 250 kg, the ORION manipulator isused to handle probes or work on delicate tasks.A set of video and still picture cameras together with a 2.4 kW light suite providespossibilities for video mapping and photo mosaicing. Therefore two green lasers which areinstalled parallel to each other can be used as size relation. Due to a water leak the InsitePacific ATLAS camera could be used on the first four dives only.Besides cameras and manipulators, the scientific equipment installed during leg M64/2constisted of a CTD with turbidity and high-temperature sensors, which could be used onlyon three dives due to a water intrusion in the housing. A set of niskin bottles, a 675 kHzscanning sonar, a sample drawbox and several different sampling tools such as “hand” netsand grabbing devices complete the installed equipment.
14
The scientific data base system used at MARUM feeds all ROV- and ship-based science andlogging channels into an adapted real-time database system (DAVIS-ROV). The QUESTcontrol system provides transparent access to all RS-232 data and video channels. Duringoperation data and video has be distributed by the real-time database via the ship’s networksystem in different laboratories and supply the scientists with data from their own devices.Dive summaries containing all data of interest including video and digital still photographswere compiled after each dive. Using the database's export capabilities in combination withthe software product "ADELIE" developed at IFREMER, GIS based plots, data graphs anddivetrack maps containing time and position-referenced scientific data, video and imageswere available shortly after or even during the dives.Post-cruise data archival will be hosted by the information system PANGAEA(www.pangaea.de) at the World Data Center for Marine Environmental Sciences (WDC-MARE), which is operated on a long-term base by MARUM, University of Bremen, and theFoundation Alfred Wegener Institute for Polar and Marine Research, Bremerhaven (AWI).During leg M64/2 QUEST could be successfully deployed 15 times while 14 of these divesreached the bottom. Launch and recovery has been done at sea states up to 2.5 m andwinds of up to 6 bft.. Total bottom time of 110 hours could be achieved at depths of 2950 to3050m. The planned scientific program could be finished completely during the leg. Beneathscientific sampling and photo mosaicing the current working map could be improved andcompleted in some parts. Two scientific devices, an ocean bottom tiltmeter (OBT) and anocean bottom pressure sensor (OBP) had been transported with the ROV to the bottom andinstalled during the dives. 24 temperature loggers for a yearly monitoring program were alsodistributed in mussel fields. A profiler frame and a benthic chamber had been successfullytransported and set with the ROV several times for a daily monitoring.During all operations, the crew of RV METEOR provided a very successful and smoothhandling on deck, excellent navigation and professional technical support to fulfill thescientific tasks required.
2.4.3 OFOS deployments(N. Augustin, H.-H. Gennerich, K.S. Lackschewitz, H. Marbler, T. Pape, S. Weber, G.Schroll)
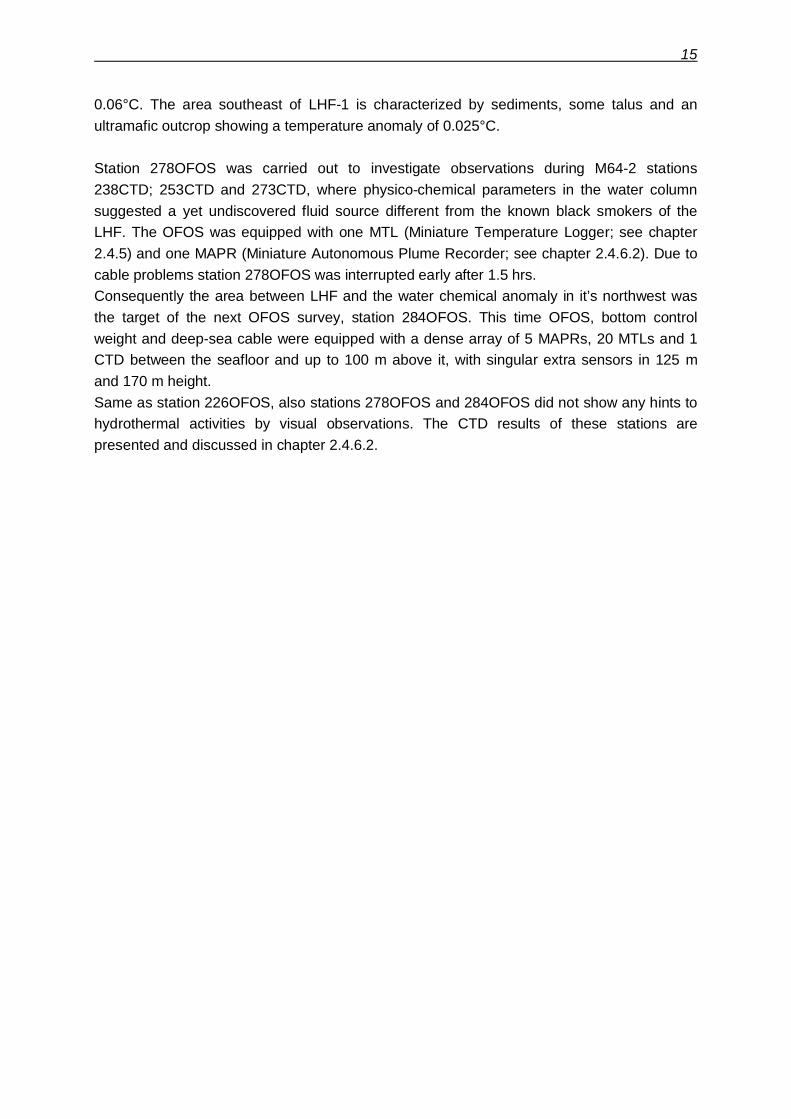
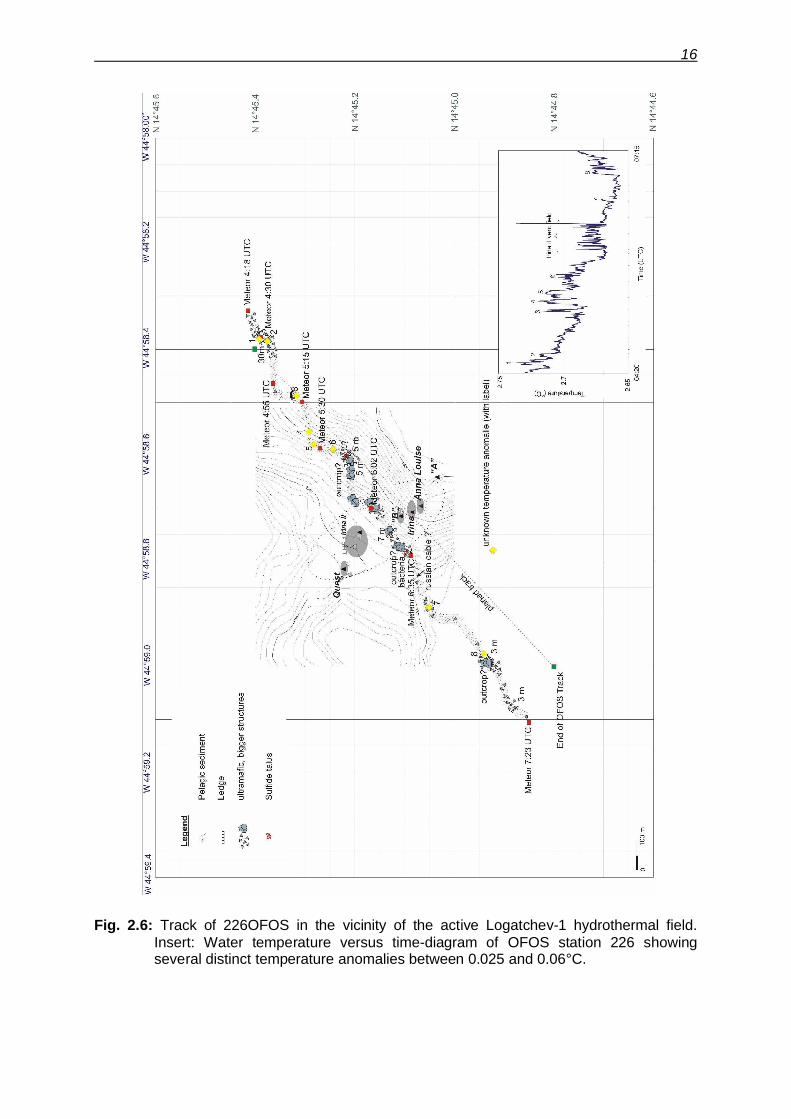
A total of 3 TV-sled stations were carried out in the vicinity of LHF-1. The objectives of theOFOS (Ocean Floor Observation System) stations were to find signs of unknownhydrothermal activity.The IFM-GEOMAR TV-sled was equipped with a BENTHOS photo camera and flash, aSONY digital camcorder and a FSI 3’’ memory CTD probe. During our first OFOS-station 226we have mapped a NW-SE profile between 14°45.4’N / 44°58.35’W and 14°44.85’N /44°59.1’ W crossing site „B“ of LHF-1 (Fig. 2.6). The beginning of the profile is characterizedby a talus field followed by sediments, where we found four temperature anomalies with anincrease of 0.03°C. One of this anomalies is close to 239GTV-station showing a temperatureof the sampled sediments of 43°C onboard. When we crossed site „B“ no sign ofhydothermal activity was visible. However, we have measured a temperature anomaly of
15
0.06°C. The area southeast of LHF-1 is characterized by sediments, some talus and anultramafic outcrop showing a temperature anomaly of 0.025°C.
Station 278OFOS was carried out to investigate observations during M64-2 stations238CTD; 253CTD and 273CTD, where physico-chemical parameters in the water columnsuggested a yet undiscovered fluid source different from the known black smokers of theLHF. The OFOS was equipped with one MTL (Miniature Temperature Logger; see chapter2.4.5) and one MAPR (Miniature Autonomous Plume Recorder; see chapter 2.4.6.2). Due tocable problems station 278OFOS was interrupted early after 1.5 hrs.Consequently the area between LHF and the water chemical anomaly in it’s northwest wasthe target of the next OFOS survey, station 284OFOS. This time OFOS, bottom controlweight and deep-sea cable were equipped with a dense array of 5 MAPRs, 20 MTLs and 1CTD between the seafloor and up to 100 m above it, with singular extra sensors in 125 mand 170 m height.Same as station 226OFOS, also stations 278OFOS and 284OFOS did not show any hints tohydrothermal activities by visual observations. The CTD results of these stations arepresented and discussed in chapter 2.4.6.2.
16
Fig. 2.6: Track of 226OFOS in the vicinity of the active Logatchev-1 hydrothermal field.Insert: Water temperature versus time-diagram of OFOS station 226 showingseveral distinct temperature anomalies between 0.025 and 0.06°C.
17
2.4.4 Description of rocks and hydrothermal precipitates(N. Augustin, H. Strauss)
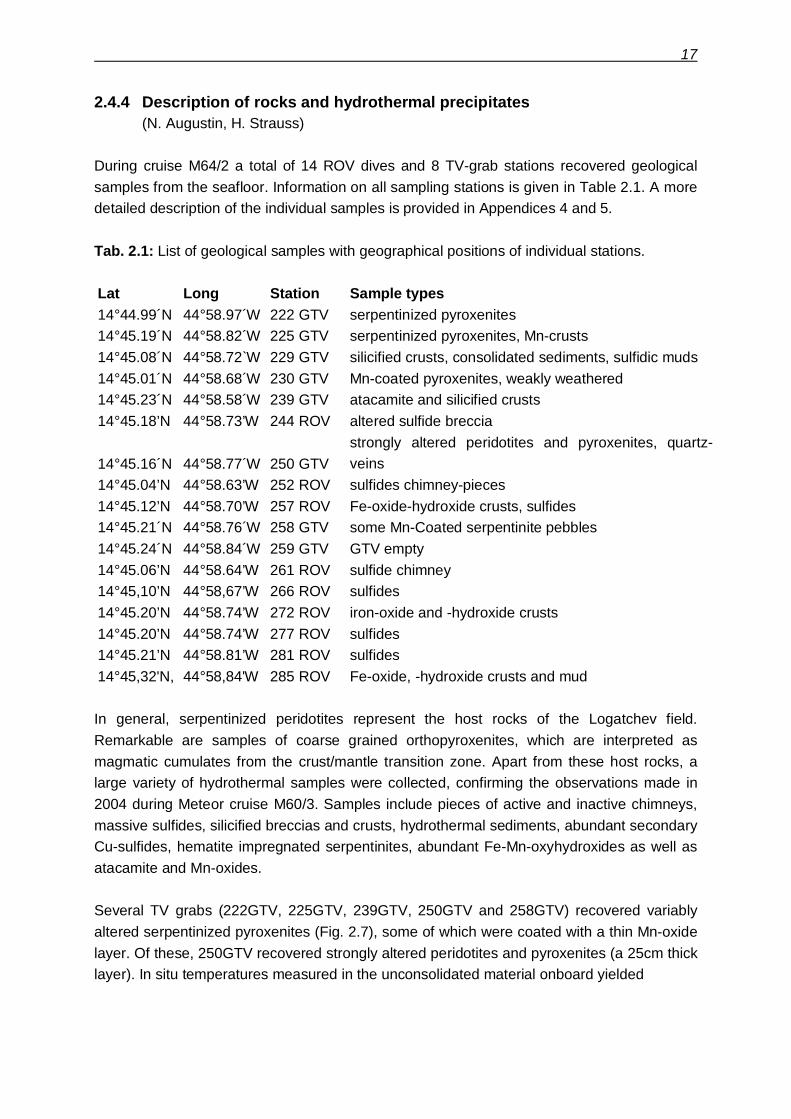
During cruise M64/2 a total of 14 ROV dives and 8 TV-grab stations recovered geologicalsamples from the seafloor. Information on all sampling stations is given in Table 2.1. A moredetailed description of the individual samples is provided in Appendices 4 and 5.
Tab. 2.1: List of geological samples with geographical positions of individual stations.
Lat Long Station Sample types14°44.99´N 44°58.97´W 222 GTV serpentinized pyroxenites14°45.19´N 44°58.82´W 225 GTV serpentinized pyroxenites, Mn-crusts14°45.08´N 44°58.72`W 229 GTV silicified crusts, consolidated sediments, sulfidic muds14°45.01´N 44°58.68´W 230 GTV Mn-coated pyroxenites, weakly weathered14°45.23´N 44°58.58´W 239 GTV atacamite and silicified crusts14°45.18’N 44°58.73’W 244 ROV altered sulfide breccia
14°45.16´N 44°58.77´W 250 GTVstrongly altered peridotites and pyroxenites, quartz-veins
14°45.04’N 44°58.63’W 252 ROV sulfides chimney-pieces14°45.12’N 44°58.70’W 257 ROV Fe-oxide-hydroxide crusts, sulfides14°45.21´N 44°58.76´W 258 GTV some Mn-Coated serpentinite pebbles14°45.24´N 44°58.84´W 259 GTV GTV empty14°45.06’N 44°58.64’W 261 ROV sulfide chimney14°45,10’N 44°58,67’W 266 ROV sulfides14°45.20’N 44°58.74’W 272 ROV iron-oxide and -hydroxide crusts14°45.20’N 44°58.74’W 277 ROV sulfides14°45.21’N 44°58.81’W 281 ROV sulfides14°45,32'N, 44°58,84'W 285 ROV Fe-oxide, -hydroxide crusts and mud
In general, serpentinized peridotites represent the host rocks of the Logatchev field.Remarkable are samples of coarse grained orthopyroxenites, which are interpreted asmagmatic cumulates from the crust/mantle transition zone. Apart from these host rocks, alarge variety of hydrothermal samples were collected, confirming the observations made in2004 during Meteor cruise M60/3. Samples include pieces of active and inactive chimneys,massive sulfides, silicified breccias and crusts, hydrothermal sediments, abundant secondaryCu-sulfides, hematite impregnated serpentinites, abundant Fe-Mn-oxyhydroxides as well asatacamite and Mn-oxides.
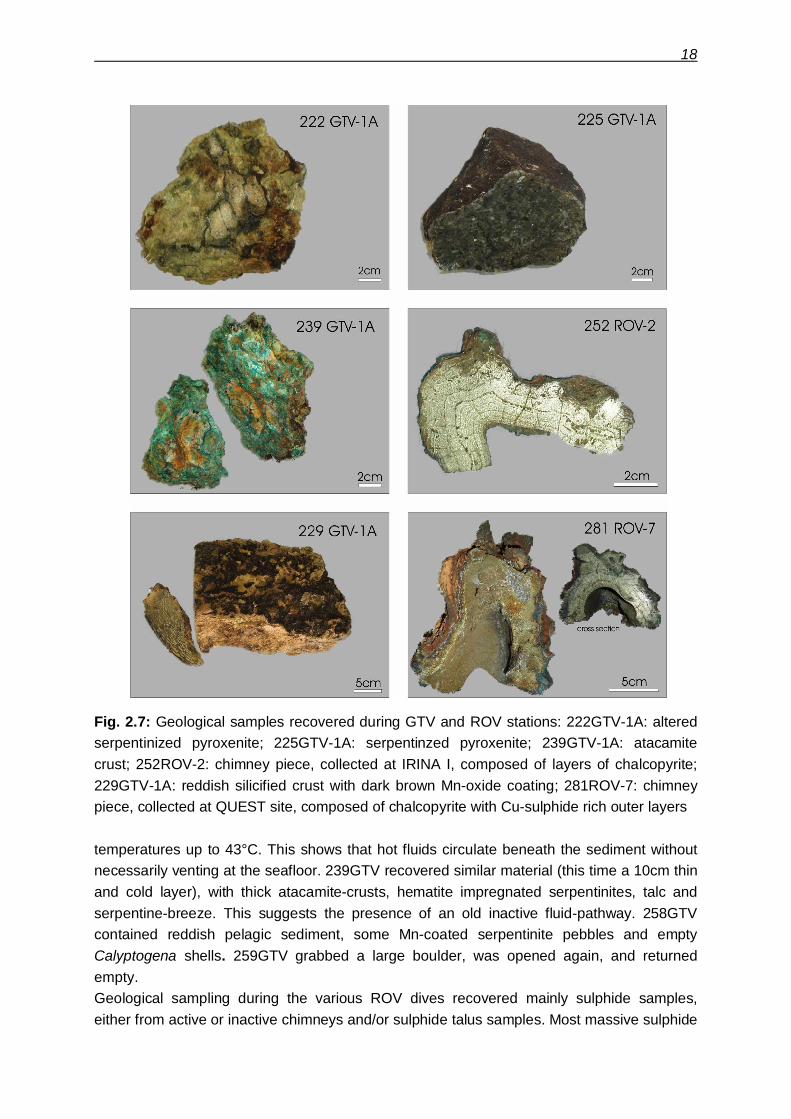
Several TV grabs (222GTV, 225GTV, 239GTV, 250GTV and 258GTV) recovered variablyaltered serpentinized pyroxenites (Fig. 2.7), some of which were coated with a thin Mn-oxidelayer. Of these, 250GTV recovered strongly altered peridotites and pyroxenites (a 25cm thicklayer). In situ temperatures measured in the unconsolidated material onboard yielded
18
Fig. 2.7: Geological samples recovered during GTV and ROV stations: 222GTV-1A: alteredserpentinized pyroxenite; 225GTV-1A: serpentinzed pyroxenite; 239GTV-1A: atacamitecrust; 252ROV-2: chimney piece, collected at IRINA I, composed of layers of chalcopyrite;229GTV-1A: reddish silicified crust with dark brown Mn-oxide coating; 281ROV-7: chimneypiece, collected at QUEST site, composed of chalcopyrite with Cu-sulphide rich outer layers
temperatures up to 43°C. This shows that hot fluids circulate beneath the sediment withoutnecessarily venting at the seafloor. 239GTV recovered similar material (this time a 10cm thinand cold layer), with thick atacamite-crusts, hematite impregnated serpentinites, talc andserpentine-breeze. This suggests the presence of an old inactive fluid-pathway. 258GTVcontained reddish pelagic sediment, some Mn-coated serpentinite pebbles and emptyCalyptogena shells. 259GTV grabbed a large boulder, was opened again, and returnedempty.Geological sampling during the various ROV dives recovered mainly sulphide samples,either from active or inactive chimneys and/or sulphide talus samples. Most massive sulphide
19
pieces were composed of chalcopyrite, sometimes displaying a distinctive layering. Othersamples comprise more porous chalcopyrite rich interior portions and clearly layered partstowards the outer rim. Occasionally, different fluid conduits could be recognized. The outerrim of all sulphide pieces was generally covered with a thin Fe-oxide coating. 252ROVrecovered a large number of pieces which, apart from chalcopyrite as major sulphide, containabundant colourful copper-rich sulphide minerals (Fig. 2.7). During 261ROV, a fresh sulphidepiece comprising largely chalcopyrite was collected from the Barad-Dur chimney at Site A.Further chimney pieces, composed mainly of chalcopyrite and showing individual orifices(Fig. 2.7), were recovered from IRINA II (277ROV) and the QUEST Site (281ROV).
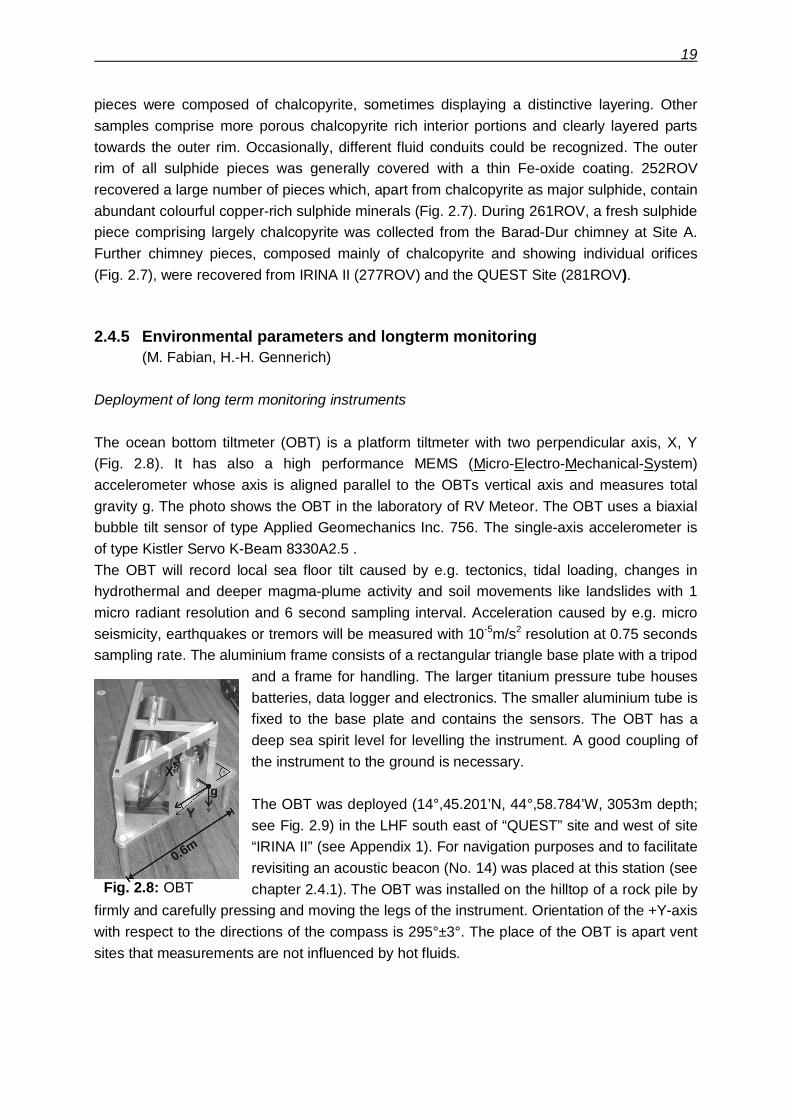
2.4.5 Environmental parameters and longterm monitoring(M. Fabian, H.-H. Gennerich)
Deployment of long term monitoring instruments
The ocean bottom tiltmeter (OBT) is a platform tiltmeter with two perpendicular axis, X, Y(Fig. 2.8). It has also a high performance MEMS (Micro-Electro-Mechanical-System)accelerometer whose axis is aligned parallel to the OBTs vertical axis and measures totalgravity g. The photo shows the OBT in the laboratory of RV Meteor. The OBT uses a biaxialbubble tilt sensor of type Applied Geomechanics Inc. 756. The single-axis accelerometer isof type Kistler Servo K-Beam 8330A2.5 .The OBT will record local sea floor tilt caused by e.g. tectonics, tidal loading, changes inhydrothermal and deeper magma-plume activity and soil movements like landslides with 1micro radiant resolution and 6 second sampling interval. Acceleration caused by e.g. microseismicity, earthquakes or tremors will be measured with 10-5m/s2 resolution at 0.75 secondssampling rate. The aluminium frame consists of a rectangular triangle base plate with a tripod
and a frame for handling. The larger titanium pressure tube housesbatteries, data logger and electronics. The smaller aluminium tube isfixed to the base plate and contains the sensors. The OBT has adeep sea spirit level for levelling the instrument. A good coupling ofthe instrument to the ground is necessary.
The OBT was deployed (14°,45.201’N, 44°,58.784’W, 3053m depth;see Fig. 2.9) in the LHF south east of “QUEST” site and west of site“IRINA II” (see Appendix 1). For navigation purposes and to facilitaterevisiting an acoustic beacon (No. 14) was placed at this station (seechapter 2.4.1). The OBT was installed on the hilltop of a rock pile by
firmly and carefully pressing and moving the legs of the instrument. Orientation of the +Y-axiswith respect to the directions of the compass is 295°±3°. The place of the OBT is apart ventsites that measurements are not influenced by hot fluids.
Fig. 2.8: OBT
20
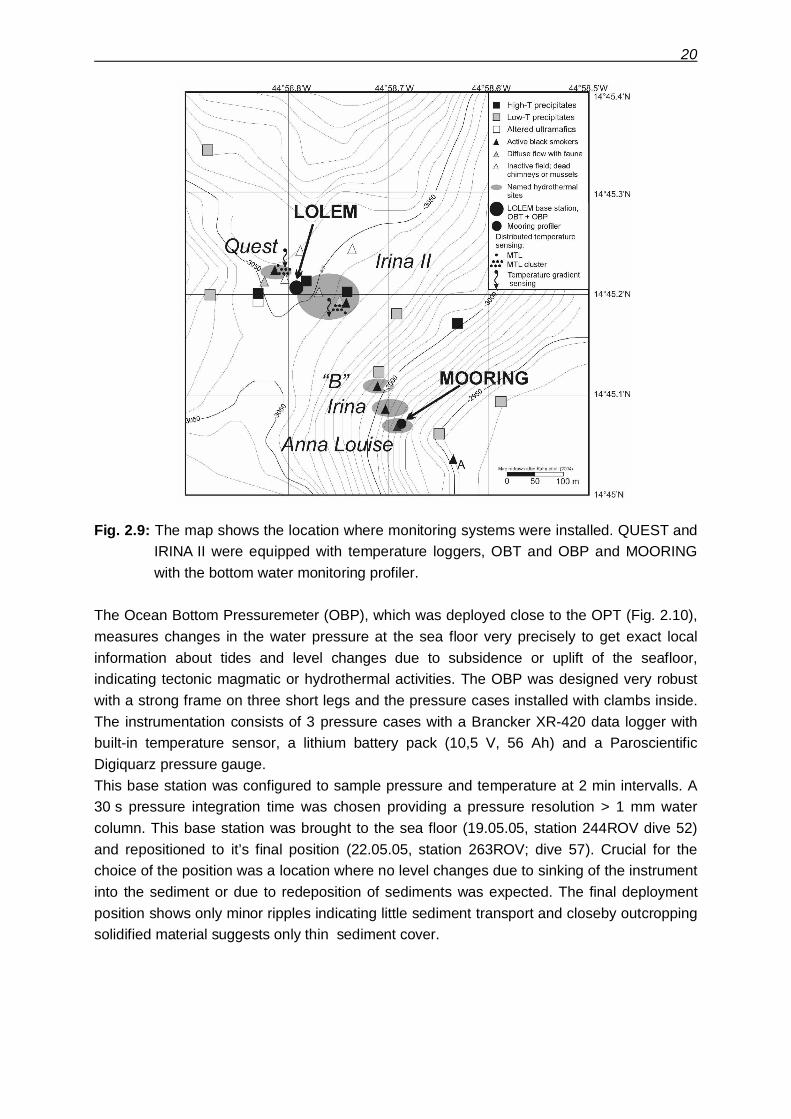
Fig. 2.9: The map shows the location where monitoring systems were installed. QUEST andIRINA II were equipped with temperature loggers, OBT and OBP and MOORINGwith the bottom water monitoring profiler.
The Ocean Bottom Pressuremeter (OBP), which was deployed close to the OPT (Fig. 2.10),measures changes in the water pressure at the sea floor very precisely to get exact localinformation about tides and level changes due to subsidence or uplift of the seafloor,indicating tectonic magmatic or hydrothermal activities. The OBP was designed very robustwith a strong frame on three short legs and the pressure cases installed with clambs inside.The instrumentation consists of 3 pressure cases with a Brancker XR-420 data logger withbuilt-in temperature sensor, a lithium battery pack (10,5 V, 56 Ah) and a ParoscientificDigiquarz pressure gauge.This base station was configured to sample pressure and temperature at 2 min intervalls. A30 s pressure integration time was chosen providing a pressure resolution > 1 mm watercolumn. This base station was brought to the sea floor (19.05.05, station 244ROV dive 52)and repositioned to it’s final position (22.05.05, station 263ROV; dive 57). Crucial for thechoice of the position was a location where no level changes due to sinking of the instrumentinto the sediment or due to redeposition of sediments was expected. The final deploymentposition shows only minor ripples indicating little sediment transport and closeby outcroppingsolidified material suggests only thin sediment cover.
21
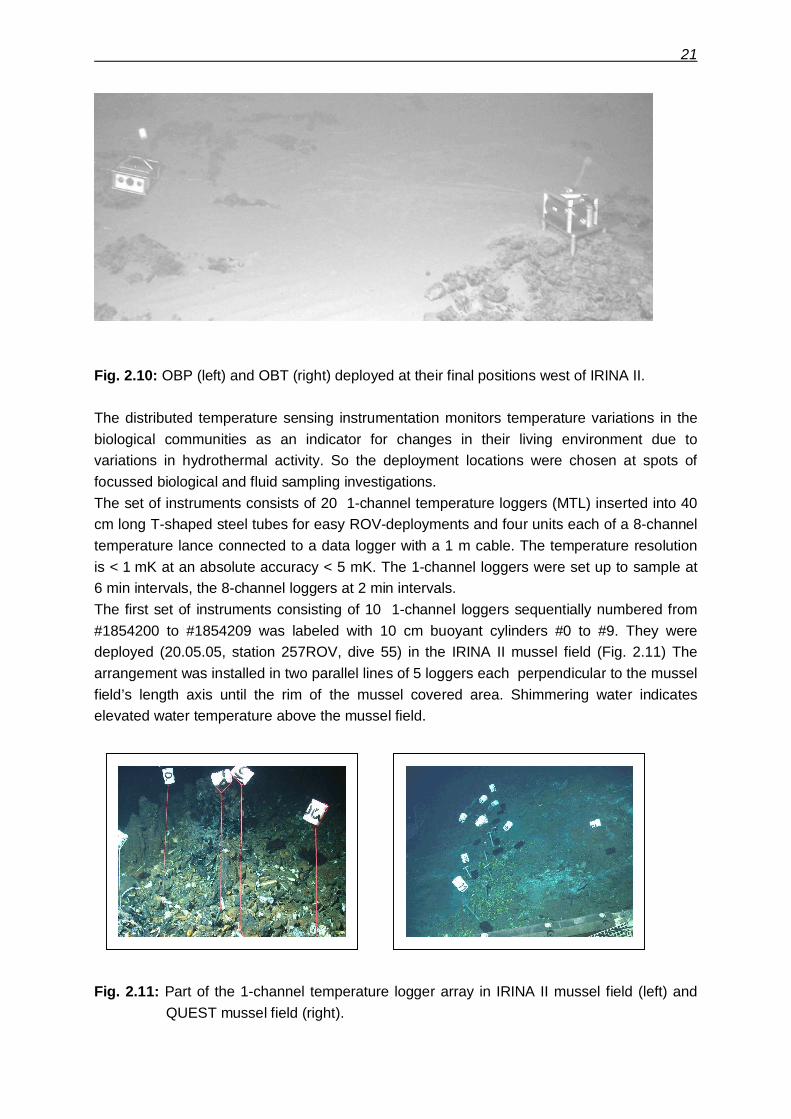
Fig. 2.10: OBP (left) and OBT (right) deployed at their final positions west of IRINA II.
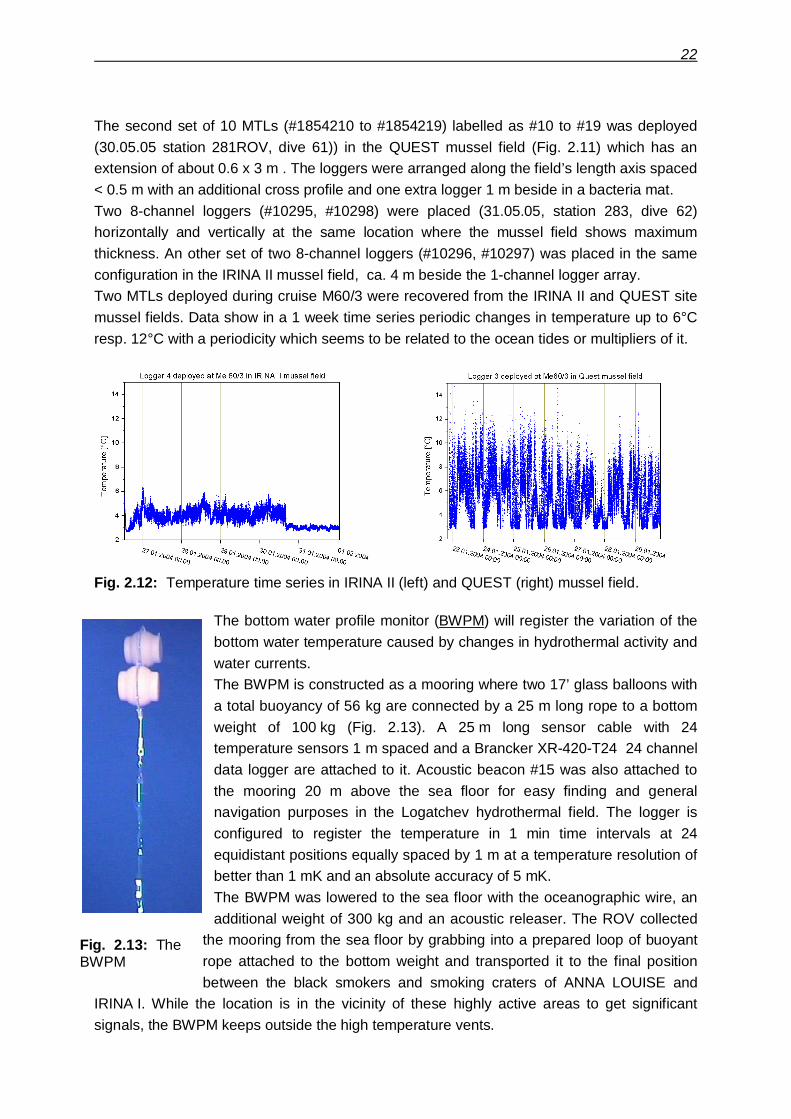
The distributed temperature sensing instrumentation monitors temperature variations in thebiological communities as an indicator for changes in their living environment due tovariations in hydrothermal activity. So the deployment locations were chosen at spots offocussed biological and fluid sampling investigations.The set of instruments consists of 20 1-channel temperature loggers (MTL) inserted into 40cm long T-shaped steel tubes for easy ROV-deployments and four units each of a 8-channeltemperature lance connected to a data logger with a 1 m cable. The temperature resolutionis < 1 mK at an absolute accuracy < 5 mK. The 1-channel loggers were set up to sample at6 min intervals, the 8-channel loggers at 2 min intervals.The first set of instruments consisting of 10 1-channel loggers sequentially numbered from#1854200 to #1854209 was labeled with 10 cm buoyant cylinders #0 to #9. They weredeployed (20.05.05, station 257ROV, dive 55) in the IRINA II mussel field (Fig. 2.11) Thearrangement was installed in two parallel lines of 5 loggers each perpendicular to the musselfield’s length axis until the rim of the mussel covered area. Shimmering water indicateselevated water temperature above the mussel field.
Fig. 2.11: Part of the 1-channel temperature logger array in IRINA II mussel field (left) andQUEST mussel field (right).
22
The second set of 10 MTLs (#1854210 to #1854219) labelled as #10 to #19 was deployed(30.05.05 station 281ROV, dive 61)) in the QUEST mussel field (Fig. 2.11) which has anextension of about 0.6 x 3 m . The loggers were arranged along the field’s length axis spaced< 0.5 m with an additional cross profile and one extra logger 1 m beside in a bacteria mat.Two 8-channel loggers (#10295, #10298) were placed (31.05.05, station 283, dive 62)horizontally and vertically at the same location where the mussel field shows maximumthickness. An other set of two 8-channel loggers (#10296, #10297) was placed in the sameconfiguration in the IRINA II mussel field, ca. 4 m beside the 1-channel logger array.Two MTLs deployed during cruise M60/3 were recovered from the IRINA II and QUEST sitemussel fields. Data show in a 1 week time series periodic changes in temperature up to 6°Cresp. 12°C with a periodicity which seems to be related to the ocean tides or multipliers of it.
Fig. 2.12: Temperature time series in IRINA II (left) and QUEST (right) mussel field.
The bottom water profile monitor (BWPM) will register the variation of thebottom water temperature caused by changes in hydrothermal activity andwater currents.The BWPM is constructed as a mooring where two 17’ glass balloons witha total buoyancy of 56 kg are connected by a 25 m long rope to a bottomweight of 100 kg (Fig. 2.13). A 25 m long sensor cable with 24temperature sensors 1 m spaced and a Brancker XR-420-T24 24 channeldata logger are attached to it. Acoustic beacon #15 was also attached tothe mooring 20 m above the sea floor for easy finding and generalnavigation purposes in the Logatchev hydrothermal field. The logger isconfigured to register the temperature in 1 min time intervals at 24equidistant positions equally spaced by 1 m at a temperature resolution ofbetter than 1 mK and an absolute accuracy of 5 mK.The BWPM was lowered to the sea floor with the oceanographic wire, anadditional weight of 300 kg and an acoustic releaser. The ROV collected
the mooring from the sea floor by grabbing into a prepared loop of buoyantrope attached to the bottom weight and transported it to the final positionbetween the black smokers and smoking craters of ANNA LOUISE and
IRINA I. While the location is in the vicinity of these highly active areas to get significantsignals, the BWPM keeps outside the high temperature vents.
Fig. 2.13: TheBWPM
23
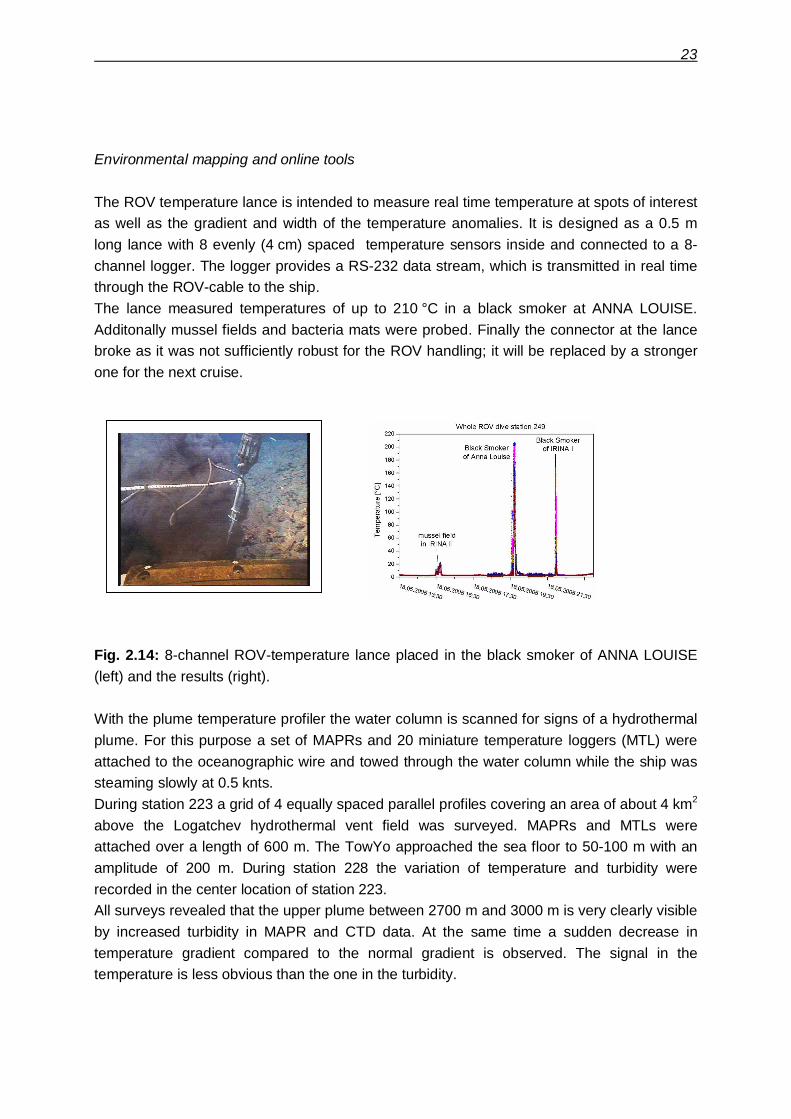
Environmental mapping and online tools
The ROV temperature lance is intended to measure real time temperature at spots of interestas well as the gradient and width of the temperature anomalies. It is designed as a 0.5 mlong lance with 8 evenly (4 cm) spaced temperature sensors inside and connected to a 8-channel logger. The logger provides a RS-232 data stream, which is transmitted in real timethrough the ROV-cable to the ship.The lance measured temperatures of up to 210 °C in a black smoker at ANNA LOUISE.Additonally mussel fields and bacteria mats were probed. Finally the connector at the lancebroke as it was not sufficiently robust for the ROV handling; it will be replaced by a strongerone for the next cruise.
Fig. 2.14: 8-channel ROV-temperature lance placed in the black smoker of ANNA LOUISE(left) and the results (right).
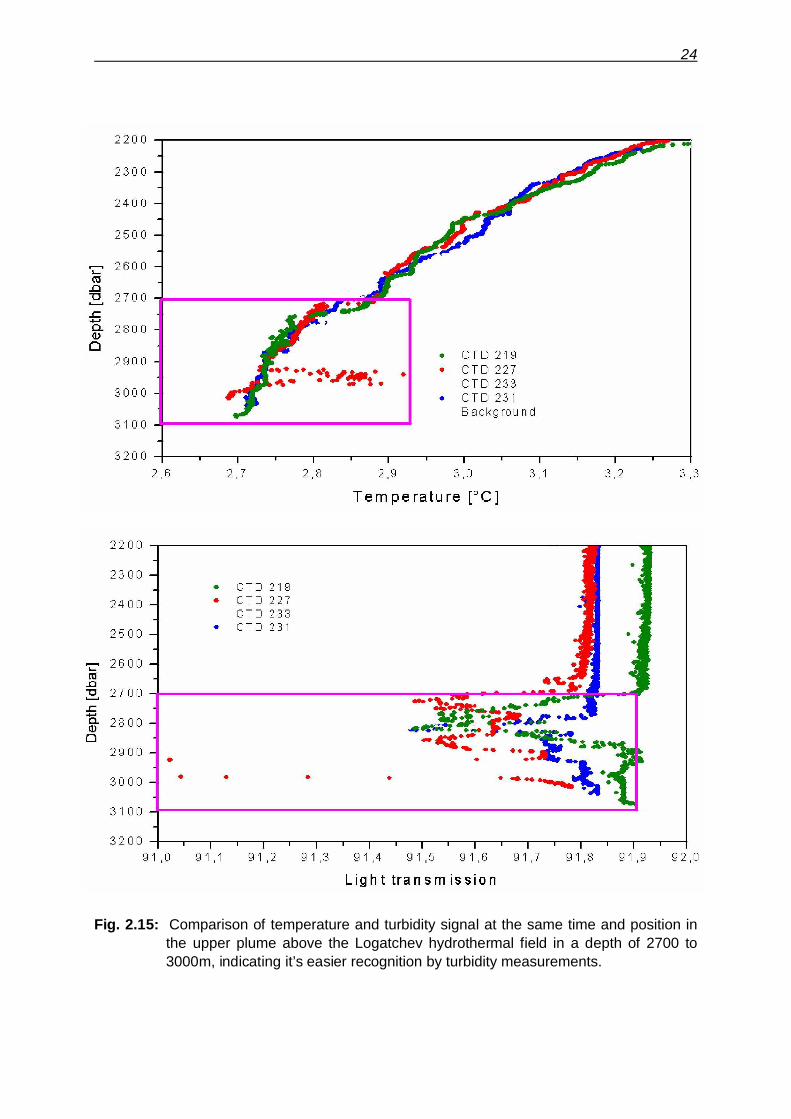
With the plume temperature profiler the water column is scanned for signs of a hydrothermalplume. For this purpose a set of MAPRs and 20 miniature temperature loggers (MTL) wereattached to the oceanographic wire and towed through the water column while the ship wassteaming slowly at 0.5 knts.During station 223 a grid of 4 equally spaced parallel profiles covering an area of about 4 km2
above the Logatchev hydrothermal vent field was surveyed. MAPRs and MTLs wereattached over a length of 600 m. The TowYo approached the sea floor to 50-100 m with anamplitude of 200 m. During station 228 the variation of temperature and turbidity wererecorded in the center location of station 223.All surveys revealed that the upper plume between 2700 m and 3000 m is very clearly visibleby increased turbidity in MAPR and CTD data. At the same time a sudden decrease intemperature gradient compared to the normal gradient is observed. The signal in thetemperature is less obvious than the one in the turbidity.
24
Fig. 2.15: Comparison of temperature and turbidity signal at the same time and position inthe upper plume above the Logatchev hydrothermal field in a depth of 2700 to3000m, indicating it’s easier recognition by turbidity measurements.
25
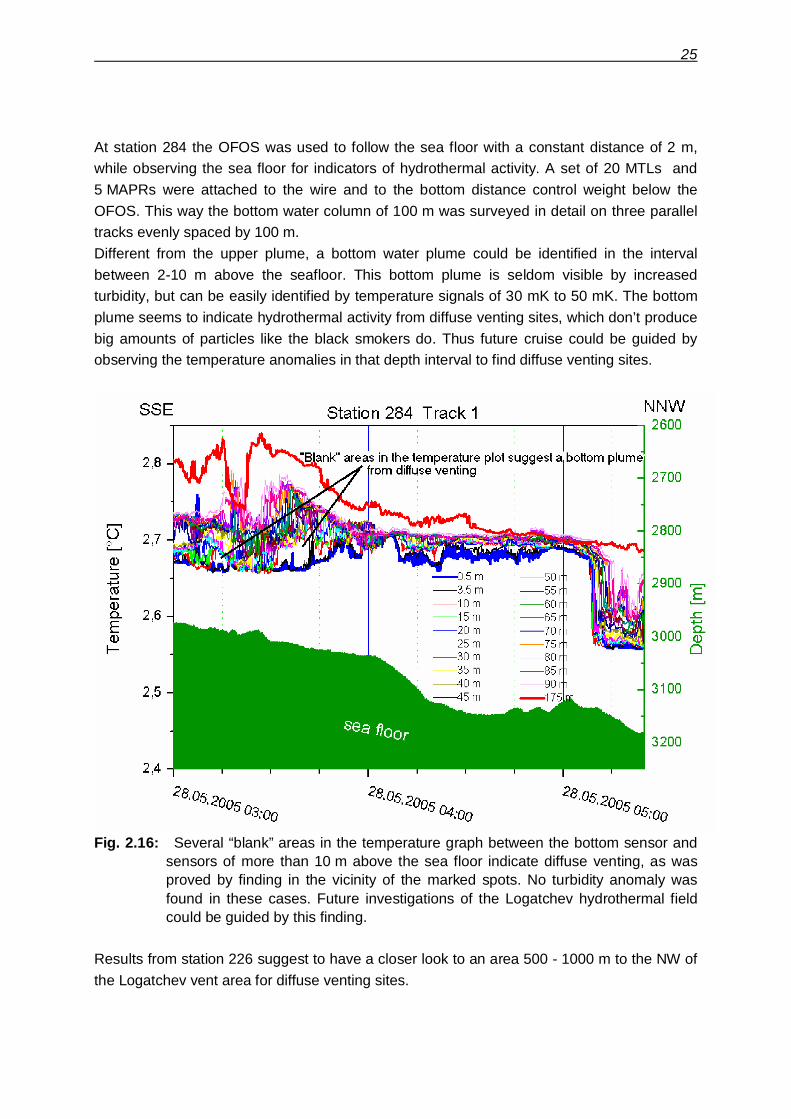
At station 284 the OFOS was used to follow the sea floor with a constant distance of 2 m,while observing the sea floor for indicators of hydrothermal activity. A set of 20 MTLs and5 MAPRs were attached to the wire and to the bottom distance control weight below theOFOS. This way the bottom water column of 100 m was surveyed in detail on three paralleltracks evenly spaced by 100 m.Different from the upper plume, a bottom water plume could be identified in the intervalbetween 2-10 m above the seafloor. This bottom plume is seldom visible by increasedturbidity, but can be easily identified by temperature signals of 30 mK to 50 mK. The bottomplume seems to indicate hydrothermal activity from diffuse venting sites, which don’t producebig amounts of particles like the black smokers do. Thus future cruise could be guided byobserving the temperature anomalies in that depth interval to find diffuse venting sites.
Fig. 2.16: Several “blank” areas in the temperature graph between the bottom sensor andsensors of more than 10 m above the sea floor indicate diffuse venting, as wasproved by finding in the vicinity of the marked spots. No turbidity anomaly wasfound in these cases. Future investigations of the Logatchev hydrothermal fieldcould be guided by this finding.
Results from station 226 suggest to have a closer look to an area 500 - 1000 m to the NW ofthe Logatchev vent area for diffuse venting sites.
26
More about the physical observations in the water column can be found in a separate section“plume mapping” in this report, because the operations of CTD and MAPR were conducted inclose collaboration with scientists from the gas and fluid chemistry group.
2.4.6 Physico-chemical characterization of the Logatchev hydrothermal field
2.4.6.1 Gas chemistry (T. Pape, G. Schroll)
During a previous cruise to the Logatchev hydrothermal venting site with R/V METEOR in2004 (M60/3) comprehensive analysis was performed for the gas chemical characterizationof hydrothermal fluids and plumes. This work yielded gas concentrations and stable isotopesignatures of CH4 and H2 of numerous fluids sampled at distinct emanation points.Considerable differences in absolute and relative gas concentrations, and fluid temperatures(calculated from stable isotope composition of H2) between the distinct fluids could be shown(Kuhn et al., 2004). Water column investigations revealed a distribution of hydrothermalsignatures covering the water depth range from 2.500 to 3.000 m. However, due to a limitednumber of hydrocasts these data did not allow for a detailed characterization of the horizontaldistribution of the entire hydrothermal plume.
Main objectives of the gas chemistry analysis performed during M64/2 were to determinethe composition of distinct fluids and the vertical and horizontal extension of the gas plume inthe water column above the Logatchev field, both with emphasis on variations compared tothe earlier investigation. For this purpose, samples of hydrothermal fluids and plumes wererecovered during several ROV dives and CTD stations and analysed for the concentrationsof the main reactive gases hydrogen and methane. These investigations aimed to detect thegas chemical cyclicity of the Logatchev hydrothermal vent system. Reported here arepreliminary results of CTD-profiling and gas analysis.
Samples and methods
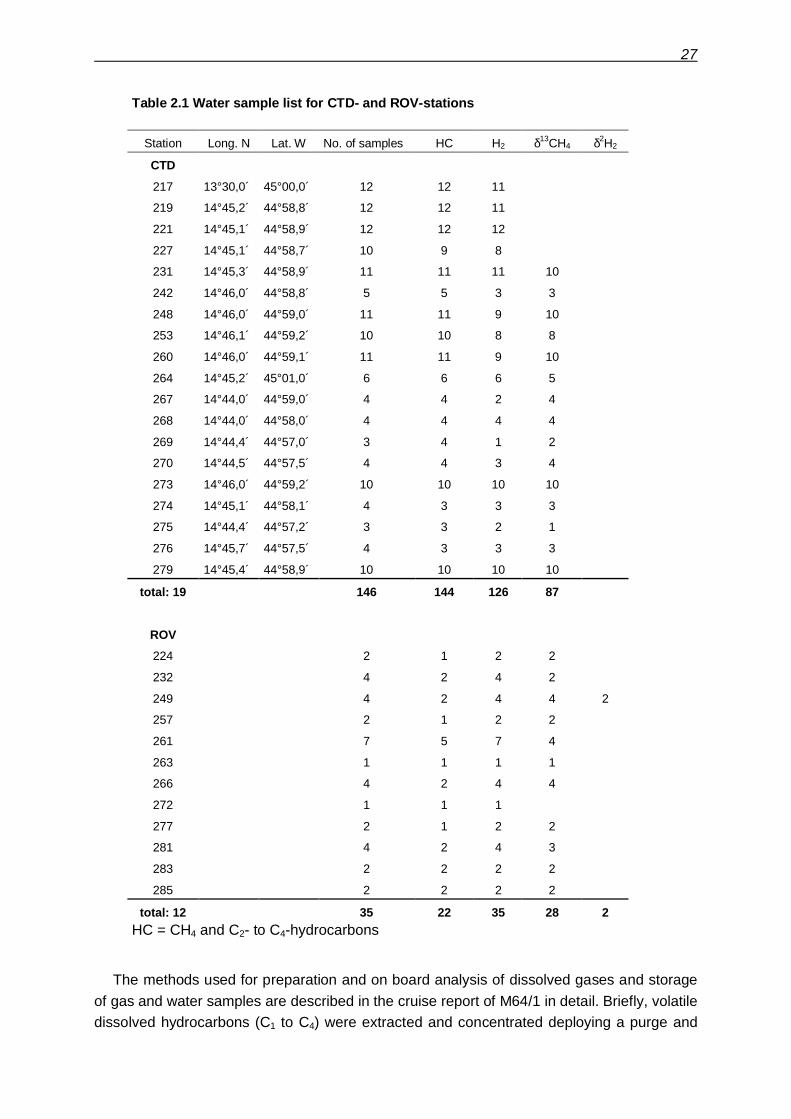
During M64/2 34 CTD stations were conducted for measurements of conductivity,temperature, salinity, and light transmission of the water column. A map illustrating thepositions of the stations is given in chapter 2.4.6.1. CTD data were recorded for the entirewater column using a SEABIRD CTD Type 911 equipped with a light transmission sensor. At19 stations water samples were taken with a rosette of 23 10 L Niskin bottles for on boardanalysis of concentrations of H2 and CH4. Fluid and near-bottom water samples wereobtained by a fluid sampling system or Niskin bottles during 12 ROV dives. Subsampleswere stored for onshore measurements of stable carbon isotopic compositions of CH4 andH2. In total, 146 samples from the water column and 35 vent associated water and fluidsamples were recovered for analyses of dissolved gases (Table 2.1).
27
Table 2.1 Water sample list for CTD- and ROV-stations
Station Long. N Lat. W No. of samples HC H2 δ13CH4 δ2H2
CTD
217 13°30,0´ 45°00,0´ 12 12 11
219 14°45,2´ 44°58,8´ 12 12 11
221 14°45,1´ 44°58,9´ 12 12 12
227 14°45,1´ 44°58,7´ 10 9 8
231 14°45,3´ 44°58,9´ 11 11 11 10
242 14°46,0´ 44°58,8´ 5 5 3 3
248 14°46,0´ 44°59,0´ 11 11 9 10
253 14°46,1´ 44°59,2´ 10 10 8 8
260 14°46,0´ 44°59,1´ 11 11 9 10
264 14°45,2´ 45°01,0´ 6 6 6 5
267 14°44,0´ 44°59,0´ 4 4 2 4
268 14°44,0´ 44°58,0´ 4 4 4 4
269 14°44,4´ 44°57,0´ 3 4 1 2
270 14°44,5´ 44°57,5´ 4 4 3 4
273 14°46,0´ 44°59,2´ 10 10 10 10
274 14°45,1´ 44°58,1´ 4 3 3 3
275 14°44,4´ 44°57,2´ 3 3 2 1
276 14°45,7´ 44°57,5´ 4 3 3 3
279 14°45,4´ 44°58,9´ 10 10 10 10
total: 19 146 144 126 87
ROV
224 2 1 2 2
232 4 2 4 2
249 4 2 4 4 2
257 2 1 2 2
261 7 5 7 4
263 1 1 1 1
266 4 2 4 4
272 1 1 1
277 2 1 2 2
281 4 2 4 3
283 2 2 2 2
285 2 2 2 2
total: 12 35 22 35 28 2HC = CH4 and C2- to C4-hydrocarbons
The methods used for preparation and on board analysis of dissolved gases and storageof gas and water samples are described in the cruise report of M64/1 in detail. Briefly, volatiledissolved hydrocarbons (C1 to C4) were extracted and concentrated deploying a purge and
28
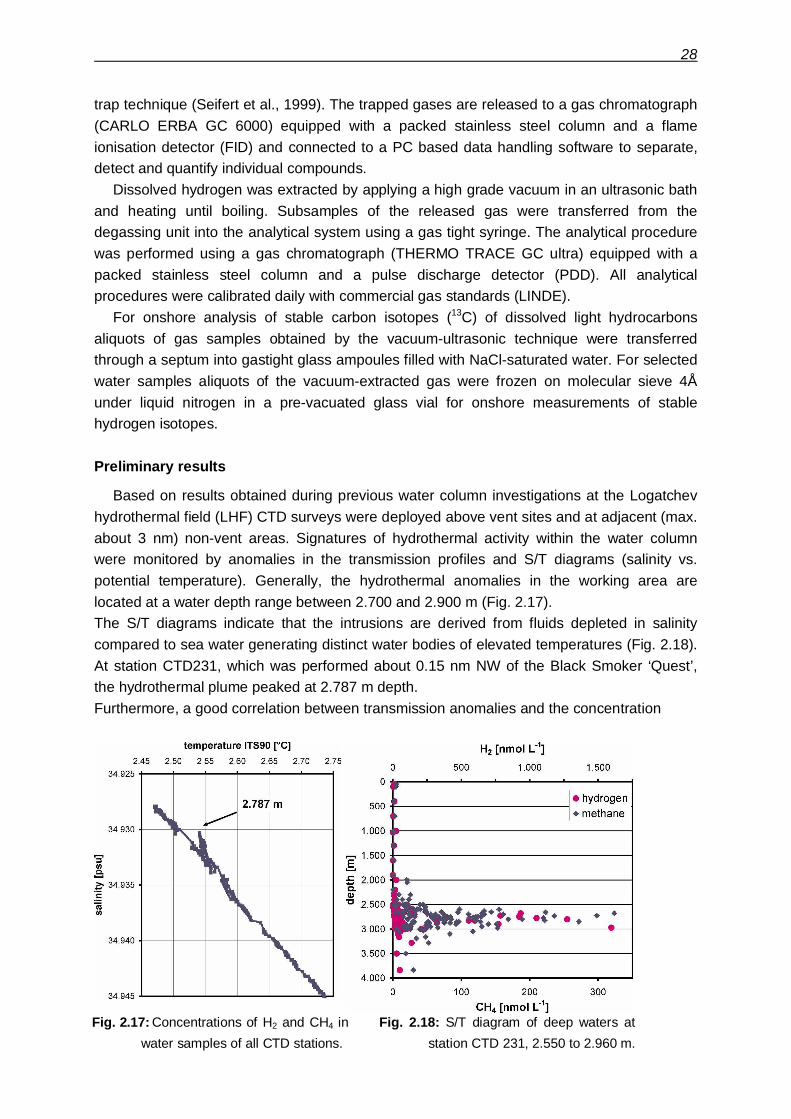
Fig. 2.17: Concentrations of H2 and CH4 inwater samples of all CTD stations.
trap technique (Seifert et al., 1999). The trapped gases are released to a gas chromatograph(CARLO ERBA GC 6000) equipped with a packed stainless steel column and a flameionisation detector (FID) and connected to a PC based data handling software to separate,detect and quantify individual compounds.
Dissolved hydrogen was extracted by applying a high grade vacuum in an ultrasonic bathand heating until boiling. Subsamples of the released gas were transferred from thedegassing unit into the analytical system using a gas tight syringe. The analytical procedurewas performed using a gas chromatograph (THERMO TRACE GC ultra) equipped with apacked stainless steel column and a pulse discharge detector (PDD). All analyticalprocedures were calibrated daily with commercial gas standards (LINDE).
For onshore analysis of stable carbon isotopes (13C) of dissolved light hydrocarbonsaliquots of gas samples obtained by the vacuum-ultrasonic technique were transferredthrough a septum into gastight glass ampoules filled with NaCl-saturated water. For selectedwater samples aliquots of the vacuum-extracted gas were frozen on molecular sieve 4Åunder liquid nitrogen in a pre-vacuated glass vial for onshore measurements of stablehydrogen isotopes.
Preliminary results
Based on results obtained during previous water column investigations at the Logatchevhydrothermal field (LHF) CTD surveys were deployed above vent sites and at adjacent (max.about 3 nm) non-vent areas. Signatures of hydrothermal activity within the water columnwere monitored by anomalies in the transmission profiles and S/T diagrams (salinity vs.potential temperature). Generally, the hydrothermal anomalies in the working area arelocated at a water depth range between 2.700 and 2.900 m (Fig. 2.17).The S/T diagrams indicate that the intrusions are derived from fluids depleted in salinitycompared to sea water generating distinct water bodies of elevated temperatures (Fig. 2.18).At station CTD231, which was performed about 0.15 nm NW of the Black Smoker ‘Quest’,the hydrothermal plume peaked at 2.787 m depth.Furthermore, a good correlation between transmission anomalies and the concentration
Fig. 2.18: S/T diagram of deep waters atstation CTD 231, 2.550 to 2.960 m.
29
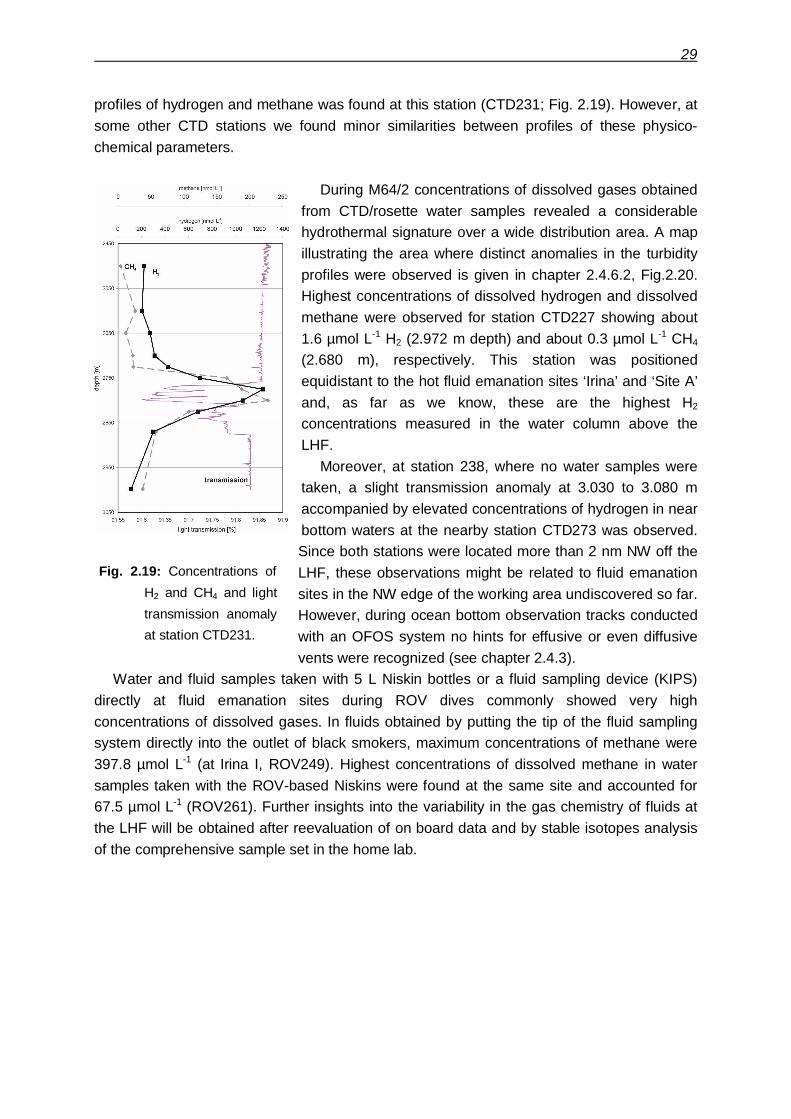
profiles of hydrogen and methane was found at this station (CTD231; Fig. 2.19). However, atsome other CTD stations we found minor similarities between profiles of these physico-chemical parameters.
During M64/2 concentrations of dissolved gases obtainedfrom CTD/rosette water samples revealed a considerablehydrothermal signature over a wide distribution area. A mapillustrating the area where distinct anomalies in the turbidityprofiles were observed is given in chapter 2.4.6.2, Fig.2.20.Highest concentrations of dissolved hydrogen and dissolvedmethane were observed for station CTD227 showing about1.6 µmol L-1 H2 (2.972 m depth) and about 0.3 µmol L-1 CH4
(2.680 m), respectively. This station was positionedequidistant to the hot fluid emanation sites ‘Irina’ and ‘Site A’and, as far as we know, these are the highest H2
concentrations measured in the water column above theLHF.
Moreover, at station 238, where no water samples weretaken, a slight transmission anomaly at 3.030 to 3.080 maccompanied by elevated concentrations of hydrogen in nearbottom waters at the nearby station CTD273 was observed.Since both stations were located more than 2 nm NW off theLHF, these observations might be related to fluid emanationsites in the NW edge of the working area undiscovered so far.However, during ocean bottom observation tracks conductedwith an OFOS system no hints for effusive or even diffusivevents were recognized (see chapter 2.4.3).
Water and fluid samples taken with 5 L Niskin bottles or a fluid sampling device (KIPS)directly at fluid emanation sites during ROV dives commonly showed very highconcentrations of dissolved gases. In fluids obtained by putting the tip of the fluid samplingsystem directly into the outlet of black smokers, maximum concentrations of methane were397.8 µmol L-1 (at Irina I, ROV249). Highest concentrations of dissolved methane in watersamples taken with the ROV-based Niskins were found at the same site and accounted for67.5 µmol L-1 (ROV261). Further insights into the variability in the gas chemistry of fluids atthe LHF will be obtained after reevaluation of on board data and by stable isotopes analysisof the comprehensive sample set in the home lab.
Fig. 2.19: Concentrations ofH2 and CH4 and lighttransmission anomalyat station CTD231.
30
2.4.6.2 Spatial distribution of the hydrothermal signature in the water column(H. Marbler, T. Pape, H.-H. Gennerich, G. Schroll, S. Weber)
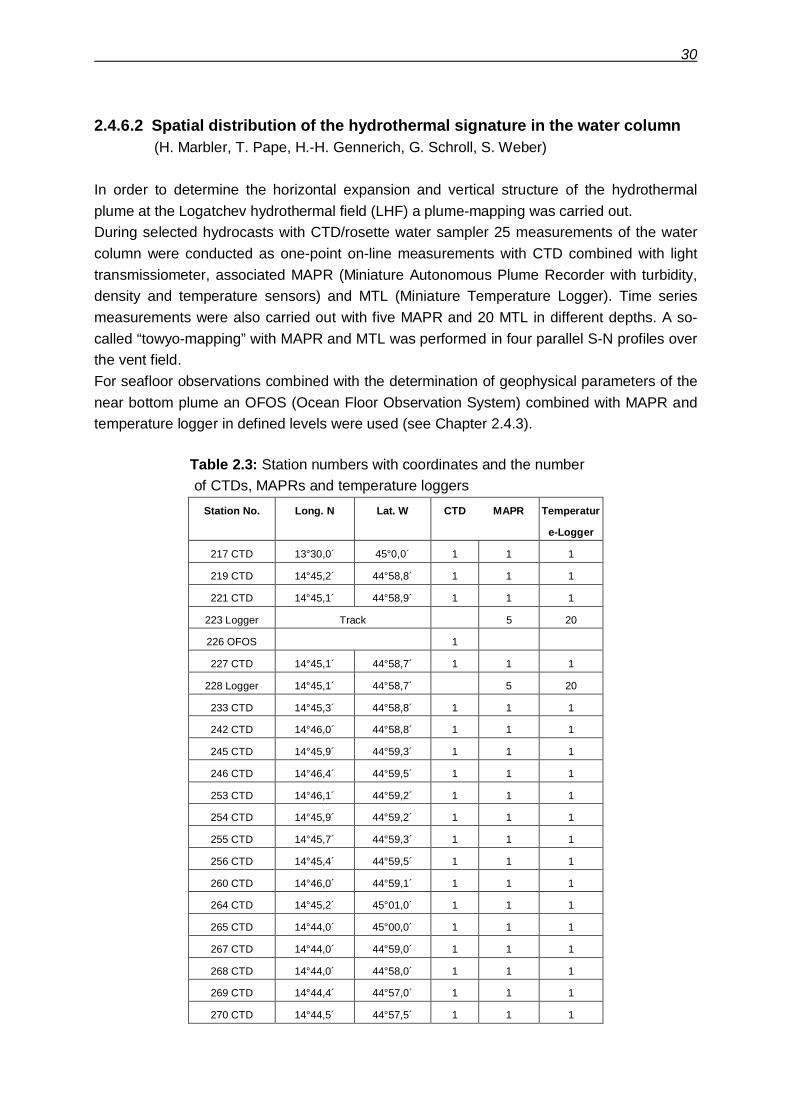
In order to determine the horizontal expansion and vertical structure of the hydrothermalplume at the Logatchev hydrothermal field (LHF) a plume-mapping was carried out.During selected hydrocasts with CTD/rosette water sampler 25 measurements of the watercolumn were conducted as one-point on-line measurements with CTD combined with lighttransmissiometer, associated MAPR (Miniature Autonomous Plume Recorder with turbidity,density and temperature sensors) and MTL (Miniature Temperature Logger). Time seriesmeasurements were also carried out with five MAPR and 20 MTL in different depths. A so-called “towyo-mapping” with MAPR and MTL was performed in four parallel S-N profiles overthe vent field.For seafloor observations combined with the determination of geophysical parameters of thenear bottom plume an OFOS (Ocean Floor Observation System) combined with MAPR andtemperature logger in defined levels were used (see Chapter 2.4.3).
Table 2.3: Station numbers with coordinates and the number of CTDs, MAPRs and temperature loggers
Station No. Long. N Lat. W CTD MAPR Temperatur
e-Logger
217 CTD 13°30,0´ 45°0,0´ 1 1 1
219 CTD 14°45,2´ 44°58,8´ 1 1 1
221 CTD 14°45,1´ 44°58,9´ 1 1 1
223 Logger Track 5 20
226 OFOS 1
227 CTD 14°45,1´ 44°58,7´ 1 1 1
228 Logger 14°45,1´ 44°58,7´ 5 20
233 CTD 14°45,3´ 44°58,8´ 1 1 1
242 CTD 14°46,0´ 44°58,8´ 1 1 1
245 CTD 14°45,9´ 44°59,3´ 1 1 1
246 CTD 14°46,4´ 44°59,5´ 1 1 1
253 CTD 14°46,1´ 44°59,2´ 1 1 1
254 CTD 14°45,9´ 44°59,2´ 1 1 1
255 CTD 14°45,7´ 44°59,3´ 1 1 1
256 CTD 14°45,4´ 44°59,5´ 1 1 1
260 CTD 14°46,0´ 44°59,1´ 1 1 1
264 CTD 14°45,2´ 45°01,0´ 1 1 1
265 CTD 14°44,0´ 45°00,0´ 1 1 1
267 CTD 14°44,0´ 44°59,0´ 1 1 1
268 CTD 14°44,0´ 44°58,0´ 1 1 1
269 CTD 14°44,4´ 44°57,0´ 1 1 1
270 CTD 14°44,5´ 44°57,5´ 1 1 1
31
Station No. Long. N Lat. W CTD MAPR Temperatur
e-Logger
273 CTD 14°46,0´ 44°59,2´ 1 1 1
274 CTD 14°45,1´ 44°58,1´ 1 1 1
275 CTD 14°44,4´ 44°57,2´ 1 1 1
276 CTD 14°45,7´ 44°57,5´ 1 1 1
278 OFOS 1
279 CTD 14°45,4´ 44°58,9´ 1 1 1
280 CTD 14°47,0´ 45°00,0´ 1 1 1
284 OFOS Track 1 5 20
Preliminary Results
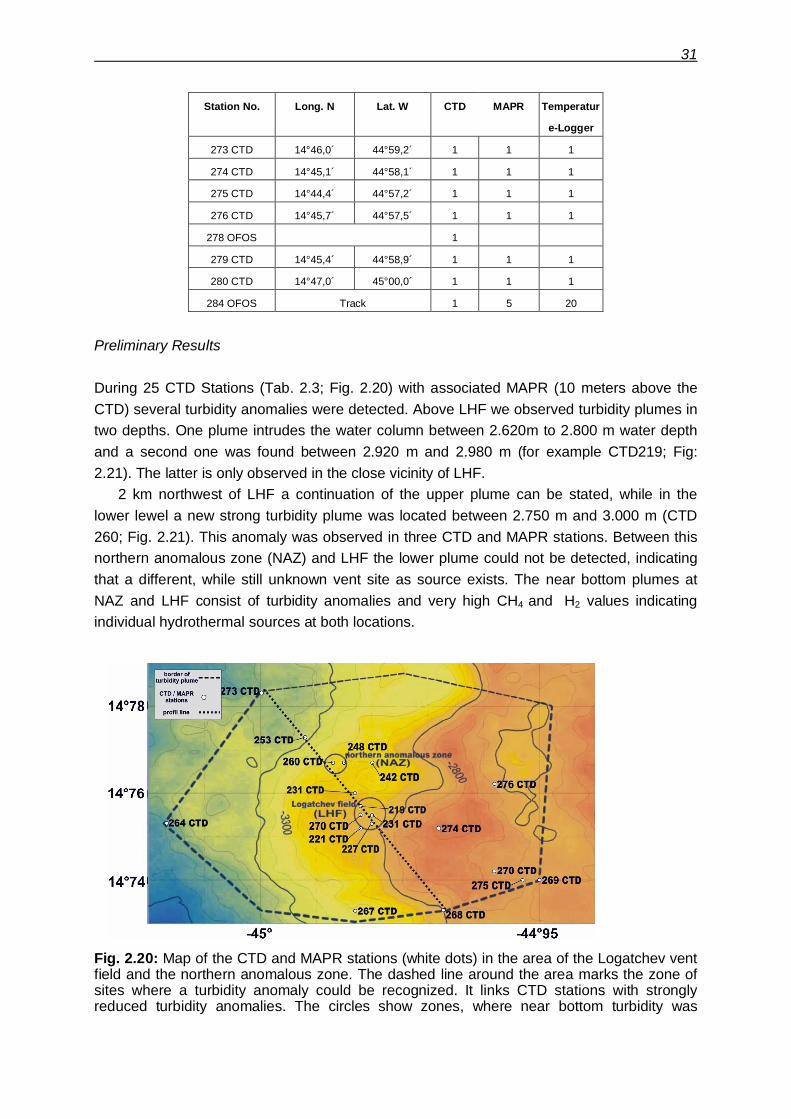
During 25 CTD Stations (Tab. 2.3; Fig. 2.20) with associated MAPR (10 meters above theCTD) several turbidity anomalies were detected. Above LHF we observed turbidity plumes intwo depths. One plume intrudes the water column between 2.620m to 2.800 m water depthand a second one was found between 2.920 m and 2.980 m (for example CTD219; Fig:2.21). The latter is only observed in the close vicinity of LHF.
2 km northwest of LHF a continuation of the upper plume can be stated, while in thelower lewel a new strong turbidity plume was located between 2.750 m and 3.000 m (CTD260; Fig. 2.21). This anomaly was observed in three CTD and MAPR stations. Between thisnorthern anomalous zone (NAZ) and LHF the lower plume could not be detected, indicatingthat a different, while still unknown vent site as source exists. The near bottom plumes atNAZ and LHF consist of turbidity anomalies and very high CH4 and H2 values indicatingindividual hydrothermal sources at both locations.
Fig. 2.20: Map of the CTD and MAPR stations (white dots) in the area of the Logatchev ventfield and the northern anomalous zone. The dashed line around the area marks the zone ofsites where a turbidity anomaly could be recognized. It links CTD stations with stronglyreduced turbidity anomalies. The circles show zones, where near bottom turbidity was
32
observed. The dotted line through these zones marks the profile of the 2D- plumerepresentation (figure 2.22).
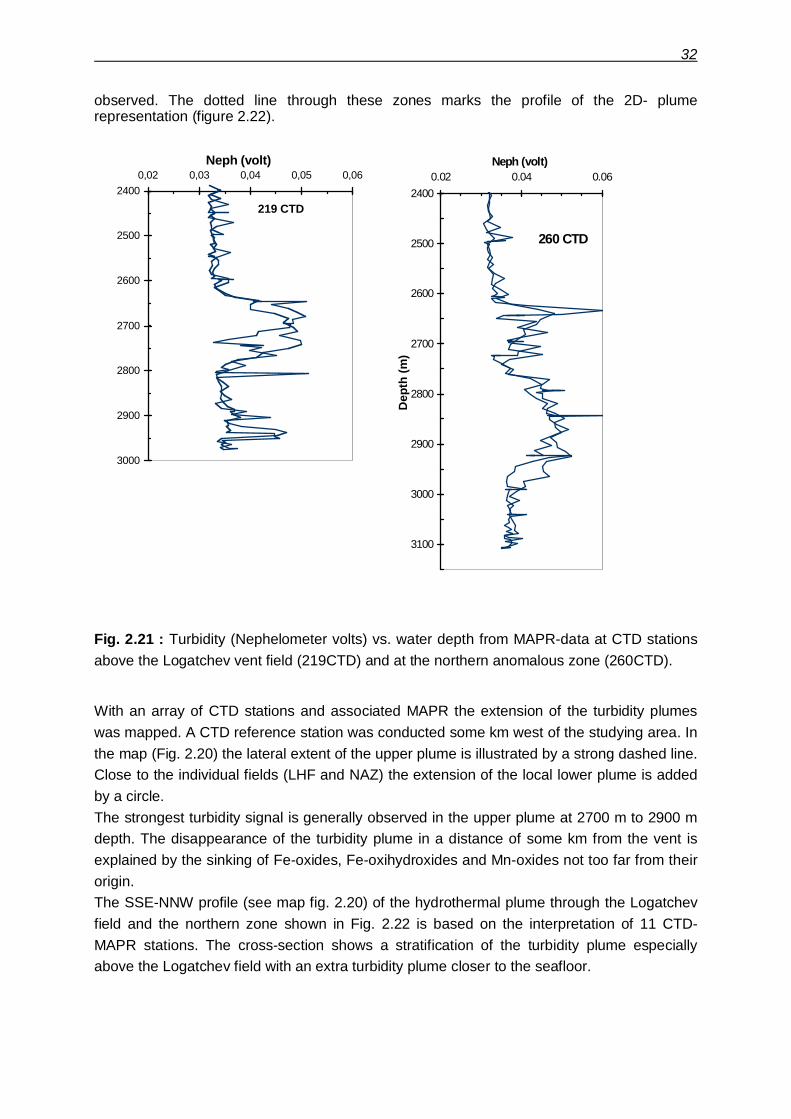
Fig. 2.21 : Turbidity (Nephelometer volts) vs. water depth from MAPR-data at CTD stationsabove the Logatchev vent field (219CTD) and at the northern anomalous zone (260CTD).
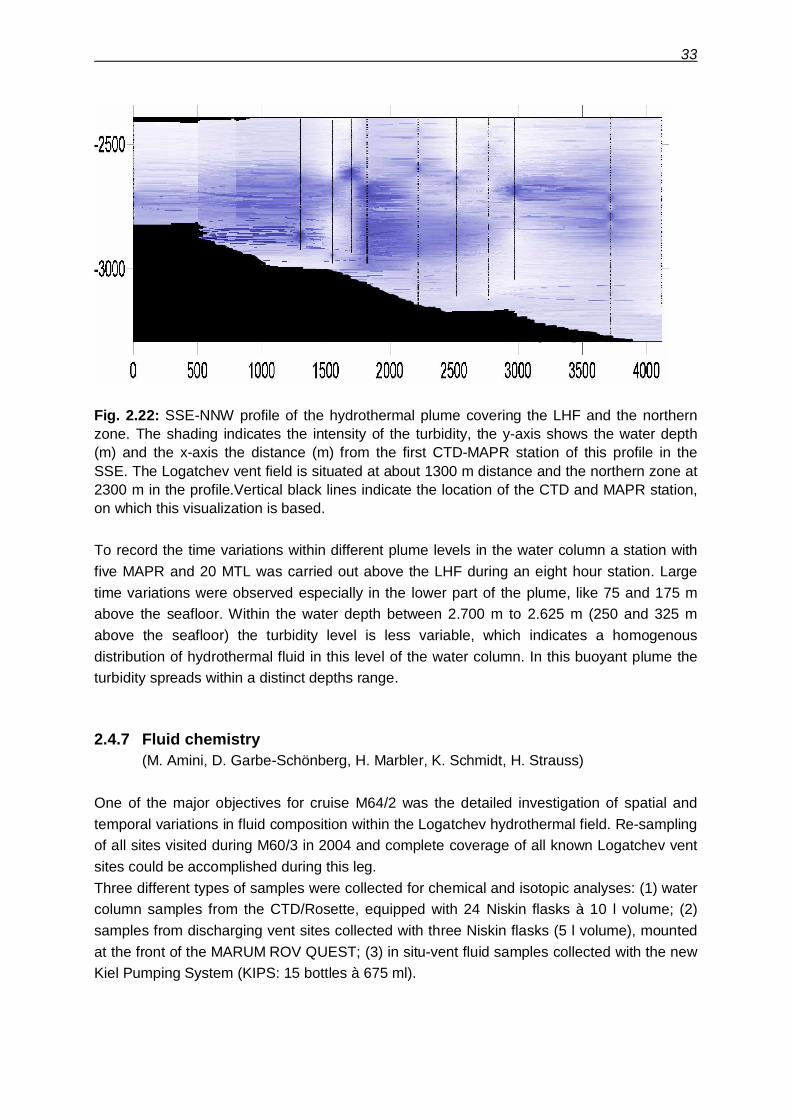
With an array of CTD stations and associated MAPR the extension of the turbidity plumeswas mapped. A CTD reference station was conducted some km west of the studying area. Inthe map (Fig. 2.20) the lateral extent of the upper plume is illustrated by a strong dashed line.Close to the individual fields (LHF and NAZ) the extension of the local lower plume is addedby a circle.The strongest turbidity signal is generally observed in the upper plume at 2700 m to 2900 mdepth. The disappearance of the turbidity plume in a distance of some km from the vent isexplained by the sinking of Fe-oxides, Fe-oxihydroxides and Mn-oxides not too far from theirorigin.The SSE-NNW profile (see map fig. 2.20) of the hydrothermal plume through the Logatchevfield and the northern zone shown in Fig. 2.22 is based on the interpretation of 11 CTD-MAPR stations. The cross-section shows a stratification of the turbidity plume especiallyabove the Logatchev field with an extra turbidity plume closer to the seafloor.
219 CTD2400
2500
2600
2700
2800
2900
3000
0,02 0,03 0,04 0,05 0,06Neph (volt)
260 CTD
2400
2500
2600
2700
2800
2900
3000
3100
0.02 0.04 0.06Neph (volt)
Dep
th (m
)
33
Fig. 2.22: SSE-NNW profile of the hydrothermal plume covering the LHF and the northernzone. The shading indicates the intensity of the turbidity, the y-axis shows the water depth(m) and the x-axis the distance (m) from the first CTD-MAPR station of this profile in theSSE. The Logatchev vent field is situated at about 1300 m distance and the northern zone at2300 m in the profile.Vertical black lines indicate the location of the CTD and MAPR station,on which this visualization is based.
To record the time variations within different plume levels in the water column a station withfive MAPR and 20 MTL was carried out above the LHF during an eight hour station. Largetime variations were observed especially in the lower part of the plume, like 75 and 175 mabove the seafloor. Within the water depth between 2.700 m to 2.625 m (250 and 325 mabove the seafloor) the turbidity level is less variable, which indicates a homogenousdistribution of hydrothermal fluid in this level of the water column. In this buoyant plume theturbidity spreads within a distinct depths range.
2.4.7 Fluid chemistry(M. Amini, D. Garbe-Schönberg, H. Marbler, K. Schmidt, H. Strauss)
One of the major objectives for cruise M64/2 was the detailed investigation of spatial andtemporal variations in fluid composition within the Logatchev hydrothermal field. Re-samplingof all sites visited during M60/3 in 2004 and complete coverage of all known Logatchev ventsites could be accomplished during this leg.Three different types of samples were collected for chemical and isotopic analyses: (1) watercolumn samples from the CTD/Rosette, equipped with 24 Niskin flasks à 10 l volume; (2)samples from discharging vent sites collected with three Niskin flasks (5 l volume), mountedat the front of the MARUM ROV QUEST; (3) in situ-vent fluid samples collected with the newKiel Pumping System (KIPS: 15 bottles à 675 ml).
34
Fluid Sampling System (KIPS)
For in situ-sampling of hydrothermal fluids directly from inside the vent orifices a pumpedflow-through system (Kiel Pumping System, KIPS) mounted on the ROV’s starboard backside was used.
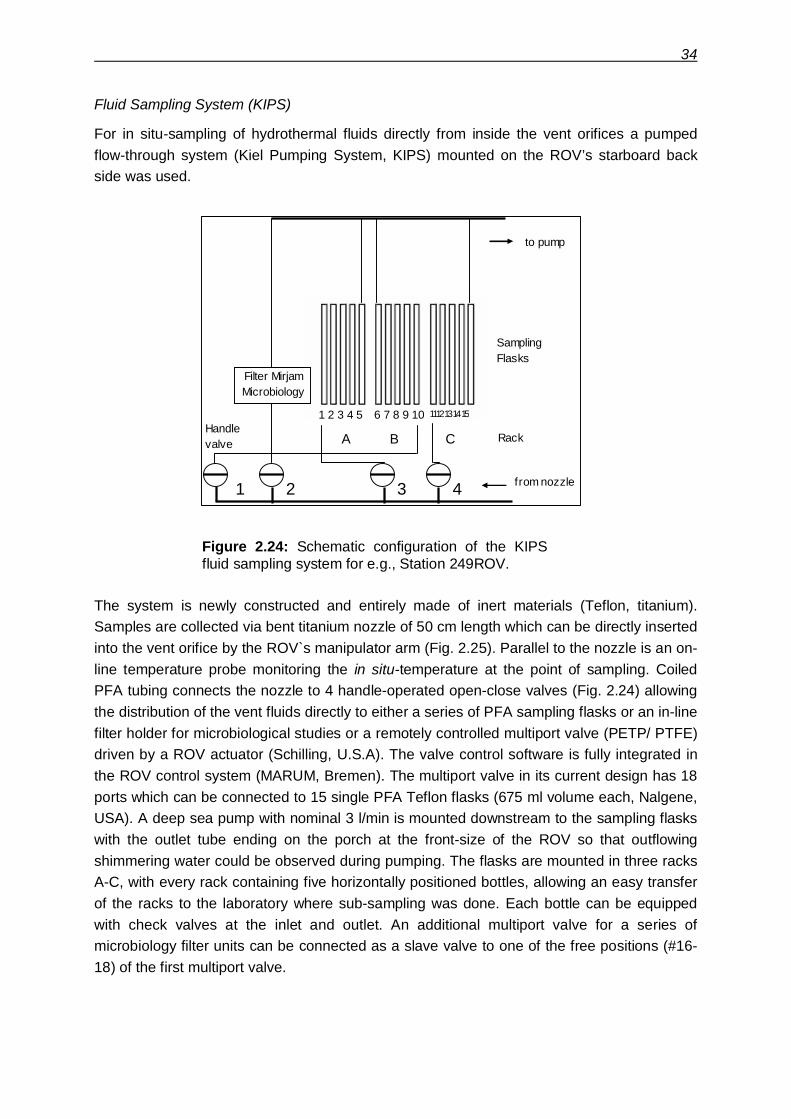
Figure 2.24: Schematic configuration of the KIPSfluid sampling system for e.g., Station 249ROV.
The system is newly constructed and entirely made of inert materials (Teflon, titanium).Samples are collected via bent titanium nozzle of 50 cm length which can be directly insertedinto the vent orifice by the ROV`s manipulator arm (Fig. 2.25). Parallel to the nozzle is an on-line temperature probe monitoring the in situ-temperature at the point of sampling. CoiledPFA tubing connects the nozzle to 4 handle-operated open-close valves (Fig. 2.24) allowingthe distribution of the vent fluids directly to either a series of PFA sampling flasks or an in-linefilter holder for microbiological studies or a remotely controlled multiport valve (PETP/ PTFE)driven by a ROV actuator (Schilling, U.S.A). The valve control software is fully integrated inthe ROV control system (MARUM, Bremen). The multiport valve in its current design has 18ports which can be connected to 15 single PFA Teflon flasks (675 ml volume each, Nalgene,USA). A deep sea pump with nominal 3 l/min is mounted downstream to the sampling flaskswith the outlet tube ending on the porch at the front-size of the ROV so that outflowingshimmering water could be observed during pumping. The flasks are mounted in three racksA-C, with every rack containing five horizontally positioned bottles, allowing an easy transferof the racks to the laboratory where sub-sampling was done. Each bottle can be equippedwith check valves at the inlet and outlet. An additional multiport valve for a series ofmicrobiology filter units can be connected as a slave valve to one of the free positions (#16-18) of the first multiport valve.
A B C
1 2 3 4 5 6 7 8 9 10 1112131415
1 2 3 4
Filter MirjamMicrobiology
to pump
from nozzle
Handlevalve
1
SamplingFlasks
Rack
35
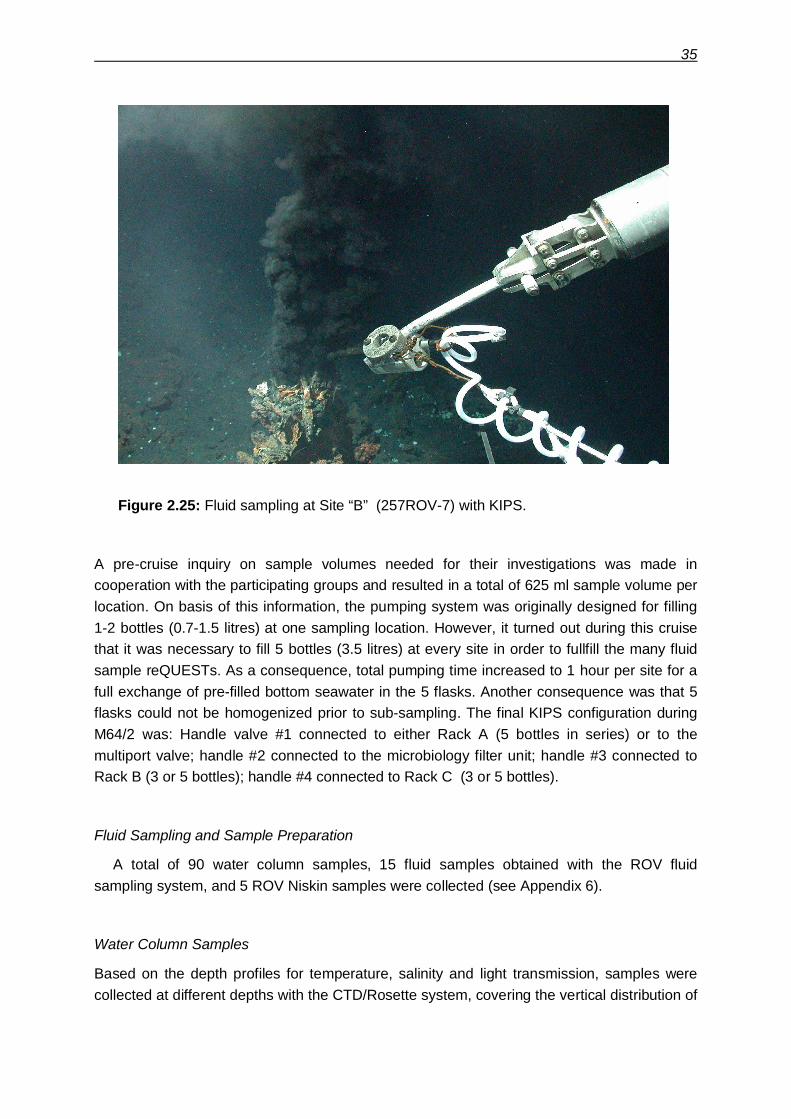
Figure 2.25: Fluid sampling at Site “B” (257ROV-7) with KIPS.
A pre-cruise inquiry on sample volumes needed for their investigations was made incooperation with the participating groups and resulted in a total of 625 ml sample volume perlocation. On basis of this information, the pumping system was originally designed for filling1-2 bottles (0.7-1.5 litres) at one sampling location. However, it turned out during this cruisethat it was necessary to fill 5 bottles (3.5 litres) at every site in order to fullfill the many fluidsample reQUESTs. As a consequence, total pumping time increased to 1 hour per site for afull exchange of pre-filled bottom seawater in the 5 flasks. Another consequence was that 5flasks could not be homogenized prior to sub-sampling. The final KIPS configuration duringM64/2 was: Handle valve #1 connected to either Rack A (5 bottles in series) or to themultiport valve; handle #2 connected to the microbiology filter unit; handle #3 connected toRack B (3 or 5 bottles); handle #4 connected to Rack C (3 or 5 bottles).
Fluid Sampling and Sample Preparation
A total of 90 water column samples, 15 fluid samples obtained with the ROV fluidsampling system, and 5 ROV Niskin samples were collected (see Appendix 6).
Water Column Samples
Based on the depth profiles for temperature, salinity and light transmission, samples werecollected at different depths with the CTD/Rosette system, covering the vertical distribution of
36
the hydrothermal plume. Sampling of these waters was performed directly after recovery ofthe CTD/Rosette system.
Immediately after sampling, pH and Eh were measured. Subsequently, and depending uponfuture chemical analyses, non-filtered subsamples (with aliquots either non-acidified oracidified to a pH of 2 with suprapure HCl) were stored at 4°C.Barium sulphate was precipitated from sample aliquots (addition of barium chloride solutionat pH 2) for measuring the sulphur and oxygen isotopic compositions of dissolved sulphate.For selected CTD stations, untreated water samples were collected for measuring theoxygen and hydrogen isotopic composition of these waters.
For the CTD stations in the vicinity of active vents, samples have been collected for theanalysis of amino acids in the dissolved and particulate organic material. Water sampleswere filtered through GF/F glass fibre filters and the filters wrapped in aluminium foil andfrozen at -20°C. The organic compounds in the filtrate were concentrated by means of solidphase extraction onto C18 and SCX phases and subsequently stored at -20°C. For selectedprofiles throughout the water column an aliquot of the samples has been frozen at -20°C forlater analysis of the ammonium concentration and its nitrogen isotopic composition.
Vent Fluid Samples
Immediately after recovery of the ROV, all three Niskin flasks (N1, N2, N3) and all bottlesfrom the KIPS were sub-sampled.
Aliquots were sub-sampled for the following chemical and isotopic analyses: free gas anddissolved gases (CH4, H2, abundance and isotopic composition, approx. 1000 ml), totaldissolved and particulate major and trace elements (2x 50ml), isotopic composition of Ca (25ml), high precision alkalinity (250 ml), selected anions (50 ml), sulphate (1 ml) and sulphide(abundance and isotope geochemistry, 400 ml), dissolved inorganic carbon (abundance andisotopic composition, 30 ml), amino acids (2x 75 ml), ammonium (abundance and nitrogenisotopes, 60 ml), and aliquots for subsequent filtration (500-1000ml) and microbiologicalcultivation work.
On small unfiltered aliquots (30 ml), ph, Eh, total Fe and Fe-II, S2-, and dissolved silica weremeasured directly after sampling for all samples.
For all other chemical analyses, fluid samples were pressure-filtrated with Nitrogen(99.999%) at 1 bar through pre-cleaned 0.2 µm Nuclepore PC membrane filters by means ofpolycarbonate filtration units (Sartorius, Germany). The filtrates were separated into aliquotsfor voltammetric and ICP analyses and acidified to pH 1 with 100 µl subboiled concentratednitric acid per 50 ml (ICP) and with suprapure HCl to pH 2 (voltammetry), respectively.Procedural blanks were processed in regular intervals. All work was done in a class 100clean bench (Slee, Germany) using only all-plastic labware (polypropylene, polycarbonate,PFA Teflon). Rinse water was ultrapure (>18.2 Mohm), dispensed from a Millipore Milli-Qsystem.
For selected samples, about 200 ml of fluid were filled into specially pre-cleaned bottles andimmediately deep-frozen at -20°C. These samples are shipped in frozen state for the
37
determination of organic metal complexation in the home laboratory of the project partner Dr.Sylvia Sander (University of Otago, New Zealand). Some representative samples were deep-frozen or poisoned with HgCl2, respectively, as conservation for organic analyses in thehome laboratory.
After return to the home laboratories at University of Kiel selected samples will be analysedfor major (Mg, Ca, Ba, Sr, Na, K, Si, Fe, Mn, B, Cl) and trace element composition (e.g., I, Br,Li, Al, Cs, Ba, Sr, Y-REE, Fe, Mn, Cr, V, Cu, Co, Ni, Pb, U, Mo, As, Sb, W, PGE) by ICP-OES (Spectro Ciros SOP CCD) and ICP-MS using both collision-cell quadrupole (Agilent7500cs) and high-resolution sector-field based instrumentation (Micromass PlasmaTrace2).
At IUB in Bremen, voltammetry will be used for further trace metal analyses (Zn, Cd, Pb, Cu,Co, Ni, Ti, V, Mo, U, Tl, Pt). ICP-MS and ICP-OES measurements of minor elements andtrace metals (see above) will be carried out as well for interlaboratory comparison. Li and Nawill be analysed by flame photometry, and photometric methods will be used to determineanionic compounds (silicate, phosphate, sulfate, chloride). The duplicate coverage of someelements with different methods will be used for the evaluation of the methods and the data.The determination of organic complexation of Fe, Cu, and Zn (S. Sander, Univ. Otago) willbe done by voltammetric ligand titration.At the Westfälische Wilhelms-Universität Münster, sulphur (sulphides, sulphates), oxygen(sulphates, fluid samples), and hydrogen (fluid samples) isotope measurements will beperformed.
At the Bundesanstalt für Geowissenschaften und Rohstoffe (BGR) in Hannover the aminoacid concentrations (HPLC-FD) and their racemization (GC-FID) as well as their isotopiccomposition (GC-irmMS) will be analysed for selected samples. Additionally, the ammoniumconcentration and its nitrogen isotopic composition will be investigated. For a set of samplesthe concentration and carbon isotopic composition of the dissolved inorganic carbon will beanalysed by a Finnigan Gasbench-Delta Plus-MS coupling.
At IFM-Geomar in Kiel the isotopic composition of Ca and Sr as well as U for selectedsamples will be determined by TIMS and MC-ICPMS. Alkalinity will be determined to highprecision.
On-board analyses
pH and Eh Measurements
For all samples collected with either the CTD/Rosette, the Niskin flasks or the Kiel FluidPumping System (KIPS), pH and Eh measurements were performed on unfiltered samplealiquots immediately after sampling. Measurements were carried out with WTW electrodes(Ag/AgCl reference electrode).
Chloride Titration
In order to determine whether or not phase separation affected the chemical composition ofthe hydrothermal fluids, fluid samples from hot vents collected during ROV dives, either withNiskin bottles or with the Kiel Fluid Sampling System, were subjected to chloride
38
concentration analysis. Measurements were performed as titration with 0.1 mM AgNO3-solution, using fluorescene-sodium as the indicator. For reference, samples from a watercolumn profile were also analyzed.
Photometric Determination of Dissolved Inorganic Silica
Silica tends to be enriched in hydrothermal fluids (e.g., van Damm, 2004). Hence, fluidsamples and selected CDT/Rosette water column samples were analyzed for theirabundance of dissolved silica. The analysis of dissolved silicon compounds in seawater andhydrothermal fluids is based on the formation of α-silicomolybdic acid via complexation of thedissolved silica with ammoniumheptamolybdate (e.g., Grasshoff et al., 1999). Concentrationmeasurements were performed with a biochrom Libra S12 spectral photometer at anextinction of 810 nm. Silica contents in water column samples were measured both in filteredand non-filtered samples. No significant difference was detected.
Photometric Determination of Iron Concentrations
The principle of this method is the determination of an orange-red ferroin complex, which isformed by Fe(II) ions in the fluid sample with 1,10-phenantroline in a pH range of 3-5. Inaddition to a quantification of Fe(II), it is also possible to measure the Fetot fraction in thesample by reducing all Fe with ascorbic acid. Fe(III) is determined as difference betweenFetot and Fe(II). Analyses were carried out with a biochrom Libra S12 spectral photometerand the absorption was measured at 511 nm. Fe concentrations were measured only infiltered samples of hydrothermal fluids. The detection limit is about 0.1 ppm. Samples withconcentrations above 100 ppm were measured in diluted samples.
Voltammetric Determination of Trace Element Concentrations
For onboard sulfide and trace metal concentration analyses, the electrochemical method ofvoltammetry was used. Voltammetry is able to differentiate between different redox speciesand (in combination with UV digestion of the water samples) free and complexed forms ofions in solution and is highly sensitive. All the voltammetric measurements were performedusing a Metrohm system comprising a 757 VA Computrace run with a standard PC, an 813Compact Autosampler and two 765 Dosimats. The three-electrode configuration consisted ofthe multi-mode electrode (MME) as the working electrode, an Ag/AgCl reference electrode (3mol l−1 KCl), and a platinum wire as the auxiliary electrode.
Immediately after recovery, the unfiltered fluid samples were analysed for total dissolvedsulfide in alkaline solution using the method after Metrohm Application Bulletin 199/3e.Filtered aliquots were submitted to a digestion process in a UV Digestor (Model 705,Metrohm), which contains a high pressure mercury lamp (500 W), decomposing organicmetal complexes. After 1 hour UV irradiation, the total content of Mn, Zn, Cu, Cd, and Pb inall fluid samples and Fe in selected water column samples were determined by the standardaddition method. For Fe, the highly sensitive cathodic stripping voltammetric method ofObata and van den Berg (2001) using 2,3-dihydroxinaphthalene as complexing agent wasapplied in samples with low Fe concentrations, while photometry was used for samples with
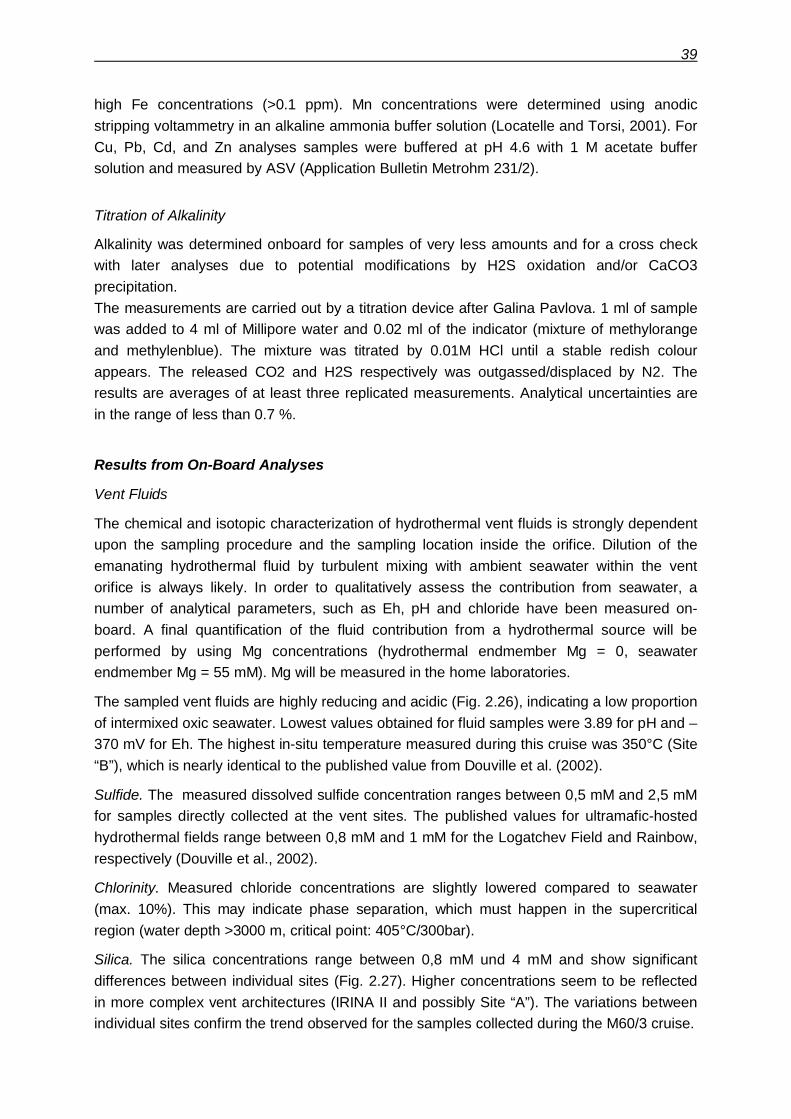
39
high Fe concentrations (>0.1 ppm). Mn concentrations were determined using anodicstripping voltammetry in an alkaline ammonia buffer solution (Locatelle and Torsi, 2001). ForCu, Pb, Cd, and Zn analyses samples were buffered at pH 4.6 with 1 M acetate buffersolution and measured by ASV (Application Bulletin Metrohm 231/2).
Titration of Alkalinity
Alkalinity was determined onboard for samples of very less amounts and for a cross checkwith later analyses due to potential modifications by H2S oxidation and/or CaCO3precipitation.The measurements are carried out by a titration device after Galina Pavlova. 1 ml of samplewas added to 4 ml of Millipore water and 0.02 ml of the indicator (mixture of methylorangeand methylenblue). The mixture was titrated by 0.01M HCl until a stable redish colourappears. The released CO2 and H2S respectively was outgassed/displaced by N2. Theresults are averages of at least three replicated measurements. Analytical uncertainties arein the range of less than 0.7 %.
Results from On-Board Analyses
Vent Fluids
The chemical and isotopic characterization of hydrothermal vent fluids is strongly dependentupon the sampling procedure and the sampling location inside the orifice. Dilution of theemanating hydrothermal fluid by turbulent mixing with ambient seawater within the ventorifice is always likely. In order to qualitatively assess the contribution from seawater, anumber of analytical parameters, such as Eh, pH and chloride have been measured on-board. A final quantification of the fluid contribution from a hydrothermal source will beperformed by using Mg concentrations (hydrothermal endmember Mg = 0, seawaterendmember Mg = 55 mM). Mg will be measured in the home laboratories.
The sampled vent fluids are highly reducing and acidic (Fig. 2.26), indicating a low proportionof intermixed oxic seawater. Lowest values obtained for fluid samples were 3.89 for pH and –370 mV for Eh. The highest in-situ temperature measured during this cruise was 350°C (Site“B”), which is nearly identical to the published value from Douville et al. (2002).
Sulfide. The measured dissolved sulfide concentration ranges between 0,5 mM and 2,5 mMfor samples directly collected at the vent sites. The published values for ultramafic-hostedhydrothermal fields range between 0,8 mM and 1 mM for the Logatchev Field and Rainbow,respectively (Douville et al., 2002).
Chlorinity. Measured chloride concentrations are slightly lowered compared to seawater(max. 10%). This may indicate phase separation, which must happen in the supercriticalregion (water depth >3000 m, critical point: 405°C/300bar).
Silica. The silica concentrations range between 0,8 mM und 4 mM and show significantdifferences between individual sites (Fig. 2.27). Higher concentrations seem to be reflectedin more complex vent architectures (IRINA II and possibly Site “A”). The variations betweenindividual sites confirm the trend observed for the samples collected during the M60/3 cruise.
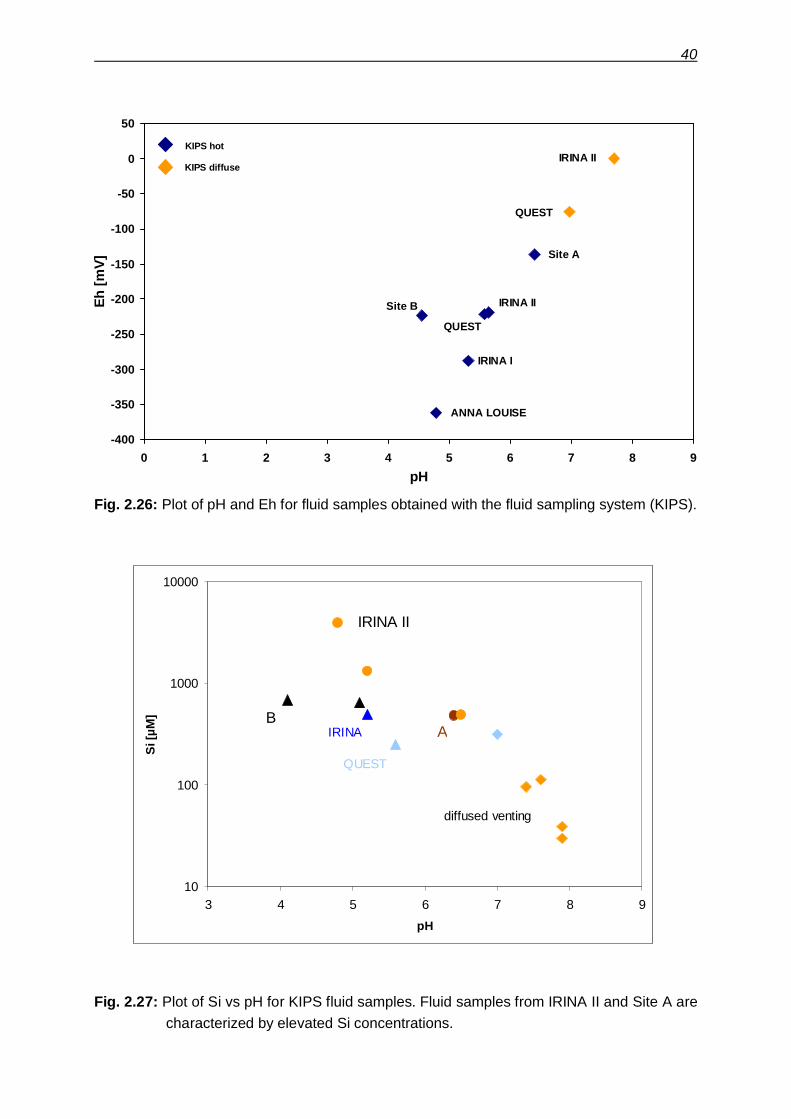
40
Fig. 2.26: Plot of pH and Eh for fluid samples obtained with the fluid sampling system (KIPS).
Fig. 2.27: Plot of Si vs pH for KIPS fluid samples. Fluid samples from IRINA II and Site A arecharacterized by elevated Si concentrations.
-400
-350
-300
-250
-200
-150
-100
-50
0
50
0 1 2 3 4 5 6 7 8 9pH
Eh [m
V]
IRINA II
QUEST
QUEST
IRINA II
IRINA I
Site B
Site A
ANNA LOUISE
KIPS hot
KIPS diffuse
10
100
1000
10000
3 4 5 6 7 8 9pH
Si [µ
M]
IRINA II
diffused venting
AB
IRINA
QUEST
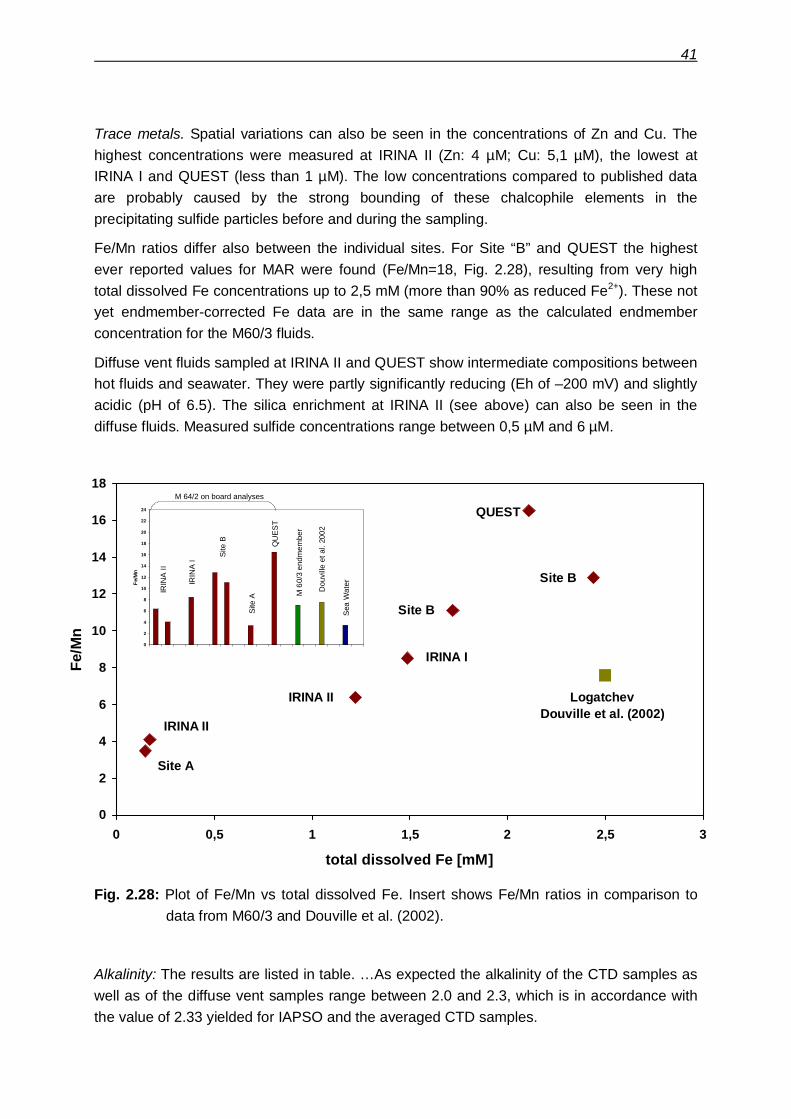
41
Trace metals. Spatial variations can also be seen in the concentrations of Zn and Cu. Thehighest concentrations were measured at IRINA II (Zn: 4 µM; Cu: 5,1 µM), the lowest atIRINA I and QUEST (less than 1 µM). The low concentrations compared to published dataare probably caused by the strong bounding of these chalcophile elements in theprecipitating sulfide particles before and during the sampling.
Fe/Mn ratios differ also between the individual sites. For Site “B” and QUEST the highestever reported values for MAR were found (Fe/Mn=18, Fig. 2.28), resulting from very hightotal dissolved Fe concentrations up to 2,5 mM (more than 90% as reduced Fe2+). These notyet endmember-corrected Fe data are in the same range as the calculated endmemberconcentration for the M60/3 fluids.
Diffuse vent fluids sampled at IRINA II and QUEST show intermediate compositions betweenhot fluids and seawater. They were partly significantly reducing (Eh of –200 mV) and slightlyacidic (pH of 6.5). The silica enrichment at IRINA II (see above) can also be seen in thediffuse fluids. Measured sulfide concentrations range between 0,5 µM and 6 µM.
Fig. 2.28: Plot of Fe/Mn vs total dissolved Fe. Insert shows Fe/Mn ratios in comparison todata from M60/3 and Douville et al. (2002).
Alkalinity: The results are listed in table. …As expected the alkalinity of the CTD samples aswell as of the diffuse vent samples range between 2.0 and 2.3, which is in accordance withthe value of 2.33 yielded for IAPSO and the averaged CTD samples.
0
2
4
6
8
10
12
14
16
18
0 0,5 1 1,5 2 2,5 3
total dissolved Fe [mM]
Fe/M
n
IRINA II
IRINA II
Site A
Site B
Site B
QUEST
IRINA I
LogatchevDouville et al. (2002)
0
2
4
6
8
10
12
14
16
18
0 0,5 1 1,5 2 2,5 3
total dissolved Fe [mM]
Fe/M
n
IRINA II
IRINA II
Site A
Site B
Site B
QUEST
IRINA I
LogatchevDouville et al. (2002)
0
2
4
6
8
10
12
14
16
18
20
22
24
Fe/M
n
IRIN
A II
IRIN
A I
Site
B
Site
A
QU
ES
T
M 6
0/3
endm
embe
r
Dou
ville
et a
l. 20
02
Sea
Wat
er
M 64/2 on board analyses
0
2
4
6
8
10
12
14
16
18
20
22
24
Fe/M
n
IRIN
A II
IRIN
A I
Site
B
Site
A
QU
ES
T
M 6
0/3
endm
embe
r
Dou
ville
et a
l. 20
02
Sea
Wat
er
M 64/2 on board analyses
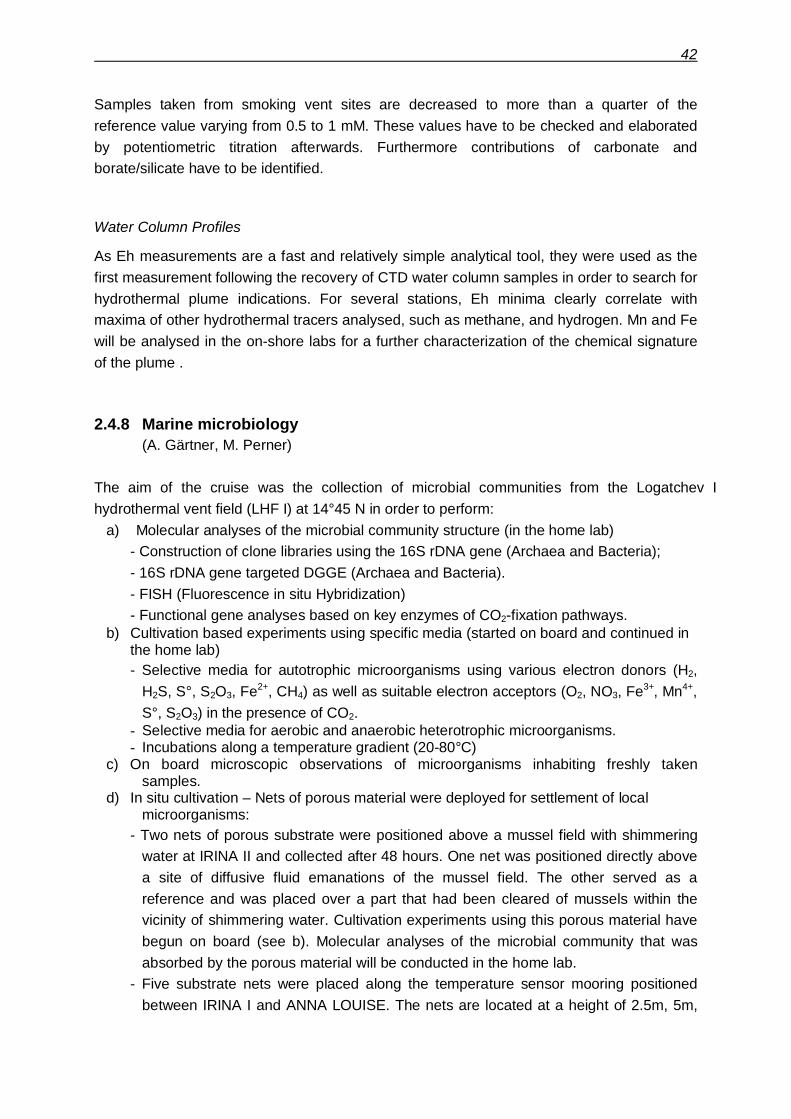
42
Samples taken from smoking vent sites are decreased to more than a quarter of thereference value varying from 0.5 to 1 mM. These values have to be checked and elaboratedby potentiometric titration afterwards. Furthermore contributions of carbonate andborate/silicate have to be identified.
Water Column Profiles
As Eh measurements are a fast and relatively simple analytical tool, they were used as thefirst measurement following the recovery of CTD water column samples in order to search forhydrothermal plume indications. For several stations, Eh minima clearly correlate withmaxima of other hydrothermal tracers analysed, such as methane, and hydrogen. Mn and Fewill be analysed in the on-shore labs for a further characterization of the chemical signatureof the plume .
2.4.8 Marine microbiology(A. Gärtner, M. Perner)
The aim of the cruise was the collection of microbial communities from the Logatchev Ihydrothermal vent field (LHF I) at 14°45 N in order to perform:
a) Molecular analyses of the microbial community structure (in the home lab)- Construction of clone libraries using the 16S rDNA gene (Archaea and Bacteria);- 16S rDNA gene targeted DGGE (Archaea and Bacteria).- FISH (Fluorescence in situ Hybridization)- Functional gene analyses based on key enzymes of CO2-fixation pathways.
b) Cultivation based experiments using specific media (started on board and continued inthe home lab)- Selective media for autotrophic microorganisms using various electron donors (H2,
H2S, S°, S2O3, Fe2+, CH4) as well as suitable electron acceptors (O2, NO3, Fe3+, Mn4+,S°, S2O3) in the presence of CO2.
- Selective media for aerobic and anaerobic heterotrophic microorganisms.- Incubations along a temperature gradient (20-80°C)
c) On board microscopic observations of microorganisms inhabiting freshly takensamples.
d) In situ cultivation – Nets of porous material were deployed for settlement of localmicroorganisms:
- Two nets of porous substrate were positioned above a mussel field with shimmeringwater at IRINA II and collected after 48 hours. One net was positioned directly abovea site of diffusive fluid emanations of the mussel field. The other served as areference and was placed over a part that had been cleared of mussels within thevicinity of shimmering water. Cultivation experiments using this porous material havebegun on board (see b). Molecular analyses of the microbial community that wasabsorbed by the porous material will be conducted in the home lab.
- Five substrate nets were placed along the temperature sensor mooring positionedbetween IRINA I and ANNA LOUISE. The nets are located at a height of 2.5m, 5m,
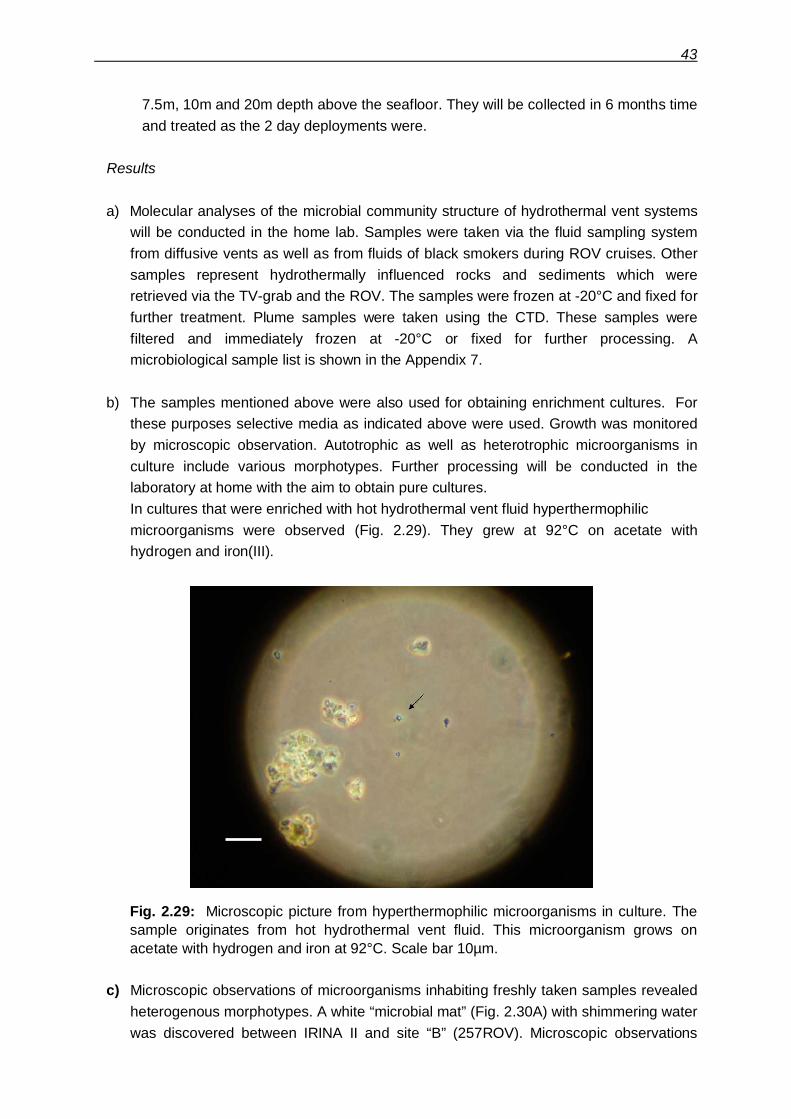
43
7.5m, 10m and 20m depth above the seafloor. They will be collected in 6 months timeand treated as the 2 day deployments were.
Results
a) Molecular analyses of the microbial community structure of hydrothermal vent systemswill be conducted in the home lab. Samples were taken via the fluid sampling systemfrom diffusive vents as well as from fluids of black smokers during ROV cruises. Othersamples represent hydrothermally influenced rocks and sediments which wereretrieved via the TV-grab and the ROV. The samples were frozen at -20°C and fixed forfurther treatment. Plume samples were taken using the CTD. These samples werefiltered and immediately frozen at -20°C or fixed for further processing. Amicrobiological sample list is shown in the Appendix 7.
b) The samples mentioned above were also used for obtaining enrichment cultures. Forthese purposes selective media as indicated above were used. Growth was monitoredby microscopic observation. Autotrophic as well as heterotrophic microorganisms inculture include various morphotypes. Further processing will be conducted in thelaboratory at home with the aim to obtain pure cultures.In cultures that were enriched with hot hydrothermal vent fluid hyperthermophilicmicroorganisms were observed (Fig. 2.29). They grew at 92°C on acetate withhydrogen and iron(III).
Fig. 2.29: Microscopic picture from hyperthermophilic microorganisms in culture. Thesample originates from hot hydrothermal vent fluid. This microorganism grows onacetate with hydrogen and iron at 92°C. Scale bar 10µm.
c) Microscopic observations of microorganisms inhabiting freshly taken samples revealedheterogenous morphotypes. A white “microbial mat” (Fig. 2.30A) with shimmering waterwas discovered between IRINA II and site “B” (257ROV). Microscopic observations
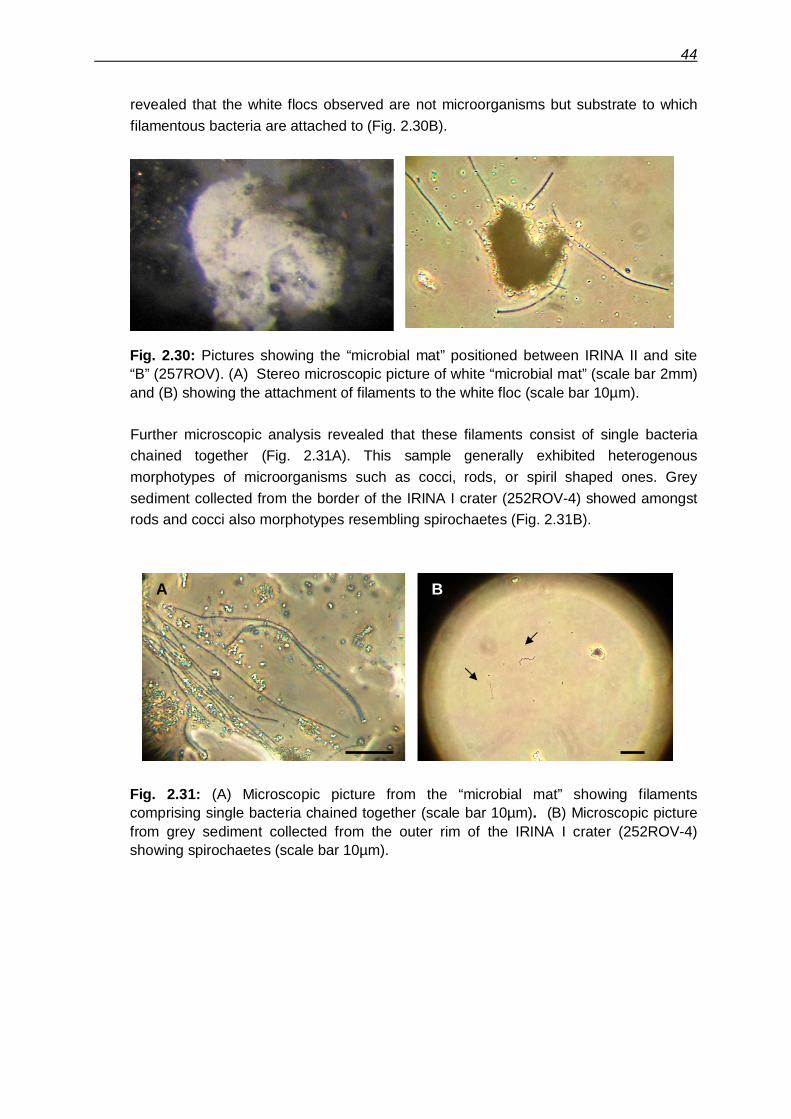
44
revealed that the white flocs observed are not microorganisms but substrate to whichfilamentous bacteria are attached to (Fig. 2.30B).
Fig. 2.30: Pictures showing the “microbial mat” positioned between IRINA II and site“B” (257ROV). (A) Stereo microscopic picture of white “microbial mat” (scale bar 2mm)and (B) showing the attachment of filaments to the white floc (scale bar 10µm).
Further microscopic analysis revealed that these filaments consist of single bacteriachained together (Fig. 2.31A). This sample generally exhibited heterogenousmorphotypes of microorganisms such as cocci, rods, or spiril shaped ones. Greysediment collected from the border of the IRINA I crater (252ROV-4) showed amongstrods and cocci also morphotypes resembling spirochaetes (Fig. 2.31B).
Fig. 2.31: (A) Microscopic picture from the “microbial mat” showing filamentscomprising single bacteria chained together (scale bar 10µm). (B) Microscopic picturefrom grey sediment collected from the outer rim of the IRINA I crater (252ROV-4)showing spirochaetes (scale bar 10µm).
BA
45
2.4.9 Hydrothermal symbioses(N. Dubilier, F. Zielinski)
Our main goal for this cruise was to investigate the transfer of energy from vent fluids to thedominant members of the faunal community at Logatchev, the mussels Bathymodiolusputeoserpentis. These mussels have greatly reduced guts, and their main source of nutritionare symbiotic bacteria that live in their gills. Two types of symbionts coexist in the gill cells:thiotrophic bacteria that use reduced sulfur compounds such as sulfide as an energy sourceand fix CO2 as a carbon source, and methanotrophic bacteria that use methane as both anenergy and carbon source. The energy sources for the mussel symbioses are delivered bythe hydrothermal fluids that carry high concentrations of sulfide, methane, and other reducedcompounds. The dilution of these effluents with ambient seawater leads to gradients insulfide and methane concentrations that vary over time and space. These gradients play amajor role in determining the biomass, activity and productivity of the vent community. Wehave defined these interactions between hydrothermal and biological processes as thegeobiological coupling between vent fluids and symbiotic primary producers.
During this cruise, we contributed to our ongoing studies of geobiological coupling at MARvents by identifying and characterizing gradients in vent fluids in mussel beds, and collectingmussels along these gradients for analysis of the biomass and activity of the bacterialsymbionts. To collect geochemical data at a scale relevant to the mussel community, weworked in close collaboration with the fluid chemistry group, temperature logger group, and insitu group on mussel beds from three sites at Logatchev, two sites at IRINA II and one atQUEST. Site 1 at IRINA II was located relatively high on the IRINA II mound, close to theactive black smokers on top of the IRINA II complex. This site was completely dominated byBathymodiolus mussels that formed a dense bed of several layers thickness with no emptyshells visible. Site 2 was lower on the IRINA mound, south of the large chimney complex,and close to the small active black chimney. At this site, 2 mussel beds separated by only afew meters were sampled: the mussel bed at Site 2A appeared less active with many emptymussel shells and high abundances of gastropod snails and ophiurid sea stars covering themussels, which were rusty brown in color. In contrast, the mussels at Site 2B appeared to bethriving, with little coverage by other animals, and the mussel shells shiny dark-brown toblack in color. Site 3 at QUEST was a mussel bed located southeast of the active smoker atQUEST. This site was characterized by high abundances of juvenile mussels. Shimmeringwater was observed at all collection sites, and shrimp were regularly observed at the bottomlayers of the mussel beds. A summary of collections sites and geochemical data is providedin Table 2.5.
A further major goal during our cruise was to study how the removal of mussels from fluidgradients affects the symbiosis. In a so-called transplant experiment, we collected mussels atSite 1 on the IRINA II complex and placed them at a site far removed from any obvious ventfluids (Beacon 14, Fig. 2.32).
Mussels were collected using the ROV manipulator arm in nets (40 cm length with a 20cm diameter opening, mesh size 1000 µm) with a net-covered lid that could be closed aftercollecting the mussels, to prevent predators such as vent crabs from entering the nets ormussels from escaping from the nets. Nets were recovered from the Beacon 14 site 1, 2, 5,
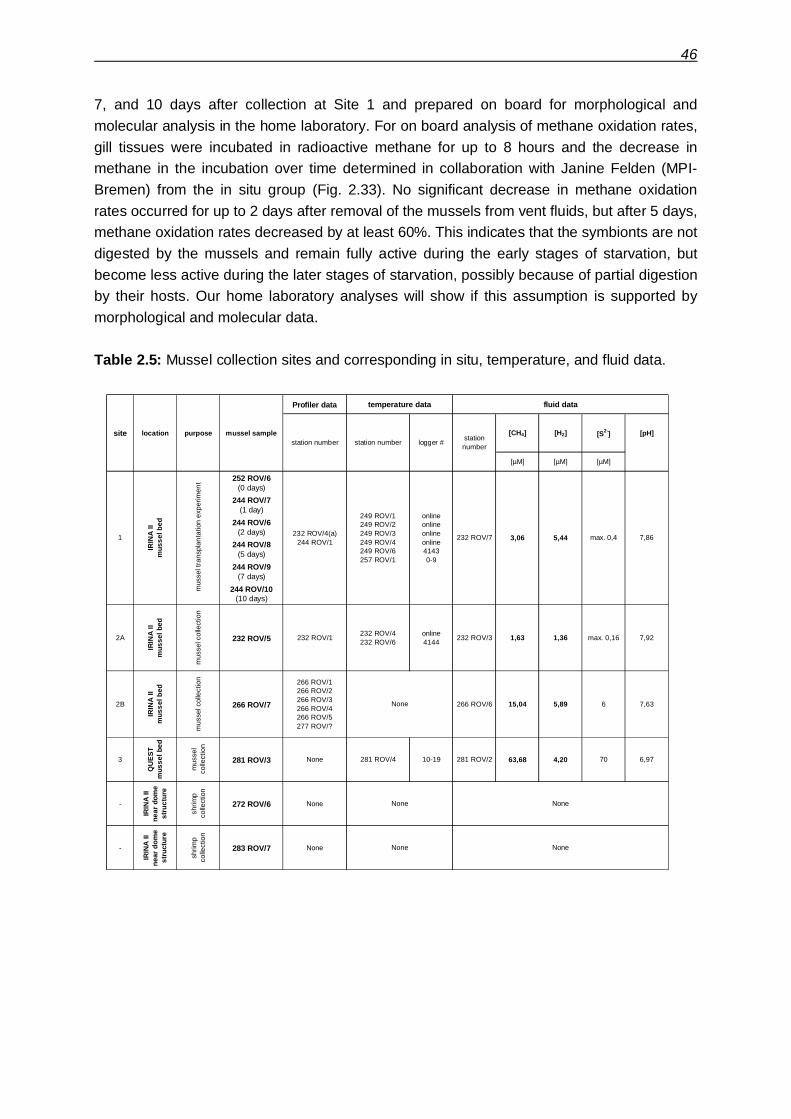
46
7, and 10 days after collection at Site 1 and prepared on board for morphological andmolecular analysis in the home laboratory. For on board analysis of methane oxidation rates,gill tissues were incubated in radioactive methane for up to 8 hours and the decrease inmethane in the incubation over time determined in collaboration with Janine Felden (MPI-Bremen) from the in situ group (Fig. 2.33). No significant decrease in methane oxidationrates occurred for up to 2 days after removal of the mussels from vent fluids, but after 5 days,methane oxidation rates decreased by at least 60%. This indicates that the symbionts are notdigested by the mussels and remain fully active during the early stages of starvation, butbecome less active during the later stages of starvation, possibly because of partial digestionby their hosts. Our home laboratory analyses will show if this assumption is supported bymorphological and molecular data.
Table 2.5: Mussel collection sites and corresponding in situ, temperature, and fluid data.
Profiler data
[µM] [µM] [µM]
252 ROV/6(0 days)
244 ROV/7(1 day)
244 ROV/6(2 days)
244 ROV/8(5 days)
244 ROV/9(7 days)
244 ROV/10(10 days)
2A
IRIN
A II
mus
sel b
ed
mus
sel c
olle
ctio
n
232 ROV/5 232 ROV/1 232 ROV/4232 ROV/6
online4144 232 ROV/3 1,63 1,36 max. 0,16 7,92
2B
IRIN
A II
mus
sel b
ed
mus
sel c
olle
ctio
n
266 ROV/7
266 ROV/1266 ROV/2266 ROV/3266 ROV/4266 ROV/5277 ROV/?
266 ROV/6 15,04 5,89 6 7,63
QU
EST
mus
sel b
ed
mus
sel
colle
ctio
n
281 ROV/3 None 281 ROV/4 10-19 281 ROV/2 63,68 4,20 70 6,97
-
IRIN
A II
near
dom
est
ruct
ure
shrim
pco
llect
ion
272 ROV/6 None
-
IRIN
A II
near
dom
est
ruct
ure
shrim
pco
llect
ion
283 ROV/7 None None
None
None
site
1
3
NoneNone
stationnumber
[CH4] [H2]location purpose
IRIN
A II
mus
sel b
ed
mus
sel t
rans
plan
tatio
n ex
perim
ent
232 ROV/4(a)244 ROV/1
temperature data
station number
fluid data
[S2-] [pH]mussel sample
5,44
onlineonlineonlineonline41430-9
249 ROV/1249 ROV/2249 ROV/3249 ROV/4249 ROV/6257 ROV/1
232 ROV/7 3,06
station number logger #
max. 0,4 7,86
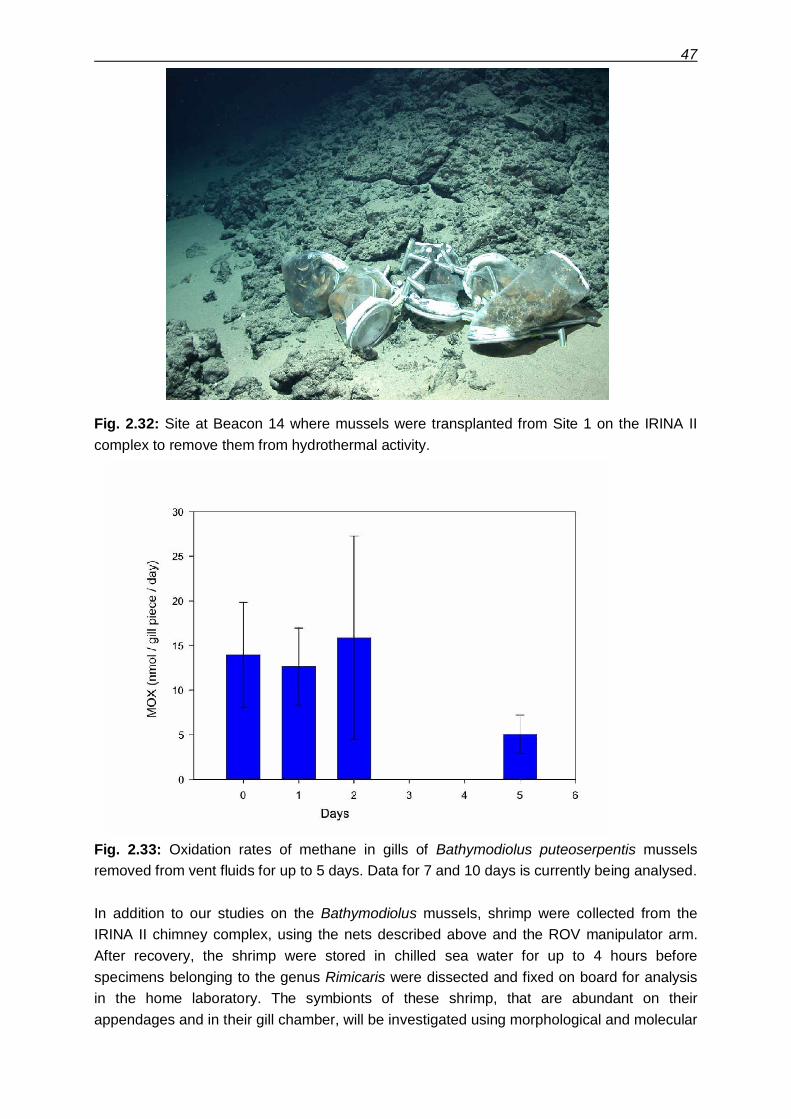
47
Fig. 2.32: Site at Beacon 14 where mussels were transplanted from Site 1 on the IRINA IIcomplex to remove them from hydrothermal activity.
Fig. 2.33: Oxidation rates of methane in gills of Bathymodiolus puteoserpentis musselsremoved from vent fluids for up to 5 days. Data for 7 and 10 days is currently being analysed.
In addition to our studies on the Bathymodiolus mussels, shrimp were collected from theIRINA II chimney complex, using the nets described above and the ROV manipulator arm.After recovery, the shrimp were stored in chilled sea water for up to 4 hours beforespecimens belonging to the genus Rimicaris were dissected and fixed on board for analysisin the home laboratory. The symbionts of these shrimp, that are abundant on theirappendages and in their gill chamber, will be investigated using morphological and molecular
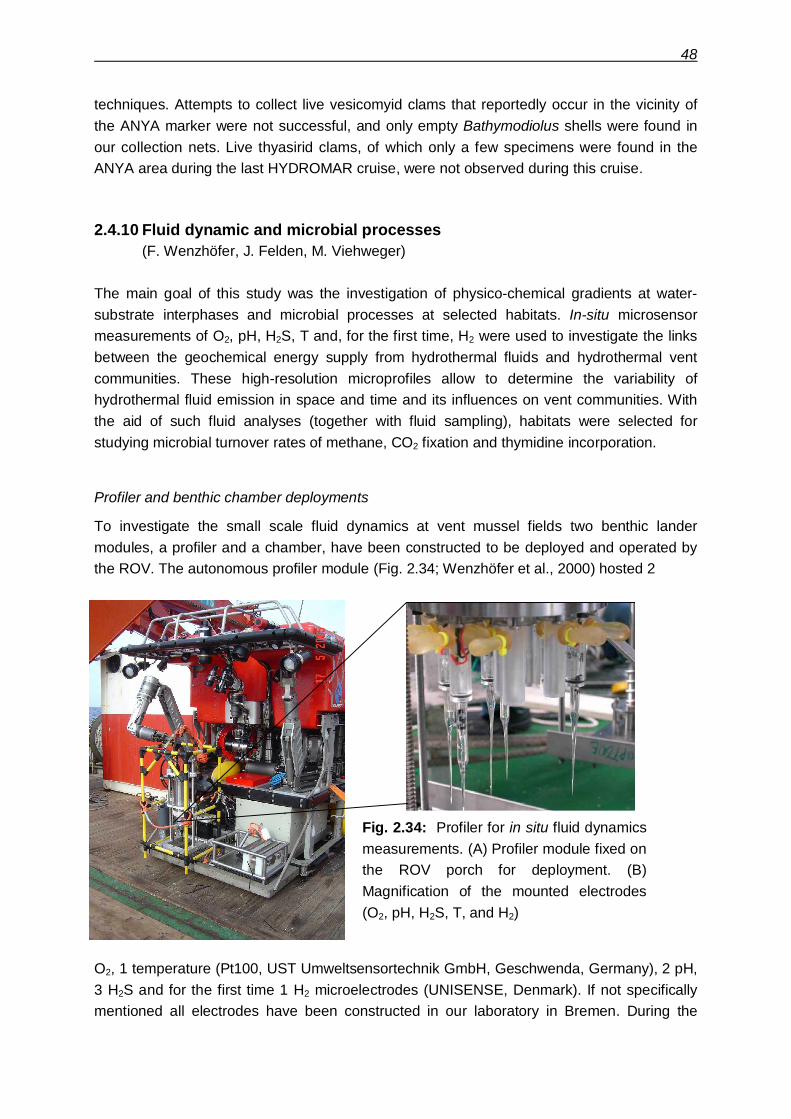
48
techniques. Attempts to collect live vesicomyid clams that reportedly occur in the vicinity ofthe ANYA marker were not successful, and only empty Bathymodiolus shells were found inour collection nets. Live thyasirid clams, of which only a few specimens were found in theANYA area during the last HYDROMAR cruise, were not observed during this cruise.
2.4.10 Fluid dynamic and microbial processes(F. Wenzhöfer, J. Felden, M. Viehweger)
The main goal of this study was the investigation of physico-chemical gradients at water-substrate interphases and microbial processes at selected habitats. In-situ microsensormeasurements of O2, pH, H2S, T and, for the first time, H2 were used to investigate the linksbetween the geochemical energy supply from hydrothermal fluids and hydrothermal ventcommunities. These high-resolution microprofiles allow to determine the variability ofhydrothermal fluid emission in space and time and its influences on vent communities. Withthe aid of such fluid analyses (together with fluid sampling), habitats were selected forstudying microbial turnover rates of methane, CO2 fixation and thymidine incorporation.
Profiler and benthic chamber deployments
To investigate the small scale fluid dynamics at vent mussel fields two benthic landermodules, a profiler and a chamber, have been constructed to be deployed and operated bythe ROV. The autonomous profiler module (Fig. 2.34; Wenzhöfer et al., 2000) hosted 2
O2, 1 temperature (Pt100, UST Umweltsensortechnik GmbH, Geschwenda, Germany), 2 pH,3 H2S and for the first time 1 H2 microelectrodes (UNISENSE, Denmark). If not specificallymentioned all electrodes have been constructed in our laboratory in Bremen. During the
Fig. 2.34: Profiler for in situ fluid dynamicsmeasurements. (A) Profiler module fixed onthe ROV porch for deployment. (B)Magnification of the mounted electrodes(O2, pH, H2S, T, and H2)
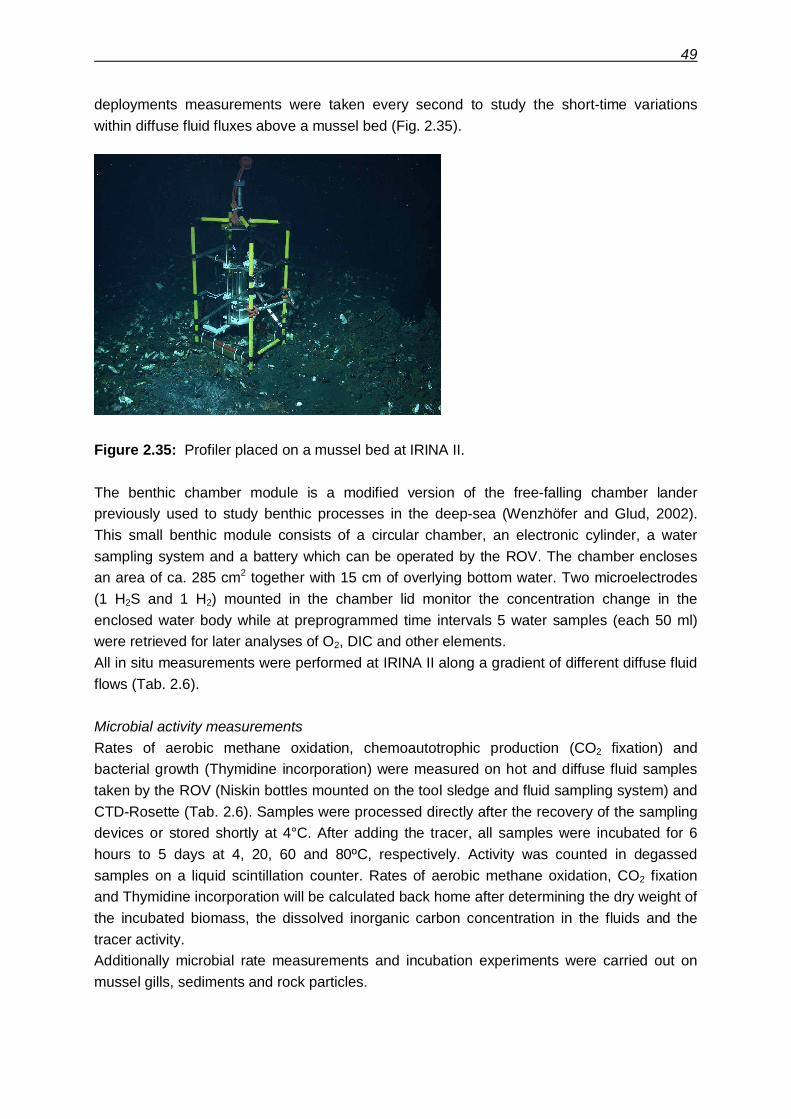
49
deployments measurements were taken every second to study the short-time variationswithin diffuse fluid fluxes above a mussel bed (Fig. 2.35).
Figure 2.35: Profiler placed on a mussel bed at IRINA II.
The benthic chamber module is a modified version of the free-falling chamber landerpreviously used to study benthic processes in the deep-sea (Wenzhöfer and Glud, 2002).This small benthic module consists of a circular chamber, an electronic cylinder, a watersampling system and a battery which can be operated by the ROV. The chamber enclosesan area of ca. 285 cm2 together with 15 cm of overlying bottom water. Two microelectrodes(1 H2S and 1 H2) mounted in the chamber lid monitor the concentration change in theenclosed water body while at preprogrammed time intervals 5 water samples (each 50 ml)were retrieved for later analyses of O2, DIC and other elements.All in situ measurements were performed at IRINA II along a gradient of different diffuse fluidflows (Tab. 2.6).
Microbial activity measurementsRates of aerobic methane oxidation, chemoautotrophic production (CO2 fixation) andbacterial growth (Thymidine incorporation) were measured on hot and diffuse fluid samplestaken by the ROV (Niskin bottles mounted on the tool sledge and fluid sampling system) andCTD-Rosette (Tab. 2.6). Samples were processed directly after the recovery of the samplingdevices or stored shortly at 4°C. After adding the tracer, all samples were incubated for 6hours to 5 days at 4, 20, 60 and 80ºC, respectively. Activity was counted in degassedsamples on a liquid scintillation counter. Rates of aerobic methane oxidation, CO2 fixationand Thymidine incorporation will be calculated back home after determining the dry weight ofthe incubated biomass, the dissolved inorganic carbon concentration in the fluids and thetracer activity.Additionally microbial rate measurements and incubation experiments were carried out onmussel gills, sediments and rock particles.
A
B
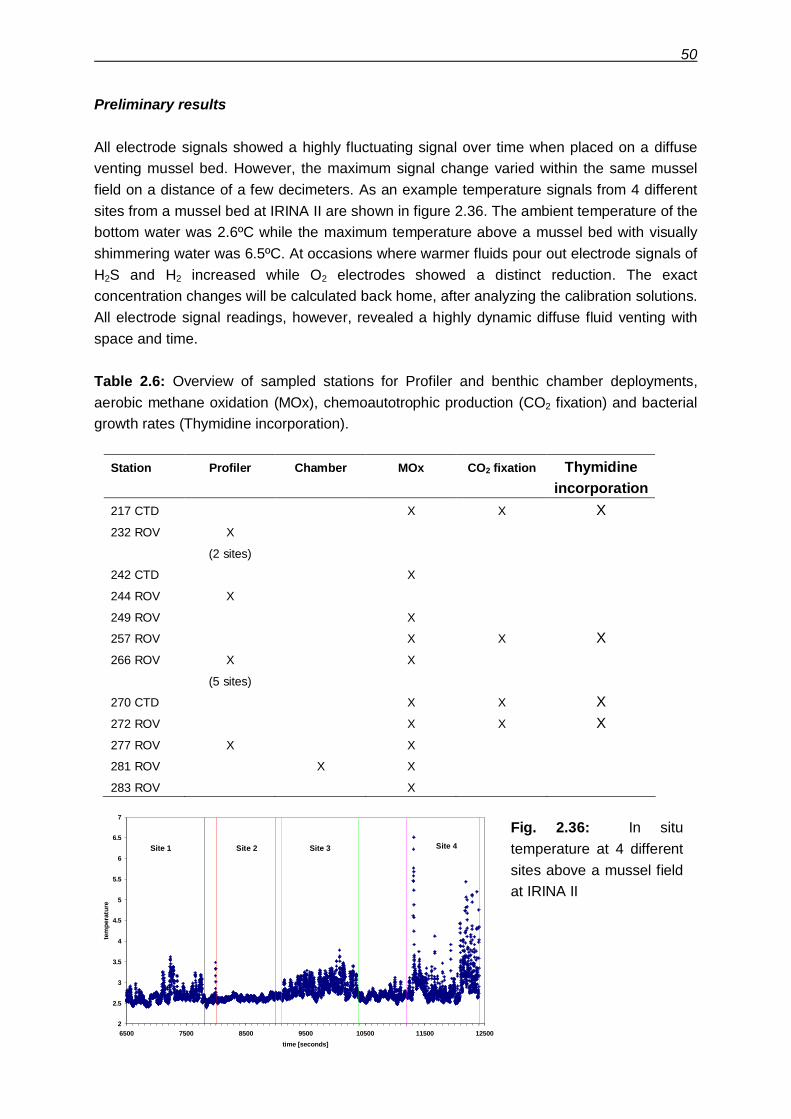
50
Preliminary results
All electrode signals showed a highly fluctuating signal over time when placed on a diffuseventing mussel bed. However, the maximum signal change varied within the same musselfield on a distance of a few decimeters. As an example temperature signals from 4 differentsites from a mussel bed at IRINA II are shown in figure 2.36. The ambient temperature of thebottom water was 2.6ºC while the maximum temperature above a mussel bed with visuallyshimmering water was 6.5ºC. At occasions where warmer fluids pour out electrode signals ofH2S and H2 increased while O2 electrodes showed a distinct reduction. The exactconcentration changes will be calculated back home, after analyzing the calibration solutions.All electrode signal readings, however, revealed a highly dynamic diffuse fluid venting withspace and time.
Table 2.6: Overview of sampled stations for Profiler and benthic chamber deployments,aerobic methane oxidation (MOx), chemoautotrophic production (CO2 fixation) and bacterialgrowth rates (Thymidine incorporation).
Station Profiler Chamber MOx CO2 fixation Thymidineincorporation
217 CTD X X X232 ROV X
(2 sites)
242 CTD X
244 ROV X
249 ROV X
257 ROV X X X266 ROV X
(5 sites)
X
270 CTD X X X272 ROV X X X277 ROV X X
281 ROV X X
283 ROV X
2
2.5
3
3.5
4
4.5
5
5.5
6
6.5
7
6500 7500 8500 9500 10500 11500 12500time [seconds]
tem
pera
ture
Site 1 Site 2 Site 3 Site 4
Fig. 2.36: In situtemperature at 4 differentsites above a mussel fieldat IRINA II
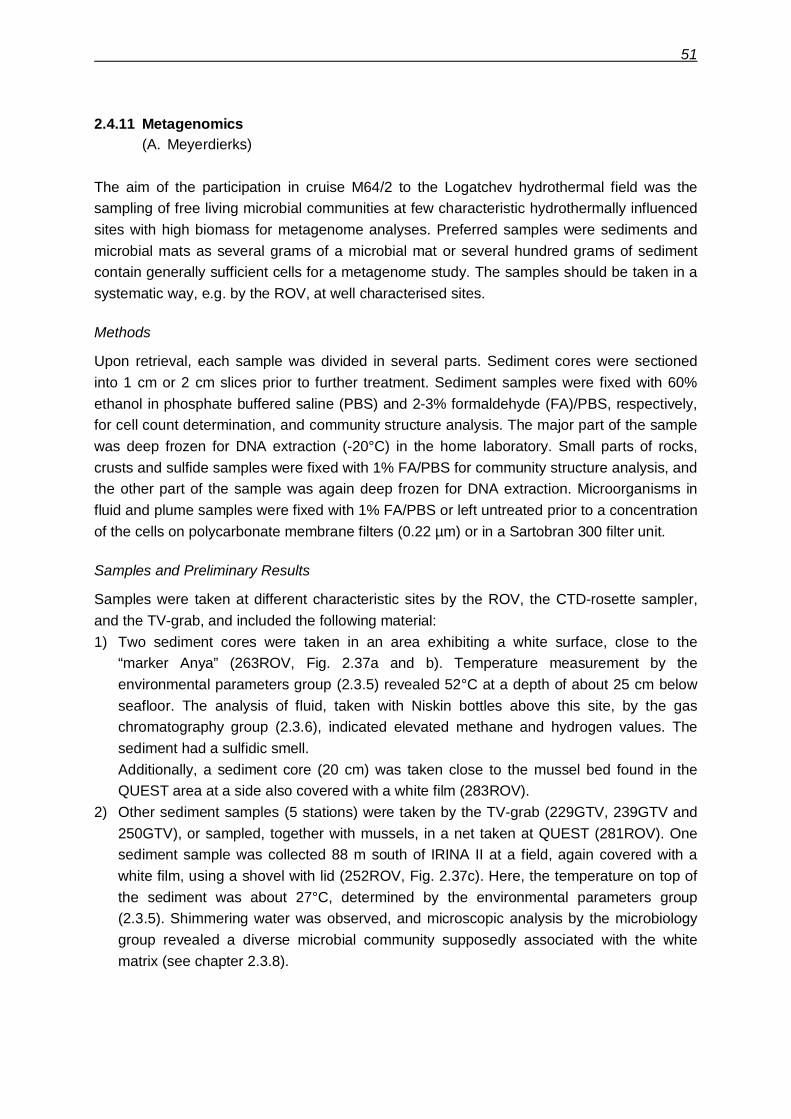
51
2.4.11 Metagenomics(A. Meyerdierks)
The aim of the participation in cruise M64/2 to the Logatchev hydrothermal field was thesampling of free living microbial communities at few characteristic hydrothermally influencedsites with high biomass for metagenome analyses. Preferred samples were sediments andmicrobial mats as several grams of a microbial mat or several hundred grams of sedimentcontain generally sufficient cells for a metagenome study. The samples should be taken in asystematic way, e.g. by the ROV, at well characterised sites.
Methods
Upon retrieval, each sample was divided in several parts. Sediment cores were sectionedinto 1 cm or 2 cm slices prior to further treatment. Sediment samples were fixed with 60%ethanol in phosphate buffered saline (PBS) and 2-3% formaldehyde (FA)/PBS, respectively,for cell count determination, and community structure analysis. The major part of the samplewas deep frozen for DNA extraction (-20°C) in the home laboratory. Small parts of rocks,crusts and sulfide samples were fixed with 1% FA/PBS for community structure analysis, andthe other part of the sample was again deep frozen for DNA extraction. Microorganisms influid and plume samples were fixed with 1% FA/PBS or left untreated prior to a concentrationof the cells on polycarbonate membrane filters (0.22 µm) or in a Sartobran 300 filter unit.
Samples and Preliminary Results
Samples were taken at different characteristic sites by the ROV, the CTD-rosette sampler,and the TV-grab, and included the following material:1) Two sediment cores were taken in an area exhibiting a white surface, close to the
“marker Anya” (263ROV, Fig. 2.37a and b). Temperature measurement by theenvironmental parameters group (2.3.5) revealed 52°C at a depth of about 25 cm belowseafloor. The analysis of fluid, taken with Niskin bottles above this site, by the gaschromatography group (2.3.6), indicated elevated methane and hydrogen values. Thesediment had a sulfidic smell.Additionally, a sediment core (20 cm) was taken close to the mussel bed found in theQUEST area at a side also covered with a white film (283ROV).
2) Other sediment samples (5 stations) were taken by the TV-grab (229GTV, 239GTV and250GTV), or sampled, together with mussels, in a net taken at QUEST (281ROV). Onesediment sample was collected 88 m south of IRINA II at a field, again covered with awhite film, using a shovel with lid (252ROV, Fig. 2.37c). Here, the temperature on top ofthe sediment was about 27°C, determined by the environmental parameters group(2.3.5). Shimmering water was observed, and microscopic analysis by the microbiologygroup revealed a diverse microbial community supposedly associated with the whitematrix (see chapter 2.3.8).
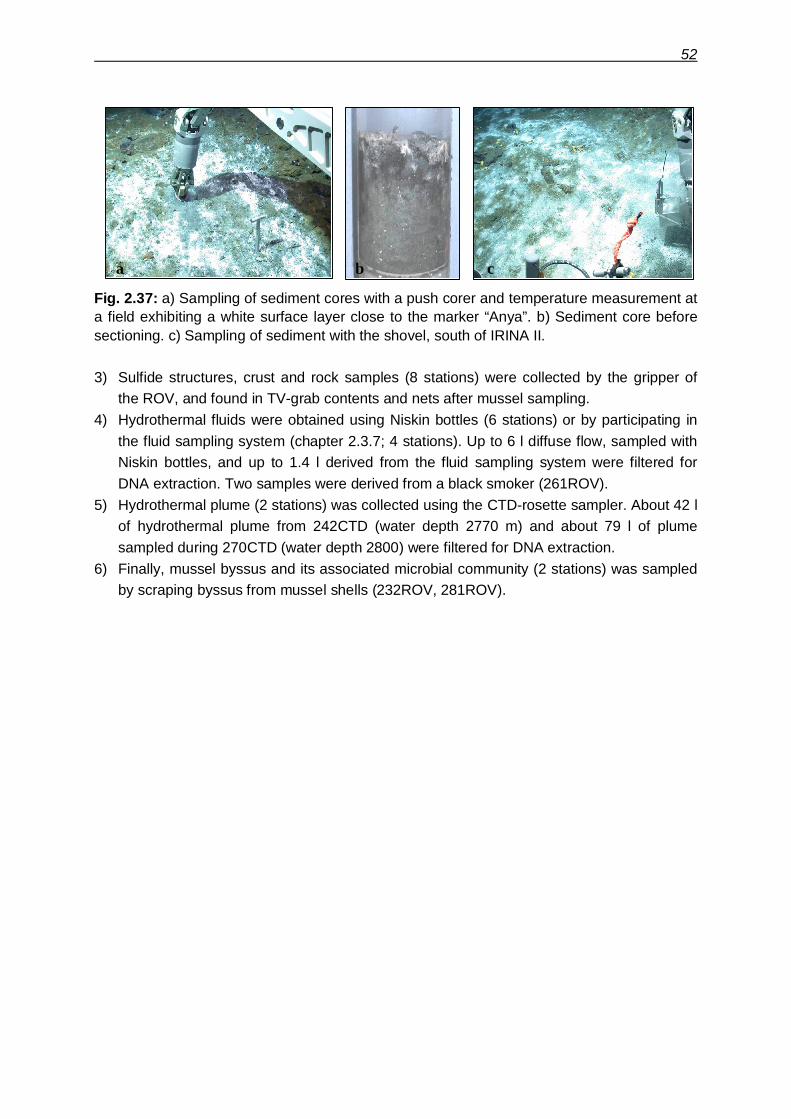
52
Fig. 2.37: a) Sampling of sediment cores with a push corer and temperature measurement ata field exhibiting a white surface layer close to the marker “Anya”. b) Sediment core beforesectioning. c) Sampling of sediment with the shovel, south of IRINA II.
3) Sulfide structures, crust and rock samples (8 stations) were collected by the gripper ofthe ROV, and found in TV-grab contents and nets after mussel sampling.
4) Hydrothermal fluids were obtained using Niskin bottles (6 stations) or by participating inthe fluid sampling system (chapter 2.3.7; 4 stations). Up to 6 l diffuse flow, sampled withNiskin bottles, and up to 1.4 l derived from the fluid sampling system were filtered forDNA extraction. Two samples were derived from a black smoker (261ROV).
5) Hydrothermal plume (2 stations) was collected using the CTD-rosette sampler. About 42 lof hydrothermal plume from 242CTD (water depth 2770 m) and about 79 l of plumesampled during 270CTD (water depth 2800) were filtered for DNA extraction.
6) Finally, mussel byssus and its associated microbial community (2 stations) was sampledby scraping byssus from mussel shells (232ROV, 281ROV).
a b c
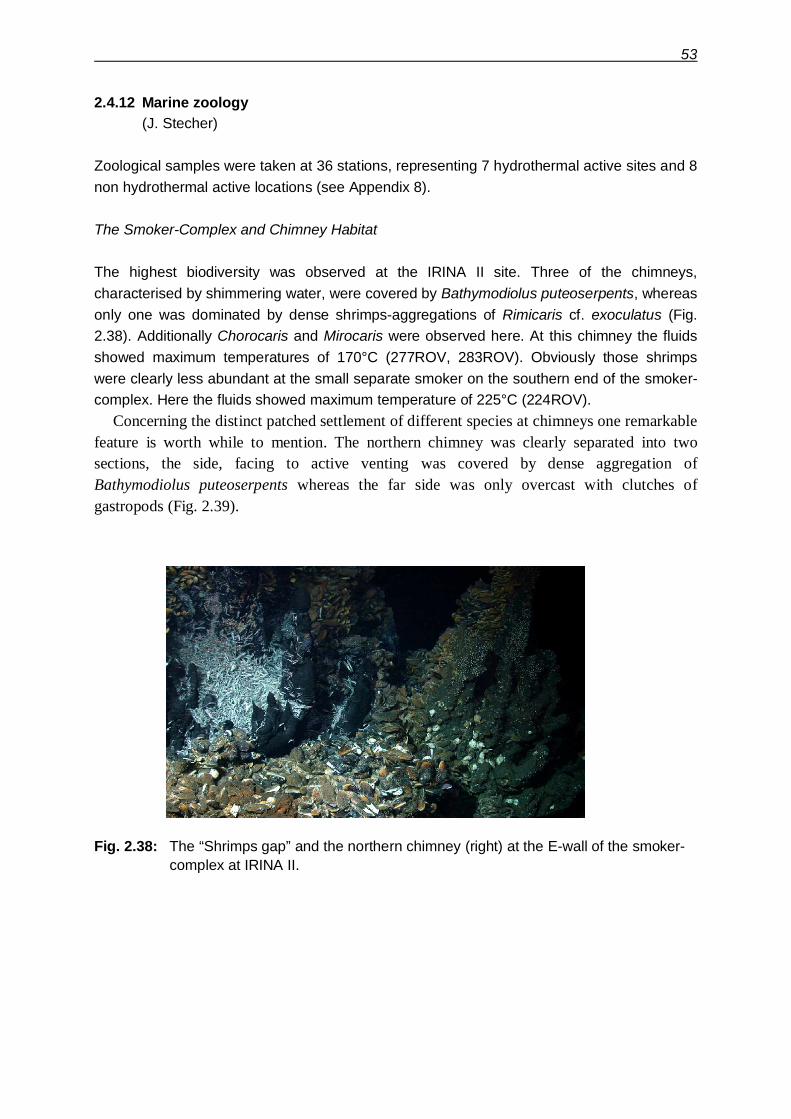
53
2.4.12 Marine zoology(J. Stecher)
Zoological samples were taken at 36 stations, representing 7 hydrothermal active sites and 8non hydrothermal active locations (see Appendix 8).
The Smoker-Complex and Chimney Habitat
The highest biodiversity was observed at the IRINA II site. Three of the chimneys,characterised by shimmering water, were covered by Bathymodiolus puteoserpents, whereasonly one was dominated by dense shrimps-aggregations of Rimicaris cf. exoculatus (Fig.2.38). Additionally Chorocaris and Mirocaris were observed here. At this chimney the fluidsshowed maximum temperatures of 170°C (277ROV, 283ROV). Obviously those shrimpswere clearly less abundant at the small separate smoker on the southern end of the smoker-complex. Here the fluids showed maximum temperature of 225°C (224ROV).
Concerning the distinct patched settlement of different species at chimneys one remarkablefeature is worth while to mention. The northern chimney was clearly separated into twosections, the side, facing to active venting was covered by dense aggregation ofBathymodiolus puteoserpents whereas the far side was only overcast with clutches ofgastropods (Fig. 2.39).
Fig. 2.38: The “Shrimps gap” and the northern chimney (right) at the E-wall of the smoker-complex at IRINA II.
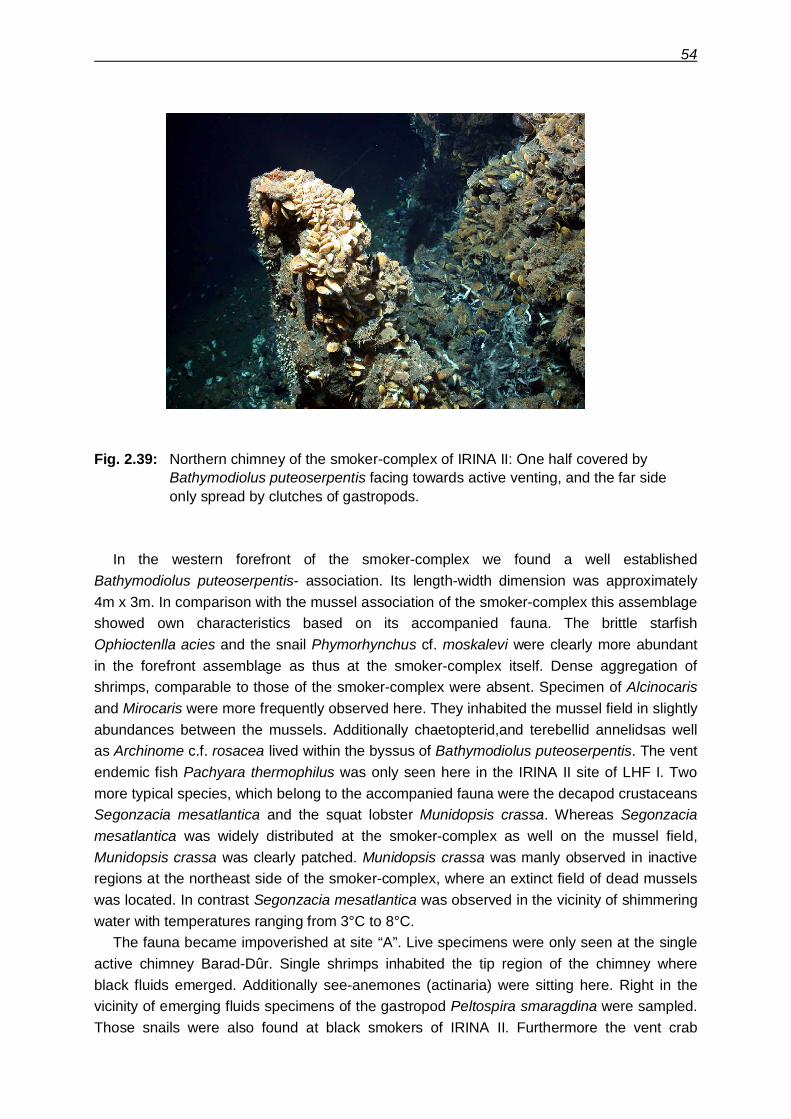
54
Fig. 2.39: Northern chimney of the smoker-complex of IRINA II: One half covered byBathymodiolus puteoserpentis facing towards active venting, and the far sideonly spread by clutches of gastropods.
In the western forefront of the smoker-complex we found a well establishedBathymodiolus puteoserpentis- association. Its length-width dimension was approximately4m x 3m. In comparison with the mussel association of the smoker-complex this assemblageshowed own characteristics based on its accompanied fauna. The brittle starfishOphioctenlla acies and the snail Phymorhynchus cf. moskalevi were clearly more abundantin the forefront assemblage as thus at the smoker-complex itself. Dense aggregation ofshrimps, comparable to those of the smoker-complex were absent. Specimen of Alcinocarisand Mirocaris were more frequently observed here. They inhabited the mussel field in slightlyabundances between the mussels. Additionally chaetopterid,and terebellid annelidsas wellas Archinome c.f. rosacea lived within the byssus of Bathymodiolus puteoserpentis. The ventendemic fish Pachyara thermophilus was only seen here in the IRINA II site of LHF I. Twomore typical species, which belong to the accompanied fauna were the decapod crustaceansSegonzacia mesatlantica and the squat lobster Munidopsis crassa. Whereas Segonzaciamesatlantica was widely distributed at the smoker-complex as well on the mussel field,Munidopsis crassa was clearly patched. Munidopsis crassa was manly observed in inactiveregions at the northeast side of the smoker-complex, where an extinct field of dead musselswas located. In contrast Segonzacia mesatlantica was observed in the vicinity of shimmeringwater with temperatures ranging from 3°C to 8°C.
The fauna became impoverished at site “A”. Live specimens were only seen at the singleactive chimney Barad-Dûr. Single shrimps inhabited the tip region of the chimney whereblack fluids emerged. Additionally see-anemones (actinaria) were sitting here. Right in thevicinity of emerging fluids specimens of the gastropod Peltospira smaragdina were sampled.Those snails were also found at black smokers of IRINA II. Furthermore the vent crab
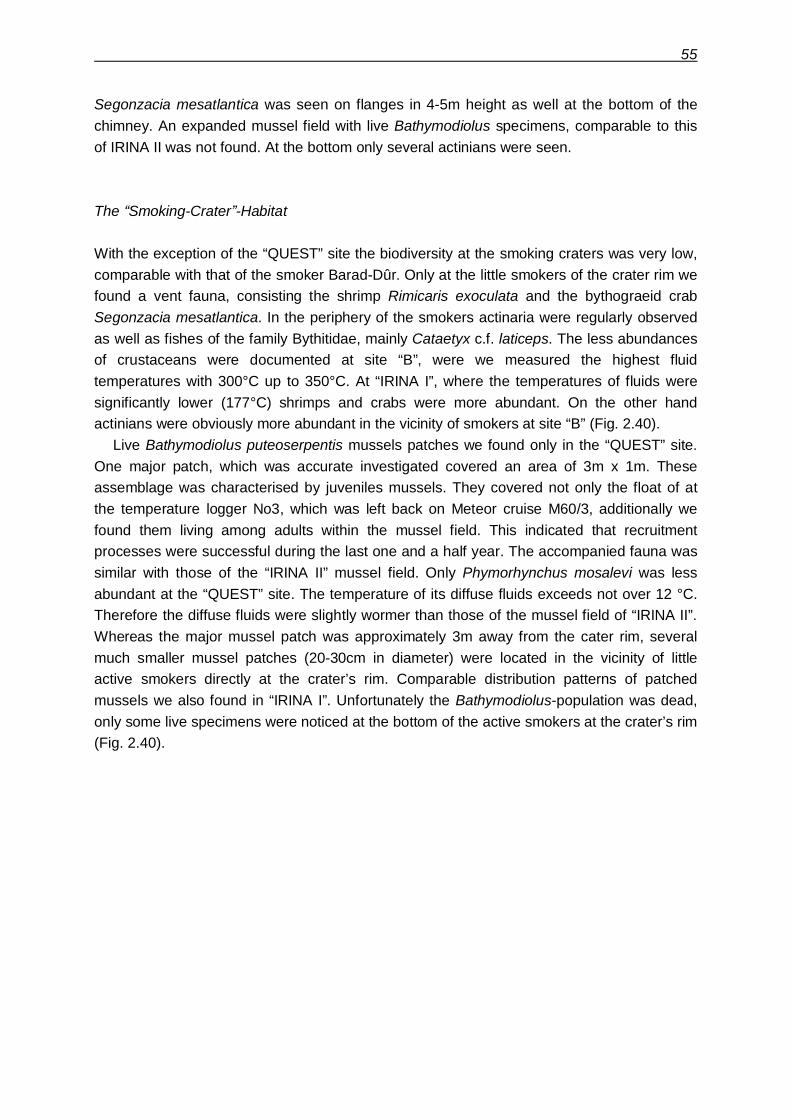
55
Segonzacia mesatlantica was seen on flanges in 4-5m height as well at the bottom of thechimney. An expanded mussel field with live Bathymodiolus specimens, comparable to thisof IRINA II was not found. At the bottom only several actinians were seen.
The Smoking-Crater -Habitat
With the exception of the “QUEST” site the biodiversity at the smoking craters was very low,comparable with that of the smoker Barad-Dûr. Only at the little smokers of the crater rim wefound a vent fauna, consisting the shrimp Rimicaris exoculata and the bythograeid crabSegonzacia mesatlantica. In the periphery of the smokers actinaria were regularly observedas well as fishes of the family Bythitidae, mainly Cataetyx c.f. laticeps. The less abundancesof crustaceans were documented at site “B”, were we measured the highest fluidtemperatures with 300°C up to 350°C. At “IRINA I”, where the temperatures of fluids weresignificantly lower (177°C) shrimps and crabs were more abundant. On the other handactinians were obviously more abundant in the vicinity of smokers at site “B” (Fig. 2.40).
Live Bathymodiolus puteoserpentis mussels patches we found only in the “QUEST” site.One major patch, which was accurate investigated covered an area of 3m x 1m. Theseassemblage was characterised by juveniles mussels. They covered not only the float of atthe temperature logger No3, which was left back on Meteor cruise M60/3, additionally wefound them living among adults within the mussel field. This indicated that recruitmentprocesses were successful during the last one and a half year. The accompanied fauna wassimilar with those of the “IRINA II” mussel field. Only Phymorhynchus mosalevi was lessabundant at the “QUEST” site. The temperature of its diffuse fluids exceeds not over 12 °C.Therefore the diffuse fluids were slightly wormer than those of the mussel field of “IRINA II”.Whereas the major mussel patch was approximately 3m away from the cater rim, severalmuch smaller mussel patches (20-30cm in diameter) were located in the vicinity of littleactive smokers directly at the crater’s rim. Comparable distribution patterns of patchedmussels we also found in “IRINA I”. Unfortunately the Bathymodiolus-population was dead,only some live specimens were noticed at the bottom of the active smokers at the crater’s rim(Fig. 2.40).
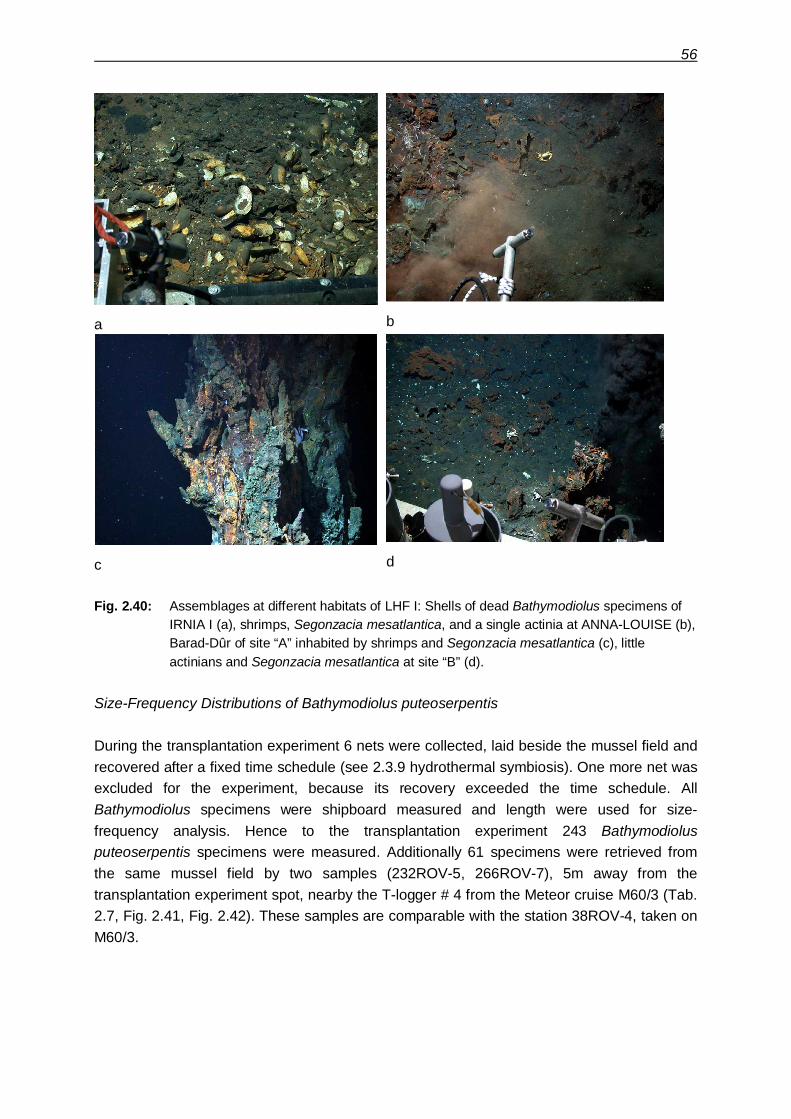
56
a b
c d
Fig. 2.40: Assemblages at different habitats of LHF I: Shells of dead Bathymodiolus specimens ofIRNIA I (a), shrimps, Segonzacia mesatlantica, and a single actinia at ANNA-LOUISE (b),Barad-Dûr of site “A” inhabited by shrimps and Segonzacia mesatlantica (c), littleactinians and Segonzacia mesatlantica at site “B” (d).
Size-Frequency Distributions of Bathymodiolus puteoserpentis
During the transplantation experiment 6 nets were collected, laid beside the mussel field andrecovered after a fixed time schedule (see 2.3.9 hydrothermal symbiosis). One more net wasexcluded for the experiment, because its recovery exceeded the time schedule. AllBathymodiolus specimens were shipboard measured and length were used for size-frequency analysis. Hence to the transplantation experiment 243 Bathymodiolusputeoserpentis specimens were measured. Additionally 61 specimens were retrieved fromthe same mussel field by two samples (232ROV-5, 266ROV-7), 5m away from thetransplantation experiment spot, nearby the T-logger # 4 from the Meteor cruise M60/3 (Tab.2.7, Fig. 2.41, Fig. 2.42). These samples are comparable with the station 38ROV-4, taken onM60/3.
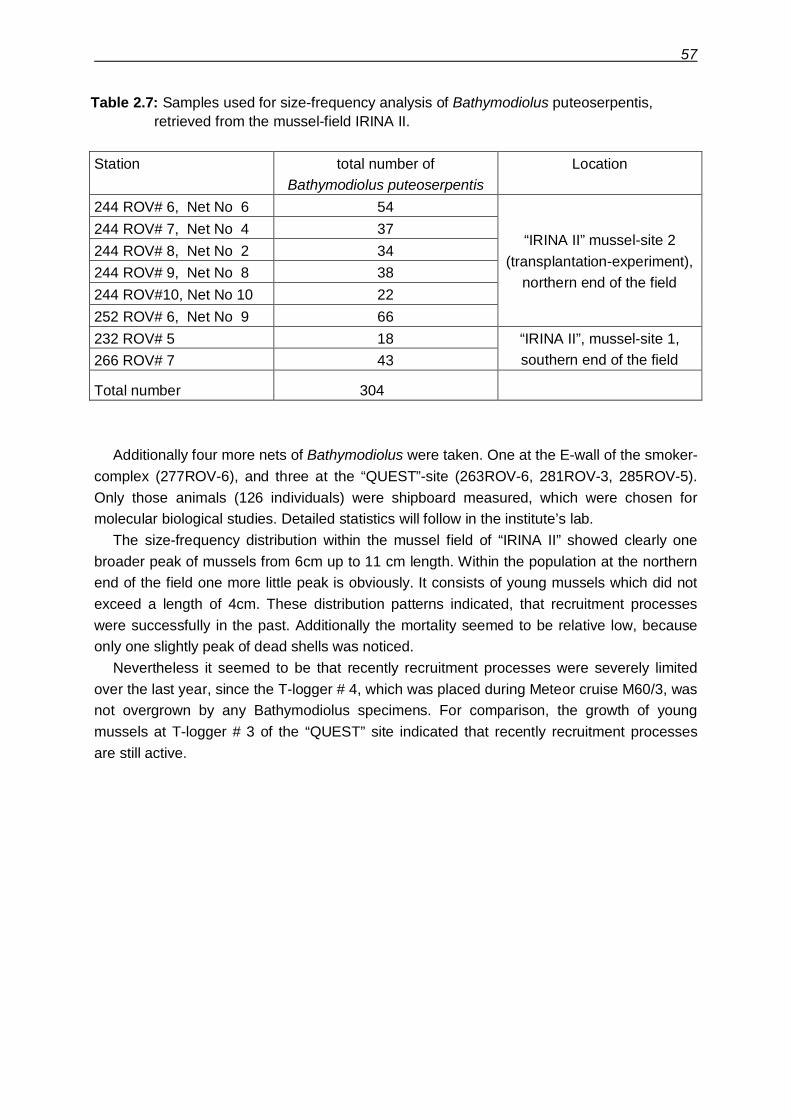
57
Table 2.7: Samples used for size-frequency analysis of Bathymodiolus puteoserpentis,retrieved from the mussel-field IRINA II.
Station total number ofBathymodiolus puteoserpentis
Location
244 ROV# 6, Net No 6 54244 ROV# 7, Net No 4 37244 ROV# 8, Net No 2 34244 ROV# 9, Net No 8 38244 ROV#10, Net No 10 22252 ROV# 6, Net No 9 66
“IRINA II” mussel-site 2(transplantation-experiment),
northern end of the field
232 ROV# 5 18266 ROV# 7 43
“IRINA II”, mussel-site 1,southern end of the field
Total number 304
Additionally four more nets of Bathymodiolus were taken. One at the E-wall of the smoker-complex (277ROV-6), and three at the “QUEST”-site (263ROV-6, 281ROV-3, 285ROV-5).Only those animals (126 individuals) were shipboard measured, which were chosen formolecular biological studies. Detailed statistics will follow in the institute’s lab.
The size-frequency distribution within the mussel field of “IRINA II” showed clearly onebroader peak of mussels from 6cm up to 11 cm length. Within the population at the northernend of the field one more little peak is obviously. It consists of young mussels which did notexceed a length of 4cm. These distribution patterns indicated, that recruitment processeswere successfully in the past. Additionally the mortality seemed to be relative low, becauseonly one slightly peak of dead shells was noticed.
Nevertheless it seemed to be that recently recruitment processes were severely limitedover the last year, since the T-logger # 4, which was placed during Meteor cruise M60/3, wasnot overgrown by any Bathymodiolus specimens. For comparison, the growth of youngmussels at T-logger # 3 of the “QUEST” site indicated that recently recruitment processesare still active.
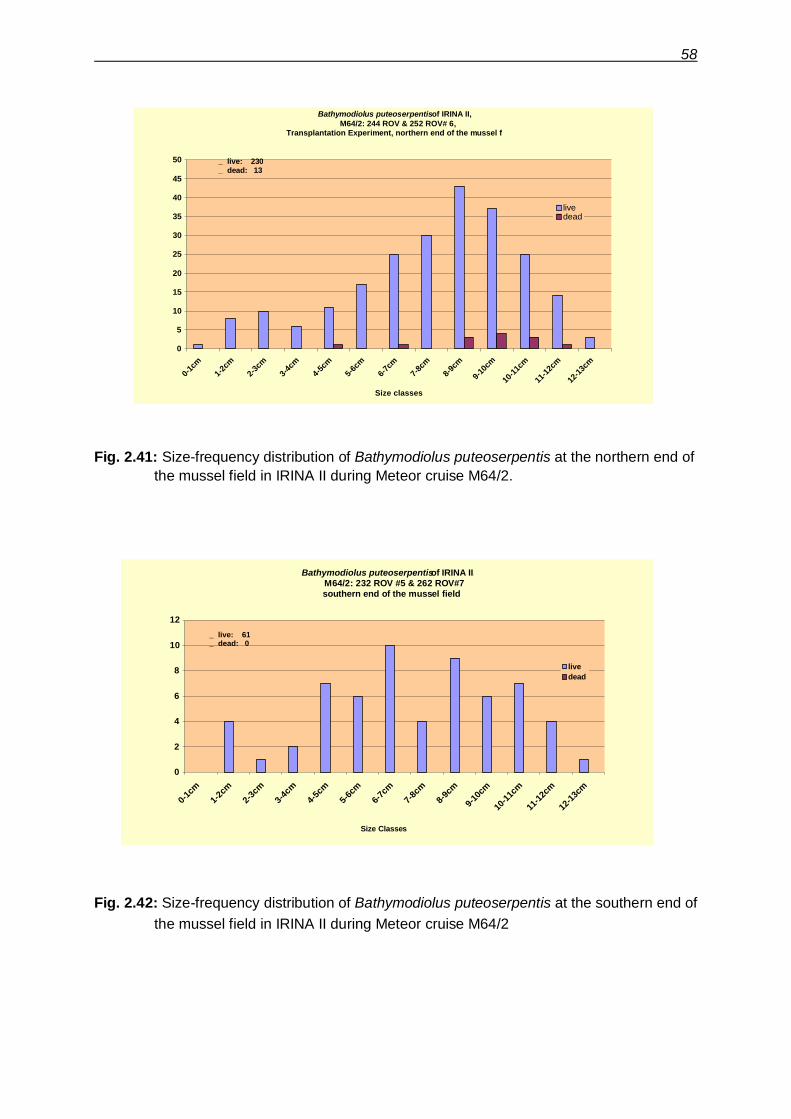
58
Fig. 2.41: Size-frequency distribution of Bathymodiolus puteoserpentis at the northern end ofthe mussel field in IRINA II during Meteor cruise M64/2.
Fig. 2.42: Size-frequency distribution of Bathymodiolus puteoserpentis at the southern end ofthe mussel field in IRINA II during Meteor cruise M64/2
Bathymodiolus puteoserpentis of IRINA II,M64/2: 244 ROV & 252 ROV# 6,
Transplantation Experiment, northern end of the mussel field
0
5
10
15
20
25
30
35
40
45
50
0-1cm
1-2cm
2-3cm
3-4cm
4-5cm
5-6cm
6-7cm
7-8cm
8-9cm
9-10c
m
10-11
cm
11-12
cm
12-13
cm
livedead
Size classes
_ live: 230_ dead: 13
Bathymodiolus puteoserpentis of IRINA II, M64/2: 232 ROV #5 & 262 ROV#7southern end of the mussel field
0
2
4
6
8
10
12
0-1cm
1-2cm
2-3cm
3-4cm
4-5cm
5-6cm
6-7cm
7-8cm
8-9cm
9-10c
m
10-11
cm
11-12
cm
12-13
cm
livedead
Size Classes
_ live: 61_ dead: 0
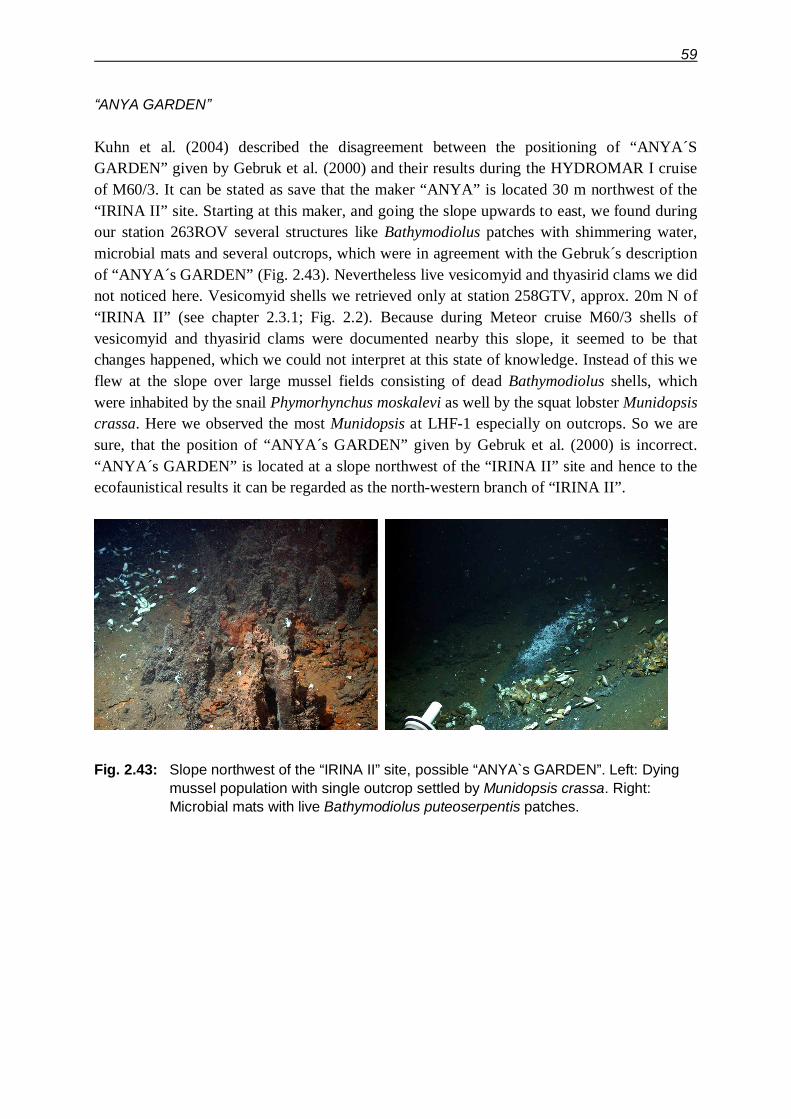
59
ANYA GARDEN
Kuhn et al. (2004) described the disagreement between the positioning of “ANYA´SGARDEN” given by Gebruk et al. (2000) and their results during the HYDROMAR I cruiseof M60/3. It can be stated as save that the maker “ANYA” is located 30 m northwest of the“IRINA II” site. Starting at this maker, and going the slope upwards to east, we found duringour station 263ROV several structures like Bathymodiolus patches with shimmering water,microbial mats and several outcrops, which were in agreement with the Gebruk´s descriptionof “ANYA´s GARDEN” (Fig. 2.43). Nevertheless live vesicomyid and thyasirid clams we didnot noticed here. Vesicomyid shells we retrieved only at station 258GTV, approx. 20m N of“IRINA II” (see chapter 2.3.1; Fig. 2.2). Because during Meteor cruise M60/3 shells ofvesicomyid and thyasirid clams were documented nearby this slope, it seemed to be thatchanges happened, which we could not interpret at this state of knowledge. Instead of this weflew at the slope over large mussel fields consisting of dead Bathymodiolus shells, whichwere inhabited by the snail Phymorhynchus moskalevi as well by the squat lobster Munidopsiscrassa. Here we observed the most Munidopsis at LHF-1 especially on outcrops. So we aresure, that the position of “ANYA´s GARDEN” given by Gebruk et al. (2000) is incorrect.“ANYA´s GARDEN” is located at a slope northwest of the “IRINA II” site and hence to theecofaunistical results it can be regarded as the north-western branch of “IRINA II”.
Fig. 2.43: Slope northwest of the “IRINA II” site, possible “ANYA`s GARDEN”. Left: Dyingmussel population with single outcrop settled by Munidopsis crassa. Right:Microbial mats with live Bathymodiolus puteoserpentis patches.
60
2.5 Weather conditions
(W. T. Ochsenhirt)
In the afternoon of May 06 2005 FS METEOR left the port of Fortaleza for leg M64/2. Theweather to the beginning of the voyage was dominated by a ridge of a subtropical high in theSouthwest Atlantic and METEOR encountered south-easterly trade winds of 4 to 5 Bft.One day later, in the early morning, near 01° South a first larger cloud belt associated withshowers was passed.On the next day METEOR crossed the ITCZ (Inter Tropical Convergence Zone)accompanied by frequent and heavy showers and gusty winds up to Bft 6 from variabledirections. The normal wind direction outside of the tropical shower area was southeast atfirst and became east to northeast later. Wind speeds without disturbances ranged from 4 to5 Bft.The northern edge of the ITCZ extended from 08°N 15°W to 07°N 38°W during this period.METEOR arrived in the area of investigation near 14,8°N 45,0°W on May 10 in the afternoon.This region was still under the influence of the tradewindsystem and steady easterly winds of4 to 6 Bft predominated with most frequent wind speed of Bft 5.On some days the wind decreased to Bft 3. During the whole time of station work theweather was mostly fair with only few periods of light precipitation.The swell came from easterly directions with height of 1.5 to 2 m, in cases of two swells fromdifferent origin up to 3m.In the evening of May 29 METEOR left the working area with easterly course to Dakar. Onthe transit the centre of the subtropical high was just south of the Azores. Easterly winds ofabout 5 Bft backed to Northeast and North and decreased gradually.In the forenoon of June 04 the voyage ended in the port of Dakar.
2.6 Acknowledgments
We would like to thank Captain Kull and his crew for their professionality and exceptionallyhard work during the cruise, which contributed to the success of the expedtion. Furthermore,we acknowledge the professional patronage of the German Ministry of Foreign Affairs as wellas Captain Berkenheger at the Leitstelle Meteor.We wish to thank the German Science Foundation (DFG) for funding the cruise andsubsequent analytical work in the framework of the priority programm SPP 1144 “Frommantle to ocean: Energy-, material-, and life cycles at spreading axes”.
61
2.7 References
Amann R.I., Ludwig W., Schleifer K.H. (1995) Phylogenetic identification and in situ detectionof individual microbial cells without cultivation. Microbiol. Rev. 59:143-169.
Douville E., Charlou J. L., Oelkers E. H., Bienvenu P., Jove Colon C. F., Donval J. P.,Fouquet Y., Prieur D., and Appriou P. (2002) The Rainbow vent fluids (36° 14'N, MAR):the influence of ultramafic rocks and phase separation on trace metal content in Mid-Atlantic Ridge hydrothermal fluids. Chemical Geology 184, 37-48.
Gebruk, A.V., Moskalev, L.I., Chevaldonné, P., Sudarikov, S.M. and Chernyaev, E.S. (1997)Hydrothermal vent fauna of the Logatchev area (14°45’N, MAR): preliminary results fromfirst ‘Mir’ and ‘Nautile’ dives in 1995. InterRidge News, 6, 10-14.
Gebruk, A.V., Chevaldonné, P., Shank, T. Lutz, R.A. and Vrijenhoek (2000) Deep-seahydrothermal vent communities of the Logatchev area (14°45’N, Mid-Atlantic Ridge):diverse biotopes and high biomass. J. Mar. Biol., 80, 383-393.
Grasshoff, K., Kremling, K., Ehrhardt, M., 1999. Methods of Seawater Analysis. 3rd edition,600 p., Wiley-VCH.
Handelsman, J., Liles, M., Mann, D., Riesenfeld, C., and Goodman, R.M. (2002) Cloning themetagenome: Culture-independent access to the diversity and functions of theuncultivated microbial world. In Functional Microbial Genomics. San Diego: ACADEMICPRESS INC, pp. 241-255.
Kelley, D.S., Baross, J.A., and Delaney, J.R. (2002) Volcanoes, fluids, and life at mid-oceanridge spreading centers. Annual Review of Earth and Planetary Sciences 30: 385-491.
Krasnov, S., Cherkashev, G., Stepanova, T., Batuyev, B., Krotov, A., Malin, B., Maslov, M.,Markov, V., Poroshina, I., Samovarov, M.A., Lazereva, L., and Ermolayev, I. (1995):Detailed geological studies of hydrothermal fields in the North Atlantic: Geol. Soc. Spec.Publ. 87: 43-64.
Kuhn, T. and cruise participants (2004). Mineralogical, geochemical and biologicalinvestigations of hydrothermal systems on the Mid-Atlantic Ridge between 14°45’N and15°05’N (HYDROMAR I). Meteor Berichte 03-04, Mid-Atlantic Expedition 2004, CruiseNo. 60, Leg 3, Leitstelle Meteor, Institut für Meereskunde der Universität Hamburg.
Localli, C., Torsi, G., 2001. Voltammetric trace metal determinations by cathodic and anodicstripping voltammetry in environmental matrices in the presence of mutual interference.Journal of Electroanalytical Chemistry 509, 80-89.
Obata, H., van den Berg, C.M.G., 2001. Determination of picomolar levels of iron in seawaterusing catalytic stripping voltammetry. Analytical Chemistry 73, 2522- 2528.
Riesenfeld, C.S., Goodman, R.M., and Handelsman, J. (2004) Uncultured soil bacteria are areservoir of new antibiotic resistance genes. Environ Microbiol 6: 981-989.
Seifert, R., Delling, N., Richnow, H.H., Kempe, S., Hefter, J., and Michaelis, W.(1999).Ethylene and methane in the upper water column of the subtropical Atlantic.Biogeochemistry 44, 73-91.
van Damm, K.L., 2004. Evolution of the hydrothermal system at the East Pacific Rise 9°50’N:geochemical evidence for changes in the upper oceanic crust. In: Mid-Ocean Ridges:Hydrothermal Interactions between the Lithosphere and Oceans.
Wenzhöfer F, Holby O, Glud RN, Nielsen HK, Gundersen JK (2000) In situ microsensorstudies of a shallow water hydrothermal vent at Milos, Greece. Marine Chemistry 69, 43-54.
Wenzhöfer F, Glud RN (2002) Benthic carbon mineralization in the Atlantic: A synthesisbased on in situ data from the last decade. Deep-Sea Research I 49(7), 1255-1279.