Embed Size (px)
Citation preview
VELOCITY PATTIERNS AND BED MORPHOLOGY 105
Copyright © 2004 John Wiley & Sons, Ltd. Earth Surf. Process. Landforms 29, 105–114 (2004)
Earth Surface Processes and Landforms
Earth Surf. Process. Landforms 29, 105–114 (2004)Published online in Wiley InterScience (www.interscience.wiley.com). DOI: 10.1002/esp.1021
LONGITUDINAL VELOCITY PATTERNS AND BED MORPHOLOGYINTERACTION IN A RILL
RAFAEL GIMÉNEZ1*, OLIVIER PLANCHON2, NORBERT SILVERA2 AND GERARD GOVERS1
1 Laboratory for Experimental Geomorphology, Catholic University of Leuven, Redingenstraat 16, 3000 Leuven, Belgium2 IRD – Institut de Recherche pour le Développement, BP 1386 Dakar, Senegal
Received 22 November 2002; Revised 25 March 2003; Accepted 30 April 2003
ABSTRACT
Present-day understanding of rill dynamics is hampered by a lack of detailed data on velocity distributions in rills. The latterare difficult to collect with traditional techniques due to the very low water depths and the relatively high flow velocitiesin rills. The objectives of this paper were to investigate the feasibility of miniaturized acoustic Doppler velocimeter (mADV)measurements in rill flow and to explore longitudinal variations in flow velocities and their relationship with rill bedmorphology. Detailed data on longitudinal flow velocity were required to achieve these objectives.
A 1·8 m long rill was formed freely in a flume at 5° slope and 0·001 m3 s−1 discharge. Rill topography was characterizedby an alternation of steps and pools. The flume surface was then fixed to preserve rill roughness. A topographical scanningof the entire flume surface was made. Velocity was measured with a mADV along the rill, and at different depths. Flow depthin a longitudinal direction was also measured using an elevation gauge.
A strong relationship exists between rill topography and flow hydraulics. Over steps, flow was unidirectional and rapidlyaccelerating until a threshold Froude number (Fn) value between 1·3 and 1·7 was reached and a hydraulic jump occurredleading to the formation of a pool. In the pool, the flow pattern was multidirectional and complex. The flow was subcriticalwhen leaving the pool and accelerated over the next step until the threshold Froude number value was again reached. Energyloss in the rill was concentrated in the pools, mainly due to the action of a hydraulic jump. This mechanism of energy dissipa-tion appeared to be an essential factor in rill formation and bedform evolution. Copyright © 2004 John Wiley & Sons, Ltd.
KEY WORDS: velocity variation; rill flow velocity; step-pool bedforms
INTRODUCTION
Rills eroding cohesive materials are hydraulically different from alluvial rivers or large channels. Unlike rivers,rills are small, concentrated flow paths whose depth is of the order of only a few millimetres to centimetres andthey have a relatively steep slope gradient. Also, rills evolve morphologically over much shorter timescales thanrivers due to active bed erosion (Nearing et al., 1997; Lei et al., 1998).
Govers (1992) showed that the flow velocity in rills eroding loose, non-layered materials could be predictedfrom knowledge of discharge only, without a significant slope or soil effect. This finding has since then beenconfirmed by other authors such as Nearing et al. (1997, 1999), Takken et al. (1998), and Giménez and Govers(2001). Giménez and Govers (2001) were able to show that a feedback between bed morphology and flowhydraulics was a key factor in understanding this slope independence of flow velocity: bed roughness increasedwith slope gradient, thereby reducing flow velocity. Giménez and Govers also observed that the average Froudenumber (Fn) in eroding rills was roughly constant, as previously reported by Grant (1997) for a wide varietyof streams with slopes exceeding 1 per cent and cohesionless bed material, and by Tinkler (1997) for the centralthread of rockbed streams. Grant (1997) hypothesized that the near-critical, constant Fn observed in steep riversis a consequence of a cyclical pattern of creation and destruction of bed forms, provided that there exists a flowwith sufficient erosive power. This cyclical process is associated with cyclical changes of flow regimes (i.e. flowenergy): from supercritical (i.e. Fn > 1) to subcritical (i.e. Fn < 1) along the whole stream, resulting in a near-critical average Fn.
* Correspondence to: R. Giménez, Laboratory for Experimental Geomorphology, Catholic University of Leuven, Redingenstraat 16, 3000Leuven, Belgium. E-mail: [email protected]
106 R. GIMÉNEZ ET AL.
Copyright © 2004 John Wiley & Sons, Ltd. Earth Surf. Process. Landforms 29, 105–114 (2004)
The mechanism responsible for the bed geometry–flow hydraulics feedback in rills cannot be entirely the sameas the one reported by Grant because the rill bed consists of cohesive material and no mobile bedforms (Giménezand Govers, 2001). Therefore, Giménez and Govers (2001) proposed the following mechanism to explain theirobservations. Flow over a smooth bed on a steep slope is supercritical. Due to small local variations in flowdepth, velocity and erosion resistance of the soil, local erosion occurs that leads to the formation of a smalldepression in the bed, which causes a hydraulic jump. Due to energy dissipation within the jump, additional localerosion occurs and a pool is formed. Within the pool, the flow is subcritical. The flow then accelerates in thedownstream direction to become supercritical again and the whole process is repeated. This leads to a successionof pools, with subcritical flow, and steps, with supercritical flow. Giménez and Govers (2001) suggested that anincrease in the slope reduces the distance needed to reach supercritical flow downstream from a pool. Conse-quently, the average number of pool–step systems per length unit will also increase with slope, but the averageflow velocity will remain constant. It should be mentioned that the concept of relating rill initiation and evolutionto the flow’s Fn was already suggested by Savat and De Ploey (1982) who proposed that rills could only formwhen the flow exceeded a critical Fn value. However, they conceived this process as unidirectional rather thanas bidirectional.
The hypothesis proposed by Giménez and Govers has not been tested yet. Conventional techniques used tomeasure flow velocities (e.g. dye tracing and surface tracing techniques with the aid of video recording) are notappropriate to obtain velocity data with the required accuracy and resolution. Recent developments in acousticDoppler velocimeter (ADV) techniques make it possible to obtain detailed velocity measurements not only inrelatively large channels (e.g. Robinson et al., 2000) but also in much narrower streams such as a rill. By usinga miniaturized acoustic Doppler velocimeter (mADV) detailed velocity measurements are now possible in flowswith a width of only 75 mm and a depth of only 20 mm.
The objectives of this study were to test the hypothesis of Gimenéz and Govers (2001) by investigatingwhether rill flow is indeed characterized by an alternation of sub- and supercritical flow reaches and, if so, howthese variations are related to rill bed morphology. In order to achieve these objectives, detailed data onlongitudinal variations in rill flow hydraulics were collected using an mADV probe.
MATERIALS AND METHODS
Set-up
The experiment was carried out in a flume 4·50 m long, 0·4 m wide and 0·45 m deep with a test section of2·5 m length, which is described in detail by Giménez and Govers (2001). The lower 0·2 m of the flume wasfilled with a silt loam soil, which was manually compacted to simulate a subsoil: some characteristics of the soilmaterial used are presented in Table I. The upper 0·25 m part of the test section was filled with the same soilbut sieved at 20 mm in order to simulate fine seedbed conditions. The surface was smoothed with a rake, creatinga 0·25–0·3 m wide and 50 mm deep longitudinal central depression with a flat bottom. The soil was then gentlymoistened to saturation and then left to drain to field capacity.
Rill formation and bed fixing
A rill was created in the topsoil of the test section in different stages as follows. The flume was set at a slopeof 5°, and a discharge of 0·001 m3 s−1 was applied for one minute. The average flow velocity was measured using
Table I. Soil characteristics
Grain-size classes (%)
<2 µm >50 µm 2–50 µm D50 (µm) Org. matter (%)
4·56 23·69 71·75 31·68 0·71
The granulometric analysis was done using laser diffractometry (Beuselincket al., 1998).
VELOCITY PATTIERNS AND BED MORPHOLOGY 107
Copyright © 2004 John Wiley & Sons, Ltd. Earth Surf. Process. Landforms 29, 105–114 (2004)
a dye-tracing technique. Potassium permanganate solution was used as a dye, a small amount of which wasinjected 0·3–0·4 m upstream of the measurement section. Flow velocities were then measured by recording thetravel time of the dye cloud over a distance of 1 m. The average travel time was taken as the mean of fivemeasurements. The calculated velocities were multiplied by a correction factor of 0·94 as used by Govers (1992).The flume was then replaced in a horizontal position and a laser scanning of 18 cross-sections spaced 0·1 m apartwas carried out. The system used for laser scanning is similar to the one described by Huang et al. (1988). Ahorizontal resolution of 1 mm was used. The vertical accuracy of the system is c. 0·1 mm. In order to obtainapproximate longitudinal profiles of the rill at each stage of its development, the lowest point of each of the 18cross-sections scanned after each experimental stage was determined: these points were then connected with astraight line to obtain an approximate longitudinal profile of the rill.
The entire operation described above was repeated seven times (i.e. the aforementioned discharge was appliedduring a total time of 7 min). During the entire operation, the downslope wall of the flume was lowered regularlyin order to avoid significant deposition in the test section, which would affect rill formation. After 7 min, a well-defined rill was formed and flow conditions were at equilibrium, i.e. average flow velocity no longer changedsignificantly over time.
The flume surface was then fixed by spraying the entire surface with polyester resin diluted in acetone (1:5).Spraying was continued until resin infiltration stopped. Three applications of resin were carried out. Betweenapplications, the flume surface was then left for 3–5 hours so that the resin could further infiltrate. After the finalapplication, the resin was left to dry. Drying was accelerated using infrared lamps and a fan heater and resultedin the stabilization of the rill surface without affecting the rill bed topography. Velocities measured using dyetracing in the fixed rill were compared to those measured during the final stage of rill formation, using the samedischarge and slope settings. The values that were obtained were very similar: 0·45 ± 0·066 m s−1 and0·48 ± 0·054 m s−1, respectively. This confirms that the resin application did not affect the rill bed roughnesssignificantly.
After drying, the flume was placed in a horizontal position and a topographical scan of the central 1·8 m lengthof the test surface was made using a 1 mm horizontal interval in the transverse direction and a 2 mm horizontalinterval in the longitudinal direction. A detailed longitudinal profile of the fixed rill was obtained from the DEMof the rill surface by selecting the lowest height value measured at every cross-section.
Experiments in the fixed rill
For the fixed rill experiments, the flume was replaced to the same slope used to create the rill (i.e. 5°) andthe same discharge was applied (i.e. 0·001 m3 s−1). Detailed information on rill hydraulics was collected usingvarious techniques.
Flow depth measurements. In order to obtain flow depths, the height of the water surface and of the lowestpoint of the rill bed was taken at 0·01 m intervals in the longitudinal direction using an elevation gauge witha precision of 0·2 mm that was mounted on a mobile frame on top of the flume. These measurements resultedin a rill bottom longitudinal profile, and a water surface profile. The rill bottom profile data were used to registerthe elevation gauge measurements with the laser scanner system of co-ordinates. The maximum water depth wasthen calculated by subtracting the laser bottom profile from the water surface profile.
mADV measurements. A miniaturized acoustic Doppler velocimeter (mADV; Figure 1) (SonTek, 1997) wasused to obtain accurate average velocity measurements. The mADV head consists of a cylindrical transmitterat the centre, which is 13 mm in diameter, and two smaller receivers located at 37·5 mm at each side of thetransmitter. The sampling volume is 5 mm3 and is located 50 mm in front of the transmitter (Figure 1).
Measurements were carried out placing the mADV transmitter facing upstream so that the measurement headdid not have an effect on the flow pattern within the sampling volume. The velocity determined at each samplingvolume was calculated as an average of 100 readings, resulting in an accuracy of ±1 per cent. In order for themADV to function properly the transmitter, the receivers, and the entire signal track from the transmitter to thesampling volume and back to the receivers must be fully submerged. In some places in the rill, completesubmergence was not possible and hence no measurement could be carried out (Figure 2).
Two mADV measurements were taken every 10 mm along the central axis of the rill, refered to asbottom and surface velocity. The surface velocity measurement was taken c. 7 mm below the water surface,

108 R. GIMÉNEZ ET AL.
Copyright © 2004 John Wiley & Sons, Ltd. Earth Surf. Process. Landforms 29, 105–114 (2004)
Figure 1. (A) Sketch of the mADV probe geometry; (B) photo of the mADV over the fixed rill. Flow is from front to back of the picture
which is the minimal depth at which the mADV can be operated. The bottom velocity was taken by placingthe probe as deeply as possible in the rill. However, because there is a 50 mm distance between the trans-mitter and the sampling volume and the rill geometry varied significantly, the absolute height above the rillbottom at which measurements were taken was not constant. At some locations, the surface and bottom velocity
Figure 2. Longitudinal velocities along the rill. Positive velocity indicates forward flow, negative velocity indicates backward flow

VELOCITY PATTIERNS AND BED MORPHOLOGY 109
Copyright © 2004 John Wiley & Sons, Ltd. Earth Surf. Process. Landforms 29, 105–114 (2004)
measurements had to be taken at almost the same depth due to the low water depth, resulting in almost identicalvalues (Figure 2). The average of bottom and surface velocities was used in all further calculations (e.g. Fndetermination).
RESULTS AND DISCUSSION
Rill bed morphology
The longitudinal height profile of the rill shows a succession of steps and pools (Figure 3): in the testsection two well-defined pools were formed with approximately the same dimensions. Pool depth was c. 60 mmand pool length c. 320 mm. The pools were not symmetric: their downstream wall was steeper than theirupstream wall. Between the two major pools, a small, embryonic pool was formed with a maximum depth ofonly 25 mm. All pools were separated by ‘steps’. The slope gradient of the step surface was very close to theaverage slope gradient and each step was between 150 and 250 mm long. The average rill width was around70–80 mm except in short V-shaped notches on the upstream pool brink where it suddenly decreased to 25–30 mm (see Figure 4).
Velocity pattern
Overall, consistent velocity measurements were obtained with the mADV. The data from the mADV showthat the flow was unidirectional on the steps: average bottom and surface velocities were both positive. Within
Figure 4. Plan view of a mature pool. A V-shaped notch is clearly observed upstream. Flow is from left to right. Flume is 40 cm wide
Figure 3. Longitudinal height profile of the rill where topographic features are indicated. Steps and pools are identified by numbers andletters, respectively: in the text, the different steps and pools are referred to by the same numbers and letters

110 R. GIMÉNEZ ET AL.
Copyright © 2004 John Wiley & Sons, Ltd. Earth Surf. Process. Landforms 29, 105–114 (2004)
the pools the flow became multidirectional (i.e. water flowing downstream and upstream at different flow depths,Figure 2): the flow pattern within the pools was described and analysed in detail by O. Planchon et al. (workin preparation). It is worth pointing out that the multidirectional velocity pattern was not only observed in themature pools, but also in the embryonic pool (Figure 2). Generally, the surface velocities were somewhat (<10per cent) higher than the corresponding bottom velocities (Figure 2): the small difference between bottom andsurface velocity indicates that the vertical velocity gradient on the steps was quite low. The flow over the stepsaccelerated from the exit of pools, where measured velocities were as low as c. 0·20 ± 0·06 m s−1 up to imme-diately before the brink of the next pool downstream, where it reached a more or less constant value ofc. 0·70 ± 0·06 m s−1 (Figure 2).
Froude number pattern
The Froude number, Fn, for open channel flow is defined as:
Fn =
v
gd(1)
where v is flow velocity, g is gravitational acceleration and d is flow depth.Fn calculations in this study were based on local values of velocity and flow depth. Consequently, Fn values
were assessed only for a narrow vertical panel of water along the central flow thread. Strictly, this is the onlycorrect approach to calculate the Fn in flows with important lateral variations (Ligget, 1993; Tinkler, 1997).
Meaningful values of Fn could only be calculated in the zones where flow is unidirectional, i.e. at the poolexits and on the steps. The calculation of Fn in the pools was considered to be meaningless due to the occurrenceof multidirectional flow.
Froude numbers increased from the pool exit, where flow was subcritical, towards the brink of the down-stream pool (Figure 5). At the onset of the brink, Fn reached values between 1·3 and 1·7. A similar pattern wasobserved in both the major pools and in the embryonic pool: the flow was supercritical when entering the pooland subcritical when leaving it (Figure 5). Fn could not be calculated at the chute (i.e. the sloping, narrow rillsection at the entrance of the pool) as no velocity measurements were available because of the shallow flowdepths and the small rill width.
Thus, our measurements show that there were important longitudinal variations of flow velocity and Fn alongthe rill. However, the pattern did not consist of a simple alternation of supercritical and subcritical flow zones,as hypothesized by Giménez and Govers (2001). At the pool exit, flow was indeed unidirectional and subcritical.The flow then accelerated over the step until the Fn reached values well above 1. A hydraulic jump occurredwhen the flow entered the pool. In the pools, flow was not simply subcritical, but displays a rather complex,multidirectional pattern.
Figure 5. Local Froude number pattern along the rill. Values within the pools are not considered (see text for explanation)
VELOCITY PATTIERNS AND BED MORPHOLOGY 111
Copyright © 2004 John Wiley & Sons, Ltd. Earth Surf. Process. Landforms 29, 105–114 (2004)
Energy gradient along the rill
The total energy of a streamline, H, can be estimated as (e.g. Chow, 1985, p. 39):
H z d
v
g = + +
2
2(2)
where z is elevation of a certain defined point above a datum plane, d is depth of this point below the watersurface (i.e. pressure head), v is velocity of the flow in the streamline passing through the point and g isgravitational acceleration.
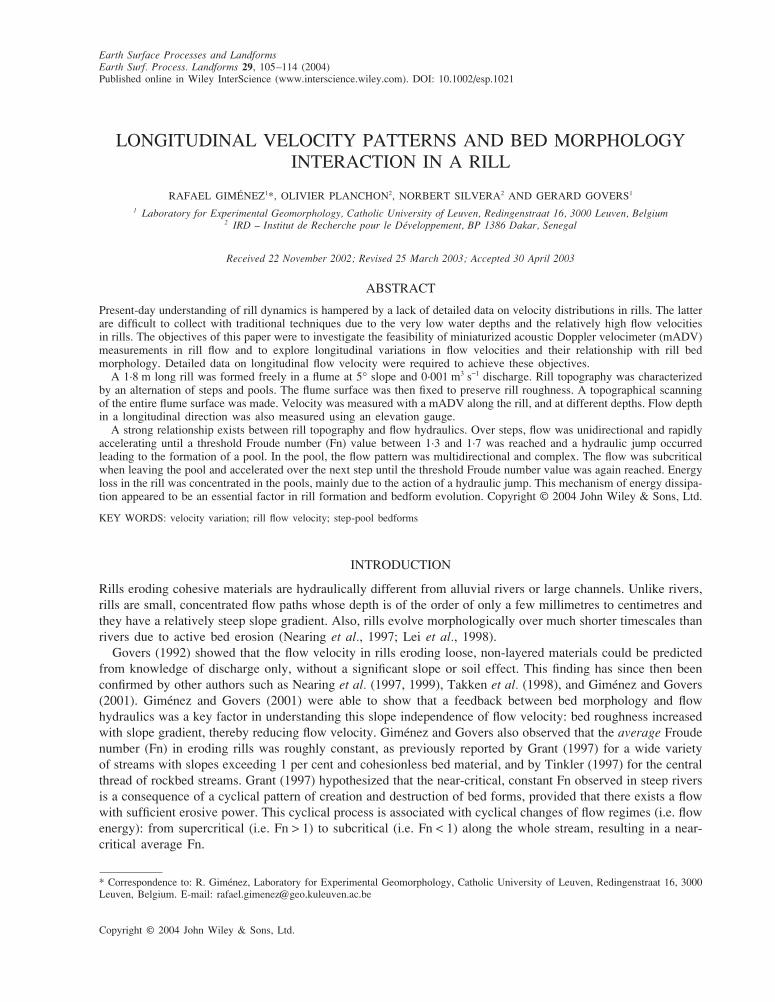
Ignoring minor disturbances due to turbulence, H can be estimated only on the steps and at the pool exits,where the streamlines have neither appreciable curvature nor divergence, i.e. hydrostatic pressure distributioncan be assumed. However, H cannot be estimated in the pools where the pressure gradient is not hydrostatic dueto the high turbulence of flow (Chow, 1985, p. 30). It can be seen that the energy line is almost horizontal fromthe pool exit to the step brink (Figure 6): the decrease on potential energy (i.e. z) is roughly counteracted bythe increase in velocity (i.e. kinetic energy). Within the pools important energy dissipation took place. The lowgradient of the energy line on the steps, combined with the low flow depths implies that the shear stress in theseareas was quite low.
Energy dissipation in pools
A pool has a morphological structure which is to some extent similar to a drop structure as defined elsewhere(Chanson, 1999, p. 355). Energy dissipation within a drop structure is mainly a consequence of two mechanisms:part of the flow energy is dissipated by the chute impact (i.e. chute impingement) and then the residual energyis dissipated by a hydraulic jump located downstream of the chute toe. For a chute flow situation (i.e. asuccession of drop structures; Chanson, 1999, p. 362), the relative energy loss on the cascade up to the hydraulicjump, Φcas, can be estimated as follows (Chanson, 1999, p. 363):
Φcas = 1 − Φj = 1 −
0 54 1715
15
0 275 0 55
⋅
+ ⋅
⋅ +
⋅ − ⋅dc
z
dc
z
z
dc
∆ ∆∆
(3)
where:
Φcas =
∆H
H
cas
b
Φj =
∆H
H
j
b
Figure 6. Total energy of the flow at different sections along the rill with reference to a datum line. Lines were obtained by regression
112 R. GIMÉNEZ ET AL.
Copyright © 2004 John Wiley & Sons, Ltd. Earth Surf. Process. Landforms 29, 105–114 (2004)
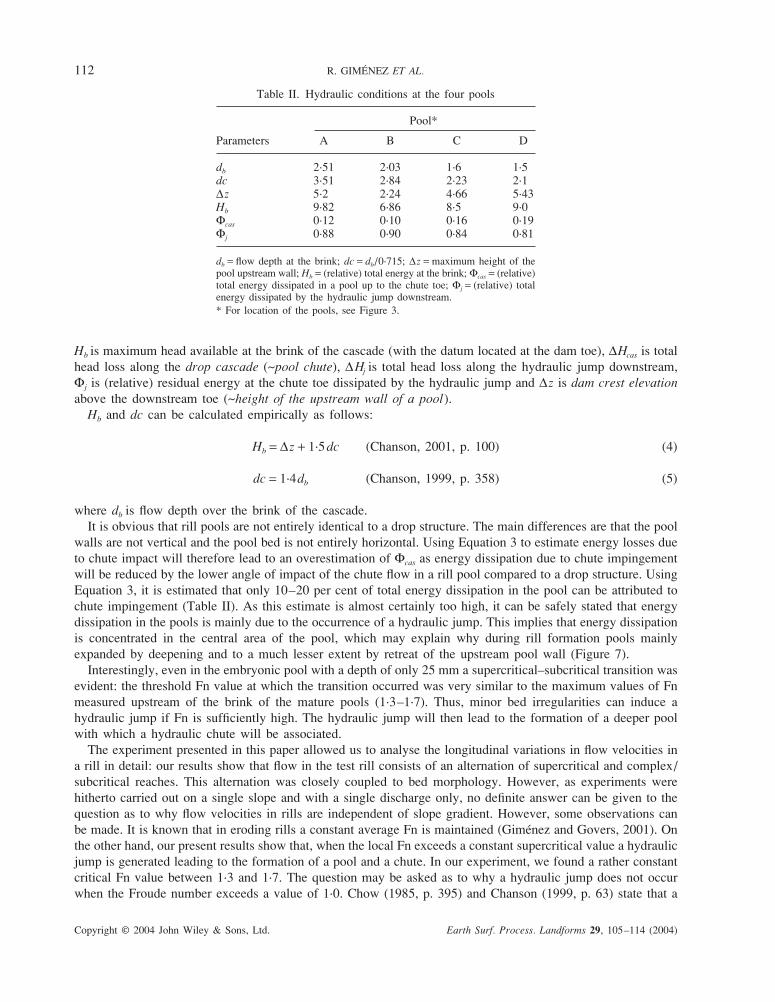
Table II. Hydraulic conditions at the four pools
Pool*
Parameters A B C D
db 2·51 2·03 1·6 1·5dc 3·51 2·84 2·23 2·1∆z 5·2 2·24 4·66 5·43Hb 9·82 6·86 8·5 9·0Φcas 0·12 0·10 0·16 0·19Φj 0·88 0·90 0·84 0·81
db = flow depth at the brink; dc = db/0·715; ∆z = maximum height of thepool upstream wall; Hb = (relative) total energy at the brink; Φcas = (relative)total energy dissipated in a pool up to the chute toe; Φj = (relative) totalenergy dissipated by the hydraulic jump downstream.* For location of the pools, see Figure 3.
Hb is maximum head available at the brink of the cascade (with the datum located at the dam toe), ∆Hcas is totalhead loss along the drop cascade (~pool chute), ∆ Hj is total head loss along the hydraulic jump downstream,Φj is (relative) residual energy at the chute toe dissipated by the hydraulic jump and ∆z is dam crest elevation
above the downstream toe (~height of the upstream wall of a pool).Hb and dc can be calculated empirically as follows:
Hb = ∆z + 1·5dc (Chanson, 2001, p. 100) (4)
dc = 1·4db (Chanson, 1999, p. 358) (5)
where db is flow depth over the brink of the cascade.It is obvious that rill pools are not entirely identical to a drop structure. The main differences are that the pool
walls are not vertical and the pool bed is not entirely horizontal. Using Equation 3 to estimate energy losses dueto chute impact will therefore lead to an overestimation of Φcas as energy dissipation due to chute impingementwill be reduced by the lower angle of impact of the chute flow in a rill pool compared to a drop structure. UsingEquation 3, it is estimated that only 10–20 per cent of total energy dissipation in the pool can be attributed tochute impingement (Table II). As this estimate is almost certainly too high, it can be safely stated that energydissipation in the pools is mainly due to the occurrence of a hydraulic jump. This implies that energy dissipationis concentrated in the central area of the pool, which may explain why during rill formation pools mainlyexpanded by deepening and to a much lesser extent by retreat of the upstream pool wall (Figure 7).
Interestingly, even in the embryonic pool with a depth of only 25 mm a supercritical–subcritical transition wasevident: the threshold Fn value at which the transition occurred was very similar to the maximum values of Fnmeasured upstream of the brink of the mature pools (1·3–1·7). Thus, minor bed irregularities can induce ahydraulic jump if Fn is sufficiently high. The hydraulic jump will then lead to the formation of a deeper poolwith which a hydraulic chute will be associated.
The experiment presented in this paper allowed us to analyse the longitudinal variations in flow velocities ina rill in detail: our results show that flow in the test rill consists of an alternation of supercritical and complex/subcritical reaches. This alternation was closely coupled to bed morphology. However, as experiments werehitherto carried out on a single slope and with a single discharge only, no definite answer can be given to thequestion as to why flow velocities in rills are independent of slope gradient. However, some observations canbe made. It is known that in eroding rills a constant average Fn is maintained (Giménez and Govers, 2001). Onthe other hand, our present results show that, when the local Fn exceeds a constant supercritical value a hydraulicjump is generated leading to the formation of a pool and a chute. In our experiment, we found a rather constantcritical Fn value between 1·3 and 1·7. The question may be asked as to why a hydraulic jump does not occurwhen the Froude number exceeds a value of 1·0. Chow (1985, p. 395) and Chanson (1999, p. 63) state that a

VELOCITY PATTIERNS AND BED MORPHOLOGY 113
Copyright © 2004 John Wiley & Sons, Ltd. Earth Surf. Process. Landforms 29, 105–114 (2004)
Figure 7. Longitudinal height evolution of the rill along time. t1–t7 are periods of 1 minute in increasing order; t0 is soil surface beforethe erosion process started
clear hydraulic jump, with significant energy losses, will only occur when Fn exceeds 1·7. For lower values ofFn, undular flow occurs, with negligible energy losses. It should be kept in mind though that the threshold valueat which a hydraulic jump starts to form is not constant: it depends on local bed morphology and slopecharacteristics (Chanson, 2000).
In order to reach a given threshold Fn value downstream of a hydraulic jump the flow needs to accelerate overa step. Considering that the flow width and hence the unit discharge in a rill are independent of slope gradient(Gilley et al., 1990; Giménez and Govers, 2001), the step length necessary to reach this threshold value willdecrease with increasing slope gradient. Hence, the frequency of step–pool alternations should increase withincreasing slope gradient. This is in agreement with observations that roughness frequency of rill beds increaseswith slope gradient (Giménez and Govers, 2001). However, the longitudinally averaged value of Fn and hencethe average flow velocity will not be strongly affected by this increased frequency of alternation of supercriticaland complex/subcritical flow. On the other hand, if a constant Fn is maintained flow velocity can increase withdischarge as flow width and flow depth also increase with discharge (Giménez and Govers, 2001).
CONCLUSIONS
Our results show that present-day mADV probes can be successfully used to study longitudinal variations inflow velocity in a rill in detail. In our experiment, rill topography was characterized by an alternation of stepsand pools which was strongly related to the flow hydraulics. Over steps, flow was unidirectional and rapidlyaccelerating until a threshold Fn value between 1·3 and 1·7 was reached and a hydraulic jump occurred leadingto the formation of a pool. In the pool, the flow pattern was multidirectional and complex. The flow wassubcritical when leaving the pool and accelerated over the next step until the threshold Fn value was againreached.
The alternation of complex subcritical flow and unidirectional supercritical flow leads to an average Fn thatis near 1. On steeper slopes, it may be expected that the alternation of different flow regimes and associatedbedforms will occur with a higher frequency: this will lead to an increase of bed roughness but not to an increaseof flow velocity, provided that the threshold value of Fn is constant. Comparison of incipient and mature poolsshows that most important elements of longitudinal variation in flow structure, such as flow acceleration and thepresence of a hydraulic jump, are always present.
The data presented in this paper support the hypothesis put forward in an earlier paper that the slope inde-pendence of flow velocity in eroding rills is due to an alternation of supercritical and subcritical flow sections,resulting in an average constant Froude number and the average flow velocity being independent of slope.However, rill pools are characterized by a complex multidirectional flow pattern. Experiments using differentslopes, discharges and perhaps soil types are necessary to investigate whether the pattern we described is indeedgeneral.

114 R. GIMÉNEZ ET AL.
Copyright © 2004 John Wiley & Sons, Ltd. Earth Surf. Process. Landforms 29, 105–114 (2004)
Energy loss in the rill is concentrated in the pools. This energy loss is mainly due to the action of a hydraulicjump and to a much lesser extent to chute impingement. This mechanism of energy dissipation is an essentialelement in rill formation and bedform evolution. Another issue that warrants further attention in future experi-ments is the effect that the presence of sediment might have on rill hydraulics.
REFERENCES
Beuselinck L, Govers G, Poesen J, Degraer G, Froyen L. 1998. Grain-size analysis by laser diffractometry: comparison with the sieve-pipettemethod. Catena 32: 193–208.
Chanson H. 1999. The Hydraulics of Open Channel Flow. An Introduction. John Wiley & Sons Inc: New York.Chanson H. 2000. Boundary shear stress measurements in undular flows: application to standing wave bed forms. Water Resources Research
36(10): 3063–3076.Chanson H. 2001. The Hydraulics of Stepped Chutes and Spillways. Balkema: Lisse, The Netherlands.Chow VT 1985. Open-Channel Hydraulics. McGraw-Hill International: New York.Gilley JE, Kottwitz ER, Wieman GA. 1990. Hydraulic characteristics of rills. Transactions of the ASAE 33(6): 1900–1906.Giménez R, Govers G. 2001. Interaction between bed roughness and flow hydraulics in eroding rills. Water Resources Research 37(3): 791–
799.Govers G. 1992. Relationship between discharge, velocity and flow area for rills eroding loose, non-layered materials. Earth Surface
Processes and Landforms 17: 515–528.Grant GE. 1997. Critical flow constrains flow hydraulics in mobile-bed streams: a new hypothesis. Water Resources Research 33(2): 349–
358.Huang C, White EG, Thwaite EG, Bendeli A. 1988. A noncontact laser system for measuring soil surface topography. Soil Science Society
of America Journal 52: 350–355.Lei TW, Nearing MA, Haghighi K, Bralts VF. 1998. Rill erosion and morphological evolution: a simulation model. Water Resources
Research 34(11): 3157–3168.Ligget JA. 1993. Critical depth, velocity profiles, and averaging. Journal of Irrigation and Drainage Engineering. 119: 416–422.Nearing MA, Norton LD, Bulgakov DA, Larionov GA. 1997. Hydraulics and erosion in eroding rills. Water Resources Research 33(4): 865–
876.Nearing MA, Simanton JR, Norton LD, Bulygin SJ, Stone J. 1999. Soil erosion by surface water flow on a stony, semiarid hillslope. Earth
Surface Processes and Landforms 24(8): 677–686.Robinson KM, Cook KR, Hanson GJ. 2000. Velocity field measurements at an overfall. Transactions of the ASAE 43(3): 665–670.Savat J, De Ploey J. 1982. Sheetwash and rill development by surface flow. In Badland Geomorphology and Piping, Bryan R, Yair A (eds).
Geo Books: Norwich; 113–126.SonTek. 1997. Acoustic Doppler Velocimeter Operation Manual, version 4.0. SonTek: San Diego.Takken I, Govers G, Ciesiolka CAA, Silburn DM, Loch RJ. 1998. Factors influencing the velocity-discharge relationship in rills. IAHS
Publication 249: 63–69.Tinkler KJ. 1997. Critical flow in rockbed streams with estimated values for Manning’s n. Geomorphology 20(1–2): 147–164.


![lit rill]/ · 2016-10-19 · lit rill]/ Created Date: 10/13/2016 5:29:26 PM](https://img.pdfslide.us/doc/110x75/5fa055418e28395fa316d3a1/lit-rill-2016-10-19-lit-rill-created-date-10132016-52926-pm.jpg)