Embed Size (px)
Citation preview
ONLINE ONLY
Longitudinal study of relative growth rates of themaxilla and the mandible according toquantitative cervical vertebral maturation
Lili Chen,a Jiarong Liu,b Tianmin Xu,c and Jiuxiang Lind
Wuhan and Beijing, China
Introduction: The purpose of this study was to investigate the relative growth rates (RGR) of the maxilla andthe mandible according to quantitative cervical vertebral maturation (QCVM) of adolescents with normalocclusion. Methods: Mixed longitudinal data were used. The sample included 87 adolescents (32 boys, 55 girls)from 8 to 18 years of age with normal occlusion, selected from 901 candidates. Sequential lateral cephalogramsand hand-wrist films were taken once a year for 6 consecutive years. The growth magnitude (GM) and RGR ofthe maxilla and the mandible were measured and analyzed. Results: GM and RGR were not always consistent,because subjects had different periods of time between the QCVM stages. GM was not as reliable as RGR.RGR had no significant sex differences in the maxilla and the mandible, in spite of different decelerating curves.However, statistically significant sex differences were found in the GM of mandibular measurements. Thegreatest growth potentials were not synchronized between the maxilla and the mandible. For both sexes, thegreatest RGR of maxillary length and height was in QCVM stage I; then, deceleration occurred. The greatestRGR of mandibular length and height was in QCVM stage II, and the next largest was in QCVM stage I.Conclusions: Understanding the RGR can provide references for orthodontic treatment and orthognathicsurgery. (Am J Orthod Dentofacial Orthop 2010;137:736.e1-736.e8)
Adolescence is a period during which the rate ofgrowth accelerates, reaching a peak velocityand then decelerating until adulthood.1 This
pattern can be found in all people, but there are markedindividual variations in the start, duration, rate, andamount of growth. Craniofacial growth prediction isan ultimate goal in craniofacial biology and is a majorconcern in orthodontics, because it is the key point inthe diagnosis, prevention, interception, and treatmentof malocclusions.2
aAssociate professor and vice chairman, Department of Stomatology, Union
Hospital, Tongji Medical College, Huazhong University of Science and
Technology, Wuhan, China.bAssistant professor, Department of Stomatology, Union Hospital, Tongji Med-
ical College, Huazhong Science and Technology University, Wuhan, China.cProfessor and chairman, Department of Orthodontics, Peking University
School and Hospital of Stomatology, Beijing, China.dProfessor, Department of Orthodontics, Peking University School and Hospital
of Stomatology; director, Research Center of Craniofacial Growth and Develop-
ment, Beijing University, Beijing, China.
Funded by the National Natural Science Foundation of China (No. 30801314).
The authors report no commercial, proprietary, or financial interest in the prod-
ucts or companies described in this article.
Reprint requests to: Jiuxiang Lin, Department of Orthodontics, Peking Univer-
sity School and Hospital of Stomatology and Director, Research Center of Cra-
niofacial Growth and Development, 22#ZhongGuanCun South Street, HaiDian
District, Beijing 100081, China; e-mail, [email protected].
Submitted, July 2009; revised and accepted, December 2009.
0889-5406/$36.00
Copyright � 2010 by the American Association of Orthodontists.
doi:10.1016/j.ajodo.2009.12.022
Hand-wrist radiographs have been used routinely inorthodontics to assess the peak of the growth spurt.3-5
However, there are concerns about extra radiationexposure. In addition, the British Orthodontic Societyguidelines state that the use of hand-wrist radiographsto predict the onset of the pubertal growth spurt is notindicated.6 Because of this, cervical vertebral matura-tion (CVM) has been evaluated for its correlation toskeletal maturity as an alternative to the hand-wristmethod.7-9 One obvious advantage of the CVM methodis that a lateral cephalometric radiograph is routinelyrequired for orthodontic diagnosis and treatmentplanning; no additional radiograph is required. Butalmost all previous evaluations of puberty with thecervical vertebrae on cephalometric radiographs eitherused or referred to the atlas of Lamparski.10 This wasconvenient because changes in cervical vertebral bodiescan be evaluated with regard to growth in the atlas.However, an atlas cannot be used to evaluate growth inan objective and detailed manner because the resultscan differ from operator to operator.11
Until now, cervical vertebrae were used only to de-termine the time of the pubertal growth peak or skeletalage, and no reports have predicted maxillofacial growthin a quantitative way.12-14 To evaluate the rate ofmaxillary and mandibular growth in various growthstages, a system of quantitative CVM (QCVM)proposed by Chen et al15 was used in this study.
736.e1
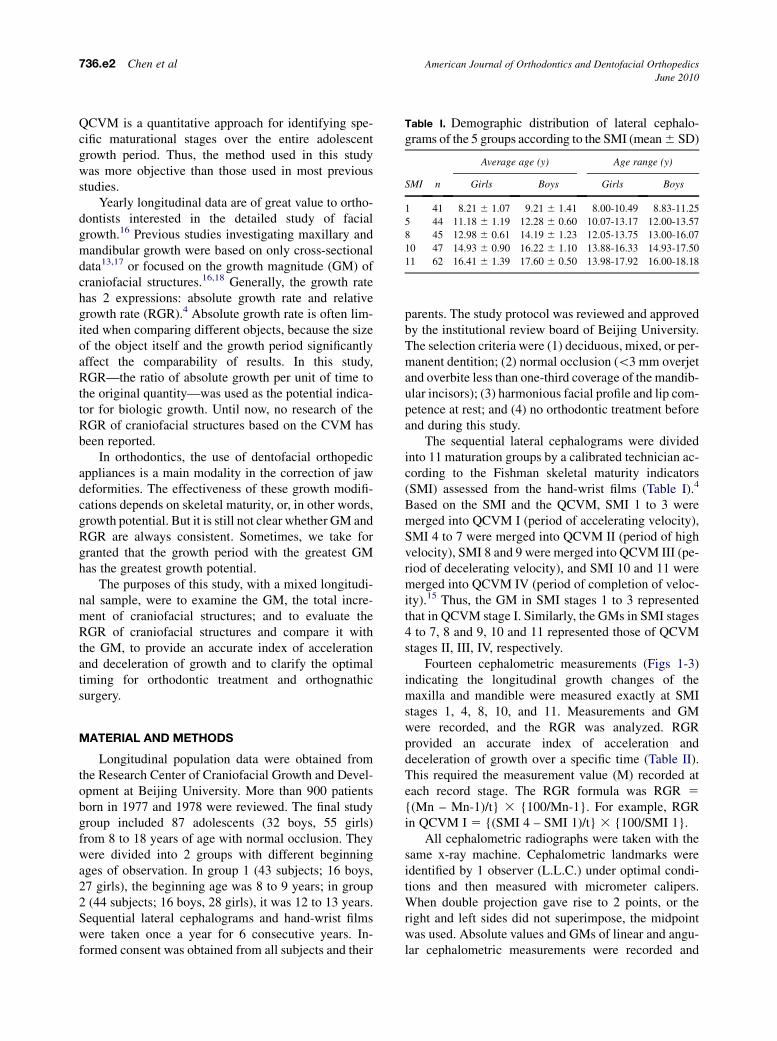
Table I. Demographic distribution of lateral cephalo-grams of the 5 groups according to the SMI (mean 6 SD)
SMI n
Average age (y) Age range (y)
Girls Boys Girls Boys
1 41 8.21 6 1.07 9.21 6 1.41 8.00-10.49 8.83-11.25
5 44 11.18 6 1.19 12.28 6 0.60 10.07-13.17 12.00-13.57
8 45 12.98 6 0.61 14.19 6 1.23 12.05-13.75 13.00-16.07
10 47 14.93 6 0.90 16.22 6 1.10 13.88-16.33 14.93-17.50
11 62 16.41 6 1.39 17.60 6 0.50 13.98-17.92 16.00-18.18
736.e2 Chen et al American Journal of Orthodontics and Dentofacial Orthopedics
June 2010
QCVM is a quantitative approach for identifying spe-cific maturational stages over the entire adolescentgrowth period. Thus, the method used in this studywas more objective than those used in most previousstudies.
Yearly longitudinal data are of great value to ortho-dontists interested in the detailed study of facialgrowth.16 Previous studies investigating maxillary andmandibular growth were based on only cross-sectionaldata13,17 or focused on the growth magnitude (GM) ofcraniofacial structures.16,18 Generally, the growth ratehas 2 expressions: absolute growth rate and relativegrowth rate (RGR).4 Absolute growth rate is often lim-ited when comparing different objects, because the sizeof the object itself and the growth period significantlyaffect the comparability of results. In this study,RGR—the ratio of absolute growth per unit of time tothe original quantity—was used as the potential indica-tor for biologic growth. Until now, no research of theRGR of craniofacial structures based on the CVM hasbeen reported.
In orthodontics, the use of dentofacial orthopedicappliances is a main modality in the correction of jawdeformities. The effectiveness of these growth modifi-cations depends on skeletal maturity, or, in other words,growth potential. But it is still not clear whether GM andRGR are always consistent. Sometimes, we take forgranted that the growth period with the greatest GMhas the greatest growth potential.
The purposes of this study, with a mixed longitudi-nal sample, were to examine the GM, the total incre-ment of craniofacial structures; and to evaluate theRGR of craniofacial structures and compare it withthe GM, to provide an accurate index of accelerationand deceleration of growth and to clarify the optimaltiming for orthodontic treatment and orthognathicsurgery.
MATERIAL AND METHODS
Longitudinal population data were obtained fromthe Research Center of Craniofacial Growth and Devel-opment at Beijing University. More than 900 patientsborn in 1977 and 1978 were reviewed. The final studygroup included 87 adolescents (32 boys, 55 girls)from 8 to 18 years of age with normal occlusion. Theywere divided into 2 groups with different beginningages of observation. In group 1 (43 subjects; 16 boys,27 girls), the beginning age was 8 to 9 years; in group2 (44 subjects; 16 boys, 28 girls), it was 12 to 13 years.Sequential lateral cephalograms and hand-wrist filmswere taken once a year for 6 consecutive years. In-formed consent was obtained from all subjects and their
parents. The study protocol was reviewed and approvedby the institutional review board of Beijing University.The selection criteria were (1) deciduous, mixed, or per-manent dentition; (2) normal occlusion (\3 mm overjetand overbite less than one-third coverage of the mandib-ular incisors); (3) harmonious facial profile and lip com-petence at rest; and (4) no orthodontic treatment beforeand during this study.
The sequential lateral cephalograms were dividedinto 11 maturation groups by a calibrated technician ac-cording to the Fishman skeletal maturity indicators(SMI) assessed from the hand-wrist films (Table I).4
Based on the SMI and the QCVM, SMI 1 to 3 weremerged into QCVM I (period of accelerating velocity),SMI 4 to 7 were merged into QCVM II (period of highvelocity), SMI 8 and 9 were merged into QCVM III (pe-riod of decelerating velocity), and SMI 10 and 11 weremerged into QCVM IV (period of completion of veloc-ity).15 Thus, the GM in SMI stages 1 to 3 representedthat in QCVM stage I. Similarly, the GMs in SMI stages4 to 7, 8 and 9, 10 and 11 represented those of QCVMstages II, III, IV, respectively.
Fourteen cephalometric measurements (Figs 1-3)indicating the longitudinal growth changes of themaxilla and mandible were measured exactly at SMIstages 1, 4, 8, 10, and 11. Measurements and GMwere recorded, and the RGR was analyzed. RGRprovided an accurate index of acceleration anddeceleration of growth over a specific time (Table II).This required the measurement value (M) recorded ateach record stage. The RGR formula was RGR 5
{(Mn – Mn-1)/t} 3 {100/Mn-1}. For example, RGRin QCVM I 5 {(SMI 4 – SMI 1)/t} 3 {100/SMI 1}.
All cephalometric radiographs were taken with thesame x-ray machine. Cephalometric landmarks wereidentified by 1 observer (L.L.C.) under optimal condi-tions and then measured with micrometer calipers.When double projection gave rise to 2 points, or theright and left sides did not superimpose, the midpointwas used. Absolute values and GMs of linear and angu-lar cephalometric measurements were recorded and
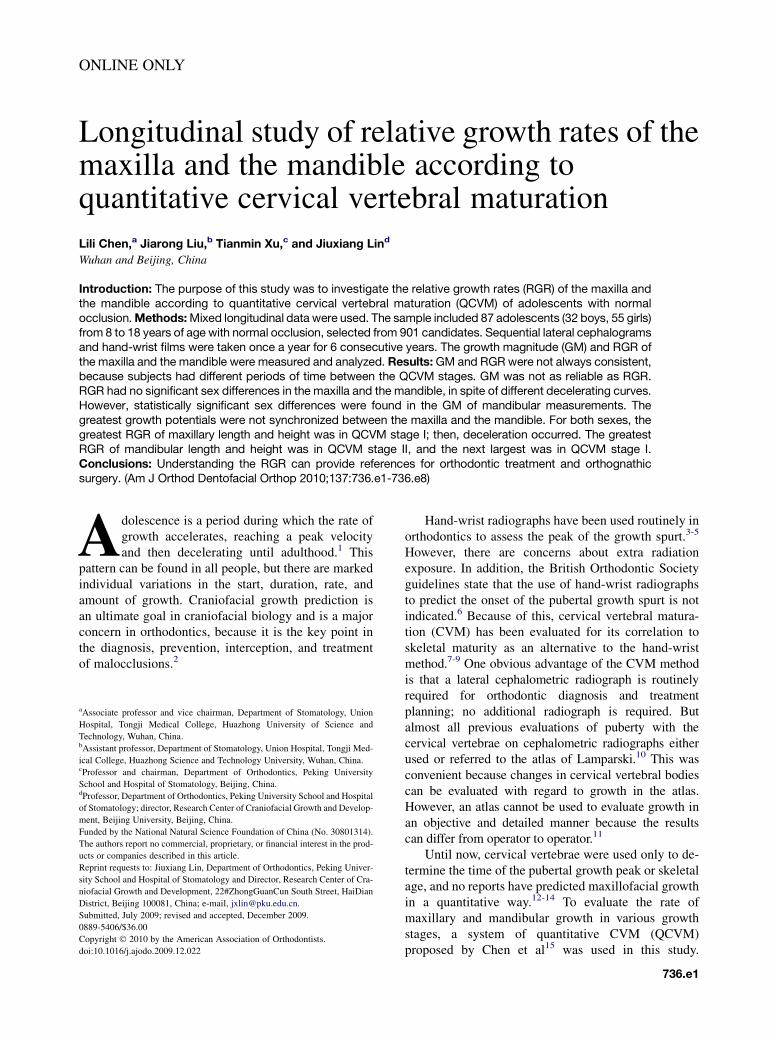
Fig 1. Reference points and reference lines: S, sella; N,nasion; A, point A; B, Point B; ANS, anterior nasal spine;PNS, posterior nasal spine; M, the midpoint betweenmolar inferius and superius; I, the midpoint between in-cision inferius and superius; Go, gonion; Gn, gnathion;Ar, articulare; SN, sella-nasion line; SN0, 7� down fromSN at S.
Fig 2. Angular measurements: 1, SNA; 2, SNB; 3, ANB;4, SA/SN, direction of maxillary growth; 5, SGn/SN, di-rection of mandibular growth; 6, GoGn/SN, the angleof mandibular plane; 7, PNS-ANS/SN, the angle of max-illary plane; 8, OP/SN, the angle of occlusal plane.
American Journal of Orthodontics and Dentofacial Orthopedics Chen et al 736.e3Volume 137, Number 6
analyzed. The measuring points and reference linesused, shown in Figures 1 through 3, are defined in thecorresponding legends to the figures.
Statistical analysis
The statistical analysis was performed with SPSSsoftware for Windows (version 13.0, SPSS, Chicago,Ill). The arithmetic mean and standard deviation werecalculated for each variable. Analysis of variance(ANOVA) and paired t tests were used. The level ofsignificance was P 5 0.05. Intraobserver reliabilityand reproducibility of the digitizer were checked on20 randomly selected cephalometric radiographs thatwere retraced and redigitized 2 weeks later. The errorsdid not exceed 0.2 mm for the linear variables and0.5� for the angular variables.
RESULTS
As shown in Table III, SNA angle did not changesignificantly with QCVM for both sexes, but SNB angleincreased and ANB angle decreased significantly, espe-cially in the boys (P \0.05). There were no significantsex differences in ANB and SNB angles during QCVMstage I. In QCVM stages II and III, the changes of ANBand SNB angles were greater for the boys than for thegirls (P \0.05).
Throughout the study period, changes of SA/SN orSGn/SN angle showed no significant differences foreither sex (P .0.05). This suggested that the growthdirections of the maxilla and the mandible were stable.We can predict the total growth direction of the maxillaand the mandible with SA/SN or SGn/SN angle.
The inclination of the palatal plane (PNS-ANS/SN)was also stable. This indicates that the palatal plane canbe used as a reference plane in lateral cephalometric ra-diographs to evaluate the maxillomandibular relationship.
The OP/SN angle was significantly different inQCVM stages I and II, but there was no significant dif-ference in QCVM stages III and IV. These results sug-gest that posterior occlusal distance increases duringthe mixed dentition period because of the replacementof deciduous teeth and growth. The changes of theOP/SN angle became smaller gradually and were main-tained after the replacement of all deciduous teeth.
The increment in mandibular length (Ar-Gn) wasalmost 2.5 times as great as the increment in the maxil-lary length (ANS-PNS t SN0) from QCVM stages I toIV (mandible: boys, 17.57 mm; girls, 13.62 mm; max-illa: boys, 7.04 mm; girls, 5.82 mm) for both sexes. InQCVM stage I, the growth increments of the maxillaand the mandible were nearly the same. In stage II,the growth of the mandible exceeded that of the maxillaand continued in stages III and IV, whereas the maxillahad no more growth. The GM of Ar-Gn and Go-Gn
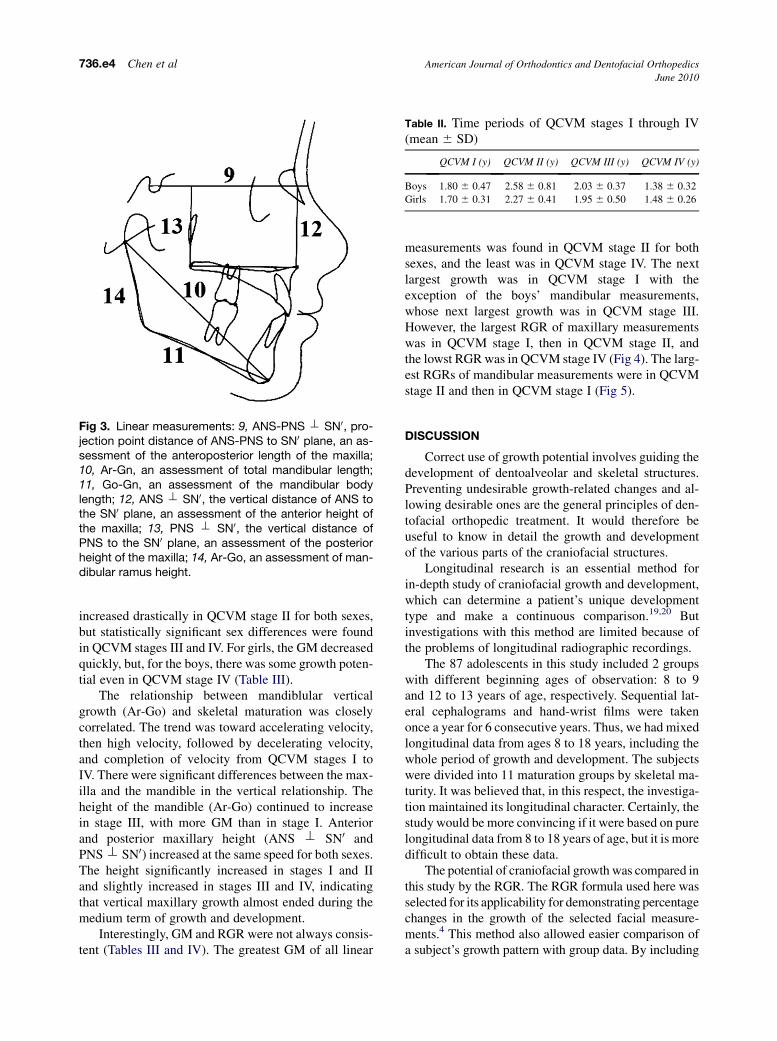
Fig 3. Linear measurements: 9, ANS-PNS t SN0, pro-jection point distance of ANS-PNS to SN0 plane, an as-sessment of the anteroposterior length of the maxilla;10, Ar-Gn, an assessment of total mandibular length;11, Go-Gn, an assessment of the mandibular bodylength; 12, ANS t SN0, the vertical distance of ANS tothe SN0 plane, an assessment of the anterior height ofthe maxilla; 13, PNS t SN0, the vertical distance ofPNS to the SN0 plane, an assessment of the posteriorheight of the maxilla; 14, Ar-Go, an assessment of man-dibular ramus height.
Table II. Time periods of QCVM stages I through IV(mean 6 SD)
QCVM I (y) QCVM II (y) QCVM III (y) QCVM IV (y)
Boys 1.80 6 0.47 2.58 6 0.81 2.03 6 0.37 1.38 6 0.32
Girls 1.70 6 0.31 2.27 6 0.41 1.95 6 0.50 1.48 6 0.26
736.e4 Chen et al American Journal of Orthodontics and Dentofacial Orthopedics
June 2010
increased drastically in QCVM stage II for both sexes,but statistically significant sex differences were foundin QCVM stages III and IV. For girls, the GM decreasedquickly, but, for the boys, there was some growth poten-tial even in QCVM stage IV (Table III).
The relationship between mandiblular verticalgrowth (Ar-Go) and skeletal maturation was closelycorrelated. The trend was toward accelerating velocity,then high velocity, followed by decelerating velocity,and completion of velocity from QCVM stages I toIV. There were significant differences between the max-illa and the mandible in the vertical relationship. Theheight of the mandible (Ar-Go) continued to increasein stage III, with more GM than in stage I. Anteriorand posterior maxillary height (ANS t SN0 andPNS t SN0) increased at the same speed for both sexes.The height significantly increased in stages I and IIand slightly increased in stages III and IV, indicatingthat vertical maxillary growth almost ended during themedium term of growth and development.
Interestingly, GM and RGR were not always consis-tent (Tables III and IV). The greatest GM of all linear
measurements was found in QCVM stage II for bothsexes, and the least was in QCVM stage IV. The nextlargest growth was in QCVM stage I with theexception of the boys’ mandibular measurements,whose next largest growth was in QCVM stage III.However, the largest RGR of maxillary measurementswas in QCVM stage I, then in QCVM stage II, andthe lowst RGR was in QCVM stage IV (Fig 4). The larg-est RGRs of mandibular measurements were in QCVMstage II and then in QCVM stage I (Fig 5).
DISCUSSION
Correct use of growth potential involves guiding thedevelopment of dentoalveolar and skeletal structures.Preventing undesirable growth-related changes and al-lowing desirable ones are the general principles of den-tofacial orthopedic treatment. It would therefore beuseful to know in detail the growth and developmentof the various parts of the craniofacial structures.
Longitudinal research is an essential method forin-depth study of craniofacial growth and development,which can determine a patient’s unique developmenttype and make a continuous comparison.19,20 Butinvestigations with this method are limited because ofthe problems of longitudinal radiographic recordings.
The 87 adolescents in this study included 2 groupswith different beginning ages of observation: 8 to 9and 12 to 13 years of age, respectively. Sequential lat-eral cephalograms and hand-wrist films were takenonce a year for 6 consecutive years. Thus, we had mixedlongitudinal data from ages 8 to 18 years, including thewhole period of growth and development. The subjectswere divided into 11 maturation groups by skeletal ma-turity. It was believed that, in this respect, the investiga-tion maintained its longitudinal character. Certainly, thestudy would be more convincing if it were based on purelongitudinal data from 8 to 18 years of age, but it is moredifficult to obtain these data.
The potential of craniofacial growth was compared inthis study by the RGR. The RGR formula used here wasselected for its applicability for demonstrating percentagechanges in the growth of the selected facial measure-ments.4 This method also allowed easier comparison ofa subject’s growth pattern with group data. By including
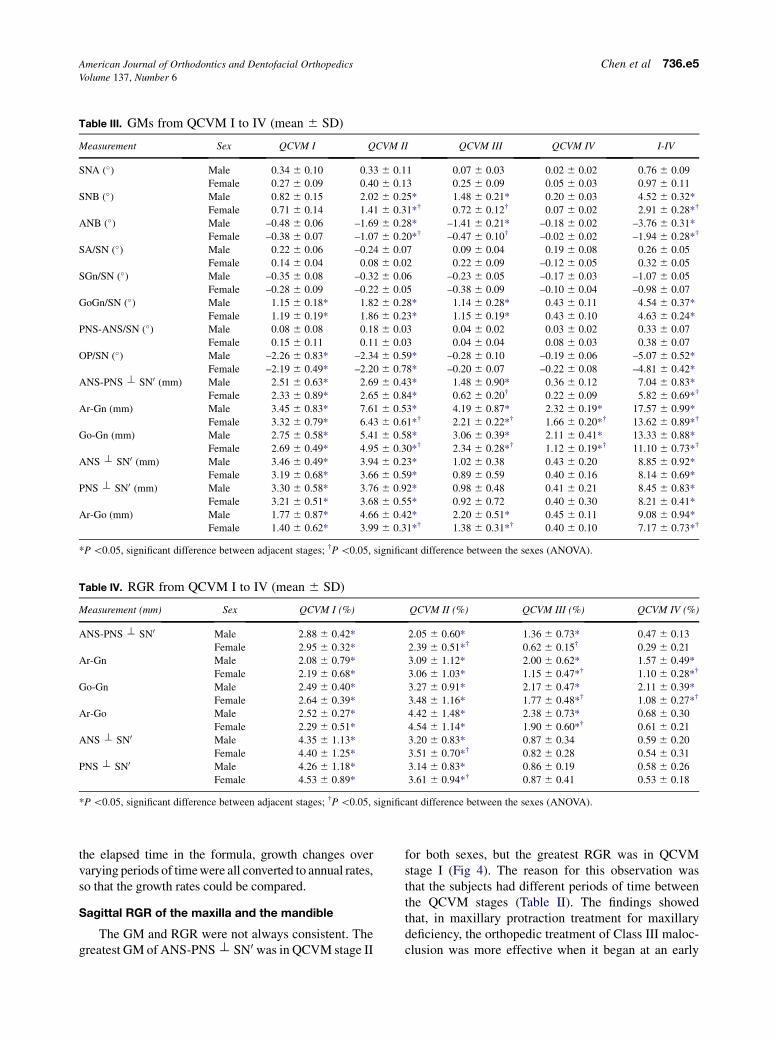
Table III. GMs from QCVM I to IV (mean 6 SD)
Measurement Sex QCVM I QCVM II QCVM III QCVM IV I-IV
SNA (�) Male 0.34 6 0.10 0.33 6 0.11 0.07 6 0.03 0.02 6 0.02 0.76 6 0.09
Female 0.27 6 0.09 0.40 6 0.13 0.25 6 0.09 0.05 6 0.03 0.97 6 0.11
SNB (�) Male 0.82 6 0.15 2.02 6 0.25* 1.48 6 0.21* 0.20 6 0.03 4.52 6 0.32*
Female 0.71 6 0.14 1.41 6 0.31*† 0.72 6 0.12† 0.07 6 0.02 2.91 6 0.28*†
ANB (�) Male –0.48 6 0.06 –1.69 6 0.28* –1.41 6 0.21* –0.18 6 0.02 –3.76 6 0.31*
Female –0.38 6 0.07 –1.07 6 0.20*† –0.47 6 0.10† –0.02 6 0.02 –1.94 6 0.28*†
SA/SN (�) Male 0.22 6 0.06 –0.24 6 0.07 0.09 6 0.04 0.19 6 0.08 0.26 6 0.05
Female 0.14 6 0.04 0.08 6 0.02 0.22 6 0.09 –0.12 6 0.05 0.32 6 0.05
SGn/SN (�) Male –0.35 6 0.08 –0.32 6 0.06 –0.23 6 0.05 –0.17 6 0.03 –1.07 6 0.05
Female –0.28 6 0.09 –0.22 6 0.05 –0.38 6 0.09 –0.10 6 0.04 –0.98 6 0.07
GoGn/SN (�) Male 1.15 6 0.18* 1.82 6 0.28* 1.14 6 0.28* 0.43 6 0.11 4.54 6 0.37*
Female 1.19 6 0.19* 1.86 6 0.23* 1.15 6 0.19* 0.43 6 0.10 4.63 6 0.24*
PNS-ANS/SN (�) Male 0.08 6 0.08 0.18 6 0.03 0.04 6 0.02 0.03 6 0.02 0.33 6 0.07
Female 0.15 6 0.11 0.11 6 0.03 0.04 6 0.04 0.08 6 0.03 0.38 6 0.07
OP/SN (�) Male –2.26 6 0.83* –2.34 6 0.59* –0.28 6 0.10 –0.19 6 0.06 –5.07 6 0.52*
Female –2.19 6 0.49* –2.20 6 0.78* –0.20 6 0.07 –0.22 6 0.08 –4.81 6 0.42*
ANS-PNS t SN0 (mm) Male 2.51 6 0.63* 2.69 6 0.43* 1.48 6 0.90* 0.36 6 0.12 7.04 6 0.83*
Female 2.33 6 0.89* 2.65 6 0.84* 0.62 6 0.20† 0.22 6 0.09 5.82 6 0.69*†
Ar-Gn (mm) Male 3.45 6 0.83* 7.61 6 0.53* 4.19 6 0.87* 2.32 6 0.19* 17.57 6 0.99*
Female 3.32 6 0.79* 6.43 6 0.61*† 2.21 6 0.22*† 1.66 6 0.20*† 13.62 6 0.89*†
Go-Gn (mm) Male 2.75 6 0.58* 5.41 6 0.58* 3.06 6 0.39* 2.11 6 0.41* 13.33 6 0.88*
Female 2.69 6 0.49* 4.95 6 0.30*† 2.34 6 0.28*† 1.12 6 0.19*† 11.10 6 0.73*†
ANS t SN0 (mm) Male 3.46 6 0.49* 3.94 6 0.23* 1.02 6 0.38 0.43 6 0.20 8.85 6 0.92*
Female 3.19 6 0.68* 3.66 6 0.59* 0.89 6 0.59 0.40 6 0.16 8.14 6 0.69*
PNS t SN0 (mm) Male 3.30 6 0.58* 3.76 6 0.92* 0.98 6 0.48 0.41 6 0.21 8.45 6 0.83*
Female 3.21 6 0.51* 3.68 6 0.55* 0.92 6 0.72 0.40 6 0.30 8.21 6 0.41*
Ar-Go (mm) Male 1.77 6 0.87* 4.66 6 0.42* 2.20 6 0.51* 0.45 6 0.11 9.08 6 0.94*
Female 1.40 6 0.62* 3.99 6 0.31*† 1.38 6 0.31*† 0.40 6 0.10 7.17 6 0.73*†
*P \0.05, significant difference between adjacent stages; †P \0.05, significant difference between the sexes (ANOVA).
Table IV. RGR from QCVM I to IV (mean 6 SD)
Measurement (mm) Sex QCVM I (%) QCVM II (%) QCVM III (%) QCVM IV (%)
ANS-PNS t SN0 Male 2.88 6 0.42* 2.05 6 0.60* 1.36 6 0.73* 0.47 6 0.13
Female 2.95 6 0.32* 2.39 6 0.51*† 0.62 6 0.15† 0.29 6 0.21
Ar-Gn Male 2.08 6 0.79* 3.09 6 1.12* 2.00 6 0.62* 1.57 6 0.49*
Female 2.19 6 0.68* 3.06 6 1.03* 1.15 6 0.47*† 1.10 6 0.28*†
Go-Gn Male 2.49 6 0.40* 3.27 6 0.91* 2.17 6 0.47* 2.11 6 0.39*
Female 2.64 6 0.39* 3.48 6 1.16* 1.77 6 0.48*† 1.08 6 0.27*†
Ar-Go Male 2.52 6 0.27* 4.42 6 1.48* 2.38 6 0.73* 0.68 6 0.30
Female 2.29 6 0.51* 4.54 6 1.14* 1.90 6 0.60*† 0.61 6 0.21
ANS t SN0 Male 4.35 6 1.13* 3.20 6 0.83* 0.87 6 0.34 0.59 6 0.20
Female 4.40 6 1.25* 3.51 6 0.70*† 0.82 6 0.28 0.54 6 0.31
PNS t SN0 Male 4.26 6 1.18* 3.14 6 0.83* 0.86 6 0.19 0.58 6 0.26
Female 4.53 6 0.89* 3.61 6 0.94*† 0.87 6 0.41 0.53 6 0.18
*P \0.05, significant difference between adjacent stages; †P \0.05, significant difference between the sexes (ANOVA).
American Journal of Orthodontics and Dentofacial Orthopedics Chen et al 736.e5Volume 137, Number 6
the elapsed time in the formula, growth changes overvarying periods of time were all converted to annual rates,so that the growth rates could be compared.
Sagittal RGR of the maxilla and the mandible
The GM and RGR were not always consistent. Thegreatest GM of ANS-PNS t SN0 was in QCVM stage II
for both sexes, but the greatest RGR was in QCVMstage I (Fig 4). The reason for this observation wasthat the subjects had different periods of time betweenthe QCVM stages (Table II). The findings showedthat, in maxillary protraction treatment for maxillarydeficiency, the orthopedic treatment of Class III maloc-clusion was more effective when it began at an early
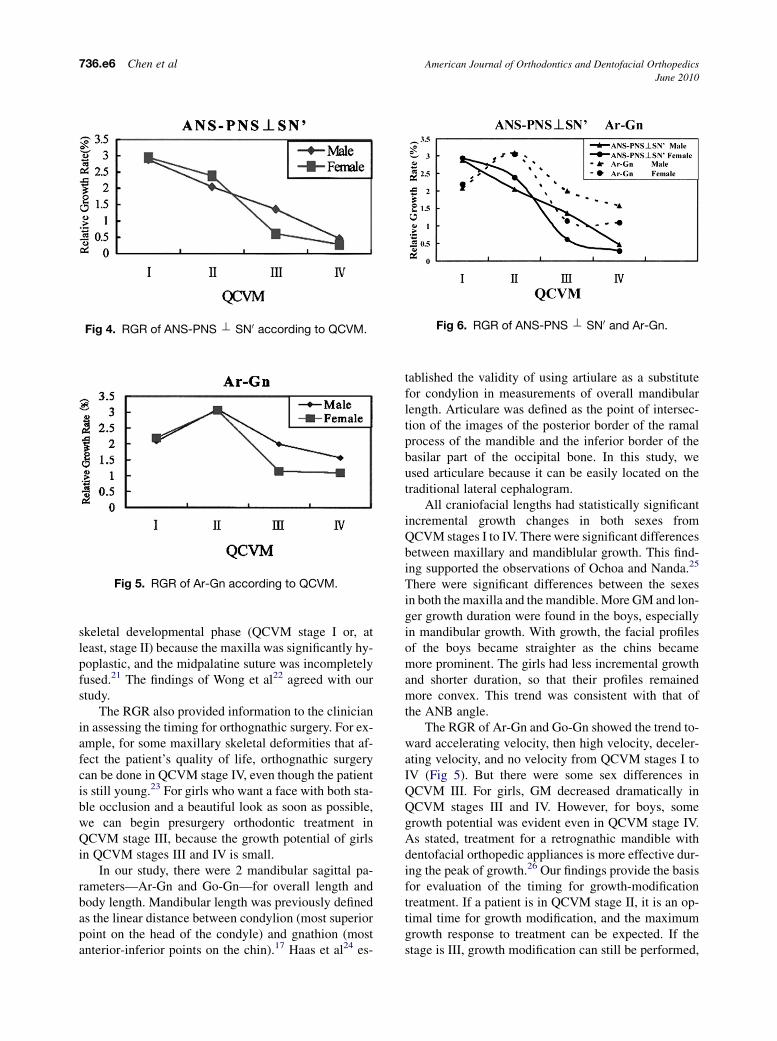
Fig 4. RGR of ANS-PNS t SN0 according to QCVM.
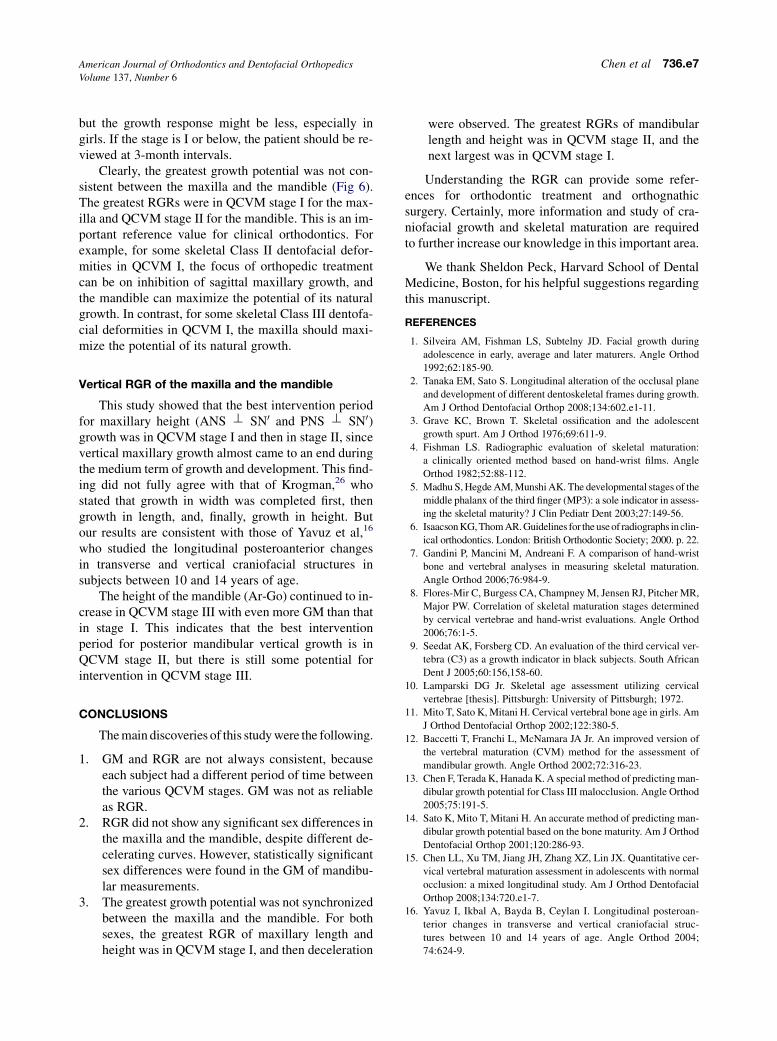
Fig 5. RGR of Ar-Gn according to QCVM.
Fig 6. RGR of ANS-PNS t SN0 and Ar-Gn.
736.e6 Chen et al American Journal of Orthodontics and Dentofacial Orthopedics
June 2010
skeletal developmental phase (QCVM stage I or, atleast, stage II) because the maxilla was significantly hy-poplastic, and the midpalatine suture was incompletelyfused.21 The findings of Wong et al22 agreed with ourstudy.
The RGR also provided information to the clinicianin assessing the timing for orthognathic surgery. For ex-ample, for some maxillary skeletal deformities that af-fect the patient’s quality of life, orthognathic surgerycan be done in QCVM stage IV, even though the patientis still young.23 For girls who want a face with both sta-ble occlusion and a beautiful look as soon as possible,we can begin presurgery orthodontic treatment inQCVM stage III, because the growth potential of girlsin QCVM stages III and IV is small.
In our study, there were 2 mandibular sagittal pa-rameters—Ar-Gn and Go-Gn—for overall length andbody length. Mandibular length was previously definedas the linear distance between condylion (most superiorpoint on the head of the condyle) and gnathion (mostanterior-inferior points on the chin).17 Haas et al24 es-
tablished the validity of using artiulare as a substitutefor condylion in measurements of overall mandibularlength. Articulare was defined as the point of intersec-tion of the images of the posterior border of the ramalprocess of the mandible and the inferior border of thebasilar part of the occipital bone. In this study, weused articulare because it can be easily located on thetraditional lateral cephalogram.
All craniofacial lengths had statistically significantincremental growth changes in both sexes fromQCVM stages I to IV. There were significant differencesbetween maxillary and mandiblular growth. This find-ing supported the observations of Ochoa and Nanda.25
There were significant differences between the sexesin both the maxilla and the mandible. More GM and lon-ger growth duration were found in the boys, especiallyin mandibular growth. With growth, the facial profilesof the boys became straighter as the chins becamemore prominent. The girls had less incremental growthand shorter duration, so that their profiles remainedmore convex. This trend was consistent with that ofthe ANB angle.
The RGR of Ar-Gn and Go-Gn showed the trend to-ward accelerating velocity, then high velocity, deceler-ating velocity, and no velocity from QCVM stages I toIV (Fig 5). But there were some sex differences inQCVM III. For girls, GM decreased dramatically inQCVM stages III and IV. However, for boys, somegrowth potential was evident even in QCVM stage IV.As stated, treatment for a retrognathic mandible withdentofacial orthopedic appliances is more effective dur-ing the peak of growth.26 Our findings provide the basisfor evaluation of the timing for growth-modificationtreatment. If a patient is in QCVM stage II, it is an op-timal time for growth modification, and the maximumgrowth response to treatment can be expected. If thestage is III, growth modification can still be performed,
American Journal of Orthodontics and Dentofacial Orthopedics Chen et al 736.e7Volume 137, Number 6
but the growth response might be less, especially ingirls. If the stage is I or below, the patient should be re-viewed at 3-month intervals.
Clearly, the greatest growth potential was not con-sistent between the maxilla and the mandible (Fig 6).The greatest RGRs were in QCVM stage I for the max-illa and QCVM stage II for the mandible. This is an im-portant reference value for clinical orthodontics. Forexample, for some skeletal Class II dentofacial defor-mities in QCVM I, the focus of orthopedic treatmentcan be on inhibition of sagittal maxillary growth, andthe mandible can maximize the potential of its naturalgrowth. In contrast, for some skeletal Class III dentofa-cial deformities in QCVM I, the maxilla should maxi-mize the potential of its natural growth.
Vertical RGR of the maxilla and the mandible
This study showed that the best intervention periodfor maxillary height (ANS t SN0 and PNS t SN0)growth was in QCVM stage I and then in stage II, sincevertical maxillary growth almost came to an end duringthe medium term of growth and development. This find-ing did not fully agree with that of Krogman,26 whostated that growth in width was completed first, thengrowth in length, and, finally, growth in height. Butour results are consistent with those of Yavuz et al,16
who studied the longitudinal posteroanterior changesin transverse and vertical craniofacial structures insubjects between 10 and 14 years of age.
The height of the mandible (Ar-Go) continued to in-crease in QCVM stage III with even more GM than thatin stage I. This indicates that the best interventionperiod for posterior mandibular vertical growth is inQCVM stage II, but there is still some potential forintervention in QCVM stage III.
CONCLUSIONS
The main discoveries of this study were the following.
1. GM and RGR are not always consistent, becauseeach subject had a different period of time betweenthe various QCVM stages. GM was not as reliableas RGR.
2. RGR did not show any significant sex differences inthe maxilla and the mandible, despite different de-celerating curves. However, statistically significantsex differences were found in the GM of mandibu-lar measurements.
3. The greatest growth potential was not synchronizedbetween the maxilla and the mandible. For bothsexes, the greatest RGR of maxillary length andheight was in QCVM stage I, and then deceleration
were observed. The greatest RGRs of mandibularlength and height was in QCVM stage II, and thenext largest was in QCVM stage I.
Understanding the RGR can provide some refer-ences for orthodontic treatment and orthognathicsurgery. Certainly, more information and study of cra-niofacial growth and skeletal maturation are requiredto further increase our knowledge in this important area.
We thank Sheldon Peck, Harvard School of DentalMedicine, Boston, for his helpful suggestions regardingthis manuscript.
REFERENCES
1. Silveira AM, Fishman LS, Subtelny JD. Facial growth during
adolescence in early, average and later maturers. Angle Orthod
1992;62:185-90.
2. Tanaka EM, Sato S. Longitudinal alteration of the occlusal plane
and development of different dentoskeletal frames during growth.
Am J Orthod Dentofacial Orthop 2008;134:602.e1-11.
3. Grave KC, Brown T. Skeletal ossification and the adolescent
growth spurt. Am J Orthod 1976;69:611-9.
4. Fishman LS. Radiographic evaluation of skeletal maturation:
a clinically oriented method based on hand-wrist films. Angle
Orthod 1982;52:88-112.
5. Madhu S, Hegde AM, Munshi AK. The developmental stages of the
middle phalanx of the third finger (MP3): a sole indicator in assess-
ing the skeletal maturity? J Clin Pediatr Dent 2003;27:149-56.
6. Isaacson KG, Thom AR. Guidelines for the use of radiographs in clin-
ical orthodontics. London: British Orthodontic Society; 2000. p. 22.
7. Gandini P, Mancini M, Andreani F. A comparison of hand-wrist
bone and vertebral analyses in measuring skeletal maturation.
Angle Orthod 2006;76:984-9.
8. Flores-Mir C, Burgess CA, Champney M, Jensen RJ, Pitcher MR,
Major PW. Correlation of skeletal maturation stages determined
by cervical vertebrae and hand-wrist evaluations. Angle Orthod
2006;76:1-5.
9. Seedat AK, Forsberg CD. An evaluation of the third cervical ver-
tebra (C3) as a growth indicator in black subjects. South African
Dent J 2005;60:156,158-60.
10. Lamparski DG Jr. Skeletal age assessment utilizing cervical
vertebrae [thesis]. Pittsburgh: University of Pittsburgh; 1972.
11. Mito T, Sato K, Mitani H. Cervical vertebral bone age in girls. Am
J Orthod Dentofacial Orthop 2002;122:380-5.
12. Baccetti T, Franchi L, McNamara JA Jr. An improved version of
the vertebral maturation (CVM) method for the assessment of
mandibular growth. Angle Orthod 2002;72:316-23.
13. Chen F, Terada K, Hanada K. A special method of predicting man-
dibular growth potential for Class III malocclusion. Angle Orthod
2005;75:191-5.
14. Sato K, Mito T, Mitani H. An accurate method of predicting man-
dibular growth potential based on the bone maturity. Am J Orthod
Dentofacial Orthop 2001;120:286-93.
15. Chen LL, Xu TM, Jiang JH, Zhang XZ, Lin JX. Quantitative cer-
vical vertebral maturation assessment in adolescents with normal
occlusion: a mixed longitudinal study. Am J Orthod Dentofacial
Orthop 2008;134:720.e1-7.
16. Yavuz I, Ikbal A, Bayda B, Ceylan I. Longitudinal posteroan-
terior changes in transverse and vertical craniofacial struc-
tures between 10 and 14 years of age. Angle Orthod 2004;
74:624-9.
736.e8 Chen et al American Journal of Orthodontics and Dentofacial Orthopedics
June 2010
17. Mito T, Sato K, Mitani H. Predicting mandibular growth potential
with cervical vertebral bone age. Am J Orthod Dentofacial Orthop
2003;124:173-7.
18. Chen L, Lin J, Xu T, Long X. The longitudinal sagittal growth
changes of maxilla and mandible according to quantitative cervi-
cal vertebral maturation. J Huazhong Univ Sci Technolog Med Sci
2009;29:251-6.
19. Moyers RE. Handbook of orthodontics. 4th ed. Chicago: Year
Book Medical Publishers; 1988. p. 6-17.
20. Franchi L, Baccetti T, McNamara JA Jr. Postpubertal assessment
of treatment timing for maxillary expansion and protraction
therapy followed by fixed appliances. Am J Orthod Dentofacial
Orthop 2004;26:555-68.
21. Wong RK, Alkhal HA, Rabie AB. Use of cervical vertebral
maturation to determine skeletal age. Am J Orthod Dentofacial
Orthop 2009;136:484.e1-6.
22. Yamashita Y, Nakamura Y, Shimada T, Nomura Y, Hirashita A.
Asymmetry of the lips of orthognathic surgery patients. Am J
Orthod Dentofacial Orthop 2009;136:559-63.
23. Haas DW, Martinez DF, Eckert GJ, Diers NR. Measurements of
mandibular length: a comparison of articulare vs condylion.
Angle Orthod 2001;71:210-5.
24. Ochoa BK, Nanda RS. Comparison of maxillary and mandib-
ular growth. Am J Orthod Dentofacial Orthop 2004;125:
148-59.
25. Ruf S, Pancherz H. When is the ideal period for Herbst therapy—
early or late? Semin Orthod 2003;9:47-56.
26. Krogman WM. Craniofacial growth, prenatal and postnatal. In:
Cooper HK, Harding RL, Krogman WM, Mazaheri M,
Millard RT, editors. Cleft palate and cleft lip: a team approach
to clinical management and rehabilitation. Philadelphia: W.B.
Saunders; 1979. p. 22-107.