Embed Size (px)
Citation preview
1
Longitudinal discontinuities in riverine greenhouse gas dynamics
generated by dams and urban wastewater
Hyojin Jin1, Tae Kyung Yoon2, Most Shirina Begum1, Eun-Ju Lee3, Neung-Hwan Oh3, Namgoo Kang4,
5, Ji-Hyung Park1
1Department of Environmental Science and Engineering, Ewha Womans University, Seoul 03760, Republic of Korea 5 2Division of Environmental Strategy, Korea Environment Institute, Sejong 30147, Republic of Korea 3Graduate School of Environmental Studies, Seoul National University, Seoul 08826, Republic of Korea 4Center for Gas Analysis, Korea Research Institute of Standards and Science, Daejeon 34113, Republic of Korea 5Science of Measurement, University of Science and Technology, Daejeon 34113, Republic of Korea
Correspondence to: Ji-Hyung Park ([email protected]); Namgoo Kang ([email protected]) 10
Abstract.
Riverine emissions of CO2 and other greenhouse gases (GHGs) represent crucial, but poorly constrained components of the
global GHG budgets. Three major GHGs – CO2, CH4, and N2O – have rarely been measured simultaneously in river systems
modified by human activities, adding uncertainties to the estimates of global riverine GHG emissions. Measurements of C
isotopes in dissolved organic carbon (DOC), CO2, and CH4 were combined with basin-wide surveys of three GHGs in the Han 15
River, South Korea to investigate the effects of dams and urban water pollution as primary controls on GHG dynamics in the
highly human-impacted river basin with a population >25 million. Monthly monitoring and two-season comparison were
conducted at 6 and 15 sites, respectively, to measure surface water concentrations of three GHGs, along with DOC and its
optical properties. The basin-wide surveys were complemented with a boat cruise along the lower reach and synoptic samplings
along a polluted tributary delivering effluents from a large wastewater treatment plant (WWTP) to the lower reach. The basin-20
wide surveys of three GHGs revealed distinct increases in the concentrations of three gases along the lower reach receiving
urban tributaries enriched in GHGs and DOC. Compared to the spatial patterns of GHGs observed in the upper and lower
reaches, the levels of pCO2 were consistently lower across the impounded middle reach, whereas concentrations of CH4 and
N2O were relatively high in some impoundment-affected sites. Similar levels and temporal variations in three GHGs at the
WWTP effluents and the receiving tributary indicated a disproportionate contribution of the WWTP to the tributary exports of 25
DOC and GHGs. Measurements of δ13C in surface water CO2 and CH4 sampled during the cruise along the lower reach,
combined with δ13C and Δ14C in dissolved organic matter (DOM) sampled across the basin, implied that longitudinal decreases
in Δ14C in DOM mighte be associated with wastewater-derived, old DOM in urban tributaries, which, together with enhanced
photosynthesis and CH4 oxidation in the eutrophic lower reach, appear to constrain downstream changes in δ13C in CO2 and
CH4. The overall results suggest that dams and urban wastewater may create longitudinal discontinuities in riverine metabolic 30
processes leading to large spatial variations in three GHGs. Further research is required to evaluate the relative contributions
Biogeosciences Discuss., https://doi.org/10.5194/bg-2018-278Manuscript under review for journal BiogeosciencesDiscussion started: 13 June 2018c© Author(s) 2018. CC BY 4.0 License.
2
of anthropogenic and autochthonous sources to GHG pulses along the lower reach and constrain key factors for the contrasting
impoundment effects including autotrophy-driven decreases in pCO2 and in-lake production of CH4 and N2O.
1 Introduction
A growing body of research on greenhouse gas (GHG) emissions from inland waters has recently generated various global 35
syntheses of CO2 and CH4 data (Cole et al., 2007; Bastviken et al., 2011; Raymond et al., 2013; Lauerwald et al., 2015; Stanley
et al., 2016; Marx et al., 2017) and conceptual frameworks incorporating anthropogenic perturbations as a critical driver of
riverine biogeochemical processes in human-impacted river systems (Kaushal et al., 2012; Regnier et al., 2013; Park et al.,
2018). However, these efforts have been hampered by data scarcity and inequality and inadequate consideration of multiple
GHGs co-regulated by a wide range of concurrent environmental changes including anthropogenic perturbations. Above all, 40
recent global syntheses of CO2 emissions from inland waters commonly emphasized the lack of reliable measurements of the
surface water partial pressure of CO2 (pCO2) in many of large river systems across Asia and Africa (Raymond et al., 2013;
Lauerwald et al., 2015). Furthermore, three major GHGs (CO2, CH4, and N2O) have rarely been measured simultaneously
across different components of river systems except for a small number of large, ‘natural’ rivers such as the Amazon (Richey
et al., 1988) and the Congo (Borges et al., 2015) or highly human-impacted systems (Smith et al., 2017; Wang et al., 2017b). 45
While global river systems are now subject to multiple environmental stresses, including those caused by human-made
structures and climate change, most research efforts have been focused on one or a few components of the concurrent
perturbations. A more integrative approach addressing multiple GHGs and anthropogenic perturbations is required to better
constrain the controlling factors and mechanisms for GHG emissions from increasingly human-impacted river systems
worldwide. 50
A small number of studies that measured CO2, CH4, and N2O together in large rivers such as the Amazon and Congo have
revealed some common longitudinal patterns of three GHGs driven by interrelated sources and production mechanisms
(Richey et al., 1988; Borges et al., 2015). For instance, Richey et al. (1988) found large increases in dissolved CO2 and CH4
and slight reductions in N2O in the Amazon mainstem downstream of large floodplains. They suggested that predominant
anaerobic metabolism might drive the enhanced release of CO2 and CH4 from floodplains, concurrently consuming N2O 55
through more efficient denitrification under oxygen-depleted conditions. A regional-scale comparison of three GHGs in 12
African rivers also showed similar relationships between three GHGs and wetland extents within the basin (Borges et al.,
2015). These previous studies have used positive relationships between dissolved organic carbon (DOC) concentrations and
CO2 and other GHGs as an indication of the riverine heterotrophy driving in-stream production of GHGs (Borges and Abril,
2011; Borges et al., 2015; Teodoru et al., 2015). The widely used concept of river continuum from headwater to mouth assumes 60
gradual and continual changes in riverine organic matter composition and metabolic processes corresponding to downstream
variations in environmental conditions and biotic communities along the river (Vannote et al., 1980). However, it remains
unexplored whether the traditional view of gradual longitudinal variations in riverine organic matter composition and its
Biogeosciences Discuss., https://doi.org/10.5194/bg-2018-278Manuscript under review for journal BiogeosciencesDiscussion started: 13 June 2018c© Author(s) 2018. CC BY 4.0 License.
3
transformations can explain riverine dynamics of GHGs driven by a combination of multiple environmental factors specific to
various natural and human-impacted river systems. 65
Measurements of multiple GHGs in highly human-impacted river systems have provided drastically different pictures of the
longitudinal and seasonal patterns of GHGs from those observed in large natural rivers (Silvennoinen et al., 2008; Burgos et
al., 2015; Crawford et al., 2016; Smith et al., 2017; Wang et al., 2017b). A growing number of dams constructed on rivers
worldwide have altered riverine flows of water and materials to the oceans, trapping over 100 billion metric tons of sediment
and up to 3 billion metric tons of C in the reservoirs constructed over the last five decades (Syvitski et al., 2005). The trapping 70
of sediments and nutrients in reservoir sediments, combined with increased water retention time and improved light conditions
promoting primary production, can alter significantly the rate of production and consumption of CO2 and CH4 in impounded
waters (Maavara et al., 2017). Many studies have examined impoundment effects on GHG emissions from various types and
sizes of dams including hydroelectric dams, often reporting contrasting results such as large pulse emissions of CO2 and CH4
from the flooded vegetation and sediments following dam construction and an enhanced primary production and CO2 sink in 75
eutrophic reservoirs (Abril et al., 2005; Chen et al., 2009; Barros et al., 2011; Hu and Cheng, 2013; Maeck et al., 2013;
Crawford et al., 2016; Maavara et al., 2017; Shi et al., 2017). These contrasting impoundment effects can be explained by the
shifting balance between autotrophy and heterotrophy at diel to decadal timescales (Park et al., 2018). However, little is known
about complex interplays among multiple factors and mechanisms concurrently affecting the production and consumption of
three GHGs. While enhanced primary production and anaerobic metabolism may play a determining role in long-term changes 80
in CO2 and CH4 emissions from the water column and sediments in impounded reaches, external inputs of organic matter and
nutrients have also been suggested as a primary control on GHG emissions from urban streams and rivers (Alshboul et al.,
2016; Smith et al., 2017; Wang et al., 2017b). Longitudinal surveys conducted along urbanized rivers have observed large
pulsatile increases in CO2 and other GHGs in rivers receiving the effluents from wastewater treatment plants (WWTPs)
(Garnier et al., 2013; Burgos et al., 2015; Alshboul et al., 2016; Yoon et al., 2017). WWTP effluents and other anthropogenic 85
sources can not only exert direct effects on riverine GHG dynamics via discharged loads of GHGs, DOC, and nutrients but
also modify riverine metabolic regimes (Garnier and Billen, 2007; Park et al., 2018). The complexity of involved metabolic
processes, together with the multiplicity of environmental conditions and anthropogenic perturbations, poses a great challenge
for a systematic understanding of GHG dynamics in human-impacted river systems.
The Han River basin exhibits unique longitudinal variations in dominant land use and anthropogenic perturbations, offering a 90
venue for various biogeochemical studies of riverine organic matter and CO2 dynamics (Fig. 1; Jung et al., 2012; Jin et al.,
2016; Yoon et al., 2017). Although headwater streams feeding into the upper reach drain largely forested mountainous terrain,
the recent expansion of croplands on steep slopes has resulted in high levels of nutrients and suspended sediment in downstream
waters receiving agricultural runoff, particularly during heavy monsoon rainfalls (Park et al., 2010). A series of dams on the
middle reach of the North Han River may create “serial discontinuity” in riverine metabolic processes and GHG emissions 95
(Ward and Stanford, 1983; Park et al., 2018), while urban tributaries draining the densely populated Seoul metropolitan area
with a population >25 million discharge pulsatile loads of nutrients, DOC, and GHGs to the lower Han River (Yoon et al.,
Biogeosciences Discuss., https://doi.org/10.5194/bg-2018-278Manuscript under review for journal BiogeosciencesDiscussion started: 13 June 2018c© Author(s) 2018. CC BY 4.0 License.
4
2017). Building on our previous studies focused on CO2 dynamics along the Han River (Yoon et al., 2016, 2017), this study
aims to compare basin-wide patterns of surface water CO2, CH4, and N2O. The primary objective was to examine the effects
of impoundments and urban water pollution on the spatiotemporal variations in three major GHG concentrations. Another 100
important goal was to track longitudinal variations in major sources of DOM and GHGs by combining measurements of C
isotopes in DOC, CO2, and CH4 with a basin-scale monitoring of three GHGs. Unlike other studies focused on the quantitative
importance of inland waters as sources of GHGs, this study aims to examine basin-scale patterns of riverine GHG dynamics
against the conceptual frameworks that can explain longitudinal variations in riverine dissolved organic matter (DOM) and
GHGs (refer to Park et al., 2018 and references therein), so only concentration data are presented without providing estimated 105
emissions of three GHGs. We expected that the comparison of reach-specific spatial patterns of three GHGs and C isotopic
composition in DOM, CO2, and CH4 in the river system modified by river impoundment and pollution would provide
invaluable field data essential for examining emerging concepts of anthropogenically created discontinuities in riverine
metabolic processes and GHG emissions.
2 Materials and methods 110
2.1 Study site
The Han River, consisting of the North Han and South Han branches and the lower Han River (called just “Han River”), drains
an area of 26,142 km2 in the middle of the Korean Peninsula (Fig. 1; Yoon et al., 2017). The mean annual precipitation in the
Han River basin was 1323 mm for the period from 1983 to 2014, with up to 70% of the annual precipitation concentrated
during four months from June to September (Seoul Metropolitan Government, 2017). Major land uses in the basin include 115
forests (73.6%), croplands (14.1%), urban and industrial areas (2.6%), and other uses (9.7%), while the highly urbanized
metropolitan area along the lower reach has a large impermeable surface accounting for 58% of the total city area of Seoul
(Seoul Metropolitan Government, 2017). Sampling sites were established along a North Han River section and the lower Han
River, covering forested headwater and agricultural streams along the upper reach through the middle and lower reaches
impounded by dams and submerged weirs to the estuary. 120
Along the monitored reaches of the North Han River, four large multi-purpose hydroelectric dams have been constructed since
1943. The most upstream dam (Soyang; HR5) constructed in 1973 is the largest (height: 123 m; reservoir surface area: 70
km2). The most downstream dam constructed in 1973 (Paldang; HR10) located at the confluence of the North and South Han
branches regulates river flow to the lower reach and supplies 2.6 million metric tons of water per day to the 25 million
metropolitan population. Three major urban tributaries [Jungnang River (JN; HR12), Tan River (TC), and Anyang River (AY)] 125
feed into the channelized lower Han River with submerged weirs at both ends. The tributary JN drains an area of 300 km2
inhabited by 3.6 million. Three WWTPs release treated sewage at the rate of 1.5 million m3 d-1 to the tributary (JN), with the
bulk (1.3 million m3 d-1) discharged from the monitored WWTP (Ministry of Environment, 2015). Four WWTPs located within
Seoul release effluents from tertiary treatments at the rate of 4.3 million m3 d-1.
Biogeosciences Discuss., https://doi.org/10.5194/bg-2018-278Manuscript under review for journal BiogeosciencesDiscussion started: 13 June 2018c© Author(s) 2018. CC BY 4.0 License.
5
2.2 Sampling and field measurements 130
Basin-wide surveys were carried out at 15 sites encompassing major land uses and human-induced perturbations in the Han
River basin during a summer monsoon period (July 2014) and in a dry period (May 2015) (Table 1). At 6 selected sites (HR1,
HR2, HR4, HR8, HR11, and HR14), routine monitoring was continued at monthly intervals from July 2014 to July 2015 except
for two winter months (January and February 2015). In addition to two-season surveys, 13 samplings were conducted at an
outlet of the tributary JN (HR12) from May 2015 to December 2017. In November 2015 and May 2016, additional samples 135
were collected at 8 locations along the JN, from a forested headwater stream to the outlet (Fig. 1). The tributary samplings
were complemented with 4 samplings at a discharge from a WWTP located a few km upstream of the JN outlet. To explore
spatially resolved patterns of riverine concentrations of three GHGs along the lower Han River, water and gas samples were
collected at 8 locations during a boat expedition that also aimed at continuous underway measurements of pCO2 using
automated pCO2 measurement systems as reported by Yoon et al. (2017). 140
In each sampling, water samples were collected from a depth of 10–20 cm below the water surface in the middle of the stream
channel or > 2 m away from the river bank. Spot water samples for chemical analysis were collected through a peristaltic pump
(Masterflex E/S portable sampler, Cole-Palmer Instrument Co., USA) into acid-washed amber glass bottles. At the same
sampling point we measured water temperature, pH, electrical conductivity (EC), and dissolved oxygen (DO) using a portable
pH meter (Orion 5-Star Portable, Thermo Scientific, USA). Surface water concentrations of three GHGs were measured by a 145
manual headspace equilibration method (Kling et al., 1992; Yoon et al., 2016). Headspace equilibration was performed using
a polypropylene syringe (60 ml; HSW Norm-Ject Luer Lock Tip; Henke-Sass Wolf GmbH, Germany) to collect a 30 mL water
sample and then a 30 mL ambient air sample. Another air sample was collected to measure gas concentrations in the ambient
air. The syringe containing the water and air samples was shaken vigorously for 2 min; then 20 mL of the equilibrated air
was stored in a pre-evacuated 12 mL glass vial (Exetainer, Labco, UK). The stored gas sample volume was larger than the vial 150
volume to create overpressure and hence minimize gas concentration change associated with potential gas leakage. Vials had
been flushed with high-purity N2 gas before the filled N2 gas was evacuated by a pump. Gas analysis was performed usually
within three days after the sampling. Air temperature and barometric pressure were measured in situ by a portable sensor
(Watchdog 1650 Micro Station, Spectrum Technologies Inc., USA). Barometric pressure, together with water temperature,
was used to calculate concentrations of three GHGs from the gas concentrations of the equilibrated air and ambient air samples 155
based on Henry’s law (Hudson, 2004). Details on the calculation algorithms and Henry’s law constants for three GHGs are
provided in Hudson (2004).
2.3 Laboratory analyses
The equilibrated headspace air sample, as well as a sample from the ambient air used for equilibration, was injected into a GC
(7890A, Agilent, USA) equipped with an FID coupled with a methanizer (for analysis of CH4 and CO2), a ECD (for N2O 160
analysis), and a Supelco Hayesep Q 12 ft 1/8” column for the simultaneous measurement of three GHGs. High-purity N2 gas
Biogeosciences Discuss., https://doi.org/10.5194/bg-2018-278Manuscript under review for journal BiogeosciencesDiscussion started: 13 June 2018c© Author(s) 2018. CC BY 4.0 License.
6
(99.999%) was used as carrier gas at a constant flow rate of 25 mL min−1. The flow rate of the reference gas was 5 mL min−1
for FID (N2) and 2 mL min−1 for μECD (Ar/CH4).Temperature settings include the inlet at 250℃, the oven at 60℃, the valve
box at 100℃, FID at 250℃, and ECD at 300℃. The volume of the sample loop was 1 mL. Standard reference gases of three
GHGs in N2 balance (RIGAS Corporation, Korea) were used to calibrate the GC signals. The gas concentrations in these 165
calibration standards were verified in the gas analysis laboratory of Korea Research Institute of Standards and Science (KRISS)
that established the national measurement standards of gravimetrically prepared CO2 in dry air and certified by a suite of gas
analysis (Min et al., 2009). Additional headspace equilibration samples collected during the boat cruise in June 2016 were
analysed for stable C isotope ratios of CO2 (δ13CCO2) and CH4 (δ13CCH4) by a GasBench-IRMS (ThermoScientific, Bremen,
Germany) at the UC Davis Stable Isotope Facility. 170
Water samples were filtered through pre-combusted (450°C) glass fiber filters (GF/F, Whatman; nominal pore size 0.7 µm) at
the laboratory. The concentration of total suspended solid (TSS) was measured as the difference in the filter weight before and
after drying at 60°C for 48 hours. Filtered water samples were analyzed for dissolved organic C, fluorescence excitation-
emission matrices (EEMs), UV absorbance, total alkalinity (TA), dissolved ions, and chlorophyll a (Chl a). For quality control
of all chemical analyses, standards with known concentrations and ultrapure water were analyzed for every batch of ten samples 175
and triplicate analysis was performed for approximately 10% of all analyzed samples to assess instrumental stability and
accuracy.
DOC was measured by a total organic carbon (TOC) analyzer using high-temperature combustion of OM followed by thermal
detection of CO2 (TOC-VCPH, Shimadzu, Japan). UV absorbance was measured across the wavelength range from 200 to 1100
nm using a UV-Vis spectrophotometer (8453, Agilent, USA). Fluorescence EEMs were collected on a fluorescence 180
spectrophotometer (F7000, Hitachi, Japan) by simultaneous scanning over excitation wavelengths from 200 to 400 nm at 5 nm
interval and emission wavelengths from 290 to 540 nm at 1 nm interval. Scan speed was 2400 nm min-1 and the bandwidth
was set to 5 nm for both excitation and emission. UV absorbance and fluorescence data were used to calculate specific UV
absorbance at 254 nm (SUVA254) (Weishaar et al., 2003), fluorescence index (FI) (McKnight et al., 2001), humification index
(HI) (Zsolnay et al., 1999), and common fluorescence EEM components (Fellman et al. 2010). Three fluorescent EEM 185
components termed C1 (excitation/emission peaks at 325/467 nm), C2 (315/404 nm), and C3 (275/354 nm) were used to
represent humic-like, microbial humic-like, and protein-like fluorescence, respectively (Fellman et al., 2010). TA was
determined with 40–80 mL filtered samples on an automated electric titrator (EasyPlus Titrator Easy pH, Metrohm,
Switzerland) based on the Gran titration method. Strong acid (0.01 N HCl) was used to titrate well beyond the equivalence
point at pH between 4 and 3. Ions dissolved in water samples were analysed on an ion chromatograph (883 Basic IC plus, 190
Metrohm, Switzerland). Chl a was analyzed spectrophotometrically following filtration on GF/C filters and acetone extraction
(American Public Health Association, 2005).
Dual carbon isotopes analyses were conducted for water samples collected from six monthly monitoring sites and the JN
WWTP effluents. Subsamples of filtered water samples were kept frozen before analysis. For Δ14C-DOC analysis, each water
sample was acidified by 40% H3PO4 solution and sparged by helium gas to remove inorganic carbon. Then, the sample was 195
Biogeosciences Discuss., https://doi.org/10.5194/bg-2018-278Manuscript under review for journal BiogeosciencesDiscussion started: 13 June 2018c© Author(s) 2018. CC BY 4.0 License.
7
oxidized with ultrahigh purity oxygen gas using UV lamp for 4 hours (Raymond and Bauer, 2001). The oxidized CO2 was
separated cryogenically with liquid N2 in a vacuum line and sealed in a pre-baked pyrex tube. The CO2 samples in the sealed
pyrex tubes were sent to the National Ocean Sciences Accelerator Mass Spectrometry (NOSAMS) facility at the Woods Hole
Oceanographic Institution for dual isotope analysis (Δ14C and δ13C) where accelerated mass spectrometer and isotope ratio
mass spectrometer were used for Δ14C and δ13C analysis, respectively (http://www.whoi.edu/nosams/home). The CO2 samples 200
were transformed to graphite targets for Δ14C analysis by accelerated mass spectrometry.
2.4 Statistical analysis
Most dissolved GHGs and water quality data were not normally distributed, and their distribution patterns varied with river
reach and measured parameter Therefore, Kendall rank correlation, as a non-parametric test, was performed using the Kendall
package of R (R Development Core Team, 2018) to investigate the relationships between water quality variables and dissolved 205
GHGs both for the whole Han River basin and for each of the upper, middle, and lower reaches. For reach-specific analysis,
sampling sites were grouped into three reaches, as shown on Fig. 1. The upper reach includes sites HR1 to HR4 (outlet of the
major tributary to the Lake Soyang, HR5). The middle reach covers the first dam on the monitored transect (HR5) through
three downstream dams and ends up at HR 11,which receives discharge from the most downstream dam (HR10). The lower
reach includes the mainstem (HR13, HR14, and HR15) and tributary sites [TC, JN (HR12), and AY] downstream of the first 210
submerged weir in Seoul (Fig. 1). Regression analysis was conducted with the data pooled for the whole basin for some water
quality measurements (pH, DO, and DOC), which exhibited strongly significant relationships with all or some of three GHGs.
The best-fit regression was established using a data analysis and graphing software (SigmaPlot, Version 12.5).
3. Results
3.1 Longitudinal variations in GHG concentrations and DOM characteristics along the Han River 215
Two basin-wide surveys from the forested headwater stream through the impounded middle reach to the highly urbanized
lower reach, combined with the monthly monitoring at six selected sites, revealed distinct longitudinal patterns of pCO2 and
concentrations of CH4 and N2O along the Han River (Figs. 2, 3, 4; Tables 1, S1, S2, S3). All three GHGs exhibited relatively
small, but noticeable increases in the agricultural stream from the generally low values found in the forested headwater stream
and large downstream increases along the lower reach flanked by two submerged weirs (Fig. 2; Table 1). Gas concentrations 220
at some lower-reach sites approached or exceeded the levels found in three tributaries draining the urban subcatchments located
in Seoul and surrounding suburban areas (Fig. 2). Levels of pCO2 in the middle reach (HR5 – HR11; 51 – 761 atm) were
particularly lower at sites within a few km upstream or downstream of the cascade dams, whereas N2O and CH4 concentrations
showed noticeable increases in one (HR6; 212 nM N2O L-1) or three dam sites (HR6, HR7, and HR10; 693 – 748 nM CH4 L-
1), respectively, compared to the less impacted upstream or downstream reaches (Table 1). While pCO2 tended to be higher in 225
Biogeosciences Discuss., https://doi.org/10.5194/bg-2018-278Manuscript under review for journal BiogeosciencesDiscussion started: 13 June 2018c© Author(s) 2018. CC BY 4.0 License.
8
summer than in other seasons at all monthly monitoring sites except HR8 and HR 11, which might be more affected by the
cascade dams along the middle reach, no clear seasonality was found for CH4 and N2O (Fig. S1).
DOC concentrations and FI exhibited gradual downstream increases toward the river mouth with the exception of relatively
high FI values in the agricultural stream, whereas HIX generally decreased downstream along the river (Fig. 3; Tables S1, S2,
S3), The concentrations of three measured nutrients (NH4+, NO3
‒, and PO43‒) were generally higher at the agricultural stream 230
and the lower-reach sites than at the other sites. The comparison of monthly water quality measurements between the six sites
and the urban tributary (HR12) points to urban tributary inputs as a driving force for the downstream increases in concentrations
of DOC and nutrients observed in the lower reach (Fig. 3). The urban tributary was highly enriched in DOC, FI, protein-like
DOM moieties (C3/DOC), and three nutrients, whereas it exhibited relatively low values of pH, DO, HIX, and Chl a (Fig. 3;
Tables S1, S2, S3). Downstream changes in all water quality measurements between the two lower-reach sites (HR11 and 235
HR14) appeared to correspond to either very high or very low values observed in the tributary (HR12) compared to the
upstream values.
When all measured gas concentrations were related to water quality measurements pooled for the whole river basin, all or two
of three GHGs exhibited significant positive or negative relationships with pH, DO, and DOC (Fig. 4). While only pCO2 had
a strong (P < 0.001) negative relationship with pH, all three gases exhibited negative relationships with DO and positive 240
relationships with DOC. Kendall rank correlation analyses conducted with all measurements grouped for each of three reaches
revealed reach-specific patterns of significant correlations for three GHGs (Fig. 5; Table S4). Significant negative correlations
were found between pCO2 and three related water quality measurements − pH, DO, and Chl a in the lower reach. These
negative correlations were either absent for N2O or significant only with DO in the case of CH4. Compared to no or weak
correlations observed for the upper and middle reaches, some parameters measured in the lower reach, including water 245
temperature, PO43−, C1/DOC, and C2/DOC, exhibited strong positive correlations with pCO2. Values of pCO2 measured at the
middle reach sites had some negative correlations with pH, TA, water temperature, cations (Na+, K+, and Mg2+), and anions
(Cl− and SO42−). These shifting correlations across the reaches were also found for CH4 and N2O, but to varying degrees. CH4
in the lower reach had significant, but relatively weak correlations with PO43−, C1/DOC, and C2/DOC, whereas N2O showed
strong positive correlations with parameters such as EC, TA, all measured cations, Cl−, NO3−, SO4
2−, DOC, FI, and C3/DOC. 250
In the case of CH4, stronger correlations were found in the upper reach, including pH, EC, TA, cations (K+, Ca2+, and Mg2+),
anions (Cl− and SO42−), FI, and C3/DOC, but these correlations were weaker or insignificant in the middle or lower reach.
3.2 Longitudinal variations in GHG concentrations and DOM characteristics along an urban tributary
Two synoptic samplings along the urban tributary (JN), complemented with additional samplings at a tributary outlet (HR12)
and an upstream WWTP discharge, pointed to WWTP effluents driving the concentrations of three GHGs, DOC, and nutrients 255
measured at the tributary outlet (Fig. 6; Table S5). Similar ranges of three GHG concentrations observed in the WWTP
effluents and the tributary outlet corroborate the dominant contribution of WWTP effluents to the tributary GHG exports to
Biogeosciences Discuss., https://doi.org/10.5194/bg-2018-278Manuscript under review for journal BiogeosciencesDiscussion started: 13 June 2018c© Author(s) 2018. CC BY 4.0 License.
9
the lower Han River. Both pCO2 and N2O concentrations increased abruptly along the most downstream reach after passing
the WWTP located within a few km upstream. In contrast, CH4 concentrations exhibited relatively large fluctuations along the
middle reach and reached in the WTTP effluents and the tributary outlet intermediate levels of the upstream values measured 260
in November 2015 and May 2016. Corresponding to the large scatters of the box plots representing three GHG concentrations
measured at the WWTP effluents and outlet site, two locations exhibited similar patterns of temporal variations in GHG
concentrations. The observed temporal variations in gas concentrations were not significantly related to fluctuations in
temperature, precipitation, and streamflow measured near the tributary outlet site, although three gases exhibited some
decreases in concentration during wet summer months in 2016 and 2017 (Fig. 6d). 265
3.3 C isotopes in DOM, CO2, and CH4
Dual C isotope analyses of DOM samples collected at seven sites provided information on the longitudinal evolution of the
stable and radioactive C isotope ratios along the Han River (Fig. 7; Table S6). In both wet-season (July 2014) and dry-season
(May 2015) samplings, Δ14C generally decreased downstream toward the river mouth, with higher values observed during the
July sampling across the mainstem sites. An exceptionally high value was found at the second most downstream mainstem site 270
(HR11), which is located 17 km downstream of the last of the cascade dams. The values of Δ14C measured in the urban tributary
and WWTP effluent (around −100) were below those measured for all mainstem sites. δ13C was highly variable at two middle-
reach sites and increased almost linearly from the second most downstream site though the urban tributary and WWTP effluents
to the last site (Fig. 7).
Concentrations of three GHGs (Fig. 8; Table S7) combined with δ13C in CO2 and CH4 (Fig. 8; Table S8) collected along the 275
lower Han River during a cruise expedition revealed clear tributary effects on the C isotopic composition of two GHGs sampled
at the mainstem sites. δ13CCO2 values ranging from −20.9 to −16.7 were distinctively higher than the range of δ13CDOC measured
at the same sites (−28.2 to −20.6). δ13CO2 continued to increase toward the river mouth, with its values bracketed by those
measured for the two upstream tributaries and a downstream tributary. The downstream tributary had lower pCO2, higher
δ13CO2, and higher concentrations of CH4 and Chl a relative to the upstream tributaries. The values of δ13CH4 also showed an 280
overall increasing trend along the lower reach, except for some localized decreases downstream of the urban tributary (HR12).
4 Discussion
4.1 Reach-specific patterns and controls on three GHGs
Building on our previous report on CO2 dynamics in the Han River basin (Yoon et al., 2016, 2017), this study provided a more
comprehensive view of longitudinal patterns in three GHGs across the upper, middle, and lower reaches affected by different 285
types and magnitudes of anthropogenic perturbations (Figs. 2−4). All three GHGs exhibited large longitudinal variations
associated with gas-specific increases at impoundment-affected sites and localized pulses along the lower reach downstream
Biogeosciences Discuss., https://doi.org/10.5194/bg-2018-278Manuscript under review for journal BiogeosciencesDiscussion started: 13 June 2018c© Author(s) 2018. CC BY 4.0 License.
10
of polluted urban tributary inflows. Although pCO2 at some impoundment-affected sites was very low, approaching or falling
below the atmospheric equilibrium, three GHGs were generally supersaturated with respect to the atmosphere across the river
basin (Table 1; Fig. 2). Very high levels of pCO2 observed in the lower reach of the Han River (up to 4132 atm) and its three 290
urban tributaries (up to 11970 atm) fall in the high ranges found in some polluted rivers in Europe (Kempe, 1984;
Frankignoulle et al., 1998; Borges et al., 2006) and China (Yao et al., 2007; Ran et al., 2015; Liu et al., 2016; Wang et al.,
2017). Consistent with these previous reports on pCO2 and other studies reporting high levels of CH4 and N2O in polluted
urban waters (Garnier et al., 2013; Yu et al., 2013; Smith et al., 2017; Wang et al., 2017b, 2018), the results observed in this
study emphasize the dominant influence of urban tributaries carrying wastewater as a primary anthropogenic source of GHGs 295
in the highly urbanized river system.
Different longitudinal patterns in three GHGs (Fig. 2), together with reach-specific significant correlations between GHGs and
other measured water quality components (Fig. 5; Table S4), illustrate that the spatial distribution and temporal dynamics of
three GHGs in the Han River basin may be significantly different from those found in natural or less impacted river systems.
While the extent of major natural sources such as wetlands and floodplains has been considered as the primary factor for 300
longitudinal variations in CO2 and CH4 in large rivers (Richey et al., 1988; Borges et al., 2013), the lack of these natural
sources, along with the distinct patterns of GHGs attributed to dams and urban wastewater, suggests that altered water retention
time and nutritional status might exert critical controls on the production and consumption of three GHGs in this highly
regulated river system. Although it would be very challenging to tease out multiple, interrelated factors as shown by previous
studies of GHG dynamics in urbanized river systems (Smith et al., 2017; Wang et al., 2017b), the observed longitudinal patterns 305
in GHGs (Figs. 2−4) and their correlations with specific sets of water quality components (Fig. 5) emphasize that the primary
factors and mechanisms for the production and consumption of three GHGs may change in response to longitudinal variations
in dominant anthropogenic perturbations, often abruptly as shown by the localized pulses of GHGs downstream of urban
tributary inflows (Figs. 2, 8).
Spatial variations in three GHGs observed along the middle reach (Figs. 2 – 4) suggest that complex interacting metabolic 310
processes in water column and sediment influence the levels of three GHGs to varying degrees depending on gas and reservoir.
Lower values of pCO2 measured at all impoundment-affected sites including site HR11 downstream of the last dam (HR10)
indicate an enhanced planktonic CO2 uptake, in agreement with enhanced photosynthesis and lowered pCO2 levels observed
in some eutrophic impounded reaches of the Mississippi (Crawford et al., 2016), the Yangtze (Liu et al., 2016), and a Yellow
River tributary (Ran et al., 2017). However, other studies have reported drastic increases in CO2 and CH4 emissions from the 315
flooded vegetation and soils in the early years following dam construction (Abril et al., 2005; Chen et al., 2009; Shi et al.,
2017). Given the negative relationship established between reservoir age and emissions of CO2 and CH4 from a wide range of
hydroelectric reservoirs (Barros et al., 2011), pulses of GHGs from the newly constructed reservoirs might taper gradually
with increasing reservoir age. Unlike other studies that have reported significant negative relationships between Chl a and
pCO2 in eutrophic impounded rivers (Crawford et al., 2016; Liu et al., 2016; Ran et al., 2017), pCO2 was not correlated with 320
Chl a in the middle reach, but had some significant positive correlations with DOM optical properties such as HIX, C1/DOC,
Biogeosciences Discuss., https://doi.org/10.5194/bg-2018-278Manuscript under review for journal BiogeosciencesDiscussion started: 13 June 2018c© Author(s) 2018. CC BY 4.0 License.
11
and C2/DOC (Fig. 4), which may be associated with terrestrial DOM components and their microbial transformation products
(Fellman et al., 2010; Parr et al., 2015). It is likely that the narrow ranges of pCO2 and Chl a did not result in any significant
correlation. However, the concurrence in the relatively high levels of pCO2 and DOC moieties of terrestrial origin at some
middle reach sites that are less affected by impoundments (e.g., HR 7 and HR8) might have resulted in the observed significant 325
correlations.
Although a small number of measurements of CH4 and N2O and their inconsistent spatial patterns observed along the
impounded middle reach (Fig. 2; Tables S2, S3) require a cautious assessment of dam effects, the higher values of CH4 and
N2O measured in some dams and outflows compared to upstream levels indicate dam-specific conditions driving the
production and consumption of CH4 and N2O in reservoir water or sediments. Crawford et al (2016) observed a weak summer-330
time CO2 sink due to enhanced photosynthesis but elevated concentrations and fluxes of CH4 along the upper Mississippi River
reaches impounded by a series of low-head dams. They attributed the observed supersaturation in CH4 to anaerobic conditions
in organic-rich sediments. Despite no correlation between CH4 and DO levels in the middle reach (Fig. 5; Table S4), the fact
that CH4 levels were higher at three shallower dam sites (HR6, HR7, and HR10) than at the most upstream dam (HR5), which
is very deep with a maximum depth reaching 110 m, implies the balance between anaerobic CH4 production in bottom sediment 335
and CH4 oxidation in aerobic water column as a driving force for the observed spatial variations. Shallow reservoirs and river
inflows accumulating methanogenic sediments have been identified as CH4 emission hot spots in impounded river systems
due to comparatively low rates of CH4 oxidation in aerobic water column (Maeck et al., 2013; Beaulieu et al., 2014). The
significant correlation between CH4 and DOC (Figs. 4, 5) is consistent with other studies relating DOC to CH4 production in
reservoirs based on the coupling between anaerobic organic matter degradation and methanogenesis (Chen et al., 2009; Wang 340
et al., 2017b). Higher CH4 values measured at warmer temperatures are also in agreement with the higher rates of CH4
production observed during warm summer months in a shallow reservoir in Ohio, USA (Beaulieu et al., 2014). N enrichment
alone or together with anaerobic conditions favourable for denitrification has been suggested as the key control on N2O
production in impoundments (Beaulieu et al., 2015; Wang et al., 2017b). The lack of clear dam effects on N2O except for one
dam site (HR6; Fig. 2) might be explained by complex interactions between microbial N transformations in the oxygen-rich 345
epilimnion and oxygen-poor hypolimnion (Beaulieu et al., 2015).
Large increases in GHG concentrations along the lower reach might be explained by a suite of related processes including in-
stream metabolisms and direct inputs from WWTPs. Direct influences of wastewater-derived GHGs have been observed in
urban rivers receiving WWTP effluents (Garnier et al., 2013; Yu et al., 2013; Burgos et al., 2015; Alshboul et al., 2016; Wang
et al., 2017a; Yoon et al., 2017). For example, large pulses of CH4 and N2O in the Guadalete River estuary in Spain were found 350
near the discharge from a WWTP, as a combined result of direct gas emissions from WWTP effluents and indirect effects on
the production of CH4 and N2O in water channel and benthic sediments downstream (Burgos et al., 2015). Previously we used
a mass balance approach based on three cruise underway measurements of pCO2 to show that two tributaries JN and TC
delivering WWTP effluents accounted for 72% of the CO2 concentration measured at a downstream location in the lower Han
River (Yoon et al., 2017). Comparison of tributary-delivered CO2 with estimated rates of CO2 production, consumption, and 355
Biogeosciences Discuss., https://doi.org/10.5194/bg-2018-278Manuscript under review for journal BiogeosciencesDiscussion started: 13 June 2018c© Author(s) 2018. CC BY 4.0 License.
12
outgassing along the downstream reach suggested that in June 2016 CO2 produced from biodegradation was much greater than
CO2 consumed by phytoplankton and similar to the amount of CO2 outgassed, while the bulk of CO2 delivered by the tributaries
was consumed by planktonic photosynthesis along the same reach in May 2015, when Chl a concentrations were much higher
than in June 2016 (Yoon et al., 2016). As observed in other polluted rivers enriched in labile DOM moieties derived from
urban sewage (Guo et al., 2015), newly produced CO2 from active microbial decomposition can sometimes exceed the 360
planktonic CO2 uptake depending on the prevailing environmental conditions. By directly measuring δ13C in CO2 respired by
bacterioplankton across a gradient of streams and lakes in Canada, McCallister and del Giorgio (2008) showed that the
production of CO2 through bacterial degradation of terrigenous DOM decreased in sharp contrast to the increasing proportion
of algal-derived DOC and CO2 with increasing levels of Chl a, implying an algal-driven activation of metabolism in eutrophic
freshwater. However, it remains largely unexplored how the balance between autotrophy and heterotrophy in eutrophic river 365
systems shifts in response to changing environmental conditions (Garnier and Billet, 2007).
Large down-river increases (Fig. 2) and temporal variability (Figs. 3, S1) in CH4 and N2O along the lower reach may result
from a combination of processes including direct WWTP discharge and in-stream production and consumption. As indicated
by the similar ranges of two gases found in the WWTP effluents and the tributary JN outlet (Fig. 6), the amount of CH4 and
N2O discharged from the WWTP appeared to drive the magnitude and temporal variability of the tributary inputs to the lower 370
reach. However, various riverine processes need to be considered to explain the downstream spatial patterns of these gases, as
indicated by the gas-specific sets of significant correlations with measured water quality components (Fig. 5). In contrast to
the lacking or weak correlations indicative of anaerobic CH4 production in the impounded middle reach, CH4 measurements
in the lower reach exhibited significant negative (DO) or positive (water temperature, C1/DOC, and C2/DOC) correlations
related to anaerobic metabolism. As observed in other urbanized river systems (Beaulieu et al., 2015; Smith et al., 2015; Wang 375
et al., 2018), eutrophication (indicated by significant positive correlation with PO43−), together with lowered DO, might create
favourable conditions for anaerobic methanogenesis in the lower reach almost impounded by two submerged weirs. Out of
many water quality components that were significantly correlated with N2O (Fig. 5), NH4+ and NO3
− have been considered as
two of the most important predictors of riverine N2O, particularly in urban streams and rivers influenced by sewage (Yu et al.,
2013, He et al., 2017; Smith et al., 2017). The lack of significant correlation with DO in the lower reach may indicate 380
nitrification overweighing denitrification as the dominant process of N2O production, although we cannot exclude the role of
anaerobic N2O production given the significant negative relationship between DO and N2O data for the whole Han River basin
(Fig. 4).
4.2 Tracking sources of DOM and GHGs using C isotopes
The dual C isotope ratios in DOM measured at five monthly monitoring sites, the tributary JN outlet, and an adjacent WWTP 385
discharge fall within the ranges associated with soil organic matter (SOM) and phytoplankton biomass (Fig. 7; Raymond and
Bauer, 2001; Marwick et al., 2015 and references therein). When Marwick et al. (2015) compared 695 measurements of
Δ14CDOC in a wide range of global river systems, most data fell between −100 and +200‰, with 72 of the data indicating a
Biogeosciences Discuss., https://doi.org/10.5194/bg-2018-278Manuscript under review for journal BiogeosciencesDiscussion started: 13 June 2018c© Author(s) 2018. CC BY 4.0 License.
13
modern age compared to the much smaller proportion of modern POC (22% of 483 POC data). Although the relatively large
between-site variations in both δ13CDOC and Δ14CDOC make it difficult to evaluate the relative contributions of allochthonous 390
and autochthonous sources, the distinct seasonal differences in isotopic signatures show that the age of DOM is generally
younger at five mainstem sites across the river basin during the monsoon period (July 2014; modern − 590 years B.P.) than in
the dry season (May 2015; 180 − 675 years B.P.) (Fig. 7). This seasonality might have resulted from an increased contribution
of DOM moieties released from terrestrial sources during monsoon rainfalls. 14C-enriched DOC identified in other temperate
river systems has been attributed to a larger contribution from 14C-enriched litter and soil organic matter and shorter residence 395
times of DOM in systems with higher annual precipitation (Raymond and Bauer, 2001; Butman et al., 2015). The latitudinal
decreases in Δ14C along the mainstem toward the values found in the urban tributary and WWTPs point to the dominant
contribution of DOM derived from anthropogenic sources. The values of 13CDOC (−25.8) and Δ14CDOC (−97.9, −113.5)
measured in WWTP effluents (Table S6) were similar to those reported by other studies (Griffith et al., 2009; Butman et al.,
2015). As suggested by Griffith and Raymond (2011), aged DOM moieties in WWTP effluents (765 – 905 years B.P.; Table 400
S6) may not only leave clear isotopic signatures on DOM in downstream reaches, but also fuel the riverine heterotrophy by
providing labile sources for biodegradation.
The longitudinal increase in δ13CCO2 from −20.9 ‰ at RKM 76 to −16.7 ‰ at RKM 50 in Fig. 8 results from the complex
interplay between organic matter degradation, planktonic photosynthesis, atmospheric gas exchange, and dissolution of
carbonates of either natural or anthropogenic origin (Barth et al., 2003; Schulte et al., 2011; Zeng et al., 2011; Maher et al., 405
2013). The observed values of δ13CCO2 fall within the reported ranges of δ13C measured for CO2 originating from riverine
organic matter degradation (−25 – −15‰) (Longinelli and Edmond, 1983; McCallister and del Giorgio, 2008). However, these
values are less negative than the ranges of δ13C measured directly for CO2 respired by bacteria consuming organic matter of
terrestrial and algal origin in two streams and eight lakes in Canada (−32.5 – −28.4‰) (McCallister and del Giorgio, 2008),
indicating that other riverine processes than bacterial degradation are involved in shifting δ13C in dissolved CO2. It has been 410
reported that δ13C in riverine DIC derived from carbonate dissolution and bacterial respiration ranges from −15 – −5‰,
reflecting the balance between the concurrent processes that can either enrich or deplete DIC in 13C (Telmer and Veizer et al.,
1999; Barth et al., 2003; Schulte et al., 2011; Zeng et al., 2011). Photosynthesis and atmospheric gas exchange can result in an
enrichment of 13C in remaining riverine CO2 through preferential planktonic uptake of the lighter 12CO2 and dissolution of
atmospheric CO2 enriched in 13C, respectively, whereas the preferential use of the lighter CO2 by heterotrophic bacteria results 415
in decreases in δ13C (Schulte et al., 2011).
Assuming an enrichment of 10 ‰ from dissolved CO2 to DIC (McCallister and del Giorgio, 2008), the estimated δ13C in DIC
(−11 – −7‰) would fall within the usual ranges found in global riverine systems (Schulte et al., 2011). The 4‰ down-river
increase in δ13CCO2 concurred with increases in Chl a (Fig. 8), implying primary production as an important factor affecting
the isotopic composition of dissolved CO2 in the eutrophic reach. The enrichment of 13C in CO2 along the reach downstream 420
of the urban tributaries also indicates a significant contribution from urban tributaries enriched in 13C (TC: –18.3 ‰; JN: –18.2
Biogeosciences Discuss., https://doi.org/10.5194/bg-2018-278Manuscript under review for journal BiogeosciencesDiscussion started: 13 June 2018c© Author(s) 2018. CC BY 4.0 License.
14
‰; AY: –14.7 ‰) relative to the upstream value (–20.9 ‰) (Table S8). Another potential source of isotopic enrichment might
be the production of CH4 from the reduction of CO2 in the deeper water and bottom sediment, which consumes lighter C
resulting in an enrichment of the remaining DIC pool (Barth et al., 2003). However, this mechanism might be less important
than other described processes, because the latitudinal increase in δ13C in CH4 (Fig. 8) indicates an active oxidation occurring 425
through the shallow downstream reach.
While agricultural activities, including rice cultivation, animal husbandry, and N fertilization, represent the primary
anthropogenic source of CH4 and N2O in anthropogenically impacted river systems (Silvennoinen et al., 2008; Garnier et al.,
2013), the relative contribution of wastewater and landfills often increases drastically in urbanized watersheds (Yu et al., 2013;
Smith et al., 2017; Wang et al., 2017b). Downstream changes in CH4 concentrations along the lower reach reflect localized 430
impacts of urban tributary inputs, which caused pulsatile increases in the mainstem CH4 concentrations and decreases in δ13C
in CH4 downstream of the tributary inflow (Fig. 8). The concentrations of CH4 peaked downstream of the tributary inflow, but
gradually decreased along the downstream reach, indicating efficient CH4 oxidation. Similar localized effects of WWTP
effluents were observed in the lower reaches of Seine River, downstream of Paris and Rouen, France (Garnier et al., 2013).
Down-river concentration decreases and 13C enrichment in CH4 are consistent with the underway measurements conducted 435
using a cavity ring-down spectroscopy(CRDS) along a 15 km reach of the North Creek estuary in Australia, which displayed
CH4 concentrations and δ13C values ranging from 2 to 74 nmol and −61.07 to −48.62‰, respectively (Maher et al., 2013).
While CH4 oxidation was suggested as the primary driver of downstream increases in δ13C in the estuary with relatively low
levels of anthropogenic pollution (Maher et al., 2013), the down-river patterns of CH4 concentration and isotopic composition
observed in this study may be better explained by combining tributary inputs of CH4 with lower δ13C values compared to the 440
mainstem values with CH4 oxidation in the well-mixed, shallow lower reach. Although we did not include N isotopes in tracing
sources of N2O, the approach combining measurements of δ13C in CO2 and CH4 with the dual C isotope analyses of DOM was
useful in tracking sources along the eutrophic lower reach receiving tributary inputs with distinct isotopic signatures.
5 Implications
The observed large longitudinal variations in GHGs and associated environmental variables suggest that the traditional view 445
of river continuum assuming gradual changes in riverine metabolism and organic matter composition (Vannote et al., 1980)
might have a limited validity in explaining the high spatial variability in three GHGs observed in this study. Although the river
continuum concept has been useful in explaining gradual longitudinal variations in CO2 from headwater streams to lowland
rivers corresponding to the changing balance between autotrophy and heterotrophy (Borges and Abril, 2012; Koehler et al.,
2012; Catalán et al., 2016; Hotchkiss et al., 2015), it has been increasingly recognized that rivers are often divided into discrete 450
segments such as reaches impounded by dams (Ward and Stanford, 1983; Poole, 2002) and eutrophic reaches receiving
wastewater (Garnier and Billen, 2007; Yoon et al., 2017; Park et al., 2018). Previous studies of DOM biodegradation have
often assumed a selective degradation of labile components of riverine organic matter along the continuum with minimal to
Biogeosciences Discuss., https://doi.org/10.5194/bg-2018-278Manuscript under review for journal BiogeosciencesDiscussion started: 13 June 2018c© Author(s) 2018. CC BY 4.0 License.
15
low levels of anthropogenic perturbations (Koehler et al., 2012; Weyhenmeyer et al., 2012; Catalán et al., 2016). Reach-
specific significance levels observed for the correlations between GHGs and DOC or its optical properties (Fig. 5; Table S4) 455
imply that autochthonous DOM in the impounded middle reach or eutrophic lower reach and anthropogenic DOM derived
from agricultural runoff or urban wastewater can continue to replenish the riverine pool of DOM, fuelling the river heterotrophy.
This enhanced heterotrophy, along with direct discharges of GHGs from WWTPs, may result in highly localized pulses of
GHGs along the lower Han River and other eutrophic urban rivers worldwide.
Estimated rates for the production (biodegradation) and consumption (photosynthesis) of CO2 in the lower reach downstream 460
of major tributary inflows differed substantially depending on hydroclimatic conditions and algal abundance, indicating a
shifting balance between autotrophy and heterotrophy driving CO2 dynamics (Yoon et al., 2017). Some potential activation of
riverine metabolic processes was also indicated by gas-specific sets of significant correlations between gas concentrations and
related water quality measurements shown for the lower reach (Fig. 5). The increased availability of P, together with DO and
DOM optical characteristics indicative of humic-like and microbial humic-like DOM (HIX, C1/DOC, and C2/DOC), was 465
associated with high levels of pCO2 and CH4, suggesting that P enrichment and subsequent enhancement of algal productivity
and anaerobic metabolism may create favourable conditions for the production of both CO2 and CH4. In contrast, the levels of
NH4+ and NO3
−, rather than PO43−, were significantly correlated with N2O concentrations in the lower reach, in agreement with
the well established relationship between N levels and N2O production mechanisms in eutrophic rivers affected by urban
sewage (Beaulieu et al. 2010; Yu et al., 2013; He et al., 2017). Urban tributary effects on metabolic processes in the eutrophic 470
lower reach were also reflected in the lower-reach values of δ13C in CO2 and CH4 resembling those measured in the tributaries
(Fig. 8). Because the used statistical and chemical approaches can provide only indirect evidence of altering metabolic regimes
in the eutrophic urban river system, more process-focused research is required to elucidate dominant factors and mechanisms
and evaluate the relative contributions of various metabolic processes and external supplies of GHGs derived from WWTP
effluents. In the context of anthropogenic river discontinuum (Park et al., 2018), impoundments and urban water pollution 475
might be coupled through hydrologic connection and hence cause synergistic effects on downstream metabolic processes. In
the case of the Han River basin, old cascade dams on the North Han River and large weirs newly constructed on the South Han
River might be altering not only GHG dynamics but also DOM composition and transformations. It warrants further research
to explore how dam-induced changes in water retention and C biogeochemistry cascade down to affect organic matter
transformations and GHG emissions in the eutrophic lower reach. 480
Data availability
More data are available in supplementary information and can be requested from the corresponding author ([email protected]).
Biogeosciences Discuss., https://doi.org/10.5194/bg-2018-278Manuscript under review for journal BiogeosciencesDiscussion started: 13 June 2018c© Author(s) 2018. CC BY 4.0 License.
16
Author contribution
All authors contributed to data acquisition, discussion, and manuscript preparation. Manuscript writing was coordinated by J.-
H. Park with contributions from all authors. 485
Competing interests
The authors declare that they have no conflict of interest.
Acknowledgements
This work was supported by the National Foundation of Korea (2014R1A2A2A01006577; 2017R1D1A1B06035179),
"Cooperative Research Program for Agriculture Science & Technology Development (PJ012489022018)" by Rural 490
Development Administration, Republic of Korea, and "Development of Gas Analysis Measurement Standards (18011051)"
by Korea Research Institute of Standards and Science. We thank Borami Park for her assistance with sampling and analysis.
References
Abril, G., Guérin, F., Richard, S., Delmas, R., Galy-Lacaux, C., Gosse, P., Tremblay, A., Varfalvy, L., Dos Santos, M. A., and
Matvienko, B.: Carbon dioxide and methane emissions and the carbon budget of a 10-year old tropical reservoir (Petit 495
Saut, French Guiana), Global Biogeochem. Cycles, 19, GB4007, doi:10.1029/2005GB002457, 2005.
Alshboul, Z., Encinas-Fernandez, J., Hofmann, H., and Lorke, A.: Export of dissolved methane and carbon dioxide with
effluents from municipal wastewater treatment plants, Environ. Sci. Tech., 50, 5555–5563, doi:10.1021/acs.est.5b04923,
2016.
American Public Health Association: Standard Methods for the Examination of Water and Wastewater, American Public 500
Health Association, Washington DC, 2005.
Barros, N., Cole, J. J., Tranvik, L. J., Prairie, Y. T., Bastviken, D., Huszar, V. L. M., del Giorgio, P., and Roland, F.: Carbon
emission from hydroelectric reservoirs linked to reservoir age and latitude, Nat. Geosci., 4, 593–596,
doi:10.1038/ngeo1211, 2011.
Barth, J. A. C., Cronin, A. A., Dunlop, J., and Kalin, R.M.: Influence of carbonates on the riverine carbon cycle in an 505
anthropogenically dominated catchment basin: evidence from major elements and stable carbon isotopes in the Lagan
River (N. Ireland), Chem. Geo., 200, 203–216. doi:10.1016/S0009-2541(03)00193-1, 2003.
Bastviken, D., Tranvik, L. J., Downing, J. A, Crill, P. M., and Enrich-Prast, A.: Freshwater methane emissions offset the
continental carbon sink, Science 331, 50, DOI: 10.1126/science.1196808, 2011.
Biogeosciences Discuss., https://doi.org/10.5194/bg-2018-278Manuscript under review for journal BiogeosciencesDiscussion started: 13 June 2018c© Author(s) 2018. CC BY 4.0 License.
17
Beaulieu, J. J., Shuster,W. D., and Rebholz, J. A.: Nitrous oxide emissions from a large, impounded river: the Ohio River, 510
Environ. Sci. Technol., 44, 7527–7533, DOI: 10.1021/es1016735, 2010.
Beaulieu, J. J., Smolenski, R. L., Nietch, C. T., Townsend-Small, A., and Elovitz, M. S.: High methane emissions from a
midlatitude reservoir draining an agricultural watershed, Environ. Sci. Technol., 48, 11100–11108,
doi:10.1021/es501871g, 2014.
Beaulieu, J. J., Nietch, C. T. and Young, J. L.: Controls on nitrous oxide production and consumption in reservoirs of the Ohio 515
River Basin, J. Geophys. Res. Biogeosci., 120, doi:10.1002/2015JG002941, 2015.
Borges, A. V., and Abril, G.: Carbon dioxide and methane dynamics in estuaries, in: Treatise on Estuarine and Coastal Science,
Volume 5, Wolanski, E., and McLusky, D. (Eds.), Academic Press, Waltham, 119–161, doi:10.1016/B978-0-12-374711-
2.00504-0, 2011.
Borges, A. V., Schiettecatte, L.-S., Abril, G., Delille, B., and Gazeau, F.: Carbon dioxide in European coastal waters, Estuar. 520
Coast. Shelf Sci., 70, 375–387, doi:10.1016/j.ecss.2006.05.046, 2006.
Borges, A. V., Darchambeau, F., Teodoru, C. R., Marwick, T. R., Tamooh, F., Geeraert, N., Omengo, F. O., Guérin, F.,
Lambert, T., Morana, C., Okuku, E., and Bouillon, S.: Globally significant greenhouse gas emissions from African inland
waters, Nat. Geosci., 8, 637–642, doi:10.1038/NGEO2486, 2015.
Burgos, M., Sierra, A., Ortega, T., and Forja, J. M.: Anthropogenic effects on greenhouse gas (CH4 and N2O) emissions in the 525
guadalete river estuary (SW Spain), Sci. Total Environ., 503–504, 179–189, doi:10.1016/j.scitotenv.2014.06.038, 2015.
Butman, D. E., Wilson, H. F., Barnes, R. T., Xenopoulos, M. A., and Raymond, P. A.: Increased mobilization of aged carbon
to rivers by human disturbance, Nat. Geosci., 8, 112–116, doi:10.1038/ngeo2322, 2015.
Catalán, N., Marcé R., Kothawala, D. N., and Tranvik, L. J.: Organic carbon decomposition rates controlled by water retention
time across inland waters, Nat. Geosci., 9, 501–504, doi:10.1038/ngeo2720, 2016. 530
Chen, H., Wu, Y., Yuan, X., Gao, Y., Wu, N., and Zhu, D.: Methane emissions from newly created marshes in the drawdown
area of the Three Gorges Reservoir, J. Geophys. Res., 114, D18301, doi:10.1029/2009JD012410, 2009.
Cole, J. J., Prairie, Y. T., Caraco, N. F., McDowell, W. H., Tranvik, L. J., Striegl, R. G., Duarte, C. M., Kortelainen, P.,
Downing, J. A., Middelburg, J. J., and Melack, J.: Plumbing the global carbon cycle: Integrating inland waters into the
terrestrial carbon budget, Ecosystems, 10, 171–184, doi:10.1007/s10021-006-9013-8, 2007. 535
Crawford, J. T., Loken,L. C., Stanley, E. H., Stets, E. G., Dornblaser,M. M., and Striegl, R. G.: Basin scale controls on CO2
and CH4 emissions from the Upper Mississippi River, Geophys. Res. Lett., 43, 1973–1979, doi:10.1002/2015GL067599,
2016.
Fellman, J. B., Hood, E., and Spencer, R. G. M.: Fluorescence spectroscopy opens new windows into dissolved organic matter
dynamics in freshwater ecosystems: A review, Limnol. Oceanogr., 55, 2452–2462, doi:10.4319/lo.2010.55.6.2452, 2010. 540
Frankignoulle, M., Abril, G., Borges, A., Bourge, I., Canon, C., Delille, B., Libert, E., and Théate, J.-M.: Carbon dioxide
emission from European estuaries, Science, 282, 434–436, doi:10.1126/science.282.5388.434, 1998.
Biogeosciences Discuss., https://doi.org/10.5194/bg-2018-278Manuscript under review for journal BiogeosciencesDiscussion started: 13 June 2018c© Author(s) 2018. CC BY 4.0 License.
18
Garnier, J. and Billen, G.: Production vs. Respiration in river systems: An indicator of an “ecological status”, Sci. Total
Environ., 375, 110–124, doi:10.1016/j.scitotenv.2006.12.006, 2007.
Garnier, J., Vilain, G., Silvestre, M., Billen, G., Jehanno, S., Poirier, D., Martinez, A., Decuq, C., Cellier, P., and Abril, G.: 545
Budget of methane emissions from soils, livestock and the river network at the regional scale of the Seine basin (France),
Biogeochemistry, 116, 199–214, doi:10.1007/s10533-013-9845-1, 2013.
Griffith, D. R., Barnes, R. T., and Raymond, P. A.: Inputs of fossil carbon from wastewater treatment plants to U.S. rivers and
oceans, Environ. Sci. Technol., 43, 5647–5651, doi:10.1021/es9004043, 2009.
Griffith, D. R., and Raymond, P. A.: Multiple-source heterotrophy fueled by aged organic carbon in an urbanized estuary, Mar. 550
Chem., 124, 14–22, doi:10.1016/j.marchem.2010.11.003, 2011.
Guo, W., Yang, L., Zhai, W., Chen, W., Osburn, C. L., Huang, X., and Li, Y.: Runoff-mediated seasonal oscillation in the
dynamics of dissolved organic matter in different branches of a large bifurcated estuary − The Changjiang Estuary, J.
Geophys. Res. Biogeosci., 119, 776–793, doi:10.1002/2013JG002540, 2014.
He, Y., Wang, X., Chen, H., Yuan, X., Wu, N., Zhang, Q., Yue, J., Zhang, Q., Diao, Y., Zhou, L.: Effect of watershed 555
urbanization on N2O emissions from the Chongqing metropolitan river network, China, Atmos. Environ., 171, 70–81,
doi:10.1016/j.atmosenv.2017.09.043, 2017.
Hotchkiss, E. R., Hall Jr, R. O., Sponseller, R. A., Butman, D., Klaminder, J., Laudon, H., Rosvall, M., and Karlsson, J.:
Sources of and processes controlling CO2 emissions change with the size of streams and rivers, Nat. Geosci., 8, 696–699,
doi:10.1038/ngeo2507, 2015. 560
Hu, Y. and Cheng, H.: The urgency of assessing the greenhouse gas budgets of hydroelectric reservoirs in China, Nat. Clim.
Change, 3, 708–712, doi:10.1038/nclimate1831, 2013.
Hudson, F.: Sample preparation and calculations for dissolved gas analysis in water samples using GC headspace equilibration
technique, RSKSOP-175, Revision No. 2, U.S. Environmental Protection Agency, USA, 2004.
Jin, H., Yoon, T. K., Lee, S.-H., Kang, H., Im, J., and Park, J.-H.: Enhanced greenhouse gas emission from exposed sediments 565
along a hydroelectric reservoir during an extreme drought event, Environ. Res. Lett., 11, 124003, doi:10.1088/1748-
9326/11/12/124003, 2016.
Jung, B.-J., Lee, H.-J., Jeong, J.-J., Owen, J., Kim, B., Meusburger, K., Alewell, C., Gebauer, G., Shope, C., and Park, J.-H.:
Storm pulses and varying sources of hydrologic carbon export from a mountainous watershed, J. Hydrol., 440–441, 90-
101, doi:10.1016/j.jhydrol.2012.03.030, 2012. 570
Kaushal, S. S., and Belt, K. T.: The urban watershed continuum: evolving spatial and temporal dimensions, Urban Ecosyst.,
15, 409–435, doi:10.1007/s11252-012-0226-7, 2012.
Kempe, S.: Sinks of the anthropogenically enhanced carbon-cycle in surface fresh waters, J. Geophys. Res., 89, 4657–4676,
doi:10.1029/JD089iD03p04657, 1984.
Kling, G., Kipphut, G., and Miller, M.: The flux of CO2 and CH4 from lakes and rivers in arctic Alaska, Hydrobiologia, 240, 575
23–36, doi:10.1007/BF00013449, 1992.
Biogeosciences Discuss., https://doi.org/10.5194/bg-2018-278Manuscript under review for journal BiogeosciencesDiscussion started: 13 June 2018c© Author(s) 2018. CC BY 4.0 License.
19
Koehler, B., von Wachenfeldt, E., Kothawala, D., and Tranvik, L. J.: Reactivity continuum of dissolved organic carbon
decomposition in lake water, J. Geophys. Res., 117, G01024, doi:10.1029/2011JG001793, 2012.
Lauerwald, R., Laruelle, G. G., Hartmann, J., Ciais, P., and Regnier, P. A. G.: Spatial patterns in CO2 evasion from the global
river network, Global Biogeochem. Cycles, 29, 534–554, doi:10.1002/2014GB004941, 2015. 580
Liu, S., Lu, X. X., Xia, X., Zhang, S., Ran, L., Yang, X., and Liu, T.: Dynamic biogeochemical controls on river pCO2 and
recent changes under aggravating river impoundment: An example of the subtropical Yangtze River, Global Biogeochem.
Cycles, 30, 880–897, doi:10.1002/2016GB005388, 2016.
Longinelli, A. and Edmond, J. M.: Isotopic geocehmistry of the Amazon basin: A reconnaissance, J. Geophys. Res., 88, 3703–
3717, doi:10.1029/JC088iC06p03703, 1983. 585
Maavara, T., Lauerwald, R., Regnier, P., and Van Cappellen, P.: Global perturbation of organic carbon cycling by river
damming, Nat. Commun., 15347, doi:10.1038/ncomms15347, 2017.
Maeck, A., DelSontro, T., McGinnis, D. F., Fischer, H., Flury, S., Schmidt, M., Fietzek, P., and Lorke, A.: Sediment trapping
by dams creates methane emission hot spots, Environ. Sci. Technol., 47, 8130–8137, doi:10.1021/es4003907, 2013.
Maher, D. T., Santos, I. R., Leuven, J. R. F. W., Oakes, J. M., Erler, D. V., Carvalho, M. C., and Eyre, B. D.: Novel use of 590
cavity ring-down spectroscopy to investigate aquatic carbon cycling from microbial to ecosystem scales, Environ. Sci.
Technol., 47, 12938–12945, doi:10.1021/es4027776, 2013.
Marx, A., Dusek, J., Jankovec, J., Sanda, M., Vogel, T., van Geldern, R., Hartmann, J., and Barth, J. A. C.: A review of CO2
and associated carbon dynamics in headwater streams: A global perspective, Rev. Geophys., 55, 560–585,
doi:10.1002/2016RG000547, 2017. 595
Marwick, T. R., Tamooh, F., Teodoru, C. R.,. Borges, A. V, Darchambeau, F., and Bouillon, S.: The age of river-transported
carbon: A global perspective, Global Biogeochem. Cycles, 29, 122–137, doi:10.1002/2014GB004911, 2015.
McCallister, S. L. and del Giorgio, P. A.: Direct measurement of the δ13C signature of carbon respired by bacteria in lakes:
Linkages to potential carbon sources, ecosystem baseline metabolism, and CO2 fluxes, Limnol. Oceanogr., 53, 1204–
1216, doi:10.4319/lo.2008.53.4.1204, 2008. 600
McKnight, D. M., Boyer, E. W., Westerhoff, P. K., Doran, P. T., Kulbe, T., and Anderson, D. T.: Spectroflourometric
characterization of dissolved organic matter for indication of precursor organic material and aromaticity, Limnol.
Oceanogr., 46, 38–48, doi:10.4319/lo.2001.46.1.0038, 2001.
Min, D., Kang, N., Moon, D. M., Lee, J. B., Lee, D. S., and Kim, J. S.: Effect of variation in argon content of calibration
gases on determination of atmospheric carbon dioxide, Talanta, 80, 422–427, doi:10.1016/j.talanta.2009.03.019, 2009. 605
Ministry of Environment: Statistics of Sewerage, Ministry of Environment, Sejong, Republic of Korea, 2015.
Park, J.-H., Duan, L., Kim, B., Mitchell, M. J., and Shibata, H.: Potential effects of climate change and variability on
watershed biogeochemical processes and water quality in Northeast Asia, Environ. Int., 36, 212–225,
doi:10.1016/j.envint.2009.10.008, 2010.
Park, J.-H., Nayna, O. K., Begum, M. S., Chea, E., Hartmann, J., Keil, R. G., Kumar, S., Lu, X., Ran, L., Richey, J. E., 610
Biogeosciences Discuss., https://doi.org/10.5194/bg-2018-278Manuscript under review for journal BiogeosciencesDiscussion started: 13 June 2018c© Author(s) 2018. CC BY 4.0 License.
20
Sarma, V. V. S. S., Tareq, S. M., Xuan, D. T., and Yu, R.: Reviews and syntheses: Anthropogenic perturbations to
carbon fluxes in Asian river systems – concepts, emerging trends, and research challenges, Biogeosciences, 15, 3049–
3069, doi:10.5194/bg-15-3049-2018, 2018.
Parr, T. B., Cronan, C. S., Ohno, T., Findlay, S. E. G., Smith, S. M. C. and Simon, K. S.: Urbanization changes the
composition and bioavailability of dissolved organic matter in headwater streams, Limnol. Oceanogr., 60(3), 885–900, 615
doi:10.1002/lno.10060, 2015.
Poole, G. C.: Fluvial landscape ecology: addressing uniqueness within the river discontinuum, Freshwater Biol., 47, 641–660,
doi:10.1046/j.1365-2427.2002.00922.x, 2002.
R Development Core Team: R: A language and environment for statistical computing; R Foundation for Statistical Computing:
Vienna, Austria, available at: http://www.r-project.org (last access: 1 June 2018), 2018. 620
Ran, L., Lu, X. X., Richey, J. E., Sun, H., Han, J., Liao, S., and Yi, Q.: Long-term spatial and temporal variation of CO2 partial
pressure in the Yellow River, China, Biogeosciences, 12, 921-932, doi:10.5194/bg-12-921-2015, 2015.
Ran, L., Li, L., Tian, M., Yang, X., Yu, R., Zhao, J., Wang, L., and Lu, X. X.: Riverine CO2 emissions in the Wuding River
catchment on the Loess Plateau: Environmental controls and dam impoundment impact, J. Geophys. Res. Biogeosci., 122,
1439–1455, doi:10.1002/2016JG003713, 2017. 625
Raymond, P. A. and Bauer, J. E.: Use of 14C and 13C natural abundances for evaluating riverine, estuarine, and coastal DOC
and POC sources and cycling: a review and synthesis, Organic Geochemistry, 32, 469–485, doi:10.1016/S0146-
6380(00)00190-X, 2001.
Raymond, P. A., Hartmann, J., Lauerwald, R., Sobek, S., McDonald, C., Hoover, M., Butman, D., Striegl, R., Mayorga, E.,
Humborg, C., Kortelainen, P., Dürr, H., Meybeck, M., Ciais, P., and Guth, P.: Global carbon dioxide emissions from 630
inland waters, Nature, 503, 355–359, doi:10.1038/nature12760, 2013.
Regnier, P., Friedlingstein, P., Ciais, P., Mackenzie, F. T., Gruber, N., Janssens, I. A., Laruelle, G. G., Lauerwald, R., Luyssaert,
S., Andersson, A. J., Arndt, S., Arnosti, C., Borges, A. V., Dale, A. W., Gallego-Sala, A., Goddéris, Y., Goossens, N.,
Hartmann, J., Heinze, C., Ilyina, T., Joos, F., LaRowe, D. E., Leifeld, J., Meysman, F. J. R., Munhoven, G., Raymond,
P. A., Spahni, R., Suntharalingam, P., and Thullner, M.: Anthropogenic perturbation of the carbon fluxes from land to 635
ocean, Nat. Geosci., 6, 597–607, doi:10.1038/ngeo1830, 2013.
Richey, J. E., Devol, A. H., Wofsy, S. C., Victoria, R., and Riberio, M. N. G.: Biogenic gases and the oxidation and reduction
of carbon in Amazon River and floodplain waters, Limnol. Oceanogr., 33, 551–561. Doi:10.4319/lo.1988.33.4.0551,
1988.
Schulte, P., van Geldern, R., Freitag, H., Karim, A., Négrel, P., Petelet-Giraud, E., Probst, A., Probst, J.-L., Telmer, K, Veizer, 640
J., and Barth, J. A. C.: Applications of stable water and carbon isotopes in watershed research: weathering, carbon cycling,
and water balances, Earth Sci. Rev., 109, 20–31, doi:10.1016/j.earscirev.2011.07.003, 2011.Seoul Metropolitan
Government: The 8th Han River Ecosystem Survey, Seoul Institute, Seoul, Republic of Korea, 2017.
Biogeosciences Discuss., https://doi.org/10.5194/bg-2018-278Manuscript under review for journal BiogeosciencesDiscussion started: 13 June 2018c© Author(s) 2018. CC BY 4.0 License.
21
Shi, W., Chen, Q., Yi, Q., Yu, J., Ji, Y., Hu, L., and Chen, Y.: Carbon emission from cascade reservoirs: Spatial heterogeneity
and mechanisms, Environ. Sci. Technol., 51, 12175–12181, doi:10.1021/acs.est.7b03590, 2017. 645
Silvennoinen, H., Liikanen, A., Rintala, J., and Martikainen, P. J.: Greenhouse gas fluxes from the eutrophic Temmesjoki river
and its estuary in the Liminganlahti Bay (the Baltic Sea), Biogeochemistry 90, 193–208, doi:10.1007/s10533-008-9244-
1, 2008.
Smith, R. M., Kaushal, S. S., Beaulieu, J. J., Pennino, M. J., and Welty, C.: Influence of infrastructure on water quality and
greenhouse gas dynamics in urban streams, Biogeosciences, 14, 2831–2849, doi:10.5194/bg-14-2831-2017, 2017. 650
Stanley, E. H., Casson, N. J., Christel, S., Crawford, J. T., Loken, L. C., and Oliver, S. K.: The ecology of methane in streams
and rivers: patterns, controls, and global significance, Ecol. Monogr., 86, 146–171, doi:10.1890/15-1027.1, 2016.
Syvitski, J. P. M., Vörösmarty, C. J., Kettner, A. J., and Green, P.: Impact of humans on the flux of terrestrial sediment to the
global coastal ocean, Science, 308, 376–380, doi:10.1126/science.1109454, 2005.
Telmer, K., Veizer, J.: Carbon fluxes, pCO2 and substrate weathering in a large northern river basin, Canada: carbon isotope 655
perspectives. Chem. Geol. 159, 61–86, doi:10.1016/S0009-2541(99)00034-0, 1999.
Teodoru, C. R., Nyoni, F. C., Borges, A. V., Darchambeau, F., Nyambe, I., and Bouillon, S.: Dynamics of greenhouse gases
(CO2, CH4, N2O) along the Zambezi River and major tributaries, and their importance in the riverine carbon budget,
Biogeosciences, 12, 2431–2453, doi:10.5194/bg-12-2431-2015, 2015.
Vannote, R. L., Minshall, G. W., Cummins, K. W., Sedell, J. R., and Cushing, C. E.: The river continuum concept, Can. J. 660
Fish. Aquat. Sci., 37, 130–137, doi:10.1139/f80-017, 1980.
Wang, X., He, Y., Yuan, X., Chen, H., Peng, C., Zhu, Q., Yue, J., Ren, H., Deng, W., and Liu, H.: pCO2 and CO2 fluxes of the
metropolitan river network in relation to the urbanization of Chongqing, China, J. Geophys. Res. Biogeocsi., 122, 470–
486, doi:10.1002/2016JG003494, 2017a.
Wang, X., He, Y., Yuan, X., Chen, H., Peng, C., Yue, J., Zhang, Q., Diao, Y., Liu, S.: Greenhouse gases concentrations and 665
fluxes from subtropical small reservoirs in relation with water shed urbanization, Atmos. Environ., 154, 225–235,
doi:10.1016/j.atmosenv.2017.01.047, 2017b.
Wang, X., He, Y., Chen, H., Yuan, X., Peng, C., Yue, J., Zhang, Q., Zhou, L.: CH4 concentrations and fluxes in a subtropical
metropolitan river network: Watershed urbanization impacts and environmental controls, Sci. Total Environ., 622–623,
1079–1089, doi:10.1016/j.scitotenv.2017.12.054, 2018. 670
Ward, J. V. and Stanford, J. A.: Serial discontinuity concept of lotic ecosystems, in: Dynamics of Lotic Systems, Fontaine, T.
D. and Bartell, S. M. (Eds.), Ann Arbor Science, Ann Arbor, 29–42, 1983.
Weishaar, J. L., Aiken, G. R., Bergamaschi, B. A., Fram, M. S., Fujii, R., and Mopper, K.: Evaluation of specific ultra-violet
absorbance as an indicator of the chemical composition and reactivity of dissolved organic carbon, Environ. Sci. Technol.,
37, 4702–4708, doi:10.1021/es030360x, 2003. 675
Biogeosciences Discuss., https://doi.org/10.5194/bg-2018-278Manuscript under review for journal BiogeosciencesDiscussion started: 13 June 2018c© Author(s) 2018. CC BY 4.0 License.
22
Weyhenmeyer, G. A., Fröberg, M., Karltun, E., Khalili, M., Kothawala, D., Temnerud, J., and Tranvik, L. J.: Selective decay
of terrestrial organic carbon during transport from land to sea, Glob. Change Biol., 18, 349–355, doi:10.1111/j.1365-
2486.2011.02544.x, 2012.
Yao, G., Gao, Q., Wang, Z., Huang, X., He, T., Zhang, Y., Jiao, S., and Ding, J.: Dynamics of CO2 partial pressure and CO2
outgassing in the lower reaches of the Xijiang River, a subtropical monsoon river in China, Sci. Total Environ., 376, 255–680
266, doi:10.1016/j.scitotenv.2007.01.080, 2007.
Yoon, T. K., Jin, H., Oh, N.-H., and Park, J.-H.: Technical note: Assessing gas equilibration systems for continuous pCO2
measurements in inland waters, Biogeosciences, 13, 3915–3930, doi:10.5194/bg-13-3915-2016, 2016.
Yoon, T. K., Jin, H., Begum, M. S., Kang, N., and Park, J.-H.: CO2 outgassing from an urbanized river system fueled by
wastewater treatment plant effluents, Environ. Sci. Technol., 51, 10459–10467, doi:10.1021/acs.est.7b02344, 2017. 685
Yu, Z. J., Deng, H. G., Wang, D. Q., Ye, M. W., Tan, Y. J., Li, Y. J., Chen, Z. L., and Xu, S.Y.: Nitrous oxide emissions in
the Shanghai river network: implications for the effects of urban sewage and IPCC methodology, Glob. Change Biol.,
19, 2999–3010, doi:10.1111/gcb.12290, 2013.
Zeng, F.-W., Masiello, C. A., and Hockaday, W. C.: Controls on the origin and cycling of riverine dissolved inorganic
carbon in the Brazos River, Texas, Biogeochemistry, 104, 275–291, doi:10.1007/s10533-010-9501-y, 2011. 690
Zsolnay, A., Baigar, E., Jimenez, M., Steinweg, B., and Saccomandi, F.: Differentiating with fluorescence spectroscopy the
sources of dissolved organic matter in soils subjected to drying, Chemosphere, 38, 45–50, doi:10.1016/S0045-
6535(98)00166-0, 1999.
Biogeosciences Discuss., https://doi.org/10.5194/bg-2018-278Manuscript under review for journal BiogeosciencesDiscussion started: 13 June 2018c© Author(s) 2018. CC BY 4.0 License.
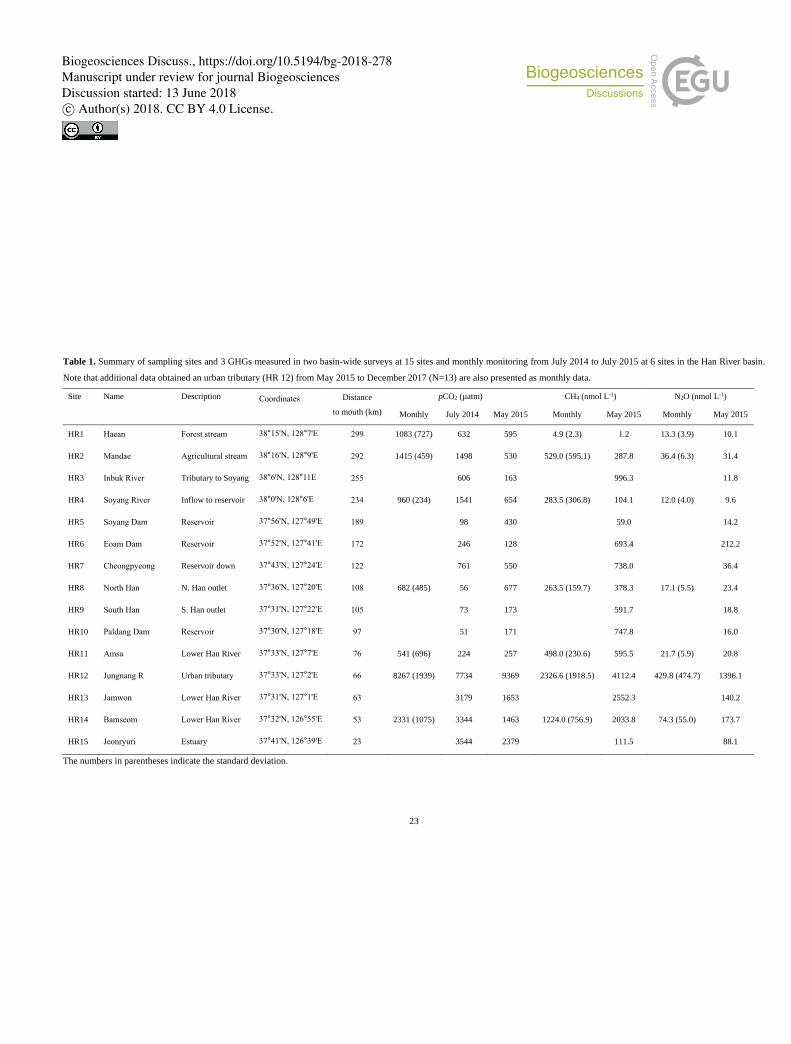
23
Table 1. Summary of sampling sites and 3 GHGs measured in two basin-wide surveys at 15 sites and monthly monitoring from July 2014 to July 2015 at 6 sites in the Han River basin.
Note that additional data obtained an urban tributary (HR 12) from May 2015 to December 2017 (N=13) are also presented as monthly data.
Site Name Description Coordinates Distance
to mouth (km)
pCO2 (µatm) CH4 (nmol L-1) N2O (nmol L-1)
Monthly July 2014 May 2015 Monthly May 2015 Monthly May 2015
HR1 Haean Forest stream 38°15'N, 128°7'E 299 1083 (727) 632 595 4.9 (2.3) 1.2 13.3 (3.9) 10.1
HR2 Mandae Agricultural stream 38°16'N, 128°9'E 292 1415 (459) 1498 530 529.0 (595.1) 287.8 36.4 (6.3) 31.4
HR3 Inbuk River Tributary to Soyang 38°6'N, 128°11E 255 606 163 996.3 11.8
HR4 Soyang River Inflow to reservoir 38°0'N, 128°6'E 234 960 (234) 1541 654 283.5 (306.8) 104.1 12.0 (4.0) 9.6
HR5 Soyang Dam Reservoir 37°56'N, 127°49'E 189 98 430 59.0 14.2
HR6 Eoam Dam Reservoir 37°52'N, 127°41'E 172 246 128 693.4 212.2
HR7 Cheongpyeong Reservoir down 37°43'N, 127°24'E 122 761 550 738.0 36.4
HR8 North Han N. Han outlet 37°36'N, 127°20'E 108 682 (485) 56 677 263.5 (159.7) 378.3 17.1 (5.5) 23.4
HR9 South Han S. Han outlet 37°31'N, 127°22'E 105 73 173 591.7 18.8
HR10 Paldang Dam Reservoir 37°30'N, 127°18'E 97 51 171 747.8 16.0
HR11 Amsa Lower Han River 37°33'N, 127°7'E 76 541 (696) 224 257 498.0 (230.6) 595.5 21.7 (5.9) 20.8
HR12 Jungnang R Urban tributary 37°33'N, 127°2'E 66 8267 (1939) 7734 9369 2326.6 (1918.5) 4112.4 429.8 (474.7) 1396.1
HR13 Jamwon Lower Han River 37°31'N, 127°1'E 63 3179 1653 2552.3 140.2
HR14 Bamseom Lower Han River 37°32'N, 126°55'E 53 2331 (1075) 3344 1463 1224.0 (756.9) 2033.8 74.3 (55.0) 173.7
HR15 Jeonryuri Estuary 37°41'N, 126°39'E 23 3544 2379 111.5 88.1
The numbers in parentheses indicate the standard deviation.
Biogeosciences Discuss., https://doi.org/10.5194/bg-2018-278Manuscript under review for journal BiogeosciencesDiscussion started: 13 June 2018c© Author(s) 2018. CC BY 4.0 License.
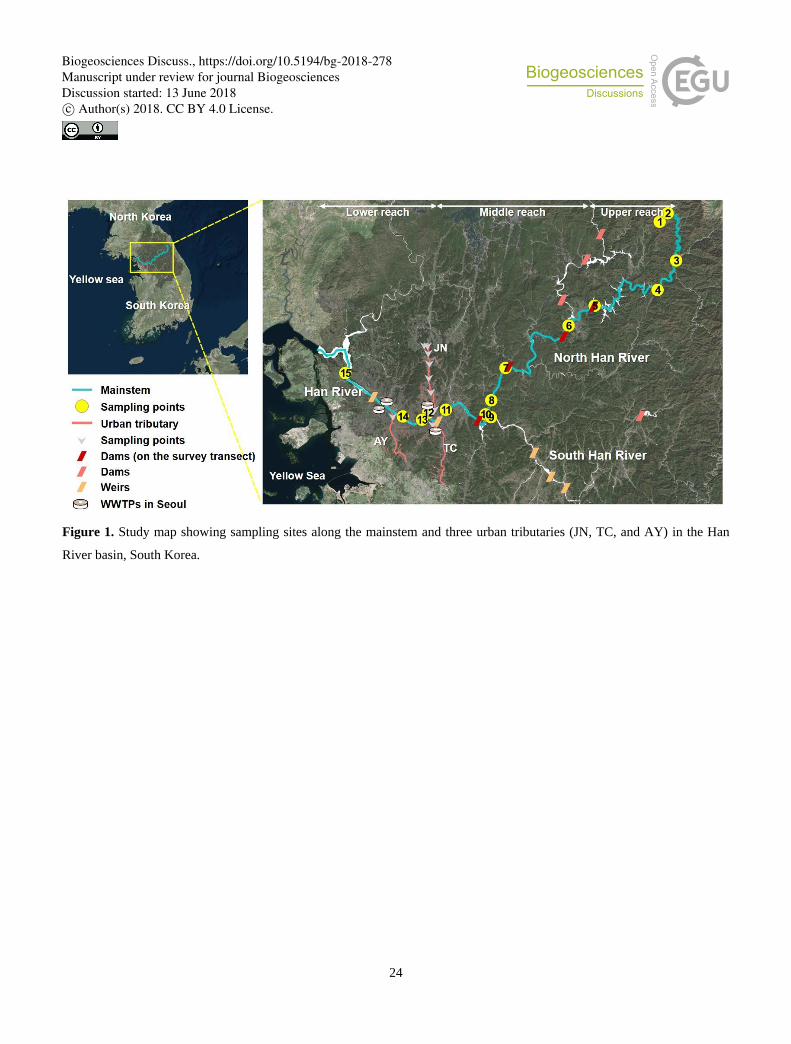
24
Figure 1. Study map showing sampling sites along the mainstem and three urban tributaries (JN, TC, and AY) in the Han
River basin, South Korea.
Biogeosciences Discuss., https://doi.org/10.5194/bg-2018-278Manuscript under review for journal BiogeosciencesDiscussion started: 13 June 2018c© Author(s) 2018. CC BY 4.0 License.
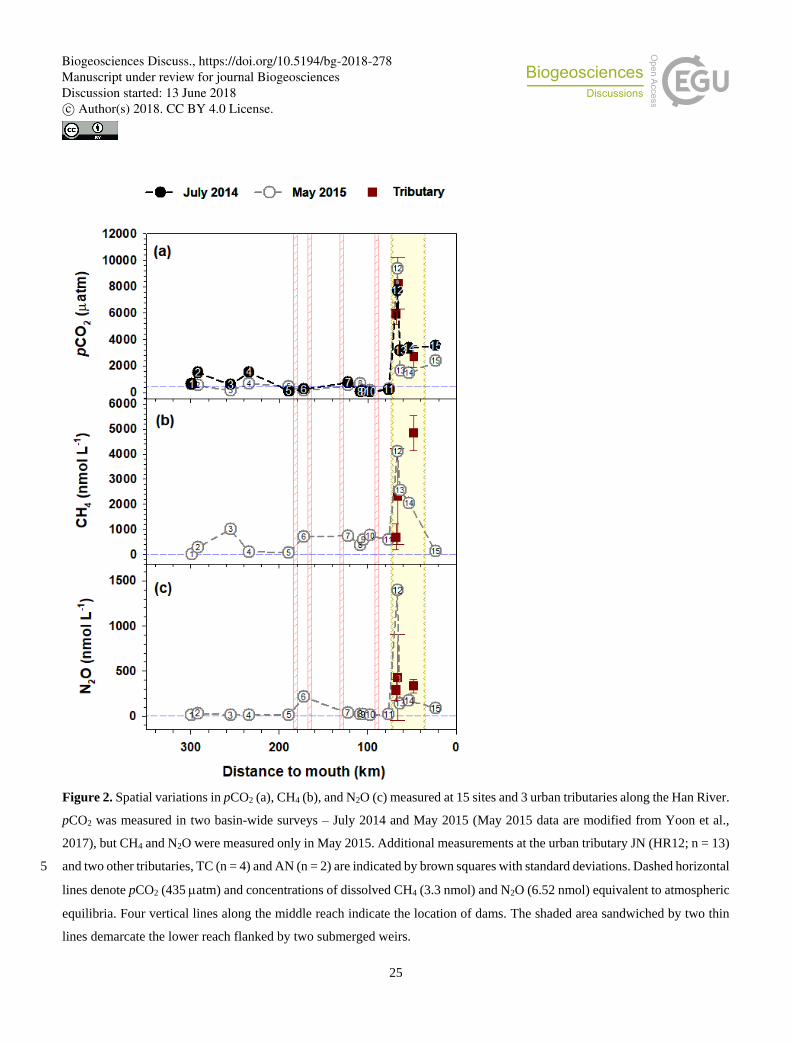
25
Figure 2. Spatial variations in pCO2 (a), CH4 (b), and N2O (c) measured at 15 sites and 3 urban tributaries along the Han River.
pCO2 was measured in two basin-wide surveys – July 2014 and May 2015 (May 2015 data are modified from Yoon et al.,
2017), but CH4 and N2O were measured only in May 2015. Additional measurements at the urban tributary JN (HR12; n = 13)
and two other tributaries, TC (n = 4) and AN (n = 2) are indicated by brown squares with standard deviations. Dashed horizontal 5
lines denote pCO2 (435 atm) and concentrations of dissolved CH4 (3.3 nmol) and N2O (6.52 nmol) equivalent to atmospheric
equilibria. Four vertical lines along the middle reach indicate the location of dams. The shaded area sandwiched by two thin
lines demarcate the lower reach flanked by two submerged weirs.
Biogeosciences Discuss., https://doi.org/10.5194/bg-2018-278Manuscript under review for journal BiogeosciencesDiscussion started: 13 June 2018c© Author(s) 2018. CC BY 4.0 License.
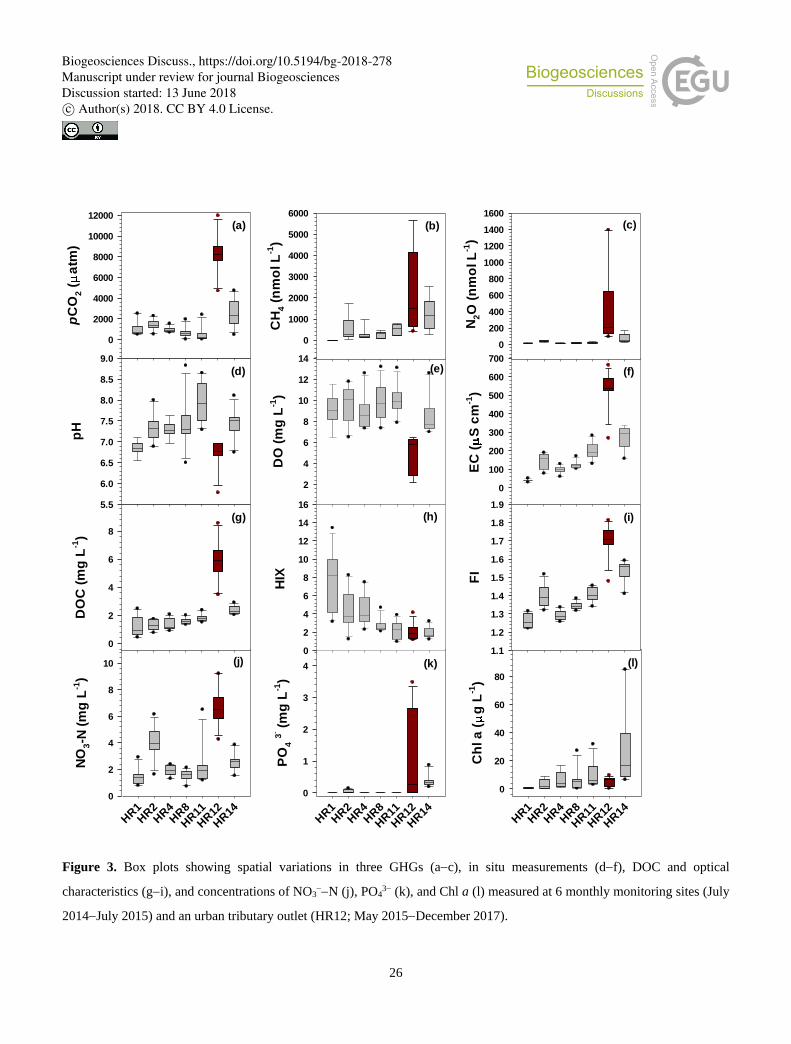
26
HR1HR2HR4HR8
HR11
HR12
HR14
NO
3-N
(m
g L
-1)
0
2
4
6
8
10
HR1HR2HR4HR8
HR11
HR12
HR14
Ch
l a
(g
L-1
)
0
20
40
60
80
FI
1.1
1.2
1.3
1.4
1.5
1.6
1.7
1.8
1.9
EC
(S
cm
-1)
0
100
200
300
400
500
600
700
HR1HR2HR4HR8
HR11
HR12
HR14
PO
4 3
- (m
g L
-1)
0
1
2
3
4
HIX
0
2
4
6
8
10
12
14
16
DO
(m
g L
-1)
2
4
6
8
10
12
14
CH
4 (
nm
ol L
-1)
0
1000
2000
3000
4000
5000
6000
DO
C (
mg
L-1
)
0
2
4
6
8
pH
5.5
6.0
6.5
7.0
7.5
8.0
8.5
9.0
N2O
(n
mo
l L
-1)
0
200
400
600
800
1000
1200
1400
1600
pC
O2 (
atm
)
0
2000
4000
6000
8000
10000
12000(a) (b) (c)
(d) (e) (f)
(g) (h) (i)
(j) (k) (l)
Figure 3. Box plots showing spatial variations in three GHGs (a−c), in situ measurements (d−f), DOC and optical
characteristics (g−i), and concentrations of NO3−−N (j), PO4
3− (k), and Chl a (l) measured at 6 monthly monitoring sites (July
2014−July 2015) and an urban tributary outlet (HR12; May 2015−December 2017).
Biogeosciences Discuss., https://doi.org/10.5194/bg-2018-278Manuscript under review for journal BiogeosciencesDiscussion started: 13 June 2018c© Author(s) 2018. CC BY 4.0 License.
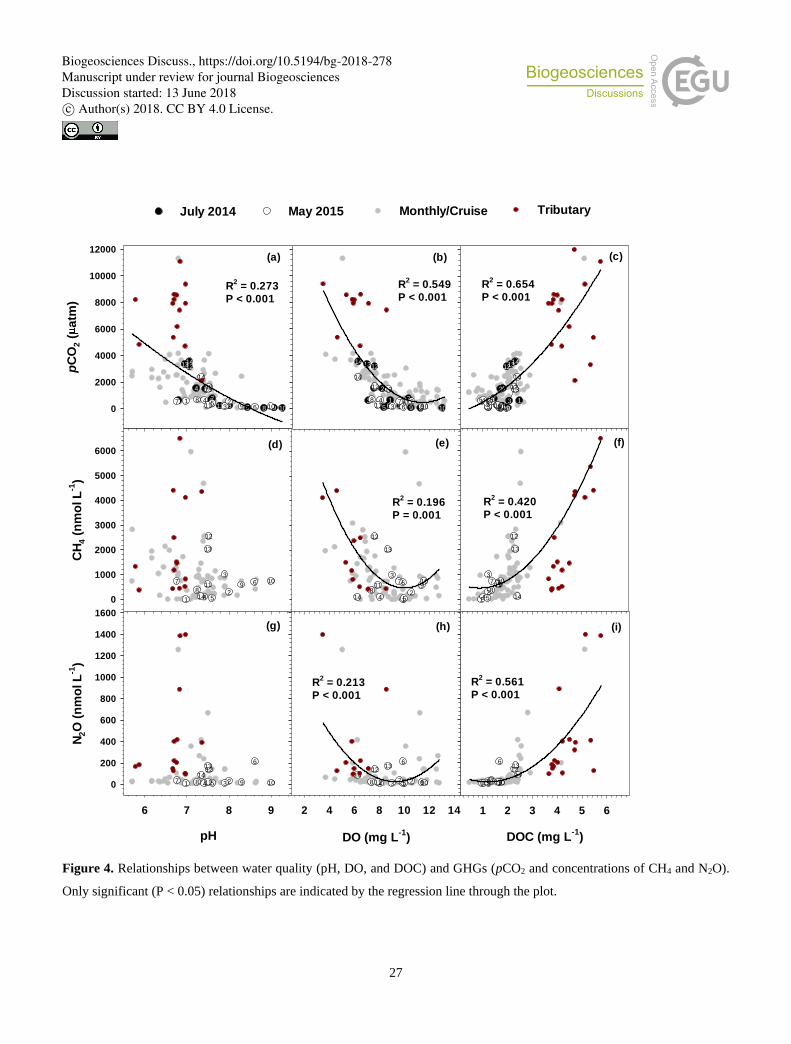
27
pH
6 7 8 9
N2O
(n
mo
l L
-1)
0
200
400
600
800
1000
1200
1400
1600
1 234 5
6
7 8 9 1011
1213
14
DO (mg L-1
)
2 4 6 8 10 12 14
1 234 5
6
78 91011
1213
14
DOC (mg L-1
)
1 2 3 4 5 6
1 2345
6
78 91011
1213
14
CH
4 (
nm
ol L
-1)
0
1000
2000
3000
4000
5000
6000
12
3
4 5
67
89
1011
12
13
14
pC
O2 (
atm
)
0
2000
4000
6000
8000
10000
12000
1
2
3
4
567
8 9 1011
121314
1 23
4 56
7 89 1011
1213
14
12
3
4 5
67
8910
11
12
13
14 12
3
45
67
8910
11
12
13
14
1
2
3
4
567
89 1011
121314
1 23
4 56
7891011
12 13
14
1
2
3
4
5 67
8 91011
121314
1 23
456
7891011
1213
14
R2 = 0.273
P < 0.001
R2 = 0.549
P < 0.001
R2 = 0.654
P < 0.001
R2 = 0.196
P = 0.001
R2 = 0.420
P < 0.001
R2 = 0.213
P < 0.001
R2 = 0.561
P < 0.001
Monthly/CruiseJuly 2014 May 2015 Tributary
(a) (b) (c)
(d) (e) (f)
(g) (h) (i)
Figure 4. Relationships between water quality (pH, DO, and DOC) and GHGs (pCO2 and concentrations of CH4 and N2O).
Only significant (P < 0.05) relationships are indicated by the regression line through the plot.
Biogeosciences Discuss., https://doi.org/10.5194/bg-2018-278Manuscript under review for journal BiogeosciencesDiscussion started: 13 June 2018c© Author(s) 2018. CC BY 4.0 License.
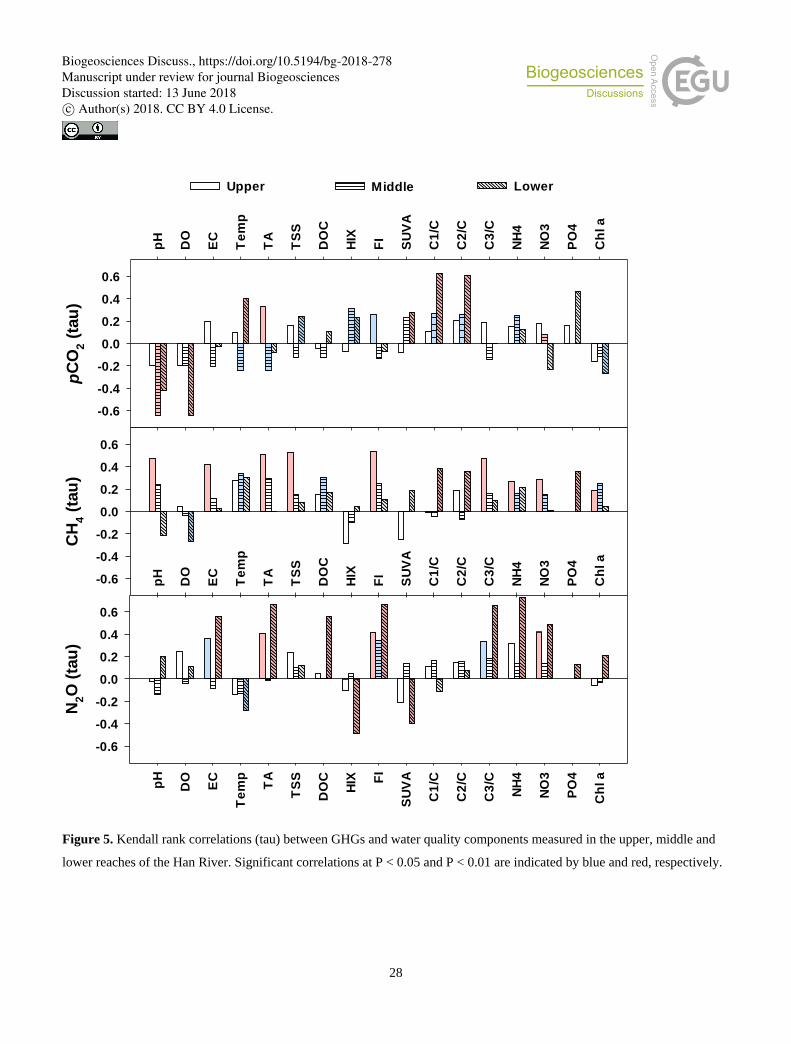
28
Figure 5. Kendall rank correlations (tau) between GHGs and water quality components measured in the upper, middle and
lower reaches of the Han River. Significant correlations at P < 0.05 and P < 0.01 are indicated by blue and red, respectively.
Upper Middle Lower
CH
4 (
tau
)
-0.6
-0.4
-0.2
0.0
0.2
0.4
0.6
pH
DO
EC
Te
mp
TA
TS
S
DO
C
HIX
FI
SU
VA
C1
/C
C2
/C
C3
/C
NH
4
NO
3
PO
4
Ch
l a
pC
O2 (
tau
)
-0.6
-0.4
-0.2
0.0
0.2
0.4
0.6
pH
DO
EC
Te
mp
TA
TS
S
DO
C
HIX F
I
SU
VA
C1
/C
C2
/C
C3
/C
NH
4
NO
3
PO
4
Ch
l a
pH
DO
EC
Te
mp
TA
TS
S
DO
C
HIX
FI
SU
VA
C1
/C
C2
/C
C3
/C
NH
4
NO
3
PO
4
Ch
l a
N2O
(ta
u)
-0.6
-0.4
-0.2
0.0
0.2
0.4
0.6
Biogeosciences Discuss., https://doi.org/10.5194/bg-2018-278Manuscript under review for journal BiogeosciencesDiscussion started: 13 June 2018c© Author(s) 2018. CC BY 4.0 License.
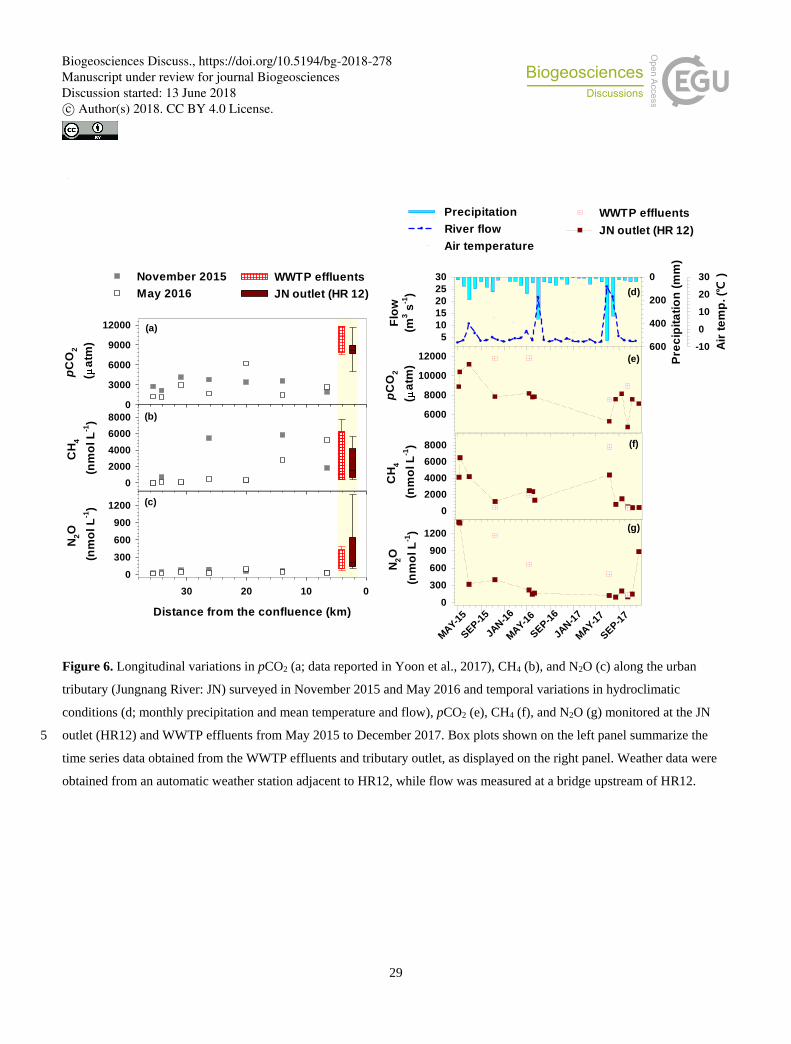
29
0
300
600
900
1200
0
2000
4000
6000
8000
6000
8000
10000
12000
pC
O2
(a
tm)
0
3000
6000
9000
12000
CH
4
(nm
ol L
-1)
0
2000
4000
6000
8000
Distance from the confluence (km)
0102030
N2O
(nm
ol L
-1)
0
300
600
900
1200
November 2015
May 2016
WWTP effluents
JN outlet (HR 12)
(a)
(b)
(c)
JN outlet (HR 12)
WWTP effluents
pC
O2
(a
tm)
CH
4
(nm
ol L
-1)
N2O
(nm
ol L
-1)
(e)
(g)
(f)
MAY-1
5
SEP-1
5
JAN-1
6
SEP-1
6
MAY-1
6
JAN-1
7
MAY-1
7
SEP-1
7
Air
te
mp
. (℃
)
-10
0
10
20
30
Pre
cip
ita
tio
n (
mm
)
0
200
400
600
Flo
w
(m3 s
-1)
5
10
15
20
25
30
(d)
Precipitation
River flow
Air temperature
Figure 6. Longitudinal variations in pCO2 (a; data reported in Yoon et al., 2017), CH4 (b), and N2O (c) along the urban
tributary (Jungnang River: JN) surveyed in November 2015 and May 2016 and temporal variations in hydroclimatic
conditions (d; monthly precipitation and mean temperature and flow), pCO2 (e), CH4 (f), and N2O (g) monitored at the JN
outlet (HR12) and WWTP effluents from May 2015 to December 2017. Box plots shown on the left panel summarize the 5
time series data obtained from the WWTP effluents and tributary outlet, as displayed on the right panel. Weather data were
obtained from an automatic weather station adjacent to HR12, while flow was measured at a bridge upstream of HR12.
Biogeosciences Discuss., https://doi.org/10.5194/bg-2018-278Manuscript under review for journal BiogeosciencesDiscussion started: 13 June 2018c© Author(s) 2018. CC BY 4.0 License.
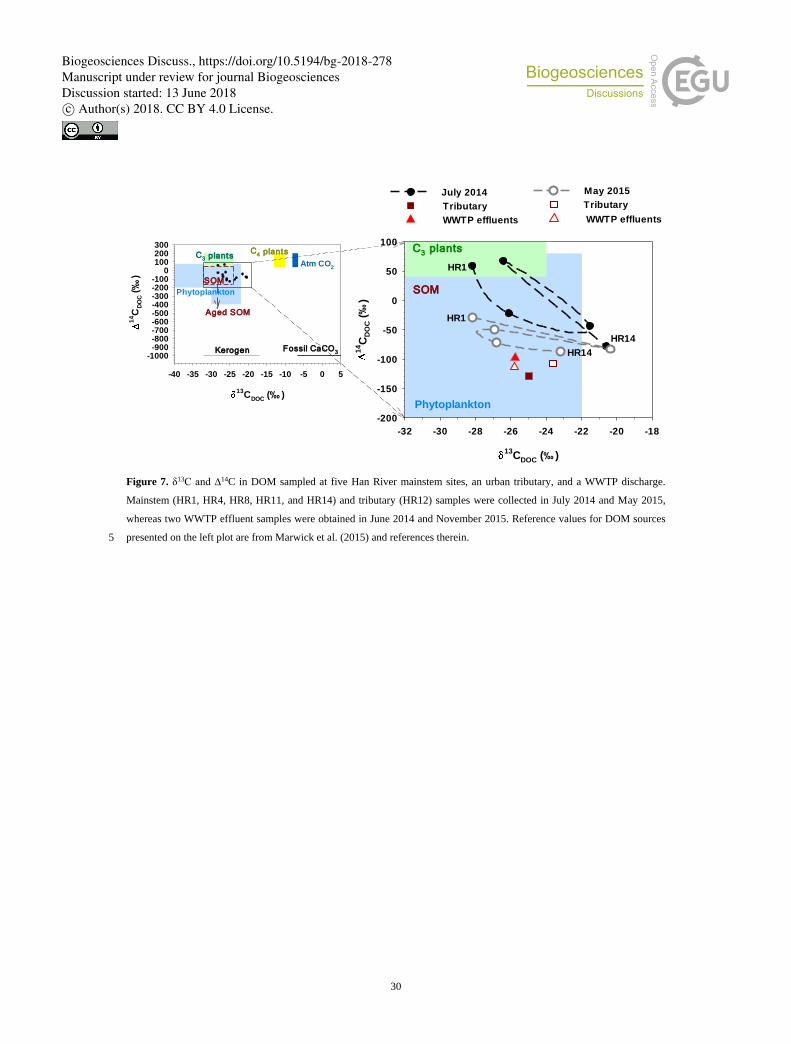
30
13CDOC (‰ )
-32 -30 -28 -26 -24 -22 -20 -18
14C
DO
C (
‰)
-200
-150
-100
-50
0
50
100C3 plants
Phytoplankton
HR1
HR14
SOM
HR1
HR14
July 2014
Tributary
WWTP effluents
May 2015
Tributary
WWTP effluents
Atm CO2
Kerogen Fossil CaCO3
C3 plants
C4 plants
SOM
Aged SOM
13C
DOC (‰ )
-40 -35 -30 -25 -20 -15 -10 -5 0 5
1
4C
DO
C (
‰)
-1000-900-800-700-600-500-400-300-200-100
0100200300
Phytoplankton
Figure 7. δ13C and ∆14C in DOM sampled at five Han River mainstem sites, an urban tributary, and a WWTP discharge.
Mainstem (HR1, HR4, HR8, HR11, and HR14) and tributary (HR12) samples were collected in July 2014 and May 2015,
whereas two WWTP effluent samples were obtained in June 2014 and November 2015. Reference values for DOM sources
presented on the left plot are from Marwick et al. (2015) and references therein. 5
Biogeosciences Discuss., https://doi.org/10.5194/bg-2018-278Manuscript under review for journal BiogeosciencesDiscussion started: 13 June 2018c© Author(s) 2018. CC BY 4.0 License.
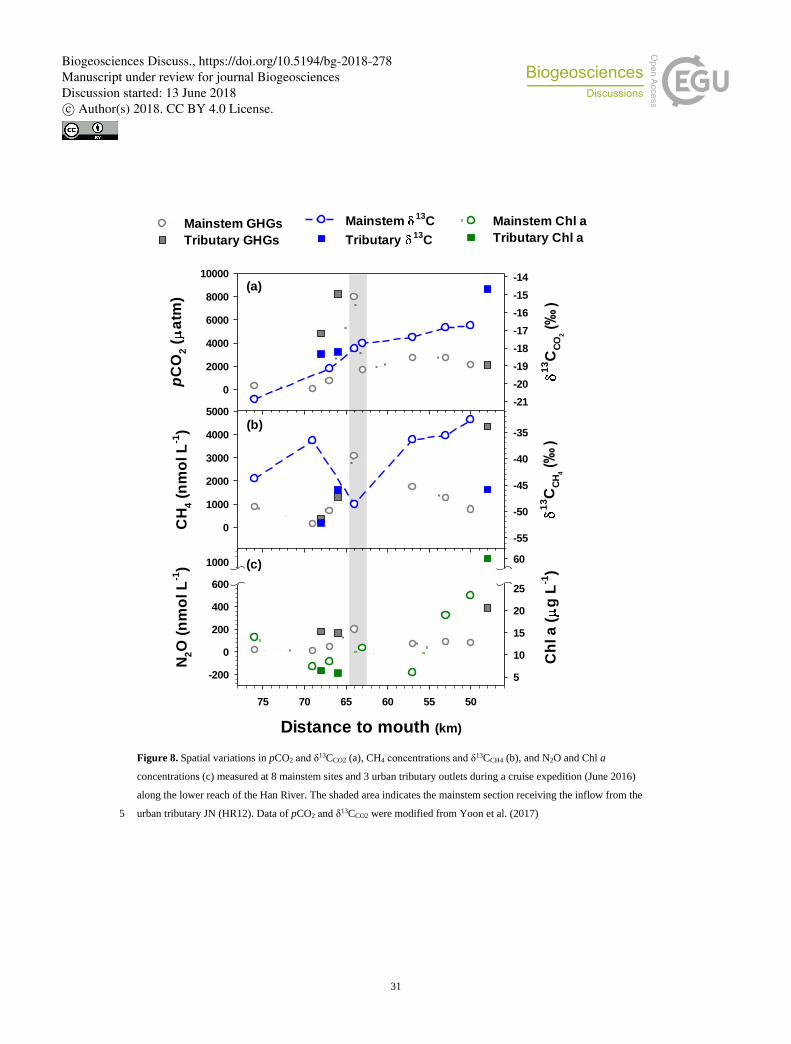
31
pC
O2 (
atm
)
0
2000
4000
6000
8000
10000
13C
CO
2
(‰
)
-21
-20
-19
-18
-17
-16
-15
-14
Mainstem GHGs
Tributary GHGs
CH
4 (
nm
ol L
-1)
0
1000
2000
3000
4000
5000
13C
CH
4
(‰
)-55
-50
-45
-40
-35
Mainstem 13
C
Tributary13
C
(a)
(c)
(b)
Distance to mouth (km)
505560657075
N2O
(n
mo
l L
-1)
-200
0
200
400
600
1000C
hl a
(g
L-1
)
5
10
15
20
25
60
Mainstem Chl a
Tributary Chl a
Figure 8. Spatial variations in pCO2 and δ13CCO2 (a), CH4 concentrations and δ13CCH4 (b), and N2O and Chl a
concentrations (c) measured at 8 mainstem sites and 3 urban tributary outlets during a cruise expedition (June 2016)
along the lower reach of the Han River. The shaded area indicates the mainstem section receiving the inflow from the
urban tributary JN (HR12). Data of pCO2 and δ13CCO2 were modified from Yoon et al. (2017) 5
Biogeosciences Discuss., https://doi.org/10.5194/bg-2018-278Manuscript under review for journal BiogeosciencesDiscussion started: 13 June 2018c© Author(s) 2018. CC BY 4.0 License.


![Detection of Discontinuities [GMAW]](https://img.pdfslide.us/doc/110x75/577cd9031a28ab9e78a27ba6/detection-of-discontinuities-gmaw.jpg)