Embed Size (px)
Citation preview
HAL Id: halshs-01907199https://halshs.archives-ouvertes.fr/halshs-01907199
Preprint submitted on 28 Oct 2018
HAL is a multi-disciplinary open accessarchive for the deposit and dissemination of sci-entific research documents, whether they are pub-lished or not. The documents may come fromteaching and research institutions in France orabroad, or from public or private research centers.
L’archive ouverte pluridisciplinaire HAL, estdestinée au dépôt et à la diffusion de documentsscientifiques de niveau recherche, publiés ou non,émanant des établissements d’enseignement et derecherche français ou étrangers, des laboratoirespublics ou privés.
Long walk to knowledge : On the determinants of highereducation mobility to Europe
Jonas Didisse, Thanh Tam Nguyen-Huu, Thi Anh-Dao Tran
To cite this version:Jonas Didisse, Thanh Tam Nguyen-Huu, Thi Anh-Dao Tran. Long walk to knowledge : On thedeterminants of higher education mobility to Europe. 2018. �halshs-01907199�
Long walk to knowledge : On the determinants of higher educationmobility to EuropeI
Jonas DIDISSEa, Thanh Tam NGUYEN-HUUa,b, Thi Anh-Dao TRANa,ú
aCREAM-EA 4702 (University of Rouen)
Faculty of Law, Economics and Management3 avenue Pasteur - 76186, Rouen cedex, France.
bTIMAS, Thang-Long University
Nghiem Xuan Yem read, Hoang Mai District - Hanoi, Vietnam
Abstract
This paper investigates the determinants of demand for higher education mobility from studentsin low- and middle-income countries to European countries over the period 2004-2013. We identifythe dyadic factors associated to the relationships between home and host countries as well asmonodic variables associated to “push” and “pull” factors. Used together with various linguisticrelations, we emphasize the relevance of informal and formal networks in explaining resistance tomigration of students. All put together, our results show that factors that are origin and destinationspecific like socio-demographic characteristics, individual beliefs and institutional profiles, out ofthe usual economic considerations, have a significant impact on student mobility.
JEL codes: F22, F62, I23, O15, O57
Keywords: Higher education mobility, Network e�ects, Language skills, Institutional quality
1. Introduction
International mobility of people is booming globally since the early 1990s. All countries ex-perience out - as well as in - migration by people looking for better opportunities to work or tostudy. The main reason why so many people would like to leave their home country is that theymay earn much more if they move (the so-called “place premium”), with economic outcomes onlabor markets and economic growth both at home and in destination countries. But there are otherreasons for moving to another country besides income gains. Among them, Higher Education (HE)in a globalizing World has gained growing interest in the economic literature. As summarized inOECD (2009):
“Higher Education drives and is driven by globalization. Higher education trains thehighly skilled workers and contributes to the research base and capacity for innovationthat determine competitiveness in the knowledge-based global economy. It facilitatesinternational collaboration and cross-cultural exchange. Cross-border flows of ideas,students, faculty and financing, coupled with developments in information and commu-nication technology, are changing the environment where higher education institutionsfunction. Cooperation and competition are intensifying simultaneously under the grow-ing influence of market forces and the emergence of new players.”(p.13)
IThe authors wish to thank Arnaud Elie (CREAM, University of Rouen), Sylvain Lamourette (Head of Interna-tional Relations O�ce and EU Project Manager, University of Rouen) and Jorge Santos (Department of InternationalCooperation, University of Porto, Portugal) for their helpful comments, precious assistance in data compilation ofimmigration policies, student mobility and Erasmus Mundus scholarship programmes. Any errors or omissions arethe authors’ responsibility. The views expressed in this paper are solely those of the authors and should not in anyway be attributed to the University of Rouen.
úCorresponding author.Email addresses: [email protected] (Jonas DIDISSE), [email protected]
(Thanh Tam NGUYEN-HUU), [email protected] (Thi Anh-Dao TRAN)
Preprint submitted to October 28, 2018
In the light of this, globalization has implied a changing understanding of HE. Especially,developing countries need to understand and to better exploit the benefits as well as mitigatethe challenges that come with globalization. On the one hand, internationalization of HE haschallenged policy makers and university managers in various terms: the importance of the Englishor foreign languages, the need for internet and other forms of Information and CommunicationTechnology (ICT), the emphasis on research and publications and the related concern with theranking of universities, etc. But on the other hand, cross-border or “borderless” HE has alsochanged students’ and sta� behavior. The movement of persons and programmes across nationshas opened new opportunities in terms of careers and salaries, skills and learning or teachingcapacity. The development of mobility programmes in the frame of the Erasmus scholarshipsfinanced by the European Commission aptly illustrates such opportunities.
International students who study abroad are an example of legal temporary migrants who havebeen rising during the last recent decades. Besides that, the OECD provides the trend in thepercentage of graduates of tertiary education among the youth population, and the figures showa gradual but definite increase in the percentage. With the increase in the number of entries attertiary level, a changing global landscape for HE is underway where global competition amongeducational institutions in developed countries is on the rise in order to attract both native-bornand international students (van der Wendet, 2015).
By focusing on the demand for HE, the present paper aims at studying the determinants of stu-dent mobility from developing countries to Europe. But it takes a new view on the topic: especially,it wonders if non-monetary factors like linguistic relations, networking or institutional factors andbeliefs may explain the flows. From the point of view of the sending countries, individuals demandfor foreign study and sort across potential destinations. A random selection in the origin may thenface “positive” selection in the destination, that is: high-skilled people are more likely to becomeimmigrants and are randomly selected from the population of immigrants in the destination. Thekey question is then: what are the determinants of HE mobility in a Southern perspective? Wheredo students go? This allows us to address three underlying issues:
(i) First, what are the main motivations for students from developing countries to go abroad?What are the factors that encourage or inhibit this mobility will in the host countries? Whilethe former determinants are gathered in the so-called “push” factors characterizing sendingcountries, the latter deal with “pull” factors stemming from destination countries.
(ii) Second, are there any individual or environment characteristics which influence mobility toone location compared to the others?
(iii) Third, does the current combination of mobility and funding flows through scholarship pro-gramme help student mobility? What will be the implications of these trends for the geog-raphy of Europe’s HE? Indeed, global competition among HE Institutions (HEIs) to attractinternationally mobile students raises worrying concerns on global scientific powerhouses andthus global magnets for academic talent.1 One wonders if the current uneven geography ofacademic mobility may also be guiding future mobility of students and, through a cumulativecausation, an even stronger concentration may occur.
To conduct our investigation, two strands of literature are crossed here in the field of interna-tional development studies:
- On one side, the economics of immigration which deals with the factors underlying interna-tional mobility, i.e.; what determines whether people choose to move, and where they decideto go. We rely here on the new economics of migration paradigm, and focuses on studentmigration as a collective decision that results from incomplete markets (Bansak et al., 2015).
- On the other side, we consider cross-border education at tertiary level as an investment deci-sion in human capital theory. Notably, students are individuals seeking better opportunities
1In the OECD countries for example, more than 3/4 of mobile academics are concentrated in only 4 countries:namely, the US, Australia, the UK, and Japan.
2
to get education (academic and skills) in order to increase their future earnings and employ-ment opportunities. Theories of investment in education may then tell us why internationalmobility at tertiary level is worthwhile.
The rest of the paper is organized as follows. Section 2 briefly describes our statistics andbackground. Section 3 presents the general options of our methodological approach before reportingour empirical findings in Section 4. Section 5 summarizes the results and concludes.
2. Research framework
2.1. TargetsThere are di�erent types of immigrants with sometimes overlapping groups. This is because of
the variety of sources of migration. Here, we focus on immigrants who choose to move legally (notforced to do so) because most of the world’s migrants are voluntary migrants. These voluntarymigrants choose to move for various reasons: to work, to join family members or to study. Inthe present paper, we are interested in educated or skilled people who are going abroad to studyfor a while and may return home (temporary versus permanent migration). Those persons havepermission to enter and live, even temporarily, in a host country. But they can become “illegalor irregular” immigrants by violating the terms of visa (for example, by overstaying a temporaryvisa and not leaving when they are supposed to). Therefore, immigration policy can a�ect whetherpeople choose to become permanent migrants and do not return to their origin country. In addition,they can be eligible for public assistance programmes in some host countries, enabling domesticresidents to argue against immigrant entries.2 Due to the latter point, we take national bordersfor granted like usual studies in this field, that is: barriers to mobility of people do exist, andpolicymakers focus on e�ects of migration flows (here, internationally mobile students) on theirown country, not global e�ects (Bansak et al., 2015).
The purpose of this paper is to examine what drives macro-economic flows of tertiary studentsfrom developing countries to Europe. However, by assuming that they will return back to theircountries of origin directly after mobility, we leave aside the underlying issue about their decision tostay or not in the destination country, that is: the comparative expectations about future earningsonce their studies are completed. To this end, we consider internationally mobile students comingfrom low and middle income group aggregate (all developing economies). Data that are computedhere comes from the UNESCO website on global flow of tertiary level students. Based on its annualdata collection, the UNESCO Institute of Statistics (UIS) produces a range of indicators to tracktrends in tertiary education at the global, regional and national levels.3 Internationally mobilestudents are defined as those who have crossed a national or territorial border for the purpose ofeducation and are now enrolled outside their country of origin. These data are downloaded fromthe UNESCO website for 89 Low- and Middle-Income countries (LMIs) in destination to Europeover the period 2004-2013. The full list of host and home countries in our sample is presented inAppendix A.
Using the available data, descriptive statics are displayed in Appendix B. Among the variouscategories of migrants, internationally mobile students are the ones who have experienced a dra-matic increase in the last decades. Their number has doubled between 1999 and 2013 (FigureB.1). From the home perspective, 67.2% of the students outflows originate from Asia (which formsthe largest group), Africa and South America (Figure B.2). As a result, LMIs represent 65.4% ofstudent outflows, hence the importance of a specific analysis for these countries (Figure B.3). Atdestination, North America and Europe account for 68.6% of the total aggregate flows with a highconcentration in a few number of countries (the US, the UK, France, Germany and Australia). As
2People may oppose immigration because they believe they will compete with immigrants or will pay more intaxes as a result of immigration (taking their jobs or spots in universities that would otherwise go to native-bornstudents, receiving more in public assistance, or leading to changes in their country’s culture). Such beliefs arelikely to a�ect how people feel about immigration, including international students, and are among the reasons whycountries impose restrictions on immigration and why immigration policy generates considerable debate (Bansaket al., 2015).
3See more at: http://www.uis.unesco.org/Education/Pages/tertiary-education.aspx#sthash.I4ezWA3x.
dpuf
3
the European countries accounts for 44.3% of the total aggregate flows, one wonders if the regioncan become a magnet within global competition among HEIs to attract internationally mobile stu-dents (Figure B.2). Figure B.4 shows the evolution of tertiary students flows from LMIs towardsour European countries of destination over the period 1999-2013. Out of the number of LMIscounted according to the World Bank classification, our sample of 89 origin countries correspondto a great part of the inflows.
2.2. Variables of interestDi�erent variables can influence the international mobility of students. We divide them into
two groups: dyadic factors and monodic factors. The latter include two sub-groups: monodic home(“pull”) factors and monodic host (“push”) factors.
Dyadic factorsMoving is costly and requires significant expenses (passport and visa, transportation, and so
on), even though they have been fallen over time (Bansak et al., 2015). There are also non-monetarycosts to moving which may be even higher than the monetary costs (“psychic costs” for example).Among them, a first set of dyadic variables that are commonly used in gravity models helps tounderstand what can explain resistance to any bilateral flow, namely: bilateral distance, linguisticproximity, historical colonial links. The CEPII has made available a “square” gravity dataset for allworld pairs of countries (Head et al., 2010). These dyadic factors linking home and host countriesin the gravity equation are usually applied to international trade, but they can be merged with anymatrix of bilateral flow (FDI, migrations, or other types of bilateral flows). Therefore, we assumehere that such dyadic variables influence the cost of student mobility.
However, geographic and cultural distances are customary mobility costs which are not specificto students: instead, a student must consider extra-costs of attending a HE programme in adi�erent location into his investment decision. In the present study, it is expected that variousmeasures of networks as well as foreign language skills may lower the cost of migrating, especiallywhen developing countries are considered. Therefore, such considerations are highlighted here byextending the usual dataset provided for gravity models with two other kinds of “resistance”.
Linguistic relations are considered to be a first resistance to migration. The contributions ofsuch relations are of particular importance in international HE mobility because language skillsallow migrant students to shrink their “sunk costs”. However, it seems that the role of this variableis underestimated in the literature since in numerous studies only one measure of language linkage isused. For example, Beine et al. (2014) only refer to “Common o�cial language” while Van Bouweland Veugelers (2013) base on “Common spoken language” and Vogtle and Windzio (2016) use the“Same language branch”. Unlike these authors, we refer to four measures of language relationshipswhich are computed by Melitz and Toubal (2014):
(i) Common o�cial language (COL): An o�cial language implies that “all messages in the lan-guage are received by everyone in the country at no marginal cost, regardless what languagethey speak”. This variable takes two values: 1 if two countries share the same o�cial languageand 0 otherwise.
(ii) Common spoken language (CSL): it is the probability that a random pair of individuals fromtwo countries can understand each other in a given language. Since a pair of countries mayshare di�erent spoken languages, CSL can be calculated as:
CSL = max – + (– ≠ max –)(1 ≠ max –)
where – := –ij =qn
l=1 LliLlj ; Ll is the percentage of speakers of a typical language l and nis the number of spoken languages that two countries share.
(iii) Common native language (CNL): it refers to a probability that a random pair of individualsfrom two countries speak the same native language. The measure of this variable is similarto the CSL. Hence, it follows that CSL includes CNL and is greater than CNL.
4
(iv) Language proximity (LP): it implies the closeness of two di�erent native languages. Melitzand Toubal (2014) propose two indicators of LP: the Ethnologue classification of languagetrees between trees, branches, and sub-branches and the Automated Similarity JudgmentProgram. In our study, the latter is used to capture the LP.
Turning to our second resistance, the role of networks has been widely investigated in theeconomic literature. Networking deals with the interest in how social and institutional relationshipsplay an important role in human capital accumulation. In our specific case, we wonder if individualswho are tied to other individuals within social or institutional networks are more prone to becomemobile.
A commonly used proxy of network is the stock of all migrants from the origin country livingat destination (see for example Beine et al., 2011, 2014; Bertoli and Fernández-Huertas Moraga,2015). Those migrants are likely to provide assistance and information to students from theircountry of origin and therefore decrease their migration costs. However, according to the WorldBank, international migrant stock is defined as the number of people born in a country other thanthat in which they live, including refugees or asylum seekers. Therefore, it embodies a broaderpopulation than the targeted one, allowing us to introduce two other measures of networks.
A first way to proxy networking is to compute the average number of tertiary students froman origin country moving to a destination country in the last years. Social networks of friends orprevious students are informal, but we assume that they are critical determinants in individualdecision to study overseas.
The role of informal networks in international HE has been addressed in qualitative case studiesfrom sociological perspectives (see for example Mazzarol and Soutar, 2002; Brooks and Waters,2010; Beech, 2015; Pedro and Franco, 2016). This approach argues that international mobility isoften socially embedded and highly influenced by either friendship or kindship networks. Beech(2015) for example, documents that such networks may provide advice and encouragement, shareliving experiences that could have a decisive influence on potential students mobility. Our researchenlarges these studies by using a quantitative investigation instead of a qualitative approach. Asin Beine et al. (2014), we expect that previous students have assimilated many information aboutthe destination country and, across their feedback, share knowledge on it and help to reduce thecost of moving there.
A second proxy of network e�ects consists in looking at formal partnerships which have beenestablished among HEIs in sending and destination countries. In particular, the Erasmus Mundus- Action 2 (EMA2) programme, which is dedicated to the development of relations between Europeand other regions through international mobility, has become a growing used tool in the interna-tionalization process. This action has the main objectives of promoting intercultural understandingand exchange of persons and knowledge in order to develop HE teaching and learning capacity,and to build the management capacity of HEIs in third countries. In fact, it aims primarily at con-tributing to the socio-economic development of the non-EU countries targeted by the EU externalcooperation policy: we talk about “Lots” of covered countries, or “Eligible” partner countries. Tothis purpose, grants are awarded to students (from Bachelor to Post-doctorate) and to academicand administrative sta�.4 Moreover, to be eligible for any EMA2 scholarship, applicants must meeta set of minimum requirements. Targets are clearly defined in terms of mobility flows (host/homeinstitutions, cohorts), disciplines and academic o�ers (courses, internships), and in terms of candi-dacy (students, sta�). Among the main questions that are raised by such programmes, one wondersif the underlying eligibility criteria of mobility which is o�ered by EMA2 (area of study, type ofmobility, language requirements, partner institutions) lowers resistance to international mobilityof students.
Monodic factorsMonodic variables are a set of variables which capture home or host country specific character-
istics. Various strands of the economic literature study the factors which influence the choice of
4Among the people eligible to EMA2 scholarship, note that some are very short-term migrants (e.g., one fullmonth for academic and administrative sta�). They travel to another country “to visit” for a specific period butnot to live; they are not considered immigrants, even temporary ones.
5
HEIs from di�erent perspectives. While aspects on destinations are gathered into “Pull factors”,the ones which determine individuals from sending countries to move abroad are synthesized into“Push factors”. Push factors are conditions that propel students to leave the origin country, whilepull factors are conditions that entice students to enter a destination country rather than another.Both push and pull factors are at play in the decision for a student to become a mover (Bansaket al., 2015). Virtually, every push factor has a corresponding pull factor, and vice-versa. But morespecifically, regulatory policies, as well as deep political and institutional characteristics of coun-tries, have been shown to influence trade as modeled in the gravity framework (Shepherd, 2012).In the present study, we believe that such “behind-the-border barriers” aptly apply to migrationflows, especially when they are concerned with international mobility of students.
To address the issue, a number of economic and socio-demographic conditions will be testedin determining how economic development influences student mobility. But on the other side,individual perception on public institutions, civil society or social cohesion in home and hostcountries is of great importance in mobility decision. The objective here is to investigate thee�ects of institutional factors and beliefs on, or to describe a specific environment underlyingmobility choice. Quality considerations, migration climate, expectations and social relations areespecially highlighted here.
From a host country point of view, the ability of a country to attract talent from around theworld on a highly competitive basis allows their institutions to further strengthen their capacity,improve their rankings and also their reputation. Quality considerations in HE are widely addressedin this perspective (Van Bouwel and Veugelers, 2013). In the same manner, many countries tryto limit the number of immigrants entering their country but also to shape the characteristics ofthe inflow, including internationally mobile students. The policies that destination countries adoptplay a central role in determining how many people study abroad and where they go.
Unfortunately, the empirical literature on international student mobility devotes much lessattention to the impact of such policies on sending countries. Let’s take the provision of publicservices: according to the existing studies, an inflow of foreign-born HE students may put pressureon the education system and other publicly provided services. Keeping fiscal costs unchanged (andthe resulting price of HE unchanged), this inflow increases the demand for HE and could crowd outnatives from universities, and the quality of education may fall in the host country. However, few(if any) studies have tried to look at the e�ects of such policies which are conducted in destinationcountries on the choice of location made by a student in sending countries. As in Van Bouweland Veugelers (2013), we use di�erent measures as quality indicators: the number of universitiesa country has in the top 100 of the Shanghai ranking and the quality of public services in HE(teaching and research). However, other characteristics which describe the immigration climateand the accessibility to public facilities will also be added to test the “attractiveness” of HEIs inthe host country.
Our purpose here is also to determine how developing countries can “push” or discourageexit by migrants who are skilled (students). On the sending country side, quality considerations(teaching, research, employability) or improvement in human capital through internationalizationof HE can be taken into consideration. For example, relatively few institutions in developingcountries provide doctoral education. Therefore, the driving force for student mobility appears tobe the lack of educational opportunities in the home country at graduate level. In our specific case,it means that HE supply is not su�cient to meet demand in the origin country: moving abroad toget a better education may be the best solution to incomplete education markets (Bansak et al.,2015)5. More interestingly, socio-demographic characteristics of home countries are introduced inour study. Indeed, a “youth bulge” in the home country may increase the population of youngadults, the group most likely to migrate in search of better opportunities.
The recent literature puts evidence that economic conditions (income, unemployment rate, taxburden, skills shortage) matter more in destination countries than in sending countries, implyingthat they are bigger pull factors than push factors (Bansak et al., 2015). However, existing studies
5Relying on micro-data of 2,485 students from four countries (China, India, Indonesia, Taiwan), Mazzarol andSoutar (2002) claim that the di�cult to gain entry at home and course not available at home appear to be the mainreasons pushing these students studying abroad.
6
show mixed results on these economic aspects. For example, the level of GDP per capita (a proxy ofdevelopment) in the home country has been found negative in explaining outflows in some empiricalstudies (Clark et al., 2007; Hatton and Williamson, 2005; Pedersen et al., 2008). But unlike thenegative prediction, some others have found positive or ambiguous e�ect (Grogger and Hanson,2011; Mayda, 2010). As average incomes rise, fewer people are migrating because the country’seconomy is better o� (negative correlation); but it may happen that more people can a�ord tomigrate, thereby developing emigration flows (positive correlation). The present study will addressthis issue in the specific flows of student migrants.
Lastly, policies or restrictions that discourage out bound students can also be viewed from thesending country side. Emigration may a�ect the sending country (especially when migrants areskilled), and concern that these e�ects are negative is the main reason why some countries imposerestrictions on emigration (especially in developing ones). For some authors, the so-called “braindrain” (loss in highly-skilled labor force, loss in social welfare, etc. which occur within the origincountry) is however counter-balanced by a “brain gain”, that is: the sending country benefits ifemigrants return after acquiring skills abroad or if the possibility of emigrating causes residents toacquire more skills as the expected return to education increases (Docquier and Sekkat, 2006). Inthis line of argument, we expect here that international students coming in the sending countrybring positive externalities in terms of knowledge, learning capacity and human capital formation.
To deal with all the monodic factors underlying institutions, beliefs or perceptions in send-ing and receiving countries, we use the Institutional Profiles Database (IPD) which has been acollaborative result from the French Development Agency (AFD) and the Directorate General ofthe Treasury (DG Trésor). The IPD provides an original measure of countries’ institutional char-acteristics through composite indicators built from perception data6. These indicators are madeavailable for academic research purposes and more specifically to explore the relationship betweeninstitutions and development. Other macroeconomic data are mainly downloaded from the WorldBank database (World Development Indicators) and from Eurostat. Table 1 reports our di�erentvariables of interest and their source. Some summary statics are presented in Appendix C.
3. Methodology
3.1. Theoretical backgroundThe present study applies the Random Utility Maximization (RUM) model of migration (Beine
et al., 2011, 2016; Bertoli and Fernández-Huertas Moraga, 2013, 2015 among others) to the contextof international mobility of students. The main assumption underlying this research framework isthe existence of multilateral resistance to migration.
Let’s start with the migration decision of a student k in country i œ O to country j œ D
Ukij = aij ≠ cij + ‘kij (1)
where i = 1, 2, . . . O is a set of origin countries and j = 1, 2, . . . D is a set of destination countries.Variable aij implies a deterministic component of utility while cij includes specific costs of movingfrom i to j, and ‘kij is a student-specific stochastic term. It is assumed to follow an independentand identically distributed extreme value type 1 distribution (iid EVT-1).
Let pij be the probability that student k chooses country j instead of staying at home or analternative country l œ D. If the deterministic component does not vary with origin country i, thisprobability can be expressed as in Beine et al. (2013):
pij = Pr{Ukij = maxlœD
Ukil} (2)
= eai≠cij
qlœD ealt≠cilt
= Sij
Si
6Source: http://www.cepii.fr/institutions/EN/ipd.asp
7
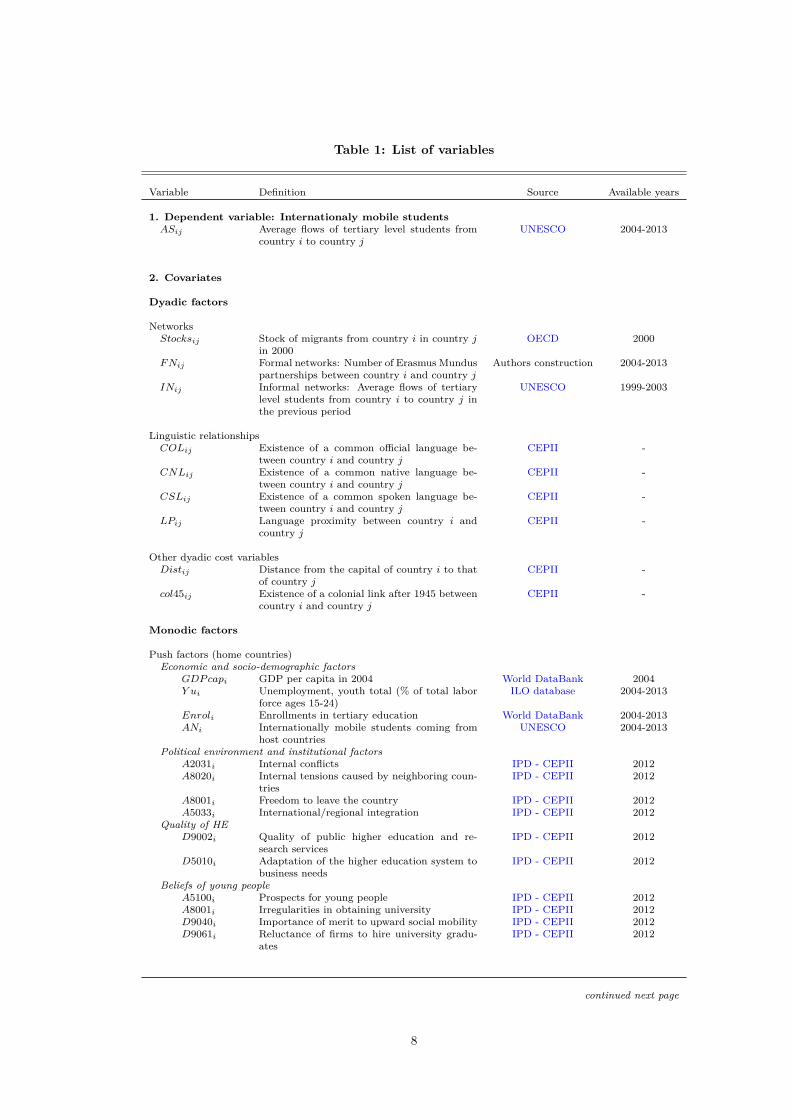
Table 1: List of variables
Variable Definition Source Available years
1. Dependent variable: Internationaly mobile studentsASij Average flows of tertiary level students from
country i to country jUNESCO 2004-2013
2. Covariates
Dyadic factors
NetworksStocksij Stock of migrants from country i in country j
in 2000OECD 2000
F Nij Formal networks: Number of Erasmus Munduspartnerships between country i and country j
Authors construction 2004-2013
INij Informal networks: Average flows of tertiarylevel students from country i to country j inthe previous period
UNESCO 1999-2003
Linguistic relationshipsCOLij Existence of a common o�cial language be-
tween country i and country jCEPII -
CNLij Existence of a common native language be-tween country i and country j
CEPII -
CSLij Existence of a common spoken language be-tween country i and country j
CEPII -
LPij Language proximity between country i andcountry j
CEPII -
Other dyadic cost variablesDistij Distance from the capital of country i to that
of country jCEPII -
col45ij Existence of a colonial link after 1945 betweencountry i and country j
CEPII -
Monodic factors
Push factors (home countries)Economic and socio-demographic factors
GDP capi GDP per capita in 2004 World DataBank 2004Y ui Unemployment, youth total (% of total labor
force ages 15-24)ILO database 2004-2013
Enroli Enrollments in tertiary education World DataBank 2004-2013ANi Internationally mobile students coming from
host countriesUNESCO 2004-2013
Political environment and institutional factorsA2031i Internal conflicts IPD - CEPII 2012A8020i Internal tensions caused by neighboring coun-
triesIPD - CEPII 2012
A8001i Freedom to leave the country IPD - CEPII 2012A5033i International/regional integration IPD - CEPII 2012
Quality of HED9002i Quality of public higher education and re-
search servicesIPD - CEPII 2012
D5010i Adaptation of the higher education system tobusiness needs
IPD - CEPII 2012
Beliefs of young peopleA5100i Prospects for young people IPD - CEPII 2012A8001i Irregularities in obtaining university IPD - CEPII 2012D9040i Importance of merit to upward social mobility IPD - CEPII 2012D9061i Reluctance of firms to hire university gradu-
atesIPD - CEPII 2012
continued next page
8
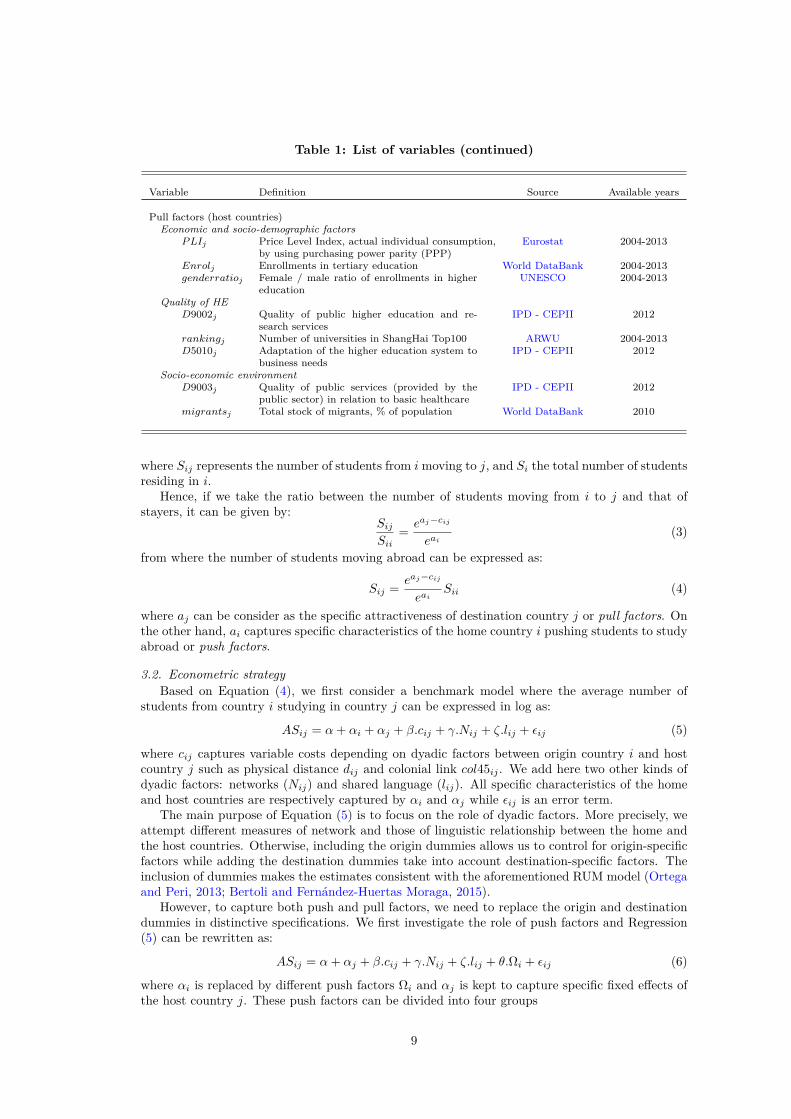
Table 1: List of variables (continued)
Variable Definition Source Available years
Pull factors (host countries)Economic and socio-demographic factors
P LIj Price Level Index, actual individual consumption, Eurostat 2004-2013by using purchasing power parity (PPP)
Enrolj Enrollments in tertiary education World DataBank 2004-2013genderratioj Female / male ratio of enrollments in higher
educationUNESCO 2004-2013
Quality of HED9002j Quality of public higher education and re-
search servicesIPD - CEPII 2012
rankingj Number of universities in ShangHai Top100 ARWU 2004-2013D5010j Adaptation of the higher education system to
business needsIPD - CEPII 2012
Socio-economic environmentD9003j Quality of public services (provided by the
public sector) in relation to basic healthcareIPD - CEPII 2012
migrantsj Total stock of migrants, % of population World DataBank 2010
where Sij represents the number of students from i moving to j, and Si the total number of studentsresiding in i.
Hence, if we take the ratio between the number of students moving from i to j and that ofstayers, it can be given by:
Sij
Sii= eaj≠cij
eai(3)
from where the number of students moving abroad can be expressed as:
Sij = eaj≠cij
eaiSii (4)
where aj can be consider as the specific attractiveness of destination country j or pull factors. Onthe other hand, ai captures specific characteristics of the home country i pushing students to studyabroad or push factors.
3.2. Econometric strategyBased on Equation (4), we first consider a benchmark model where the average number of
students from country i studying in country j can be expressed in log as:
ASij = – + –i + –j + —.cij + “.Nij + ’.lij + ‘ij (5)
where cij captures variable costs depending on dyadic factors between origin country i and hostcountry j such as physical distance dij and colonial link col45ij . We add here two other kinds ofdyadic factors: networks (Nij) and shared language (lij). All specific characteristics of the homeand host countries are respectively captured by –i and –j while ‘ij is an error term.
The main purpose of Equation (5) is to focus on the role of dyadic factors. More precisely, weattempt di�erent measures of network and those of linguistic relationship between the home andthe host countries. Otherwise, including the origin dummies allows us to control for origin-specificfactors while adding the destination dummies take into account destination-specific factors. Theinclusion of dummies makes the estimates consistent with the aforementioned RUM model (Ortegaand Peri, 2013; Bertoli and Fernández-Huertas Moraga, 2015).
However, to capture both push and pull factors, we need to replace the origin and destinationdummies in distinctive specifications. We first investigate the role of push factors and Regression(5) can be rewritten as:
ASij = – + –j + —.cij + “.Nij + ’.lij + ◊.�i + ‘ij (6)
where –i is replaced by di�erent push factors �i and –j is kept to capture specific fixed e�ects ofthe host country j. These push factors can be divided into four groups
9
(i) Economic and socio-demographic factors
(ii) Political environment and institutional factors
(iii) Quality of HE
(iv) Beliefs of young people
Second, we examine how attractiveness of the host country (pull factors) a�ects the internationalmobility in HE by using the following equation:
ASij = – + –i + — ◊ cij + “.Nij + ’.lij + ◊.�j + ‘ij (7)
where all specific fixed e�ects of the sending country i are captured by –i while �j includes di�erentpull factors.
In a last step, both push and pull factors are combined to shed light on the interactions betweenspecific determinants of attractiveness and exit. We rely on the following equation:
ASij = – + —.cij + “.Nij + ’.lij + ◊1.�i + ◊2.�j + ‘ij (8)
where –i is replaced by di�erent home specific factors �i and –j is replaced by di�erent destinationspecific factors �j .
Equations (5) to (8) can be estimated by the OLS method. However, owing to the presenceof zero flows (representing 14% of our sample), covariates can be correlated with the error terms,which makes the OLS model inconsistent. To deal with this concern, the two-stage method à laHeckman as in Beine et al. (2011) and the Poisson Pseudo-Maximum Likelihood Estimator (PPML)as in Beine et al. (2014) can be relevant. In this research, we rely on the PPML estimator which hasbeen developed by Silva and Tenreyro (2006). This method allows us to deal with two problemsassociated with the log-linearization of observed values: (i) the existence of heteroskedasticity,which leads to inconsistent estimates and (ii) the presence of zero flows as aforementioned.
Along the estimation process, the dependent variable is the average flow of migrant studentsfrom country i to country j over the period 2004 to 2013. We do not estimate neither the poolnor annual data for two reasons. First, according to Beine et al. (2014), some dyadic factorslike linguistic, colonial links and Euclidean distance are constant overtime and can be included inbilateral specific e�ects in pooling data. Second, estimating annual migrant students separatelymay not control for sudden shocks and thus lead to biased estimated coe�cients.
4. Main findings
4.1. Role of dyadic factorsThis subsection aims at investigating the role of dyadic factors in determining international
student mobility, keeping dummies for the fixed e�ects of home and host countries. In complementto the mobility costs which are commonly used in gravity empirics, two other kinds of dyadicresistance are explored in this purpose.
Role of NetworksBased on Equation (5), we expect to find evidence on the impacts of three kinds of networking
on outflow of students : (i) Average migrant students in the past considered as “informal network”,(ii) Average numbers of EMA2 partnerships between home and host countries as a proxy for “formalnetwork”, and (iii) Stock of migrants in 2000, defined as a general measure of network e�ects innumerous empirical studies. The associated estimates are displayed in Table 2. Each measure ofnetworks is studied separately in alternative models from 1 to 3 and to focus on their role, weassume for the moment that linguistic links are proxied by Common o�cial language (COL).
Table 2 depicts robust and positive e�ects of networks: whatever the measure under consider-ation, networks influence student mobility. This is consistent with predictions, especially when itconcerns developing countries. Pedersen et al. (2008) for example, found that networks matter themost for immigrants coming from poor origin countries.
10
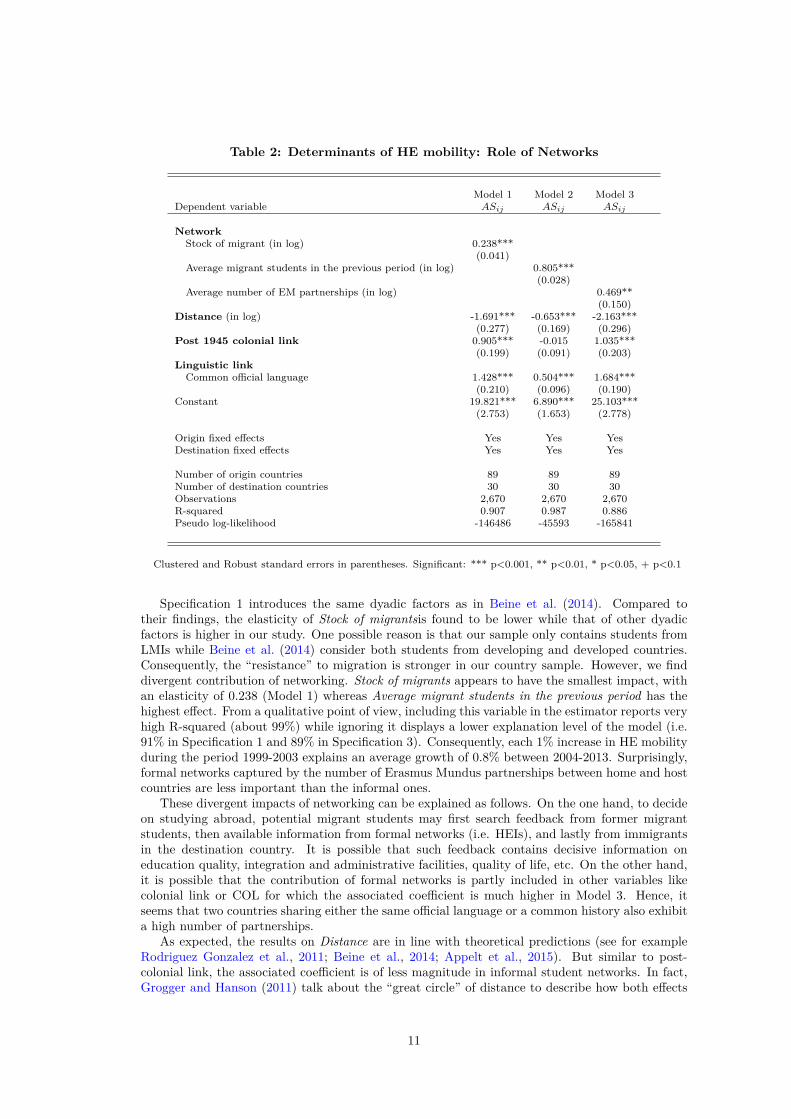
Table 2: Determinants of HE mobility: Role of Networks
Model 1 Model 2 Model 3Dependent variable ASij ASij ASij
NetworkStock of migrant (in log) 0.238***
(0.041)Average migrant students in the previous period (in log) 0.805***
(0.028)Average number of EM partnerships (in log) 0.469**
(0.150)Distance (in log) -1.691*** -0.653*** -2.163***
(0.277) (0.169) (0.296)Post 1945 colonial link 0.905*** -0.015 1.035***
(0.199) (0.091) (0.203)Linguistic link
Common o�cial language 1.428*** 0.504*** 1.684***(0.210) (0.096) (0.190)
Constant 19.821*** 6.890*** 25.103***(2.753) (1.653) (2.778)
Origin fixed e�ects Yes Yes YesDestination fixed e�ects Yes Yes Yes
Number of origin countries 89 89 89Number of destination countries 30 30 30Observations 2,670 2,670 2,670R-squared 0.907 0.987 0.886Pseudo log-likelihood -146486 -45593 -165841
Clustered and Robust standard errors in parentheses. Significant: *** p<0.001, ** p<0.01, * p<0.05, + p<0.1
Specification 1 introduces the same dyadic factors as in Beine et al. (2014). Compared totheir findings, the elasticity of Stock of migrantsis found to be lower while that of other dyadicfactors is higher in our study. One possible reason is that our sample only contains students fromLMIs while Beine et al. (2014) consider both students from developing and developed countries.Consequently, the “resistance” to migration is stronger in our country sample. However, we finddivergent contribution of networking. Stock of migrants appears to have the smallest impact, withan elasticity of 0.238 (Model 1) whereas Average migrant students in the previous period has thehighest e�ect. From a qualitative point of view, including this variable in the estimator reports veryhigh R-squared (about 99%) while ignoring it displays a lower explanation level of the model (i.e.91% in Specification 1 and 89% in Specification 3). Consequently, each 1% increase in HE mobilityduring the period 1999-2003 explains an average growth of 0.8% between 2004-2013. Surprisingly,formal networks captured by the number of Erasmus Mundus partnerships between home and hostcountries are less important than the informal ones.
These divergent impacts of networking can be explained as follows. On the one hand, to decideon studying abroad, potential migrant students may first search feedback from former migrantstudents, then available information from formal networks (i.e. HEIs), and lastly from immigrantsin the destination country. It is possible that such feedback contains decisive information oneducation quality, integration and administrative facilities, quality of life, etc. On the other hand,it is possible that the contribution of formal networks is partly included in other variables likecolonial link or COL for which the associated coe�cient is much higher in Model 3. Hence, itseems that two countries sharing either the same o�cial language or a common history also exhibita high number of partnerships.
As expected, the results on Distance are in line with theoretical predictions (see for exampleRodriguez Gonzalez et al., 2011; Beine et al., 2014; Appelt et al., 2015). But similar to post-colonial link, the associated coe�cient is of less magnitude in informal student networks. In fact,Grogger and Hanson (2011) talk about the “great circle” of distance to describe how both e�ects
11
of network and physical distance act together. When the coe�cients associated to each variableare aggregated, this “great circle” in informal network lowers the cost of migrating and stimulatesstudent mobility (0.805 ≠ 0.653 = 0.152 in Model 2) while it still discourages outflows in the twoother networks (respectively ≠1.453 and ≠1.694 in Models 1 and 3).
Other dyadic factors were investigated in order to proxy commercial links between countries:regional trade agreements, preferential treatment of imports coming from former colonies or somespecific developing countries. The results appear to be insignificant in explaining student mobility.Therefore, in order to keep tractability of our empirical investigation and to shorten our tables, weleave them aside.
According to Table 2, sharing the same o�cial language increases the number of internationallymobile students by at least 65.5%.7 However, using a sole measure of common language mightunderestimate this e�ect.8 As noted Bertoli and Fernández-Huertas Moraga (2013, 2015), potentialmigrants face multilateral resistance and in our case, linguistic skills are likely to be an importantfactor. Hence, in order to have a fresher eye on the role of linguistic relations, di�erent indicatorswill be taken into account in what follows.
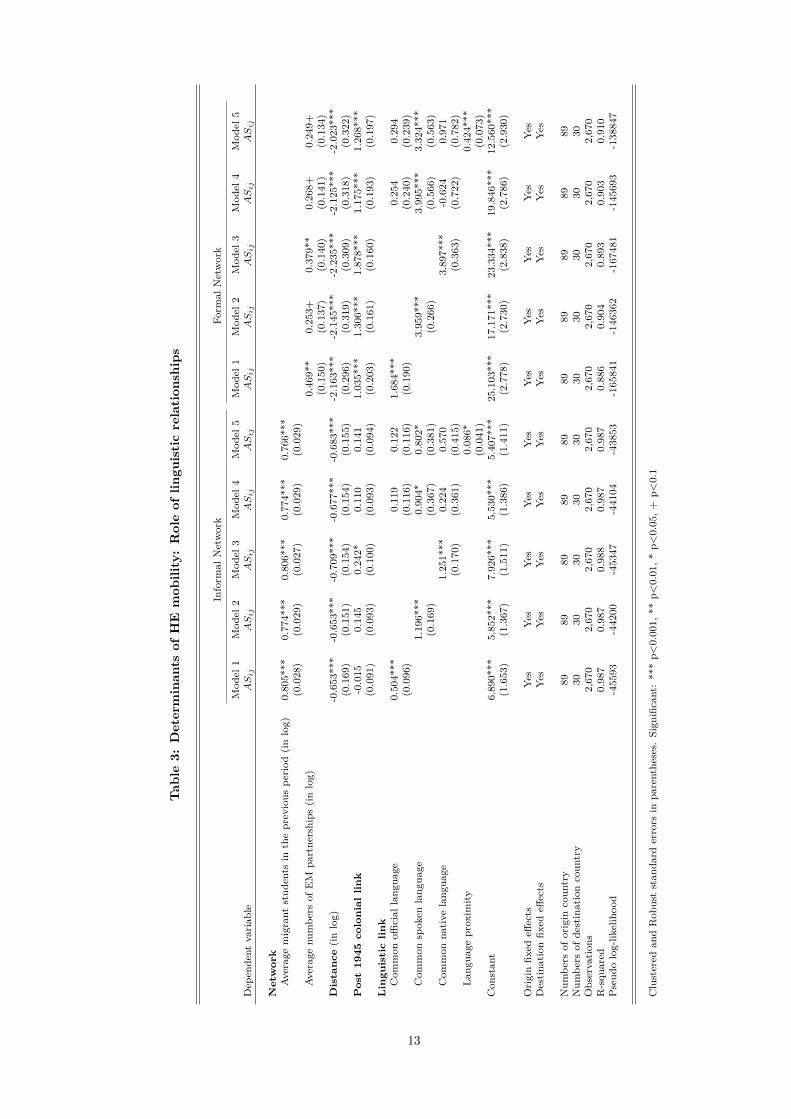
Role of linguistic skillsWe explore here four indicators of linguistic relationships (COL, CSL, CNL, and LP) as shown
in Melitz and Toubal (2014, 2016). Estimation results using Equation (5) and relying on the PPMLmethod are reported in Table 3. Since Stock of migrants is less important, only Average migrantstudents in the previous period and Average number of EM partnerships are kept afterwards in orderto explore the resistance of informal versus formal networks. From columns (1) to (4), informalnetwork is focused while in the last four columns, this variable is replaced by formal network. Forboth networking, each indicator of linguistic relationship is considered separately: COL in Model1, CSL in Model 2, and CNL in Model 3. In Model 4, the three indicators are gathered togetherbefore introducing language proximity in Model 5.
Whatever the related network, COL, CSL and CNL are all significant at 0.1% level when theyare alternatively controlled for. However, CNL and CSL appear to have a stronger impact onthe flows of student mobility. In informal networks for example, sharing CSL (CNL) with anEuropean host country increases the number of mobility students from the related sending countryby 232% (249%) and when these variables are all introduced in the estimation (Column 4), onlyCSL remains significant. Similar results occur when LP is introduced. Since neither COL nor CNLis significant, their role is probably absorbed by CSL, implying the importance of communicationfacility over influence of ethnicity and mutual trust in the higher education’s migration. All in all,these findings support our aforementioned intuition that using the sole COL may underestimatethe role of linguistic skills.
When formal network is considered separately, the coe�cients of common language become atleast three times higher than those associated with informal network. It is possible that Europeancountries use the EMA2 programme to apply indirectly “qualitative” selection criteria (thereforeimmigration policies) on skilled migrants. Coniglio and Kondoh (2015) for example, argue thatthe EU uses restrictive requirements in language skills to limit the number of immigrants fromnon-EU countries. It follows that only students with su�cient linguistic levels are selected byEMA2 partners in the sending and the destination countries, enabling linguistic resistance tobecome stronger in the formal network than in the informal one. When all linguistic indicators aregathered, CSL remains the most important indicator.
Interestingly, the coe�cients of Distance and Colonial link associated with formal networksare found to be much higher than those related to informal networks. Historical ties are highlysignificant in the former network and this may also reflect an immigration policy, that is: inflowsare selected through admission preferences to students of former colonies. These findings tend tosupport our above-mentioned intuitions. On the one hand, the low contribution of institutionalnetwork may be possibly absorbed by colonial and linguistic relations. On the other hand, feedback
7The coe�cient of COL is the lowest in Specification 2. The associated impact is computed by: exp(0.504)-1=0.655, that is 65.5%.
8In the case of bilateral trade, using a sole linguistic relationship only explains one fifth of the total impact(Melitz and Toubal, 2014).
12
Tab
le3:
Det
erm
inan
tsof
HE
mob
ility
:R
ole
oflin
guis
tic
rela
tion
ship
s
Info
rmal
Net
wor
kFo
rmal
Net
wor
k
Mod
el1
Mod
el2
Mod
el3
Mod
el4
Mod
el5
Mod
el1
Mod
el2
Mod
el3
Mod
el4
Mod
el5
Dep
ende
ntva
riab
leA
Sij
AS
ijA
Sij
AS
ijA
Sij
AS
ijA
Sij
AS
ijA
Sij
AS
ij
Net
wor
kAv
erag
em
igra
ntst
uden
tsin
the
prev
ious
peri
od(i
nlo
g)0.
805*
**0.
774*
**0.
806*
**0.
774*
**0.
766*
**(0
.028
)(0
.029
)(0
.027
)(0
.029
)(0
.029
)Av
erag
enu
mbe
rsof
EM
part
ners
hips
(in
log)
0.46
9**
0.25
3+0.
379*
*0.
268+
0.24
9+(0
.150
)(0
.137
)(0
.140
)(0
.141
)(0
.134
)D
ista
nce
(in
log)
-0.6
53**
*-0
.653
***
-0.7
09**
*-0
.677
***
-0.6
83**
*-2
.163
***
-2.1
45**
*-2
.235
***
-2.1
25**
*-2
.023
***
(0.1
69)
(0.1
51)
(0.1
54)
(0.1
54)
(0.1
55)
(0.2
96)
(0.3
19)
(0.3
09)
(0.3
18)
(0.3
22)
Pos
t19
45co
loni
allin
k-0
.015
0.14
50.
242*
0.11
00.
141
1.03
5***
1.30
6***
1.87
8***
1.17
5***
1.26
8***
(0.0
91)
(0.0
93)
(0.1
00)
(0.0
93)
(0.0
94)
(0.2
03)
(0.1
61)
(0.1
60)
(0.1
93)
(0.1
97)
Lin
guis
tic
link
Com
mon
o�ci
alla
ngua
ge0.
504*
**0.
119
0.12
21.
684*
**0.
254
0.29
4(0
.096
)(0
.116
)(0
.116
)(0
.190
)(0
.240
)(0
.239
)C
omm
onsp
oken
lang
uage
1.19
6***
0.90
4*0.
802*
3.95
9***
3.99
5***
3.32
4***
(0.1
69)
(0.3
67)
(0.3
81)
(0.2
66)
(0.5
66)
(0.5
63)
Com
mon
nati
vela
ngua
ge1.
251*
**0.
224
0.57
03.
897*
**-0
.624
0.97
1(0
.170
)(0
.361
)(0
.415
)(0
.363
)(0
.722
)(0
.782
)La
ngua
gepr
oxim
ity0.
086*
0.42
4***
(0.0
41)
(0.0
73)
Con
stan
t6.
890*
**5.
852*
**7.
926*
**5.
530*
**5.
407*
**25
.103
***
17.1
71**
*23
.334
***
19.8
46**
*12
.560
***
(1.6
53)
(1.3
67)
(1.5
11)
(1.3
86)
(1.4
11)
(2.7
78)
(2.7
30)
(2.8
38)
(2.7
86)
(2.9
30)
Ori
gin
fixed
e�ec
tsY
esY
esY
esY
esY
esY
esY
esY
esY
esY
esD
esti
nati
onfix
ede�
ects
Yes
Yes
Yes
Yes
Yes
Yes
Yes
Yes
Yes
Yes
Num
bers
ofor
igin
coun
try
8989
8989
8989
8989
8989
Num
bers
ofde
stin
atio
nco
untr
y30
3030
3030
3030
3030
30O
bser
vati
ons
2,67
02,
670
2,67
02,
670
2,67
02,
670
2,67
02,
670
2,67
02,
670
R-s
quar
ed0.
987
0.98
70.
988
0.98
70.
987
0.88
60.
904
0.89
30.
903
0.91
0P
seud
olo
g-lik
elih
ood
-455
93-4
4200
-453
47-4
4104
-438
53-1
6584
1-1
4636
2-1
6748
1-1
4569
3-1
3884
7
Clu
ster
edan
dR
obus
tst
anda
rder
rors
inpa
rent
hese
s.Si
gnifi
cant
:**
*p<
0.00
1,**
p<0.
01,*
p<0.
05,+
p<0.
1
13
from former migrant students is so important that distance is less costly and colonial link becomesinsignificant in informal networks.
DiscussionOur findings indicate that social interactions through networking matter, and linguistic links
(which are other ties connecting individuals) also matter and may even hide selective criteria toentries. In summary, CSL appears to be the most important linguistic resistance to internationalmobility in HE while the most important network e�ect comes from informal interactions.
Our analysis about the role of dyadic factors makes two important contributions to the liter-ature. Firstly, we show how important it is to consider di�erent linguistic indicators (Melitz andToubal, 2014, 2016). Using only one of them can lead to an underestimated value and thus makeinconsistent the interpretation.
The second important contribution is the inclusion of di�erent measures of networking whilemost studies on the topic consider only Stock of migrants (Beine et al., 2011, 2014; Bertoli andFernández-Huertas Moraga, 2013 among others). In our paper however, once other indicators ofnetworking are controlled for, the role of Stock of migrants becomes even insignificant 9. Thesefindings can be explained as follows.
First, former migrant students are the main sources of information (on living conditions, ed-ucation quality, friendly administration, etc.), which helps to shrink “sunk costs” for potentialmigrant students. Moreover, such information is likely to be more relevant than that supplied bycountryman (from stock of migrants) or formal partnerships. In a certain sense, our results seemto be consistent with Beine et al. (2014) who also show a higher impact of skilled migrants on theflow of international students compared to general ones.
Second, the small contribution of Stock of migrants and Institutional partnerships can be partlyabsorbed by other covariates like Colonial link or common languages. In addition, our finding onthe role of formal network (captured here by the Number of EM partnerships between EU andnon-EU countries) is in the same spirit that Shields (2013) who underlines the positive impact ofinternational governmental organization membership on the international mobility of students.
4.2. Role of Monodic factorsThe aforementioned analysis does not control for countries characteristics. Yet, taking into
account country specific factors are important in terms of policy implications. On the home side,it helps us ti understand why students do not desire to pursuing their study at home. On the hostside, it will suggest some policy-relevant outcomes in terms of attractiveness. To tackle these issuesin what follows, only CSL is taken to measure linguistic resistance and Average migrant students inthe previous period are estimated separately to shed light on the impact of country specific factorson informal networks alternatively to aggregated networks.
4.2.1. Push factorsTable 4 reports the role of monodic push factors in the mobility of HE. Estimates relies on
the PPML method basing on Equation (6). Both formal and informal networks are gathered inthe first estimations. Economic and socio-demographic factors are explored in Model 1 and theninstitutional profiles provided by the IPD will be introduced to highlight qualitative aspects inModel 2. In Model 3, informal network is considered separately in a comparative perspective.
Looking at Model 1, our empirical results evidence a qualitatively strong impact of economicand socio-demographic factors in sending countries. Consistent with theoretical predictions, theinitial level of GDP per capita, which is an indicator of their development level, appears to benegative and statistically significant at 0.1% level. The associated sign suggests that a substitutione�ect prevails: as the home country gets richer, students will prefer to stay at home and the numberof them moving abroad will decrease. Conversely, poorer countries tend to have higher studentoutflows because educational opportunities are more limited there. As aforementioned in Section
9Estimated results are available upon request.
14
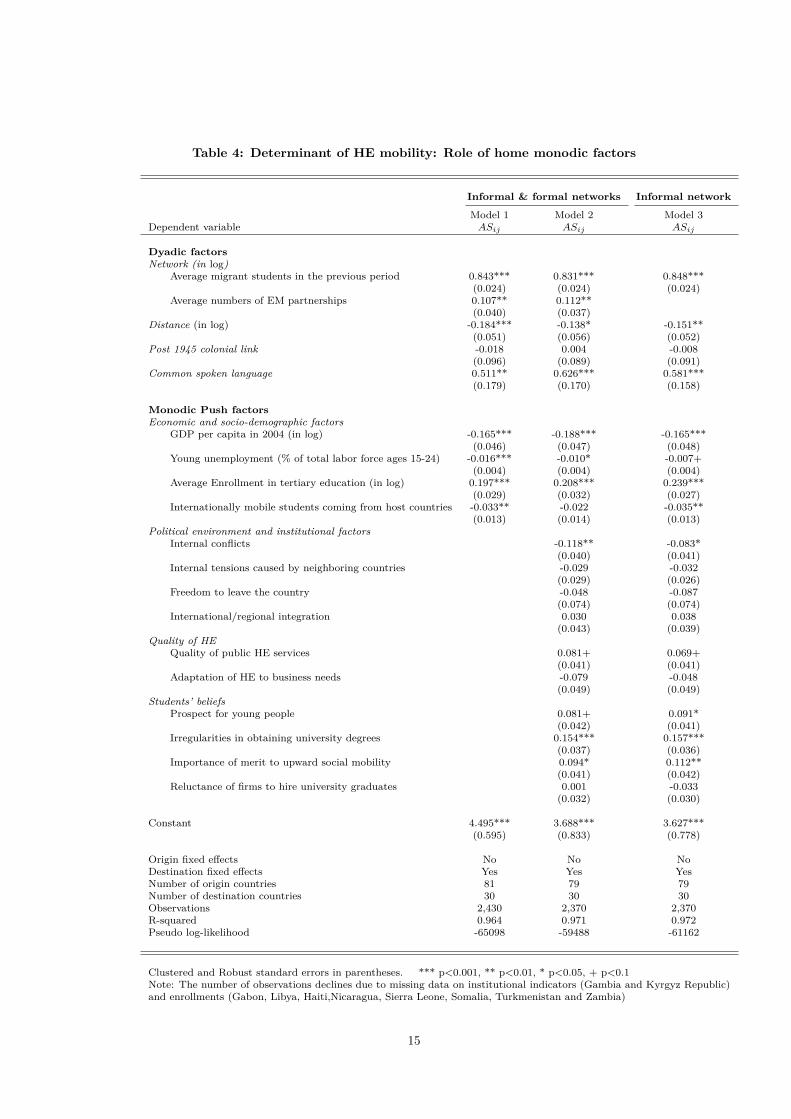
Table 4: Determinant of HE mobility: Role of home monodic factors
Informal & formal networks Informal networkModel 1 Model 2 Model 3
Dependent variable ASij ASij ASij
Dyadic factorsNetwork (in log)
Average migrant students in the previous period 0.843*** 0.831*** 0.848***(0.024) (0.024) (0.024)
Average numbers of EM partnerships 0.107** 0.112**(0.040) (0.037)
Distance (in log) -0.184*** -0.138* -0.151**(0.051) (0.056) (0.052)
Post 1945 colonial link -0.018 0.004 -0.008(0.096) (0.089) (0.091)
Common spoken language 0.511** 0.626*** 0.581***(0.179) (0.170) (0.158)
Monodic Push factorsEconomic and socio-demographic factors
GDP per capita in 2004 (in log) -0.165*** -0.188*** -0.165***(0.046) (0.047) (0.048)
Young unemployment (% of total labor force ages 15-24) -0.016*** -0.010* -0.007+(0.004) (0.004) (0.004)
Average Enrollment in tertiary education (in log) 0.197*** 0.208*** 0.239***(0.029) (0.032) (0.027)
Internationally mobile students coming from host countries -0.033** -0.022 -0.035**(0.013) (0.014) (0.013)
Political environment and institutional factorsInternal conflicts -0.118** -0.083*
(0.040) (0.041)Internal tensions caused by neighboring countries -0.029 -0.032
(0.029) (0.026)Freedom to leave the country -0.048 -0.087
(0.074) (0.074)International/regional integration 0.030 0.038
(0.043) (0.039)Quality of HE
Quality of public HE services 0.081+ 0.069+(0.041) (0.041)
Adaptation of HE to business needs -0.079 -0.048(0.049) (0.049)
Students’ beliefsProspect for young people 0.081+ 0.091*
(0.042) (0.041)Irregularities in obtaining university degrees 0.154*** 0.157***
(0.037) (0.036)Importance of merit to upward social mobility 0.094* 0.112**
(0.041) (0.042)Reluctance of firms to hire university graduates 0.001 -0.033
(0.032) (0.030)
Constant 4.495*** 3.688*** 3.627***(0.595) (0.833) (0.778)
Origin fixed e�ects No No NoDestination fixed e�ects Yes Yes YesNumber of origin countries 81 79 79Number of destination countries 30 30 30Observations 2,430 2,370 2,370R-squared 0.964 0.971 0.972Pseudo log-likelihood -65098 -59488 -61162
Clustered and Robust standard errors in parentheses. *** p<0.001, ** p<0.01, * p<0.05, + p<0.1Note: The number of observations declines due to missing data on institutional indicators (Gambia and Kyrgyz Republic)and enrollments (Gabon, Libya, Haiti,Nicaragua, Sierra Leone, Somalia, Turkmenistan and Zambia)
15
2, the impact of this factor is shown to be contradictory in determining emigration. In the caseof Asian students moving to the UK, a positive impact has been found by (Naidoo, 2007). Bycontrast, Vogtle and Windzio (2016) shows no evidence of student mobility from poor to richercountries. In our paper, a negative impact of GDP per capita on student mobility to Europe meansthat it is not necessarily a push factor.
Surprisingly, a high unemployment rate of young people hinders international mobility. Incontrast to the first economic variable, this result suggests an income or subsistence e�ect inmobility decision. When the young individual is a�ected by unemployment, he is more likely tomigrate as the probability of finding a job at home decreases. However, this push factor mattersmore for some groups of migrants than others: especially for work-based migrants. But for youngstudents, the opportunity to get a better education may be dampened because they do not haveenough resource to finance their study abroad. Or alternatively, the opportunity cost of educationis higher. In sum, unemployment describes a joint e�ect of income and investment perspectives:young individuals will have to look for a job first. In this sense, the investment decision in humancapital will be given up.
Interestingly, Enrollment in tertiary education is found to be statistically significant at 0.1%level and the associated coe�cient is positive: an increase of 10% in the number of enrolled studentsin the home country leads to a growth of 2% in outflows. Hence, the number of enrollments intertiary education underlies a home cohort or a “market size” e�ect in international mobility; i.e.the potential capacity to send students abroad to improve their human capital. On the opposite,the number of Internationally mobile students coming from host countries negatively a�ects theoutflow of students, although the impact is low both qualitatively and quantitatively. This variablemay bring evidence of a circular e�ect in bilateral flows of students: a higher number of incomingstudents improves learning capacity in the sending country, discouraging domestic students tomove abroad. According to Docquier and Sekkat (2006), the presence of network e�ects withtemporary mobility creates the ability of brain exchange or “brain circulation”. From a braingain perspective, entries of students coming from abroad (here, from Europe) enhances the humancapital of all students at origin.
When the subgroup of institutional factors and perceptions in the home countries are added inModel 2, the estimated coe�cients associated with economic factors remain robust but the circulare�ect becomes insignificant. Unemployment becomes less significant for two reasons. First, theinvestment decision on education overwhelms the income constraint when other factors are takeninto consideration. Second, this investment decision abroad can be partly supported by scholarshipso�ered in formal partnerships. Turning first to the set of political institutions, security and order,Internal conflicts are found to be negative and statistically significant at 5%. It is likely thatthe more a home country experiences intensive internal conflicts, the more it closes its boundariesand prevents any emigration. In addition, since Internal tensions caused by neighboring countries,Freedom to leave the country, and International/regional integration occur to have insignificantimpacts, it is possible that Internal conflicts are the most important institutional factor thatdescribes political environment and absorb impacts of the three other variables. Obviously, whenthe former is removed from the estimation, Freedom to leave the country turns out to becomesignificant while impacts of the two other variables remain insignificant.10
Moving on to the role of Quality considerations, it appears that no variable is significant at5% level: either because they do not influence education decision, or because their impacts areabsorbed by other factors. In fact, whether to move abroad or not is a decision made in responseto sequential arbitrage where the quality dimension seems to be considered after economic, socialand political aspects. In addition, we explore the role of individual beliefs in the home country.Reluctance of firms to hire university graduates is insignificant while the other three variablesare shown to a�ect positively outflows. In countries where Irregularities in obtaining universitydegrees (fraud, purchases of diplomas) are high, students believe that HEIs are corrupted andare pushed abroad. Likewise, if the Merit to upward social mobility is considered important,students are more motivated to study abroad. In other words, beliefs or individual perception onthe prevalence of corruption, the fairness of public institutions may push students into becoming
10Estimate results are available upon request.
16
mobile internationally.In Model 3, informal networks are investigated separately. Some divergent results compared
to those of Model 2 appear. Looking first at the dyadic factors, the role of Distance increasesin informal networks while the coe�cient associated to language skill decreases. The reason isthat the choice of location is constrained by the EMA2 programmes whereas informal networksallow students to move by themselves and to choose freely where to go. Hence, it is likely thatinstitutional partnerships through EMA2 programmes help to reduce distance in HE mobility, butat the expense of stricter language requirements.
When we look at push factors in the specific case of informal networks, the circular e�ectbecomes significant. In other words, hosting international students in the origin country, be it inthe framework of formal partnerships or not, encourages students to stay. Besides that, impactsof Students beliefs are also dependent upon the associated networking. Compared to Model 2,Prospect of young people is found to have a significant positive impact on informal network. Itimplies that the more young people is outward oriented, the more they want to pursue their studyabroad. It is possible that in a country where young people are open to the rest of the word,they search for the simplest way to study overseas. In contrast, applying for EMA2 programmesrequires stricter conditions that discourage their motivation to study abroad.
4.2.2. Pull factorsBy capturing the role of destination specific characteristics, Table 5 depicts monodic pull factors
when we consider home fixed e�ects. Based on the PPML method formalized by Equation (7), weconduct the same empirical exercise. Models 1 and 2 integrate both formal and informal networksin investigating successively economic and socio-demographic variables, then institutional aspects.In Model 3, we only consider informal network with all monodic pull factors.
Compared with previous tables, dyadic factors have a di�erent e�ect at destination. On theone hand, Post colonial link here has a positive and significant e�ect at 1%. Whereas historicalrelations do not a�ect student exit from the home perspective, they strongly a�ect the choice ofthe host country. On the other hand, formal networks have no significant e�ect. This meansthat the di�erent EMA2 partnerships essentially encourage students from the LMI countries tostudy abroad without determining where they will go. Thus, the multiplication of partnershipsby a particular host country does not necessarily increase the number of incoming students, whilehistorical relationships are levers for international mobility.
Comparing models 1 and 2 highlight the extent to which institutional factors in host countriescan influence student inflows. When these variables are added, both the R-squared and the constantincrease: while in Model 1 the constant is significant only at 5%, suggesting that there is a slightbias due to omitted variables, it becomes significant at the 0.1% level in Model 2. These tworesults confirm the idea that institutional factors in the host countries are good predictors ofstudents inflows.
Regarding educational costs, we choose to measure them by another variable than fees at des-tination for two reasons. Firstly, data on fees paid by mobile students vary across EU countriesand they are not available (Beine et al., 2014). Secondly, EMA2 programmes allow students tobe exempted from fees at destination. Against this background, we consider that there are othercosts incurred by students than direct costs like fees. Therefore, the Price Level Index is a proxyfor actual consumption expenses in host countries by using Purchasing Power Parity (PPP). Sincethey measure extra-costs that are embodied in educational costs, we expect this variable to havea negative e�ect on student flows. Surprisingly, the variable has a significant but positive e�ectwhen only economic and size factors are taken into account (Model 1). Conversely, it becomesinsignificant and negative when institutional factors are considered (Model 2). One possible reasonis that the Price Level Index captures quality and standard of living in the host country: quality inlife environment, good amenities or institutions (public administration or services, health, trans-port, etc.). When the model does not integrate such considerations, Price Level Index capturesall these e�ects. Since students are more sensitive to the quality dimension in host countries, thenthe variable of living cost is significant and positive in Model 1. In contrast, when quality consid-erations are integrated in Model 2, the Price Level Index is no longer a proxy of “host” quality
17
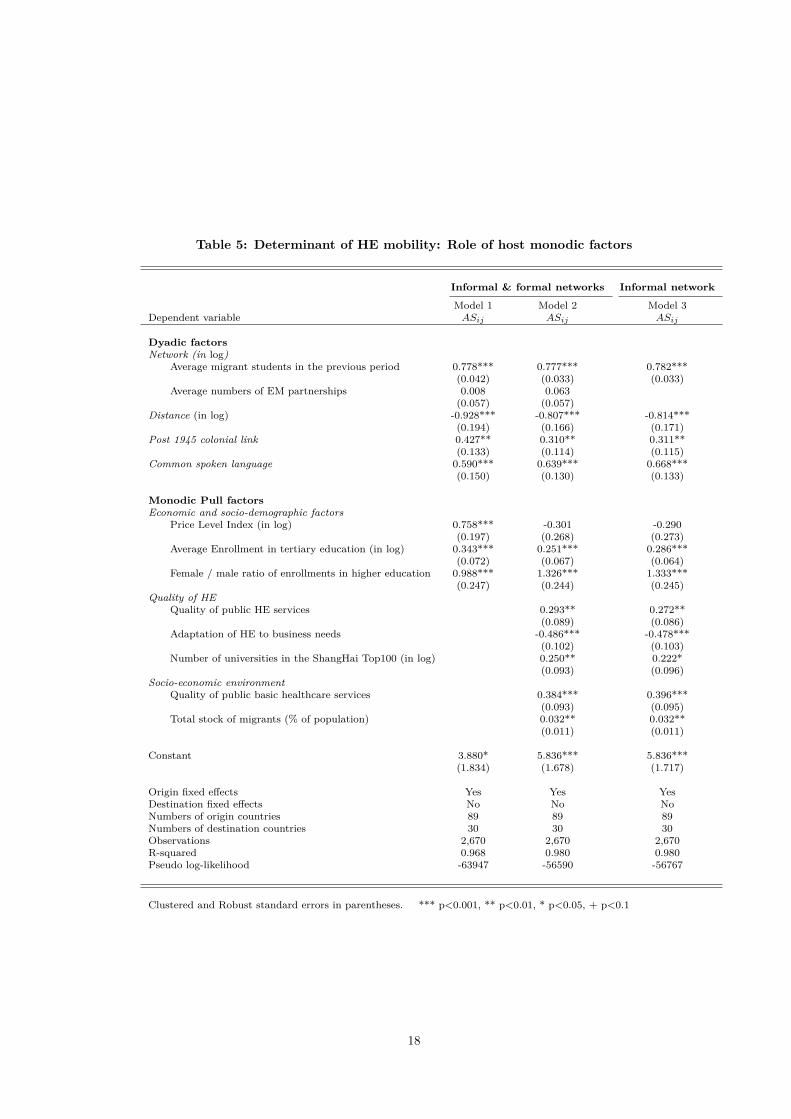
Table 5: Determinant of HE mobility: Role of host monodic factors
Informal & formal networks Informal networkModel 1 Model 2 Model 3
Dependent variable ASij ASij ASij
Dyadic factorsNetwork (in log)
Average migrant students in the previous period 0.778*** 0.777*** 0.782***(0.042) (0.033) (0.033)
Average numbers of EM partnerships 0.008 0.063(0.057) (0.057)
Distance (in log) -0.928*** -0.807*** -0.814***(0.194) (0.166) (0.171)
Post 1945 colonial link 0.427** 0.310** 0.311**(0.133) (0.114) (0.115)
Common spoken language 0.590*** 0.639*** 0.668***(0.150) (0.130) (0.133)
Monodic Pull factorsEconomic and socio-demographic factors
Price Level Index (in log) 0.758*** -0.301 -0.290(0.197) (0.268) (0.273)
Average Enrollment in tertiary education (in log) 0.343*** 0.251*** 0.286***(0.072) (0.067) (0.064)
Female / male ratio of enrollments in higher education 0.988*** 1.326*** 1.333***(0.247) (0.244) (0.245)
Quality of HEQuality of public HE services 0.293** 0.272**
(0.089) (0.086)Adaptation of HE to business needs -0.486*** -0.478***
(0.102) (0.103)Number of universities in the ShangHai Top100 (in log) 0.250** 0.222*
(0.093) (0.096)Socio-economic environment
Quality of public basic healthcare services 0.384*** 0.396***(0.093) (0.095)
Total stock of migrants (% of population) 0.032** 0.032**(0.011) (0.011)
Constant 3.880* 5.836*** 5.836***(1.834) (1.678) (1.717)
Origin fixed e�ects Yes Yes YesDestination fixed e�ects No No NoNumbers of origin countries 89 89 89Numbers of destination countries 30 30 30Observations 2,670 2,670 2,670R-squared 0.968 0.980 0.980Pseudo log-likelihood -63947 -56590 -56767
Clustered and Robust standard errors in parentheses. *** p<0.001, ** p<0.01, * p<0.05, + p<0.1
18
but only gives to students a consumption perspective. Therefore, the coe�cient which is associ-ated becomes negative but insignificant, suggesting that the institutional quality in host countriesdetermines student flows more strongly than living costs.
Concerning socio-demographic variables, the Enrollments variable has a highly significant andpositive e�ect: the higher the number of enrolled students at destination, the bigger the number ofstudent inflows. Our finding provides two pieces of information on international student mobility.Firstly, from the point of view of host countries, a positive sign means that the country sizeis a determining factor in the absorptive capacity of student inflows coming from abroad. Thelarger the host country, the bigger the tertiary education system will be and the more studentsit can receive. Secondly, from the point of view of internationally mobile students, the size ofthe host capacity a�ects positively location choices in the fact that positive e�ects of studentagglomeration outweigh negative e�ects of congestion. Like informal networks, concentration ofstudents benefits to new entrants through easier access to information and lower indirect costs ofmobility. Moreover, student “clustering” favors the development of facilities and infrastructure closeto universities (transportation, restoration, housing, culture, leisure, etc.) and whose advantagesseem to influence destination choices.
Similarly, Female / male ratio allows us to consider gender aspects. The coe�cient has apositive and significant e�ect: the more host universities will be feminized, the more studentscoming from LMI countries will be attracted. This positive role of gender can influence destinationchoices of female students from home countries.
In addition to the quality dimension already highlighted on the push side, we add here univer-sities ranking on the pull side. Such rankings are well known from students who have to chooseamong destination countries. The Quality of public HE services and the Number of universitiesin the Shanghai Top100 both provide quality considerations. The former variable is an indicatorof intrinsic quality of HEIs while the latter variable measures the role of extrinsic quality, i.e.reputation e�ects transmitted by the various international rankings whose Shanghai ranking isundoubtedly the best known. These two variables are positive and significant at 1%, implying thatstudents from LMI countries are more sensitive to the quality dimension in host countries them athome. On the opposite, the variable about Adaptation of HE to business needs has a significantbut negative e�ect on inflows of students. This may be related to their expectations about specificknowledge. Since internationally mobile students are not destined to stay at destination to get ajob after graduation, it is not surprising that they do not consider the HE programmes which areadapted to the local characteristics. On the contrary, they choose theoretical and technical courseswhose contents are easily exported at home.
Notice that comparison between Models 2 and 3 makes it possible to understand pull factorsin the specific inflows of students through informal networks or alternatively, the relevant outcomeowing to formal partnerships. We note that the only change occurs in the Number of universitiesin the ShangHai Top100 whose significance increases from the 5% level (Model 3) to the 1%level (Model 2). Given that more and more institutions are integrating formal networks likeEMA2 programmes, reputation e�ects become of high concern in internationalization of HE fortwo reasons: (i) reputation resulting from this type of ranking allows the students to prioritize thedi�erent formal networks at disposal, (ii) since formal networks are levers of reputation, countriesthat previously enjoyed high visibility from students are now forced to reinforce the impact ofrankings to keep their reputation advantages.
Finally, socio-economic environment is taken into account. The Quality of public basic health-care services provides information about public facilities and social insurance available to migrantstudents. We find a significant and positive e�ect of this variable: students are likely to move tocountries with relatively good public facilities. While this suggests a controversial “welfare mag-net” hypothesis in the economics of immigration (i.e. migrants are attracted to destinations basedon the generosity of public assistance programmes), our investigation with alternative variablesshows that it is not true for internationally mobile students (no significance in the share of GDPof public assistance programme, public expenditures). Moreover, two other reasons may explainthis positive relationship: this variable plays as a pull factor because it allows students to reduceuncertainty about their prospects abroad, and it reflects better amenities in the destination coun-try. The project of studying overseas is uncertain and risky, and individuals engaging in educationinvestment must take into consideration the probability that the mobility project could fail.
19
Immigration policies in host countries inevitably influence the entry of migrants into the Eu-ropean territories. So, the Total stock of migrants provides the migration climate in destinationcountries. It has another meaning than in Beine et al. (2014) where migrants are consideredthrough a dyadic variable as a form of network. Here, we consider the total stock of migrants,regardless of the country of origin, expressed in relation to the population in the host countries.Consequently, the positive sign and the significance at 1% of this variable indicate the existenceof a “welcoming land” e�ect. This positively a�ects international flows of students in two ways.Firstly, a high percentage of migrants suggests the existence of migratory facilities and generouspolicies towards immigrants, both in terms of administrative constraints and of acceptance of mi-grants by the rest of the population. Secondly, a favorable migration climate raises benefits ofnetworks between migrants while reducing the costs of mobility (Beine et al., 2011, 2014; Bertoliand Fernández-Huertas Moraga, 2013). The fact that di�erent specifications on networking (Model3) are not a�ected by Total stock of migrants suggests that this is the first e�ect that prevails inour model (Model 3). Like Enrollments, the Total stock of migrants gives the absorptive capac-ity of migrants, and among them international students. The more host countries are able toaccommodate migrants, the more they attract students.
4.3. Combined push and pull factorsWe now analyze the complete model by removing country dummies at both sides. Interac-
tions between push and pull factors will allow us to determine the demand for HE mobility fromdeveloping countries to Europe. Results are reported in Table 6.
Looking at the dyadic factors, the elasticity of informal network remains high even when wecapture the role of factors that are origin and destination specific. Besides that, Post-coloniallink becomes insignificant in comparison to Table 5: in other words, historical ties (and sharedlanguage) do not explain (or less) inflows of students when home dummies are removed. At firstglance, many countries control students? abilities before their entry, in particular linguistic skills.For example, it is the case for all countries in the Erasmus Mundus programme or also whena student applies for tertiary enrollment in France through Campus France. However, it is lesssignificant when other considerations at home and in destination are taken into account.
Moving to the country-specific factors, previous results are majorly reinforced but with someexceptions. Firstly, economic and socio-demographic factors both at home and in destination a�ectsignificantly HE mobility. While GDP per capita at the origin is still significant but at a lessermagnitude, the circular e�ect in origin countries becomes significant at 5% level when both formaland informal networks are under consideration. On the host side, living costs (proxied by theprice index) becomes significant, predicting that international students are less likely to move toareas with a high cost of living. Interestingly, the elasticity of gender is reinforced while the hostcapacity e�ect shows the opposite, whether we consider informal networks or both formal andinformal. Enrollments in tertiary education at both side reflect clearly a “youth bulge” (or cohorte�ect) in developing source countries which matches a size or capacity e�ect in host Europeancountries.
Secondly, qualitative information on political institutions, social cohesion and quality still mat-ter, and they even gain in importance. In sending countries for example, Irregularities in obtaininguniversity degrees push even further students to becoming mobile internationally. In receivingcountries, both indicators of quality and socio-economic environment show greater elasticity, what-ever the specification of networking. Interestingly, universities ranking becomes less significant inexplaining HE mobility compared to Table 5. On the opposite, quality of public HE and basichealthcare services appear to be important pull factors in our sample of European countries: theavailability and quality of public services a�ect whether people move there. Finally, the elasticityof the Stock of migrants is also higher in the complete model, whatever the networks. This pullfactor is highly significant in influencing student inflows: it provides a signal to potential migrantsabout relative conditions in a destination and, by a cumulative causation e�ect, some of the mostimmigrant-intensive countries turn out to become well-known immigrant destinations, includingfor internationally mobile students.
20
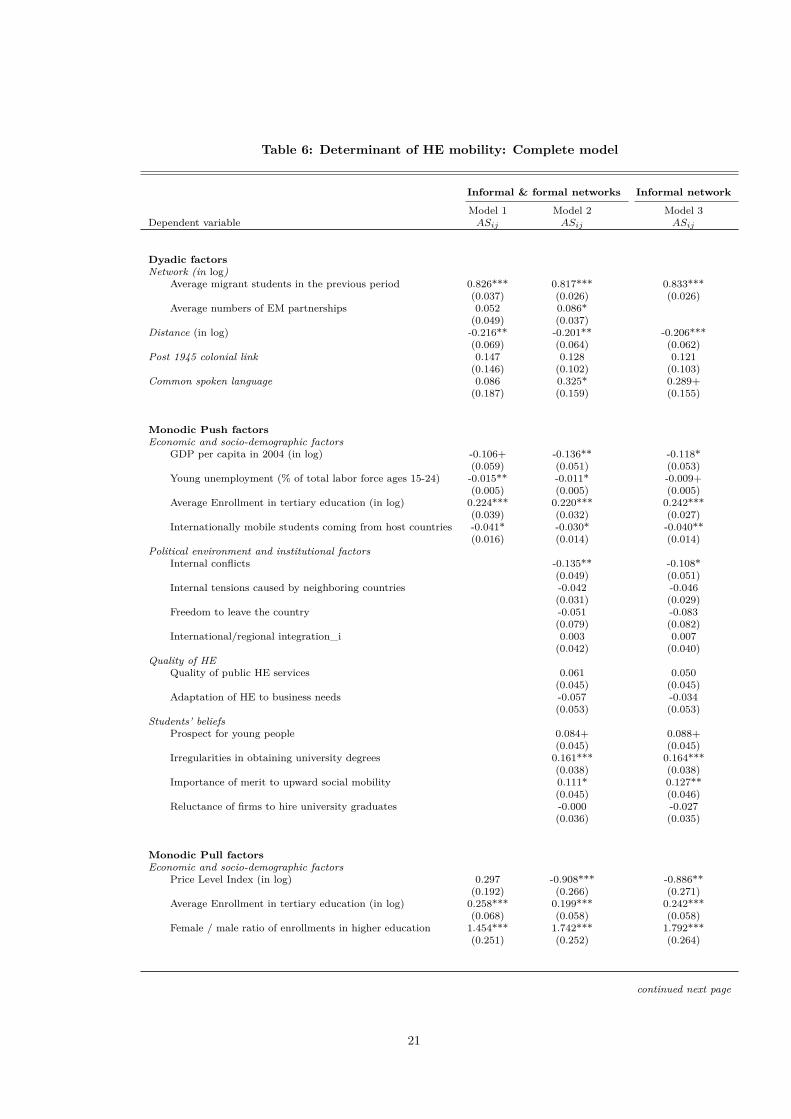
Table 6: Determinant of HE mobility: Complete model
Informal & formal networks Informal networkModel 1 Model 2 Model 3
Dependent variable ASij ASij ASij
Dyadic factorsNetwork (in log)
Average migrant students in the previous period 0.826*** 0.817*** 0.833***(0.037) (0.026) (0.026)
Average numbers of EM partnerships 0.052 0.086*(0.049) (0.037)
Distance (in log) -0.216** -0.201** -0.206***(0.069) (0.064) (0.062)
Post 1945 colonial link 0.147 0.128 0.121(0.146) (0.102) (0.103)
Common spoken language 0.086 0.325* 0.289+(0.187) (0.159) (0.155)
Monodic Push factorsEconomic and socio-demographic factors
GDP per capita in 2004 (in log) -0.106+ -0.136** -0.118*(0.059) (0.051) (0.053)
Young unemployment (% of total labor force ages 15-24) -0.015** -0.011* -0.009+(0.005) (0.005) (0.005)
Average Enrollment in tertiary education (in log) 0.224*** 0.220*** 0.242***(0.039) (0.032) (0.027)
Internationally mobile students coming from host countries -0.041* -0.030* -0.040**(0.016) (0.014) (0.014)
Political environment and institutional factorsInternal conflicts -0.135** -0.108*
(0.049) (0.051)Internal tensions caused by neighboring countries -0.042 -0.046
(0.031) (0.029)Freedom to leave the country -0.051 -0.083
(0.079) (0.082)International/regional integration_i 0.003 0.007
(0.042) (0.040)Quality of HE
Quality of public HE services 0.061 0.050(0.045) (0.045)
Adaptation of HE to business needs -0.057 -0.034(0.053) (0.053)
Students’ beliefsProspect for young people 0.084+ 0.088+
(0.045) (0.045)Irregularities in obtaining university degrees 0.161*** 0.164***
(0.038) (0.038)Importance of merit to upward social mobility 0.111* 0.127**
(0.045) (0.046)Reluctance of firms to hire university graduates -0.000 -0.027
(0.036) (0.035)
Monodic Pull factorsEconomic and socio-demographic factors
Price Level Index (in log) 0.297 -0.908*** -0.886**(0.192) (0.266) (0.271)
Average Enrollment in tertiary education (in log) 0.258*** 0.199*** 0.242***(0.068) (0.058) (0.058)
Female / male ratio of enrollments in higher education 1.454*** 1.742*** 1.792***(0.251) (0.252) (0.264)
continued next page
21
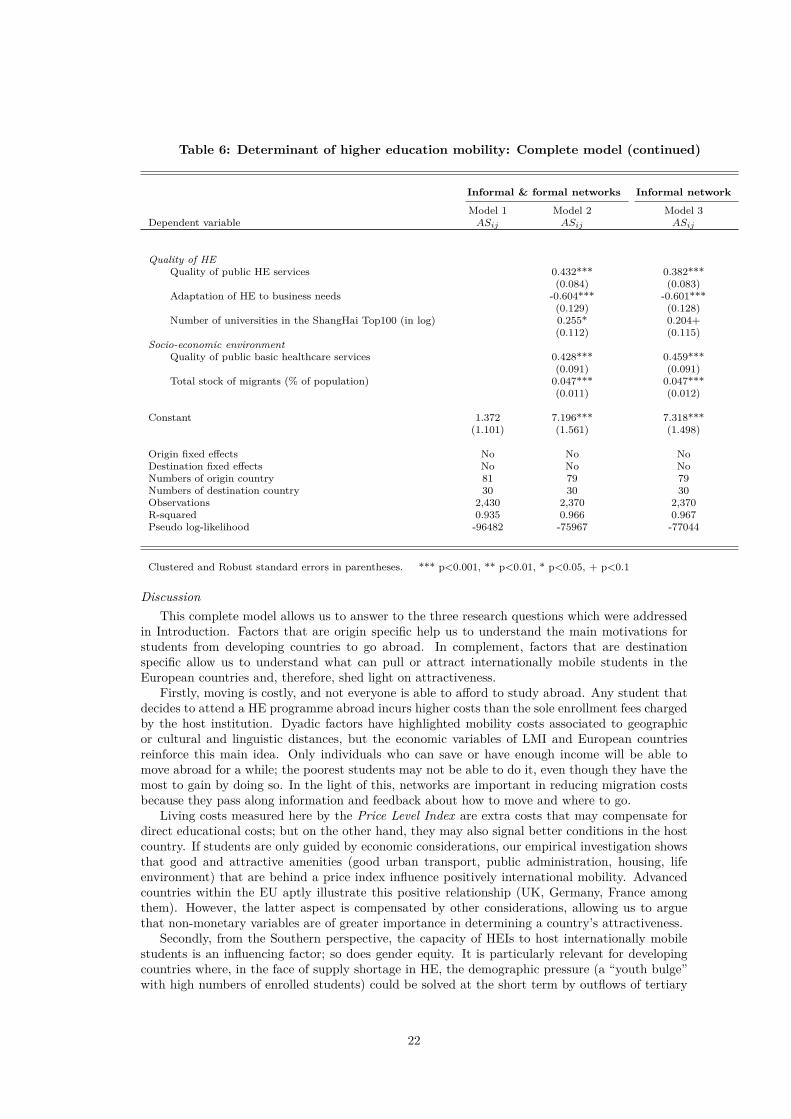
Table 6: Determinant of higher education mobility: Complete model (continued)
Informal & formal networks Informal networkModel 1 Model 2 Model 3
Dependent variable ASij ASij ASij
Quality of HEQuality of public HE services 0.432*** 0.382***
(0.084) (0.083)Adaptation of HE to business needs -0.604*** -0.601***
(0.129) (0.128)Number of universities in the ShangHai Top100 (in log) 0.255* 0.204+
(0.112) (0.115)Socio-economic environment
Quality of public basic healthcare services 0.428*** 0.459***(0.091) (0.091)
Total stock of migrants (% of population) 0.047*** 0.047***(0.011) (0.012)
Constant 1.372 7.196*** 7.318***(1.101) (1.561) (1.498)
Origin fixed e�ects No No NoDestination fixed e�ects No No NoNumbers of origin country 81 79 79Numbers of destination country 30 30 30Observations 2,430 2,370 2,370R-squared 0.935 0.966 0.967Pseudo log-likelihood -96482 -75967 -77044
Clustered and Robust standard errors in parentheses. *** p<0.001, ** p<0.01, * p<0.05, + p<0.1
DiscussionThis complete model allows us to answer to the three research questions which were addressed
in Introduction. Factors that are origin specific help us to understand the main motivations forstudents from developing countries to go abroad. In complement, factors that are destinationspecific allow us to understand what can pull or attract internationally mobile students in theEuropean countries and, therefore, shed light on attractiveness.
Firstly, moving is costly, and not everyone is able to a�ord to study abroad. Any student thatdecides to attend a HE programme abroad incurs higher costs than the sole enrollment fees chargedby the host institution. Dyadic factors have highlighted mobility costs associated to geographicor cultural and linguistic distances, but the economic variables of LMI and European countriesreinforce this main idea. Only individuals who can save or have enough income will be able tomove abroad for a while; the poorest students may not be able to do it, even though they have themost to gain by doing so. In the light of this, networks are important in reducing migration costsbecause they pass along information and feedback about how to move and where to go.
Living costs measured here by the Price Level Index are extra costs that may compensate fordirect educational costs; but on the other hand, they may also signal better conditions in the hostcountry. If students are only guided by economic considerations, our empirical investigation showsthat good and attractive amenities (good urban transport, public administration, housing, lifeenvironment) that are behind a price index influence positively international mobility. Advancedcountries within the EU aptly illustrate this positive relationship (UK, Germany, France amongthem). However, the latter aspect is compensated by other considerations, allowing us to arguethat non-monetary variables are of greater importance in determining a country’s attractiveness.
Secondly, from the Southern perspective, the capacity of HEIs to host internationally mobilestudents is an influencing factor; so does gender equity. It is particularly relevant for developingcountries where, in the face of supply shortage in HE, the demographic pressure (a “youth bulge”with high numbers of enrolled students) could be solved at the short term by outflows of tertiary
22
level students. In turn, the circular flow of students may help to build learning capacity in theorigin country, contributing to increase stayers through brain gain.
Thirdly, consistent with Van Bouwel and Veugelers (2013), our study finds that internationallymobile students are more sensitive to the quality dimension in host countries, but specifically inthe signaling perspective to education. Indeed, high-quality institutions with good services and“prestige” will attract students. In contrast, the extent to which HE are adapted to business needsin the host country does not attract them. This finding supports the investment perspective of HE:students from LMI countries are not influenced by the employability of hosting HE programmes,but only by their learning capacity.
Lastly, migration climate, as well as good amenities (availability and quality of healthcare orother public services), are positive pull factors of internationally mobile students. This result maysupport a “cumulative causation” of migration which implies controversial policy recommendations.On one hand, people who oppose immigration may find here relevant arguments for imposingrestrictions on entries. But on the other hand, one may counter-argue that our targets here areimmigrants who are skilled people staying to study for a while and therefore, they do not haveany permanent influence on the host countries. In fact, countries in the EU have already relativelystrict policies for immigration by non-EU citizens. Therefore, transnational cooperation based oninstitutional partnership is already a way to control for admission policies, i.e. immigration policies.Moreover, our paper finds strong evidence of network e�ects in migrating, particularly of informalor social ties in assisting students outflows. However, migration incentives become endogenous oncenetwork e�ects are introduced (Docquier and Sekkat, 2006). Those legal temporary migrants areonly one group of immigrants and further restrictions on their entries may even create a counter-productive e�ect. Indeed, restrictive immigration policies, by raising quality and availability inpublic HE services make this pull factor even stronger (the destination country becomes moreattractive), thereby developing the e�ect of networks in determining student inflows.
5. Conclusion and remarks
Migration is a feature of the ongoing globalization process, but the profile of migrant populationsvaries considerably depending on the variety of sources of migration. In this paper, we haveanalyzed the determinants of demand for HE mobility of students from low- and middle-incomecountries to Europe over the period 2004-2013. The main finding of existing studies on the topicis that student mobility is governed by geographic and cultural distances, as emphasized in usualgravity empirics. However, our study highlights other factors which influence the choice of HE fromdi�erent perspectives: either in multilateral resistance to migration or in country-specific factors.
In comparison to the existing studies, our empirical investigation attempts to better under-stand multilateral resistance by highlighting two aspects. First, the literature on foreign languageskills majorly uses a single measure of linguistic relationship. However, it may not reflect the diversesources of linguistic influence on student mobility. Similarly, most studies on the topic considernetworking either by using total migrant stocks from the origin living at destination or memberstates of Bologna Process. Our study attempts to fill the gap by comparing di�erent measures ofnetworks which are of growing interest in developing countries: on the one hand, informal networkcoming from friendship and social interactions with former students and on the other hand, formalpartnerships between HEIs. In this context, the Erasmus Mundus programme (EMA2) is oneamong many instruments which are dedicated to control or choose migrants. This explains therapid development of these programmes and why it has gradually become the only opportunity forstudents to enter the destination country.
Our findings on dyadic resistance to migration show a positive impact from linguistic relationsand networks e�ects which lower mobility costs when a student has to consider enrollment abroad.Particularly, CSL is the most important linguistic resistance to student mobility. This result canbe put into a double perspective: of language skills level in origin countries and of restrictiveadmission conditions for candidates in host countries, and more precisely of the selection thattakes place before student move.
On the other side, we have shown that the Average number of migrant students in the previousperiod is a good proxy for informal networks. The elasticity of this variable appears to be high,meaning that feedback from former migrant students turns out to have important contribution
23
in reducing multilateral resistance to student mobility. Lastly, a measure of formal networks bythe number of Erasmus Mundus partnerships between sending and receiving countries has beenproposed. We consider that these formal networks will take growing importance in the distributionof student inflows as they constitute an immigration policy that allows only international studentswith some education or linguistic skills requirements to be eligible. It is the reason why the variableis sensitive to linguistic variables or Colonial link, that are themselves at the heart of immigrationpolicy. As expected, Distance and Colonial link have significant e�ects, but lower than thoseusually accepted in the economic literature.
Once we have examined the dyadic factors, this paper moves on to analyze country-specificfactors at origin (push factors) and at destination (pull factors).
By focusing on the role of di�erent monodic home factors in HE mobility, we make an im-portant contribution to the literature. Overall, both institutional and economic factors appear tobe important push factors in our country sample of developing countries. Most existing studiesaddress the role of access to educational opportunities at home to control for the possibility thatstudents are forced to seek HE overseas. In our paper, such educational opportunities are capturedat macroeconomic level by income at home, the number of Internationally mobile students comingfrom host countries, Enrollments in tertiary education. Moreover, we have also investigated otherinstitutional factors and students? beliefs. In addition to the cohort e�ect, it appears that disap-pointing perception on universities degrees or di�culty to gain merit at home push students intobecoming mobile. In other words, qualitative and direct information on the “de facto” outcome ofrules, public institutions or service delivery strongly influence HE mobility.
Factors that are destination specific allow us to understand what can pull or attract interna-tionally mobile students in the European countries and, therefore, suggest some policy implicationsin terms of attractiveness. Our results show that students are guided by economic considerationslike living costs. However, the latter aspect is compensated by other considerations, allowing usto argue that non-monetary variables are of greater importance in determining a country’s attrac-tiveness.
Assuming that the number of enrollments in HE is a proxy for the host capacity, we foundthat it is a pull factor. Gender aspects also explain student inflows from developing countries, aswell as quality in public HE and basic healthcare services. Attractive amenities appear to be animportant pull factor in our sample of European countries: the availability and quality of publicservices a�ect whether people move there.
Stock of migrants is a good predictor of student inflows (and immigration flows in general),enabling some studies to talk about cumulative causation of migration. Out of describing a net-work e�ect, it signals to potential migrants about relative conditions in migratory facilities, lifeenvironment in destination countries. In the face of such cumulative causation, European countriesmay become sensitive to the ongoing debate on immigration restrictions. Our paper provides cross-sectional evidence that students who are “socially” connected either informally (with their friends,diasporas or former students enrolled abroad) or formally (through institutional partnerships be-tween their HEIs) are more prone to leave their country of origin. Understanding these impacts isimportant if EU countries want to usefully debate the role of migration as a part of globalizationprocess. Migration is not only driven by workforce needs. In particular, the EMA2 programmecould be used as a tool to shape the characteristics of student inflows through admission or eli-gibility criteria. In the face of global competition, the ability of a country to attract talent fromaround the world enhance local human capital; but such discrimination among students migrants(when immigration policies are coupled with quality selective criteria) may raise legal and moraldoubts. More interestingly, the European countries could promote transnational cooperation in amore “brain circulation” perspective. Network e�ects coupled with outflow of students and sta�in destination to non-EU countries help to develop local learning and teaching capacities whilealleviating students exit. Such debates are essential to designing policies in areas like HE.
References
Appelt, S., van Beuzekom, B., Galindo-Rueda, F., and de Pinho, R. (2015). Which factors influ-ence the international mobility of research scientists? OECD Science, Technology and IndustryWorking Papers, 2015/02.
24
Bansak, C., Simpson, N. B., and Zavodny, M. (2015). The Economics of Immigration. Routledge,2015th edition.
Beech, S. E. (2015). International student mobility: the role of social networks. Social & CulturalGeography, 16(3):332–350.
Beine, M., Bertoli, S., and Fernández-Huertas Moraga, J. (2016). A practitioners’ guide to gravitymodels of international migration. The World Economy, 39(4):496–512.
Beine, M., Docquier, F., and Ozden, C. (2011). Diasporas. Journal of Development Economics,95(1):30 – 41. Symposium on Globalization and Brain Drain.
Beine, M., Noel, R., and Ragot, L. (2013). The determinants of international mobility of students.Working Papers 2013-30, CEPII.
Beine, M., Noel, R., and Ragot, L. (2014). Determinants of the international mobility of students.Economics of Education Review, 41:40 – 54.
Bertoli, S. and Fernández-Huertas Moraga, J. (2013). Multilateral resistance to migration. Journalof Development Economics, 102:79 – 100. Migration and Development.
Bertoli, S. and Fernández-Huertas Moraga, J. (2015). The size of the cli� at the border. RegionalScience and Urban Economics, 51:1 – 6.
Brooks, R. and Waters, J. (2010). Social networks and educational mobility: the experiences of ukstudents. Globalisation, Societies and Education, 8(1):143–157.
Clark, X., Hatton, T. J., and Williamson, J. G. (2007). Explaining u.s. immigration, 1971-1998.Review of Economics and Statistics, 89(2):359 – 373.
Coniglio and Kondoh (2015). International integration with heterogeneous immigration policies.International Economics, 142:15–31.
Docquier, F. and Sekkat, K. (2006). The Brain Drain : What do we know? Number 31 in AFDWorking Paper. Agence Française du Développement.
Grogger, J. and Hanson, G. H. (2011). Income maximization and the selection and sorting ofinternational migrants. Journal of Development Economics, 95(1):42 – 57. Symposium onGlobalization and Brain Drain.
Hatton, T. J. and Williamson, J. G. (2005). What fundamentals drive world migration? In Borjas,G. J. and Crsp, J., editors, Poverty, International Migration and Asylum. Palgrave Macmilla,Hampshire, UK.
Head, K., Mayer, T., and Ries, J. (2010). The erosion of colonial trade linkages after independence.Journal of International Economics, 81(1):1 – 14.
Mayda, A. M. (2010). International migration: a panel data analysis of the determinants of bilateralflows. Journal of Population Economics, 23(4):1249–1274.
Mazzarol, T. and Soutar, G. N. (2002). Push-pull factors influencing international student desti-nation choice. International Journal of Educational Management, 16(2):82–90.
Melitz, J. and Toubal, F. (2014). Native language, spoken language, translation and trade. Journalof International Economics, 93(2):351 – 363.
Melitz, J. and Toubal, F. (2016). Faut-il parler la même langue pour commercer? La lettre duCEPII, (361).
Naidoo, V. (2007). Research on the flow of international students to uk universities: Determinantsand implications. Journal of Research in International Education, 6(3):287–307.
25
OECD (2009). Higher Education to 2030, Vol 2. Globalisation. Centre for Education Research andInnovation.
Ortega, F. and Peri, G. (2013). The e�ect of income and immigration policies on internationalmigration. Migration Studies, 1(1):47–74.
Pedersen, P. J., Pytlikova, M., and Smith, N. (2008). Selection and network e�ects-migration flowsinto {OECD} countries 1990-2000. European Economic Review, 52(7):1160 – 1186.
Pedro, E. and Franco, M. (2016). The importance of networks in the transnational mobility ofhigher education students: attraction and satisfaction of foreign mobility students at a publicuniversity. Studies in Higher Education, 41(9):1627–1655.
Rodriguez Gonzalez, C., Bustillo Mesanza, R., and Mariel, P. (2011). The determinants of interna-tional student mobility flows: an empirical study on the erasmus programme. Higher Education,62(4):413 – 430.
Shepherd, B. (2012). The Gravity Model of International Trade: A User Guide. Number BRR11in ARTNeT Books and Research Reports. United Nations Economic and Social Commission forAsia and the Pacific (ESCAP).
Shields, R. (2013). Globalization and international student mobility: A network analysis. Com-parative Education Review, 57(4):609–636.
Silva, J. a. S. and Tenreyro, S. (2006). The log of gravity. The Review of Economics and Statistics,88(4):641–658.
Van Bouwel, L. and Veugelers, R. (2013). The determinants of student mobility in europe: thequality dimension. European Journal of Higher Education, 3(2):172–190.
van der Wendet, M. (2015). International academic mobility: Towards a concentration of the mindsin europe. Research & Occasional Paper Series, CSHE.3.14.
Vogtle, E. M. and Windzio, M. (2016). Networks of international student mobility: enlargementand consolidation of the european transnational education space? Higher Education, 72(6):723–741.
26
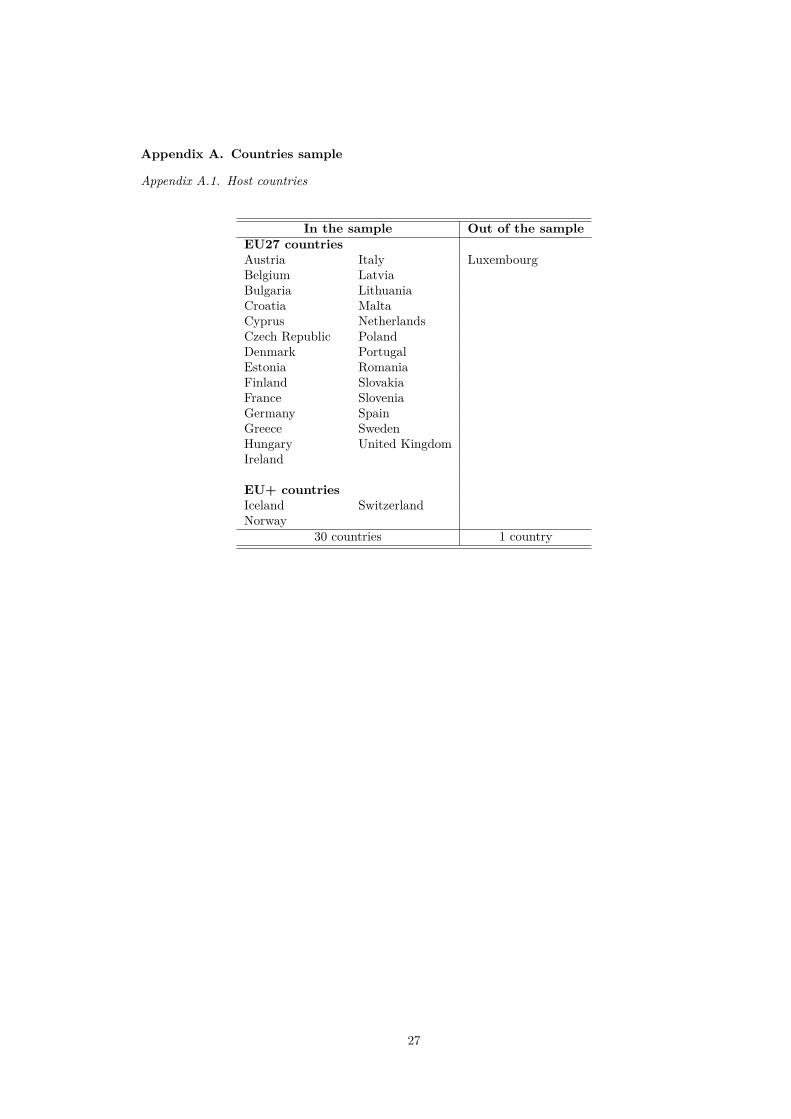
Appendix A. Countries sample
Appendix A.1. Host countries
In the sample Out of the sampleEU27 countriesAustria Italy LuxembourgBelgium LatviaBulgaria LithuaniaCroatia MaltaCyprus NetherlandsCzech Republic PolandDenmark PortugalEstonia RomaniaFinland SlovakiaFrance SloveniaGermany SpainGreece SwedenHungary United KingdomIreland
EU+ countriesIceland SwitzerlandNorway
30 countries 1 country
27
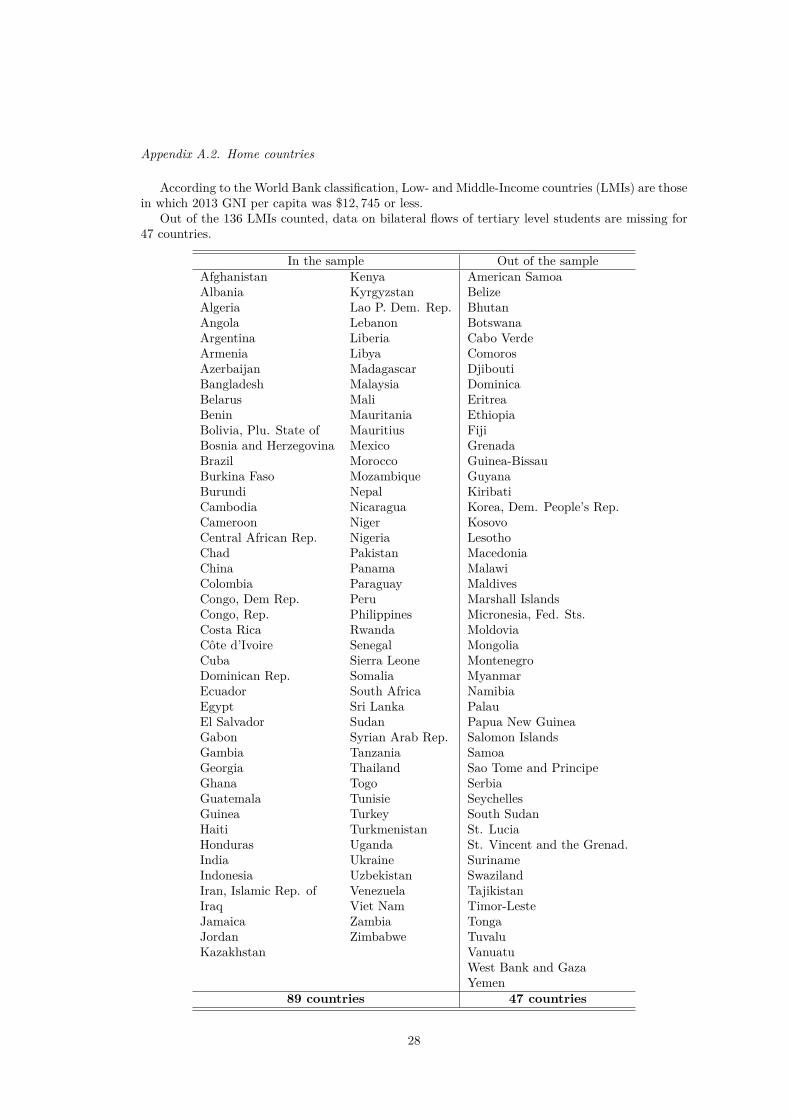
Appendix A.2. Home countries
According to the World Bank classification, Low- and Middle-Income countries (LMIs) are thosein which 2013 GNI per capita was $12, 745 or less.
Out of the 136 LMIs counted, data on bilateral flows of tertiary level students are missing for47 countries.
In the sample Out of the sampleAfghanistan Kenya American SamoaAlbania Kyrgyzstan BelizeAlgeria Lao P. Dem. Rep. BhutanAngola Lebanon BotswanaArgentina Liberia Cabo VerdeArmenia Libya ComorosAzerbaijan Madagascar DjiboutiBangladesh Malaysia DominicaBelarus Mali EritreaBenin Mauritania EthiopiaBolivia, Plu. State of Mauritius FijiBosnia and Herzegovina Mexico GrenadaBrazil Morocco Guinea-BissauBurkina Faso Mozambique GuyanaBurundi Nepal KiribatiCambodia Nicaragua Korea, Dem. People’s Rep.Cameroon Niger KosovoCentral African Rep. Nigeria LesothoChad Pakistan MacedoniaChina Panama MalawiColombia Paraguay MaldivesCongo, Dem Rep. Peru Marshall IslandsCongo, Rep. Philippines Micronesia, Fed. Sts.Costa Rica Rwanda MoldoviaCôte d’Ivoire Senegal MongoliaCuba Sierra Leone MontenegroDominican Rep. Somalia MyanmarEcuador South Africa NamibiaEgypt Sri Lanka PalauEl Salvador Sudan Papua New GuineaGabon Syrian Arab Rep. Salomon IslandsGambia Tanzania SamoaGeorgia Thailand Sao Tome and PrincipeGhana Togo SerbiaGuatemala Tunisie SeychellesGuinea Turkey South SudanHaiti Turkmenistan St. LuciaHonduras Uganda St. Vincent and the Grenad.India Ukraine SurinameIndonesia Uzbekistan SwazilandIran, Islamic Rep. of Venezuela TajikistanIraq Viet Nam Timor-LesteJamaica Zambia TongaJordan Zimbabwe TuvaluKazakhstan Vanuatu
West Bank and GazaYemen
89 countries 47 countries
28
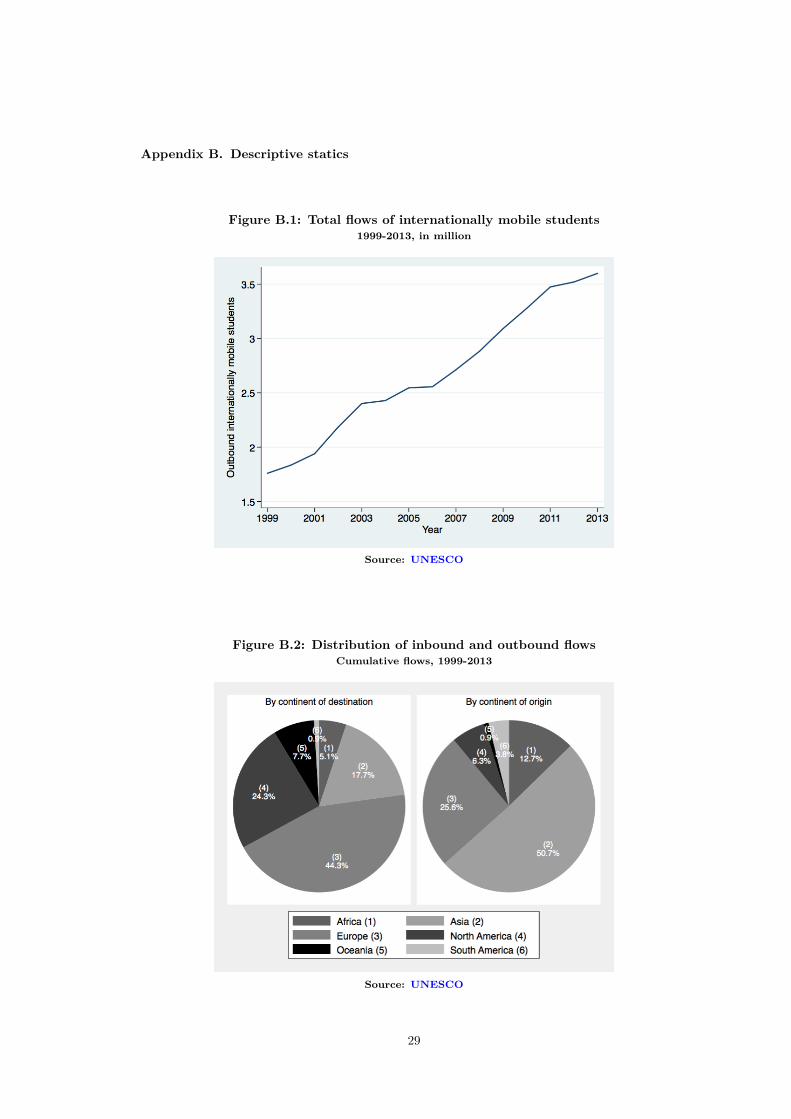
Appendix B. Descriptive statics
Figure B.1: Total flows of internationally mobile students1999-2013, in million
Source: UNESCO
Figure B.2: Distribution of inbound and outbound flowsCumulative flows, 1999-2013
Source: UNESCO
29
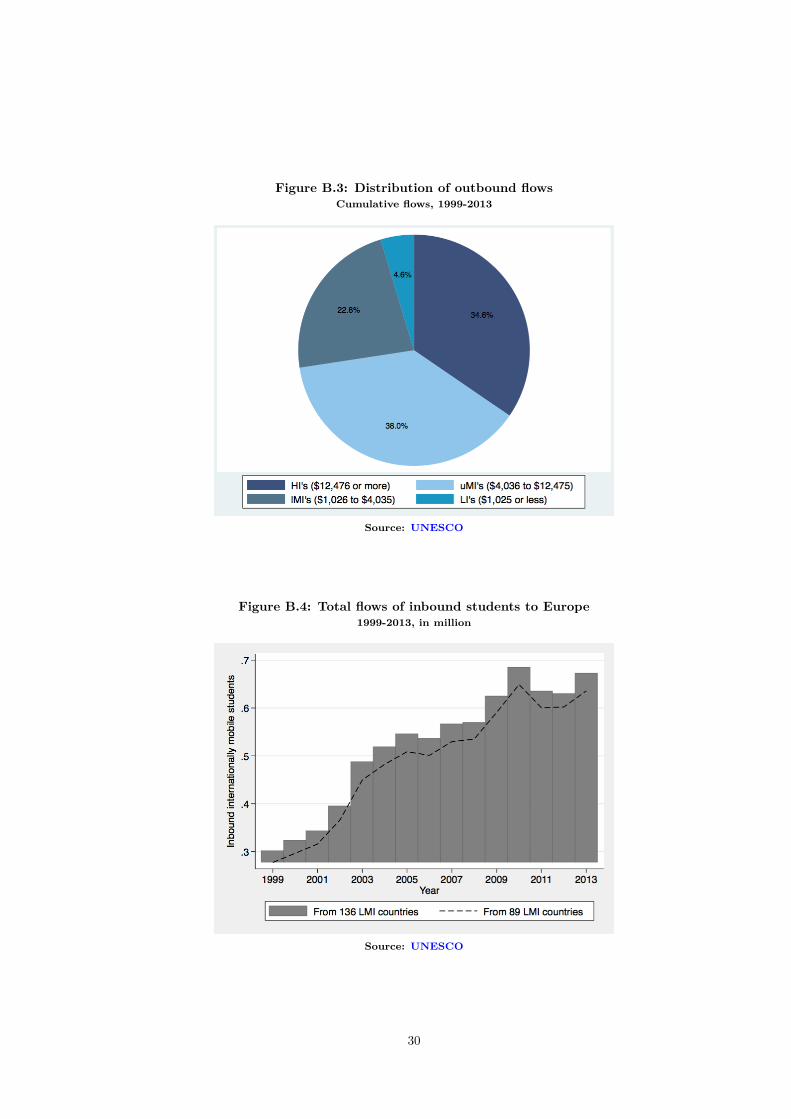
Figure B.3: Distribution of outbound flowsCumulative flows, 1999-2013
Source: UNESCO
Figure B.4: Total flows of inbound students to Europe1999-2013, in million
Source: UNESCO
30
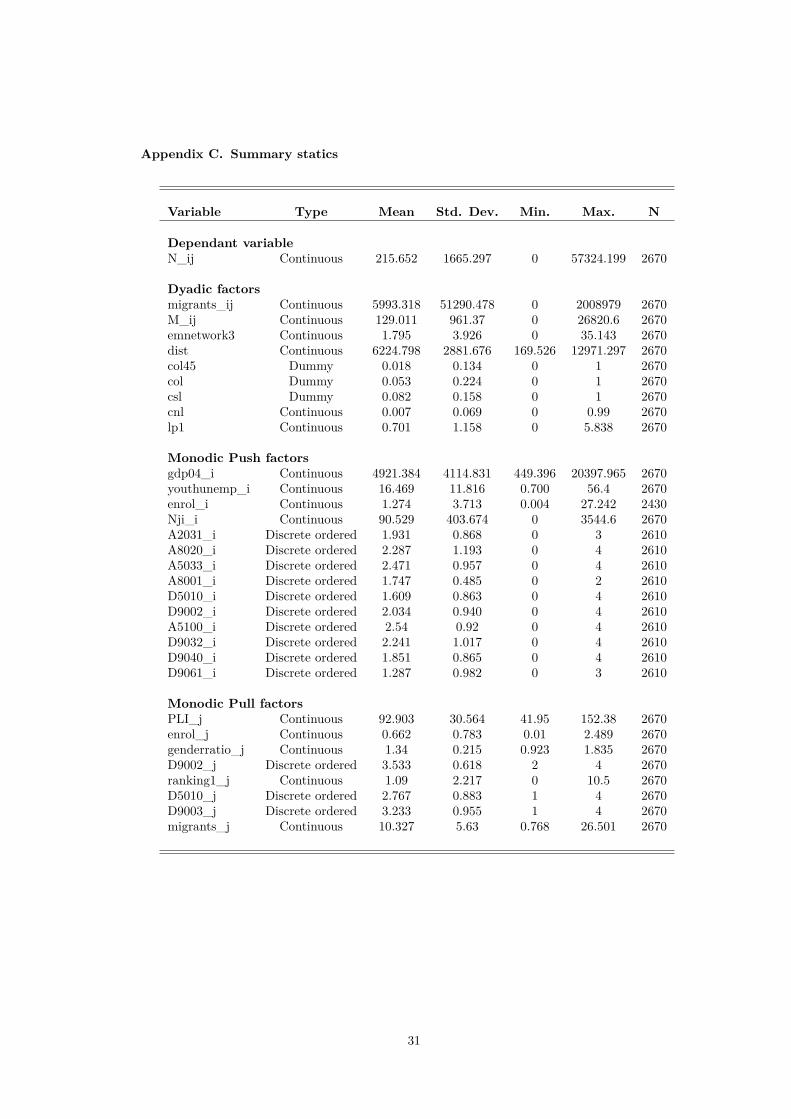
Appendix C. Summary statics
Variable Type Mean Std. Dev. Min. Max. N
Dependant variableN_ij Continuous 215.652 1665.297 0 57324.199 2670
Dyadic factorsmigrants_ij Continuous 5993.318 51290.478 0 2008979 2670M_ij Continuous 129.011 961.37 0 26820.6 2670emnetwork3 Continuous 1.795 3.926 0 35.143 2670dist Continuous 6224.798 2881.676 169.526 12971.297 2670col45 Dummy 0.018 0.134 0 1 2670col Dummy 0.053 0.224 0 1 2670csl Dummy 0.082 0.158 0 1 2670cnl Continuous 0.007 0.069 0 0.99 2670lp1 Continuous 0.701 1.158 0 5.838 2670
Monodic Push factorsgdp04_i Continuous 4921.384 4114.831 449.396 20397.965 2670youthunemp_i Continuous 16.469 11.816 0.700 56.4 2670enrol_i Continuous 1.274 3.713 0.004 27.242 2430Nji_i Continuous 90.529 403.674 0 3544.6 2670A2031_i Discrete ordered 1.931 0.868 0 3 2610A8020_i Discrete ordered 2.287 1.193 0 4 2610A5033_i Discrete ordered 2.471 0.957 0 4 2610A8001_i Discrete ordered 1.747 0.485 0 2 2610D5010_i Discrete ordered 1.609 0.863 0 4 2610D9002_i Discrete ordered 2.034 0.940 0 4 2610A5100_i Discrete ordered 2.54 0.92 0 4 2610D9032_i Discrete ordered 2.241 1.017 0 4 2610D9040_i Discrete ordered 1.851 0.865 0 4 2610D9061_i Discrete ordered 1.287 0.982 0 3 2610
Monodic Pull factorsPLI_j Continuous 92.903 30.564 41.95 152.38 2670enrol_j Continuous 0.662 0.783 0.01 2.489 2670genderratio_j Continuous 1.34 0.215 0.923 1.835 2670D9002_j Discrete ordered 3.533 0.618 2 4 2670ranking1_j Continuous 1.09 2.217 0 10.5 2670D5010_j Discrete ordered 2.767 0.883 1 4 2670D9003_j Discrete ordered 3.233 0.955 1 4 2670migrants_j Continuous 10.327 5.63 0.768 26.501 2670
31