Embed Size (px)
Citation preview

Fifth International Symposium on Marine Propulsors smp’17, Espoo, Finland, June 2017
Long Tunnel Configurations for High Efficiency Thrusters
Stefano Brizzolara1 & Enrico Bruno Brizzolara2
1Kevin T. Crofton Department of Aerospace and Ocean Engineering, Virginia Tech, Blacksburg, VA, USA
2Naval Architect and Marine Engineer, Independent Consultant, Genoa, Italy
ABSTRACT
The principal characteristics and hydrodynamic principles
of a new type of tunnel configuration designed to improve
the efficiency of long tunnel thrusters are presented. The
proposed tunnel configuration is composed of three
sections: a mid-section, having a smaller diameter, where
the impeller is running and two end-sections having a
larger diameter and transition piece. The hydrodynamic
advantages of the new technology are introduced by first
principles and then verified by a series of CFD
calculations, allowing detailed analysis of the flow field.
According current practice, installations with tunnel
length/diameter ratios greater than four are deliberately
avoided, resulting in oversized impeller designs. For a
given tunnel length, the new proposed configuration,
allows to design a smaller impeller which can meet and
overcome the efficiency of a larger impeller having the
ideal length/diameter ratio of 2~3. A series of alternative
configurations of the new proposed technology are
modeled and predicted thrust and efficiency are discussed.
Keywords
Tunnel thrusters, efficiency, CFD, ducted propellers.
1 INTRODUCTION
Tunnel Thrusters are very commonly used for station
keeping and low speed maneuvering in the bow and stern
of different types of vessels: from large ships to yachts and
working boats, from offshore floating platforms to
considerably smaller autonomous underwater vehicles. In
spite of their wide diffusion, the design of tunnel system
and its integration with the hull is still very empirical and
based on limited scientifically proven/verified data. In fact,
few systematic data have been published about the how the
tunnel geometric particulars may influence the
performance of the whole system, composed by the
impeller and duct system.
The extensive experimental systematic study conducted by
Mitsubishi (Taniguchi et al., 1966) remains one of the main
source of experimental data to estimate the effect of
different tunnel geometrical features, such as duct walls
inclination, convergent and divergent tunnel ends and
tunnel-end-wall fairings. The tests, though, regarded only
a limited number of geometrical variation of the tunnel
geometry. For instance, the maximum investigated tunnel
length to impeller diameter ratio is LD /D=3 and the tunnel
geometry investigation were done with a single fixed pitch
impeller geometry with a zero chord at tip, while most
modern thrusters use a Kaplan-like propeller with finite
(often maximum) chord at tip.
Figure 1 - Example of long bow tunnel thruster on a tanker
The importance of tunnel-end-wall fairing design in terms
of thrust augmentation was remarked by Ridley (1969) on
an actual bow thruster design for a bulk carrier, tested with
six different fairings. 16% thrust increase was achieved by
using rounded tunnel-end-wall fillet radius rf =0.2D with
respect to a right angle connection, at the same absorbed
power; 10% thrust augmentation factor was achieved with
conical fairing having 30deg average opening angle. A
comprehensive review of the duct design features was
given by Beveridge (1972), who added some interesting
data and new theoretical insight on the maximum ideal
efficiency attainable by ducted propellers, with and
without end diffusers.
Not much has been added to the state of the art in the field
since then. Moreover, all referenced experimental data are
relative to model scale. RANSE simulations have
demonstrated excellent accuracy (Yu and Yang, 2016) and
offer a unique opportunity to perform full scale parametric
predictions and investigations, overcoming the inherent
limitations of potential flow based methods, which are
valid tools for the design and analysis of the impeller (e.g.
Gaggero et al. 2009), but inappropriate to deal with viscous
flow physics that are primarily ruling the hydrodynamic
design of the duct.
From a design standpoint, tunnel thruster installations may
considerably differ in lengths, depending on the type of
hull and the location. This paper addresses installations
with long tunnel lengths L relative to the impeller diameter
D, i.e. L/D≥4, as in the example of Figure 1. As it will be
demonstrated, these types of installations are not so
uncommon and could be actually greater in number, since
often configuration with large L/D are deliberately
discarded in order to avoid the distributed losses in the long
tunnel. As a result, in ships with blunt bows, either large
tunnel and propeller diameters are used (with a general
increase of costs) or the location of the tunnel is moved
extremely close to the bottom or extreme bow with a
consequent loss of efficiency due to edge effects.
2 STEPPED LONG TUNNEL CONFIGURATION
Current design of tunnel thrusters and ducted propellers is
based on constant or continuously varying diameter of the
internal duct surface. According Brizzolara & Brizzolara
(2016) a new tunnel configuration that features a diameter
step (Figure 2) in introduced, in such a way that the internal
surfaces are composed of three sections: a mid section
(tunnel), having a smaller diameter D and a given length
LT, where the impeller is located, and two symmetric end
sections (in.large & out.large) having a length LL and a
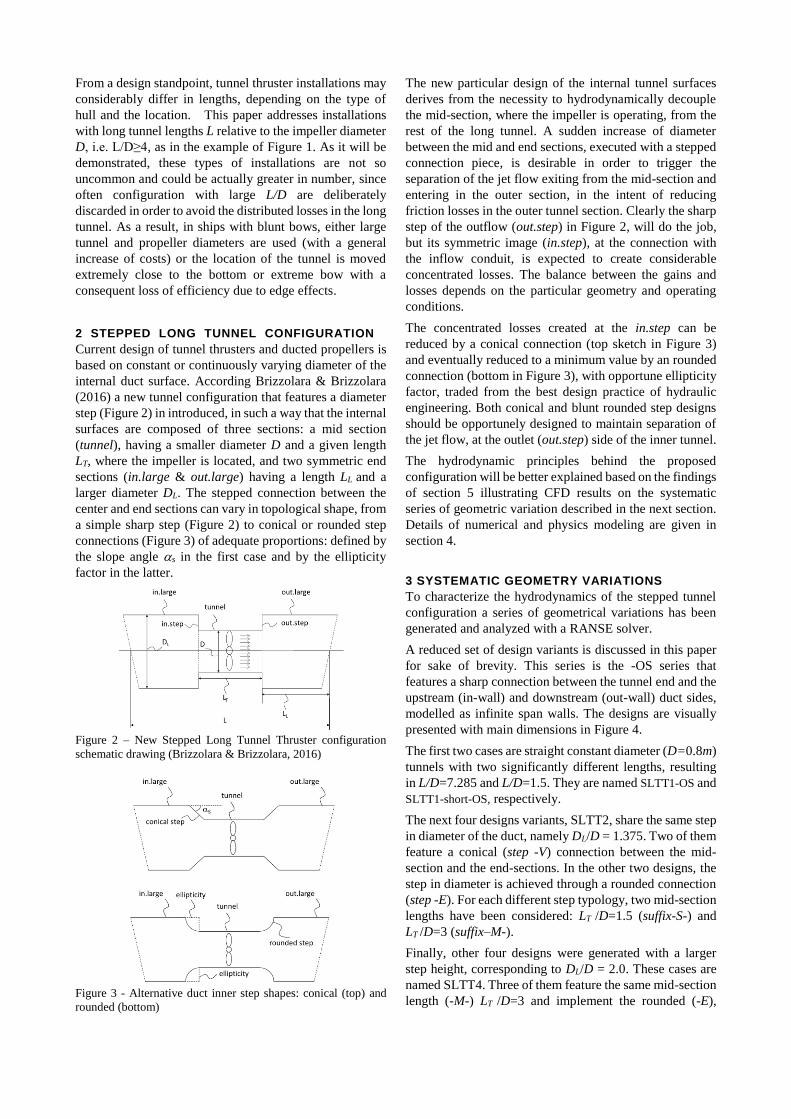
larger diameter DL. The stepped connection between the
center and end sections can vary in topological shape, from
a simple sharp step (Figure 2) to conical or rounded step
connections (Figure 3) of adequate proportions: defined by
the slope angle s in the first case and by the ellipticity
factor in the latter.
Figure 2 – New Stepped Long Tunnel Thruster configuration
schematic drawing (Brizzolara & Brizzolara, 2016)
Figure 3 - Alternative duct inner step shapes: conical (top) and
rounded (bottom)
The new particular design of the internal tunnel surfaces
derives from the necessity to hydrodynamically decouple
the mid-section, where the impeller is operating, from the
rest of the long tunnel. A sudden increase of diameter
between the mid and end sections, executed with a stepped
connection piece, is desirable in order to trigger the
separation of the jet flow exiting from the mid-section and
entering in the outer section, in the intent of reducing
friction losses in the outer tunnel section. Clearly the sharp
step of the outflow (out.step) in Figure 2, will do the job,
but its symmetric image (in.step), at the connection with
the inflow conduit, is expected to create considerable
concentrated losses. The balance between the gains and
losses depends on the particular geometry and operating
conditions.
The concentrated losses created at the in.step can be
reduced by a conical connection (top sketch in Figure 3)
and eventually reduced to a minimum value by an rounded
connection (bottom in Figure 3), with opportune ellipticity
factor, traded from the best design practice of hydraulic
engineering. Both conical and blunt rounded step designs
should be opportunely designed to maintain separation of
the jet flow, at the outlet (out.step) side of the inner tunnel.
The hydrodynamic principles behind the proposed
configuration will be better explained based on the findings
of section 5 illustrating CFD results on the systematic
series of geometric variation described in the next section.
Details of numerical and physics modeling are given in
section 4.
3 SYSTEMATIC GEOMETRY VARIATIONS
To characterize the hydrodynamics of the stepped tunnel
configuration a series of geometrical variations has been
generated and analyzed with a RANSE solver.
A reduced set of design variants is discussed in this paper
for sake of brevity. This series is the -OS series that
features a sharp connection between the tunnel end and the
upstream (in-wall) and downstream (out-wall) duct sides,
modelled as infinite span walls. The designs are visually
presented with main dimensions in Figure 4.
The first two cases are straight constant diameter (D=0.8m)
tunnels with two significantly different lengths, resulting
in L/D=7.285 and L/D=1.5. They are named SLTT1-OS and
SLTT1-short-OS, respectively.
The next four designs variants, SLTT2, share the same step
in diameter of the duct, namely DL/D = 1.375. Two of them
feature a conical (step -V) connection between the mid-
section and the end-sections. In the other two designs, the
step in diameter is achieved through a rounded connection
(step -E). For each different step typology, two mid-section
lengths have been considered: LT /D=1.5 (suffix-S-) and
LT /D=3 (suffix–M-).
Finally, other four designs were generated with a larger
step height, corresponding to DL/D = 2.0. These cases are
named SLTT4. Three of them feature the same mid-section
length (-M-) LT /D=3 and implement the rounded (-E),

conical (-V) and right angle (-S) steps. Last case SLTT4S-
S -OS features a square step too, but a shorter mid-section
length LT /D=1.5.
SLTT1L -OS SLTT1S -OS
SLTT2M-V -OS SLTT2S-V -OS
SLTT2M-E -OS SLTT2S-E -OS
SLTT4M-E -OS SLTT4M-V -OS
SLTT4M-S -OS SLTT4S-S -OS
Figure 4 - Tunnel geometry configurations considered in the
parametric CFD investigation. Only a circular portion of the
upstream and downstream infinite side-walls are represented.
4 PHYSICS AND NUMERICAL MODELLING
The focus of this investigation is in the comparison of the
viscous hydrodynamics of different duct designs. To the
scope, a state of the art Reynolds-Averaged Navier-Stokes
Equation (RANSE) solver has been used (StarCCM+,
v.11), widely validated on different propeller flow analyses
in steady and unsteady conditions (e.g. Brizzolara et al.,
2008). The finite volume solver implementation for steady
incompressible flows over unstructured polyhedral meshes
was selected. This solver uses the SIMPLE method to
conjugate pressure and velocity during the implicit solution
of the RANSE equations, by means of an AMG accelerated
algorithm. A two layers (Rody, 1991), shear driven,
realizable k- turbulence model was preferred versus more
sophisticated Reynolds stress transport models due to its
robustness and good level of accuracy, also in separated
flows, that does not require high density meshes to resolve
the viscous sublayer. A second order scheme is used to
discretize the convective term of the turbulence model.
Again, being the attention on duct hydrodynamics, a
simplified axial and rotational actuator disk model is used
to represent the hydrodynamic action of the impeller
without the need of solving the flow around the blades
(Villa et al., 2008). The actuator disk is located in place of
the impeller (disk in the middle of Figure 7) and it imparts
a non-uniform axial and tangential momentum to the flow
passing through the occupied cells. Axial and tangential
momentum sources vary along the radial coordinate
according Goldstein’s optimum distribution, according:
(1)
where r’=r/R is the radial coordinate, running from the hub
to the tip, normalized by the disk radius R=D/2. The same
shape function G is used to distribute both the axial and
rotational (tangential) momentum components. The shape
function G multiplies by a proper scale factor in order to
verify the equivalence between the total axial momentum
imparted to the flow and the impeller thrust; and another
scale factor in order to verify the equivalence between the
total rotational momentum and the impeller torque.
Figure 5 - Thrust torque and efficiency coefficients for the Ka-4-
70 propeller considered in this study. Polynomial curve
regression of each curve is given in the graph.
Impeller thrust KT=T/n2D4 and torque KQ=/n2D5
coefficients are specified as a function of the advance ratio
J=Va/nD, where n is the impeller rotational speed, D is the
impeller diameter and Va is the average inflow speed. In
this study, a the hydrodynamic characteristics of a Ka-4-70
impeller operating in a circular cylinder have been derived
from the experimental data of Van Manen & Oosterveld
(1966), as presented in Figure 5. The calculation of the
impeller inflow speed Va is obtained by averaging the axial
speed component in each cell passing through a control
plane upstream of the actuator disk, at each implicit solver
𝐺(𝑟′) = 𝑟′ √1 − 𝑟′

iteration. It is verified that the dynamic characteristics of
the actuator disk rapidly converge during the time the flow
field builds up and reach the steady state inside the tunnel.
Domain topology and global dimensions are presented in
Figure 6. On each side of the tunnel thruster, a cubic
domain measuring ~37D on its side is considered. A
smooth-wall boundary condition is set on the two inner
wall of the upstream (in-wall) and downstream (out-wall)
domains. The rest of the upstream domain boundaries are
set to stagnation-inlet. All downstream domain boundaries
except the inner wall are set to pressure outlet.
Figure 6 – CFD domain toplogy and size. The tunnel thruster
measuring L=7.825D is located in the middle of the two cubic
upstream and downstream domains.
The six different parts composing the long stepped tunnel
– namely tunnel, in/out.large, in/out.step – are modelled as
smooth-wall distinct surfaces, to allow for individual
integration of pressure and friction forces. Hence, the total
pressure of the duct system is obtained by integrating
pressure and friction forces on the two vertical walls (in
and out wall) and on the entire inner surfaces of the duct.
Figure 7 - Example of unstructured polyhedral mesh (500k cells)
used for the CFD simulations. The case is SLTT4-medium-OS.
A typical mesh resolution, counting about 500k cells, used
throughout this study, is presented in the view of Figure 7.
Prismatic cells are used close to the wall boundaries, while
polyhedral cells are used in the rest of the domain with
density refinements inside the long stepped tunnel and
around the upstream and downstream openings.
5 RESULTS
For the comparative analysis of the CFD results, the long
straight tunnel thruster SLTT1 is taken as reference case.
An impeller diameter D=0.8m and a given impeller thrust
Tp=12kN are assumed. The preliminary thruster sizing
study indicates that a Ka-4-70 impeller in a conventional
(L/D=2~3) tunnel thruster would require an input power of
about 190kW, at about 810 rpm. On this basis, the
alternative designs listed in Figure 3 were generated and
their hydrodynamic characteristics predicted by the
RANSE solver are compared in this section. The same
impeller (Ka-4-70) is considered for all different ducted
configurations, presented in Figure 4 and the rotational
speed necessary to achieve the same delivered impeller
thrust (12kN) is found as part of the CFD solution.
Alternative bases for comparison are possible, as for
instance to consider a given impeller speed (allowing for
different impeller thrust and torque values between
different cases), or a given delivered power (also allowing
for different impeller speed and thrust values). A more
sophisticated comparison would consider the impeller
pitch as an additional degree of freedom, in order to
achieve the same rotational speed and power requested by
the impeller in all cases, or the best efficiency at the given
thrust.
In fact, in the comparison with equal impeller thrust, the
different considered duct configurations imply different
distributed and concentrated losses along the duct and
consequently a different flow rate and a different thrust
delivered by the duct. The total thrust Ttot, as presented in
Figure 8, is then obtained by summation of the given
impeller thrust Tp=12kN (constant) with the duct thrust Td
found by CFD simulation for each alternative design.
Figure 8 - Total Thrust Ttot [kN] predicted by the CFD model for
the SLTT listed in Figure 4.
As it can be noted, considerable relative differences are
predicted among the total thrust prediction of Figure 8. The
predicted total thrust must be analyzed together with the
predicted impeller speed (Figure 9) and the impeller torque
(Figure 10) for a complete picture. For instance, the total
thrust of the conventional tunnel thruster is higher for the
configuration with a short tunnel (SLTT1-S), than a long
tunnel (SLLT1-L). At the same time, the shorter
conventional tunnel thruster also requires a lower input
torque. These two effects combined ultimately mean an
increased efficiency for SLTT1-S with respect to SLTT1-
L, as can be noted in Figure 12. This was expected due to
the higher friction losses in the longer tunnel and follows
the trends found by Taniguchi et al. (1966), further
explained by Beveridge (1972).

Figure 9 - Impeller revolution speed [rpm] predicted by the CFD
model for the SLTT listed in Figure 4.
Figure 10 - Impeller torque [kNm] predicted by the CFD model
for the SLTT listed in Figure 4.
Figure 12, in fact, presents the static merit coefficient C for
the different analyzed stepped tunnel configurations, in
addition to the two conventional straight tunnels. The
coefficient is perhaps the most diffused way to measure the
efficiency in producing bollard pull thrust by given a
ducted propeller (Beveridge, 1972) and it is equal to:
𝐶 = (𝐾𝑇
𝜋)
32 1
𝐾𝑄
A maximum value C=2 is expected in ideal condition (no
viscous losses, no expansion of the outflow).
The performance comparison of the various considered
stepped long tunnel configurations, as can be inferred by
the analysis of Figure 8, evidences that the highest value of
total thrust is reached by the rounded stepped
configurations, with a marked superiority of the SLTT4
configuration on the SLTT2E. This was expected since the
larger diameter of the end sections of SLTT4 minimizes the
inlet and outlet losses (lower average speed at the
contracted inlet section) while increasing the suction force
on the upstream step (in.step).
The flow rate (Figure 9) increases at the constant imposed
thrust, for designs that achieve lower duct losses. Higher
flow rate determines a higher advance ratio to the fixed
pitch propeller that has to increase the speed to keep the
assigned thrust. The torque requested by the Ka-4-70 duct
propeller (Figure 10) comes as a consequence of the
assigned thrust and the advance ratio calculated from the
CFD simulation, from the characteristic curves given in
Figure 5.
Figure 12 - Static merit coefficient C predicted by the CFD model
for the SLTT listed in Figure 4.
Steady state viscous flow fields have been obtained for
each of the tunnel configurations presented in section 3.
Integration of pressure and shear forces on each surface
allows to compute the total thrust as well as to compare the
partial contribution of each new duct component to the
total thrust. This comparison is given in the bar chart of
Figure 14.
(2)
Figure 11 - Velocity flow field for SLTT4V-medium-OS

SLTT1-OS SLTT1-short-OS
SLTT2E-medium-OS SLTT2E-OS
SLTT2V-medium-OS SLTT2V-OS
SLTT4E-medium-OS SLTT4V-medium-OS
SLTT4-medium-OS SLTT4-OS
Figure 13 - Pressure distributions in a longitudinal (diametral) section of the investigated tunnel thrusters series. Color scale is the same
for all graphs as reported at the bottom of the list.

A careful analysis of the pressure distribution along the
duct may indicate the location of the concentrated and
distribution losses along the conduit. The computed
pressure distribution on the longitudinal (diametral)
section of the duct is presented in the Figure 13, for all
considered cases.
As anticipated, the analysis of pressure distribution,
evidences how the rounded step connections are able to
minimize concentrated losses, while maximizing the
suction pressure force on the in.step surface, which is the
principal component of the total thrust produced by the
duct system.
The larger inlet openings of stepped tunnel configurations
are responsible for the reduction of the concentrated losses
with respect to the smaller diameter inlet of the
conventional tunnel. The analysis of the velocity field, as
presented in Figure 11 for SLTT4V case, reveals how the
conical step is effective in separating the jet flow exiting
from the tunnel mid-section, at the same time avoiding the
its reattachment onto the larger diameter section
downstream. This contributes to the reduction of
distributed (friction) losses in the out.large component of
the duct.
Figure 14 presents the incremental contribution of each
duct geometrical feature to the total produced thrust.
Contributions creating useful thrust are piled up above the
zero line, while negative contributions stacked below the
zero reference line, represent a reduction of the total net
thrust. It can be noted that, in the SLTT configurations, a
major contribution to the total thrust is given by the in.step
which is always subject to partial compensation of the
negative thrust produced by the out.step.
The most efficient step connection, as already noted, is the
rounded one, as the yellow (positive) taller bars in Figure
14 highlight.
Finally, for the CFD enthusiast: a close analysis of the
pressure and velocity fields obtained throughout all
computations and presented in the examples of Figure 11
and Figure 13, reveals an asymmetry of the flow exiting for
the mid-section of the SLTT configuration. This
asymmetry manifests as a periodic pressure and velocity
fluctuation around a prevalent axial jet flow. It is obviously
a consequence of the flow separation downstream of the
stepped connection between the inner and the outer tunnel
sections. Similar fluctuations have been measured for
instance in the reattachment region of turbulent flows
separating from a backward step (Kim et al., 1980). Also
note that in the CFD simulations the outflow of the
propeller disc is given both axial and rotational
momentum. However, the RANSE simulations, presented
in this paper, are indeed based on a 3D segregated steady
flow solver. Steady simulations were continued over a
large number of steps until optimal convergence (low
residuals), but this flow unsteadiness continued to
manifest. Due to the nature of the steady solver, this
predicted unsteadiness must not be considered physical,
but rather a virtual (numerical) phenomenon that is a
symptom of a physical phenomenon (flow separation). The
steady RANSE flow solver is meant to reach the steady
state by virtual time step iterations. Future planned studies
will repeat simulations with an Unsteady RANSE solver in
order to confirm the average predicted forces coming from
the steady model.
Figure 14 - Thrust production breakdown by each individual duct component of the considered stepped tunnel configurations
(conventional constant diameter tunnels, SLTT1 are also included as first two cases). The contribution of the upstream step is
noticeable and contrasted by the thrust deduction generated by the downstream step.

6 CONCLUSIONS
A new internal duct shape design is proposed for
applications on long tunnel thrusters. The patented solution
is based on a sudden radial step in duct diameter between
the mid-section and the two end sections of the duct.
Different alternative designs, obtained by varying the
diameter difference (step height) and the shape of the
stepped connection, while keeping the overall length, have
been created and analyzed by means of high fidelity fully
turbulent viscous flow simulations.
Results, obtained at constant impeller thrust, indicate that
some designs are able to produce a considerably higher
duct thrust and a higher static merit coefficient than the
conventional tunnel thruster configuration. In particular,
the rounded step configurations show static merit
coefficient increase of about 23% (SLTT2E-short) to 40%
(SLETT4E-medium), depending on the step height. This
higher increase of efficiency is paired by a considerable
increase of total thrust, amounting to 61% (SLTT2E-short)
and 74% (SLETT4E-medium), with respect to the
reference conventional long tunnel configuration.
Application potentials of the proposed technology are still
to be completely unleashed, since the higher efficiency
demonstrated by the stepped long tunnel configurations
(L/D>4) has proven superior to conventional tunnel
thruster having ideal tunnel lengths (2~3D) and same
impeller diameter, by the CFD simulations presented in
this study. Results of this study seem also to indicate the
possibility to design tunnel configurations with smaller
impeller diameters and the same efficiency and total thrust
than current conventional installation. Future studies are
planned to demonstrate evidences in this respect.
REFERENCES
Beveridge J. L. (1972). Design and Performance of Bow
Thrusters, Marine Technology, 9(4): 439-453.
Brizzolara E.B., Brizzolara S. (2016) Marine Tunnel Thruster.
US patent US9376186B2. WIPO patent publication number
WO2012/137144.
Brizzolara S., Villa D, Gaggero S (2008). A Systematic
Comparison between RANSE and Panel Method for
Propeller Analysis. 8th Int. Conf. on Hydrodynamics, ICHD
2008. Nantes, France, 1:289-302.
English J.W. (1963). The Design and Performance of Lateral
Thrust Units for Ships. Transactions of RINA, 105(3): 251-
279.
Gaggero S., Savio L., Brizzolara S., Viviani M., Conti F.,
Ferrando M. (2009). Comparison of Experimental
Measurements and Numerical Calculations for a Propeller in
Axial Cylinder. First International Symposium on Marine
Propulsors SMP’09, Trondheim, June 2009.
Kim, J., Kline, S. J., & Johnston, J. P. (1980). Investigation of
a reattaching turbulent shear layer: flow over a backward-
facing step. ASME J. Fluids Eng, 102(3), 302-308.
Ridley D. E. (1969). Effect of Tunnel Entrance Configuration
on Thruster Performance, Marine Technology, 6(2): 60-65.
Rodi W. 1991. “Experience with Two-Layer Models
Combining the k-e Model with a One-Equation Model Near
the Wall”, 29th Aerospace Sciences Meeting, January 7-10,
Reno, NV, AIAA 91-0216.
Stuntz, Jr., G. R. and Taylor, R. J. (1964). Some Aspects of
Bow-Thruster Design, Trans. SNAME, 72:336-373.
Taniguchi K., Watanabe K., Kasai H. (1966) Investigations into
the Fundamental Characteristics and Operating Performances
of Side Thruster, Mitsubishi Technical Bulletin n.35.
Van Manen J. D., Oosterveld M. W. C. (1966). Analysis of
Ducted-Propeller Design, Trans. SNAME, 74:522-562.
Villa D., Gaggero S., Brizzolara S. (2012). Ship Self-
Propulsion with Different CFD Methods: from Actuator Disk
to Viscous-Inviscid Unsteady Coupled Solvers. 10th Int.
Conf. on Hydrodynamics, ICHD’12. St. Petersburg (Russia).
Yu C., Yang C. (2016). Study of Tunnel Thruster Performance
and Flow by Quasi-Steady Reynolds-Averaged Navier-
Stokes Simulations. J. Shanghai Jiaotong Univ. (Sci.), 21(6):
662-671.