Embed Size (px)
Citation preview

G. Petkovšekj
HRPP542 1
Long term simulation of reservoir sedimentation with turbid underflows G. Petkovšek1 1 HR Wallingford Ltd, Howbery Park, Wallingford, Oxfordshire OX10 8BA, UK (Email: [email protected])
Abstract This paper presents development and an example of application of turbid density current module for RESSASS, a one-dimensional quasi-steady reservoir sedimentation model suitable for long term simulations. The module determines plunging point of density current based on the criterion of densimetric Froude number. Following plunging simulation continues in a supercritical regime as long as the energy of the density flow and slope of bed are sufficient to support the transport in this mode, or until the dam is reached. A muddy lake is then formed. An adapted version of the theory of Toniolo et al (2007) is used to compute water and sediment balance in a muddy pond. If the level of muddy pond exceeds the lowest level outlet, sediment is vented from the reservoir. The model was applied to one of the largest reservoirs in the world, the Nurek reservoir in Tajikistan. Historical data on bed levels and sediment inflow as well as a recent survey from 2015 were used to calibrate and validate the model. The model showed good results both in terms of modelled bed levels and composition of deposited sediment.
1. Introduction Sediment deposition occurs in any reservoir and reduces its capacity to store water. From practical perspective of reservoir management it is important to estimate the rates and patterns of sedimentation. For this reason, models of varying degrees of complexity and describing various water and sediment flow processes and their interactions have been proposed by scientists and engineers over the last decades.
Stratification due to density differences is one such process and a common feature in deep reservoirs. Density differences result from differences in temperature, concentration of dissolved solids, turbidity or a combination thereof (Morris & Fan 1998). In this paper we are mainly interested in turbid density currents, which in reservoirs follow the pattern described next. If sediment concentration and water depth of the sediment laden flow entering a reservoir are sufficient, it plunges under the water surface and continues its way towards the dam as submerged density current. If turbid density underflow reaches the dam it is either vented through a low level outlet or in absence of that, travels up the dam face and then turns back to form an underwater muddy lake.
Turbid density currents produce a characteristic flat-bed pattern in lower part of reservoirs. Numerical modelling of this phenomenon presents a particular challenge for engineers who deal with reservoir sedimentation problems. In principle, three-dimensional (3D) models are the most suitable to model turbid density currents. These models have been successfully applied to simulate propagation of turbid underflows

G. Petkovšekj
HRPP542 2
on the experimental scale as early as in the 1990s (e.g. Olsen & Tesaker 1995, De Cesare & Schleiss 1999) and more recently also on a real reservoir scale. For example, An & Julien (2014) simulated this phenomenon during a typhon event in South Korea. However in reservoir sedimentation studies modelling of several scenarios and multiple optimisation runs are often required with simulation periods of the order of hundred years. Application of 3D models that typically require long run times may not be suitable for practical problems (Cao et al. 2015). Engineers usually resort to 2D or, in particular if the studied reservoir is long and narrow, they choose 1D models. In this case, i.e. when vertical structure of water and sediment flow is not resolved with vertical model mesh, the selected model must still be able to address the specifics of sediment transport by turbid underflows by using another approach that is reasonably accurate. Mechanisms behind turbid density currents are quite different from free surface flow driven sediment transport and absence of a module for simulation of turbid density currents cannot be easily overcome by adjusting model parameters. Unfortunately 1D sediment transport models suitable for practical applications rarely meet this requirement, in particular those that are commercially available.
In this paper we present modelling of long-term sedimentation in Nurek reservoir in Tajikistan, one of the largest and deepest reservoirs in the world. Plunging of turbid density currents is regularly observed in this reservoir and due to the fact that the outlets are high above the bed, almost all of sediment carried by turbid underflows deposits in the lower part of the reservoir (sediment delta bottomset). This paper presents the development of turbid density current module for one-dimensional long term quasi-steady reservoir sedimentation model RESSASS (HR Wallingford 2001, 2014) and its application to model the 43 years of reservoir operation (1972-2015). The work presented here is a part of Nurek Reservoir Sedimentation Study that also covers data collection, bathymetric survey and sediment sampling as well as modelling of various future scenarios.
2. Model 2.1. RESSASS RESSASS is a long-term one-dimensional reservoir sedimentation model, developed purposely for this task by HR Wallingford (2001, 2014). It is used to simulate the movement and deposition of sediment in reservoirs. The software predicts the impact of operating rules on both the volumes and location of future sedimentation.
The model divides sediments into two different size ranges: fine (silt and clay, smaller than 0.06 mm) and coarse (sand and gravel, larger than 0.06 mm). Each of these can be further split into several fractions. The transport capacities for the coarse sizes are calculated using the well-established Ackers & White (1973) sediment transport prediction method reviewed to consider fine sand (Ackers 1993) for all simulations presented in this paper (other equations are available in the model as well). The transport rates for the coarse group depend on their proportion on bed surface, unlike the rates for the finer sediments (silts and clays) that can be transported even if they are not represented in the sediment mixture on bed surface. The method of Westrich & Jurashek (1985) is used to calculate the transport rates of this group of sediments. Corrections are applied to concentrations of both size groups to allow for non-equilibrium transport conditions. When it comes to erosion, the model also differentiates between the two group sizes and treats erosion from predominantly cohesive (sediment from fine group) bed according to equations appropriate for this type of sediment deposits (Partheniades 1965).

G. Petkovšekj
HRPP542 3
During drawdown, RESSASS can take into account development of a scouring channel in a wide reservoir. The width of such incised channel is estimated from existing empirical relations (White 2001) and updated on a regular basis.
RESSASS also has a capability to model turbidity underflows in a manner suitable for long-term simulations, as explained in the following chapter.
Boundary conditions on the upstream end are specified by inflow of water and sediment. At the downstream end, boundary conditions can be prescribed by time series of water levels at dam, minimum water release as well as outflow capacity.
The model has been successfully validated against observations on several reservoir sedimentation case studies, including Tarbela reservoir in Pakistan (Petkovsek & Roca 2013), Karangtalun settling basin in Indonesia, Rio Grande canal and reservoir in USA and Xiaolangdi reservoir in China. The results of validation tests have been presented in HR Wallingford (2014).
2.2. Turbid density currents module (TDCM) RESSASS uses a simple approach to model turbid density currents, adapted for quasi-steady flow and thus suitable for long time steps and long term simulations typical in reservoir sedimentation studies. The model predicts occurrence of the plunge point (Fig. 1) from the densimetric Froude number Fd criteria (Morris & Fan 1997):
𝐹𝐹𝑑𝑑 = 𝑣𝑣2
𝑔𝑔′ ℎ (1)
𝑔𝑔′ = 𝑔𝑔 𝑐𝑐𝜌𝜌
(1 − 1𝑠𝑠) (2)
where v = flow velocity; g = gravity acceleration; h = flow depth; ρ = density of water; c = concentration of sediment; s = relative density of sediment compared to clear water.
The value of Fd at the plunge point is a user input parameter. The recommended value is around 0.78.
From plunging on, the velocity vTDC and depth hTDC of density current are calculated from longitudinal bed slope S0 and friction factor ft for turbidity flows, according to:
𝑣𝑣𝑇𝑇𝑇𝑇𝑇𝑇 = �8𝑓𝑓𝑡𝑡
𝑔𝑔′ℎ𝑇𝑇𝑇𝑇𝑇𝑇 𝑆𝑆0 (3)
Recommended value of friction factor ft is between 0.025 and 0.03 according to the experience from Chinese reservoirs (Morris & Fan 1997, Zhang et al. 2005).
Another criteria for the inflowing turbid water to be able to plunge and continue to flow as turbid underflow is that the current must be in supercritical regime (Fd >1 as calculated from vTDC and hTDC). If transition to subcritical regime occurs or the density current reaches the dam, the model proceeds with simulation of a muddy lake.
For sediment settling and water detrainment from a muddy pond an adaptation of the theory of Toniolo et al. (2007) to the modelling concept employed in RESSASS is used that considers quasy-steady ap-proach and generalisation for any cross section shape.

G. Petkovšekj
HRPP542 4
Figure 1 Illustration of density currents modelling approach in RESSASS.
The muddy pond theory proposed by Toniolo et al. (2007) supposes that the settling interface between the muddy pond and the clear water resembles that found in a cylinder containing dilute suspension of mud (Fig.2). As sediment settles, water drains upward across the settling interface. If the inflow of water into the muddy pond matches the rate of detrainment of water from the muddy pond, the interface does not change its position; otherwise it moves downwards if the inflow is lower or upwards if the inflow is higher than the detrainment rate. Change of flow rate per unit width q with distance x along the muddy pond, which is the same as the detrainment rate for water per unit area, is calculated as:
𝑑𝑑𝑑𝑑𝑑𝑑𝑑𝑑
= 𝜈𝜈𝑠𝑠𝑠𝑠 (4)
where νsm = settling velocity of suspended mud in muddy pond.
If the settling interface of the muddy lake rises above the level of the lowest outlet of the dam, the turbid flow is discharged from the reservoir.
Figure 2 Sketch showing the formation of a settling interface and water detrainment in a cylinder containing a dilute suspension of mud of uniform size (Toniolo et al. 2007).
After the hydraulic parameters of the turbid underflow have been computed, they are passed to the sediment transport equations to calculate sediment transport rates.

G. Petkovšekj
HRPP542 5
3. Nurek Reservoir and Data 3.1. Characteristics of the reservoir The Nurek Dam is a large earth-fill embankment dam in Tajikistan. Currently it mainly serves for energy production although it also regulates water flow for irrigation and is an important asset in water resources management of the Aral Sea basin. With the height of around 300 m it was the tallest dam in the world from the time of its construction in 1970s until 2013. Situated in a narrow section of the Vakhsh river, the dam impounds water in a narrow 70 km long reservoir (Fig. 3) with initial total storage volume of 10.5 km3, most of it in the first 30 km.
As in any reservoir, sediment deposition in Nurek Reservoir reduces its storage capacity and potential to store water. The latest survey (HR Wallingford 2015b) has shown that about one third of the original total storage has been lost in 43 years of operation since 1972. Most of the storage loss occurred in the inactive reservoir area occupied by predominantly fine sediment carried by turbid density flows.
The average water inflow from the catchment area of 31,400 km2 is 640 m3/s (Hydroproject 2009) and annual inflow volume is 20.2 km3, about twice the original reservoir volume. A typical annual hydrograph displays a distinctive peak during the summer months associated with the snowmelt in the Himalayas. Annual maximum flows that occur during this period often exceed 2000 m3/s while during the low flow months of January and February the flow regularly drops below 200 m3/s.
Figure 3 Outline of the Nurek Reservoir.
Sediment inflow is related to the water inflows and geological and soil characteristics of the sparsely vegetated hilly and mountainous catchment. Morris (2011) reports that observations in the lower watershed and discussions with geologists at Rogun project (another dam under construction upstream from Nurek) indicate that the parent material in most of the catchment consists of sandstones and mudstones with limited

G. Petkovšekj
HRPP542 6
amounts of limestone and granite. Soils around Nurek reservoir typically consist of thick layers of silt and various erosional features are present.
Most of sediment reaches the reservoir in the high flow season between July and September. The period between March and June also brings a substantial amount of sediment, while the remaining period carries a negligible amount (Olsson et al. 2006). Olsson et al. (2006) gives the following composition of sediment: 42.1% of sediment is finer than 0.01 mm, 20.4% between 0.01 and 0.05 mm, 34.2% is fine sand (<0.25 mm) and 3.3% is bigger than 0.25 mm. From Hydroproject (2009) data for suspended sediment in 1979 the following composition was calculated: 33% of sediment is finer than 0.01 mm, 28.1% of sediment is in the range 0.01-0.05 mm, 30.6% between 0.05 and 0.1 mm and almost all of the rest (7.8%) is smaller than 0.25 mm.
3.2. Data for modelling and sources Initial reservoir geometry was based on 21 cross sections surveyed before the impoundment of the Nurek reservoir. In addition to that two other bathymetric surveys (1994, 2001) were available at Nurek HPP. These two surveys followed the same cross sectional survey lines as used in the pre-impoundment survey. A more comprehensive survey with over 300 survey lines of total length exceeding 650 km was carried out in the framework of Nurek Reservoir Sedimentation Study (HR Wallingford 2015b).
Daily water levels and water inflows for modelling were also collected from various sources (HR Wallingford 2015a). Daily water levels at dam since the beginning of impoundment in October 1972 were obtained from Nurek HPP. Inflow data for the Nurek reservoir can be derived from gauging stations at Darband (115 km above Nurek, operating since 1975) and Kishrog (70 km above Nurek, operating since 1982). The location of the latter station is particularly relevant for the Nurek reservoir inflows. Unfortunately the data from this station contains several gaps (in particular prior to 2005) due to difficult conditions of operation, including destruction of the station in 2009 by a major mudslide (HR Wallingford 2015a). Water inflows calculated from water levels and outflows from the reservoir that are also available at Nurek HPP were used in this study.
Estimates of sediment inflow vary significantly between different sources. Hydroproject (2009) states a long term annual average for suspended sediment at Rogun dam site (contribution area about 3% smaller than that of Nurek) based on past observations at various points along Vakhsh river. Their estimate for annual average is 78.6 Mt but also references other estimates as high as 95.9 Mt. For bedload, the value given is 9.2 Mt. The total load at Nurek could therefore be calculated as (78.6 + 9.2) × 1.03 = 90.4 Mt. Field observations at Kishrog in the period of 2005-2014 give the annual average of 46 Mt. However difficulties in sampling during high flow period when most of the sediment reaches the Nurek reservoir were noted in HR Wallingford (2015c). These problems are related to high flow velocities in the very steep section of Vakhsh river, where Kishrog is located. Morris (2011) compared Nurek reservoir storage loss according to several sources and found it within a range between 62 and 115 Mm3/year. Given that variation between different estimates is high, a decision was made not to use sediment inflow as an input parameter but rather to calibrate sediment inflows to other observed parameters that are known with a higher level of certainty.
G. Petkovšekj
HRPP542 7
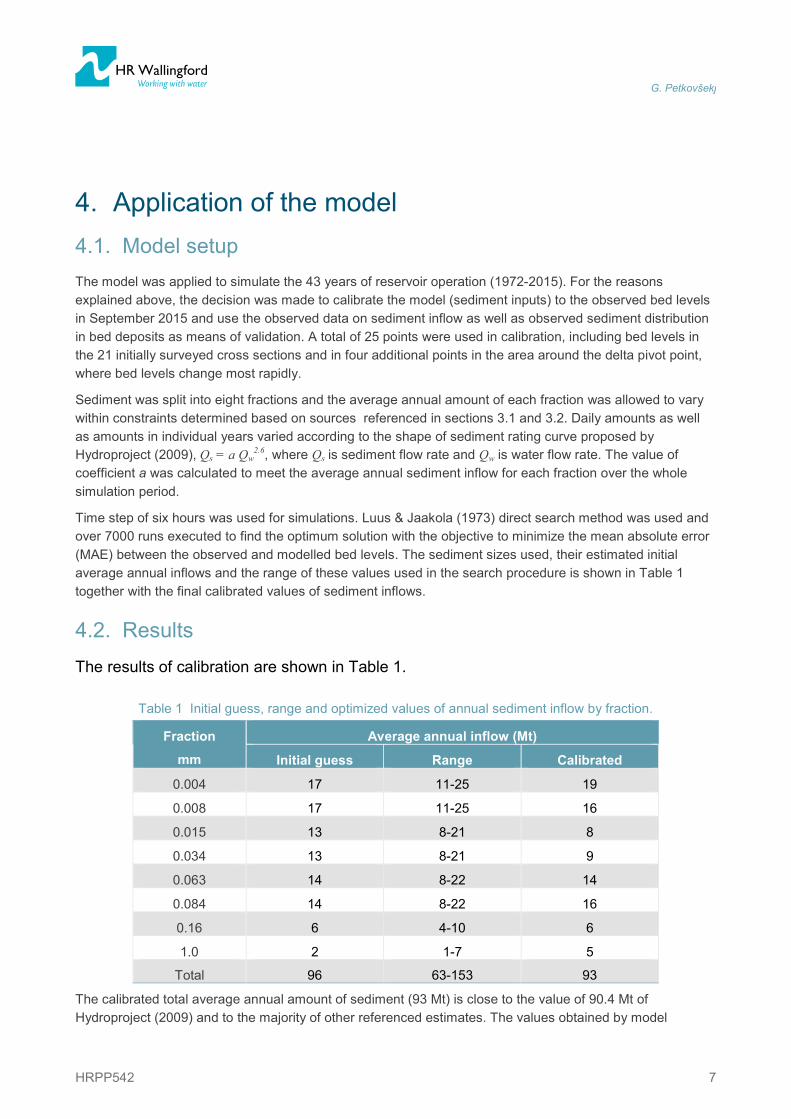
4. Application of the model 4.1. Model setup The model was applied to simulate the 43 years of reservoir operation (1972-2015). For the reasons explained above, the decision was made to calibrate the model (sediment inputs) to the observed bed levels in September 2015 and use the observed data on sediment inflow as well as observed sediment distribution in bed deposits as means of validation. A total of 25 points were used in calibration, including bed levels in the 21 initially surveyed cross sections and in four additional points in the area around the delta pivot point, where bed levels change most rapidly.
Sediment was split into eight fractions and the average annual amount of each fraction was allowed to vary within constraints determined based on sources referenced in sections 3.1 and 3.2. Daily amounts as well as amounts in individual years varied according to the shape of sediment rating curve proposed by Hydroproject (2009), Qs = a Qw
2.6, where Qs is sediment flow rate and Qw is water flow rate. The value of coefficient a was calculated to meet the average annual sediment inflow for each fraction over the whole simulation period.
Time step of six hours was used for simulations. Luus & Jaakola (1973) direct search method was used and over 7000 runs executed to find the optimum solution with the objective to minimize the mean absolute error (MAE) between the observed and modelled bed levels. The sediment sizes used, their estimated initial average annual inflows and the range of these values used in the search procedure is shown in Table 1 together with the final calibrated values of sediment inflows.
4.2. Results The results of calibration are shown in Table 1.
Table 1 Initial guess, range and optimized values of annual sediment inflow by fraction.
Fraction
mm
Average annual inflow (Mt)
Initial guess Range Calibrated
0.004 17 11-25 19
0.008 17 11-25 16
0.015 13 8-21 8
0.034 13 8-21 9
0.063 14 8-22 14
0.084 14 8-22 16
0.16 6 4-10 6
1.0 2 1-7 5
Total 96 63-153 93
The calibrated total average annual amount of sediment (93 Mt) is close to the value of 90.4 Mt of Hydroproject (2009) and to the majority of other referenced estimates. The values obtained by model

G. Petkovšekj
HRPP542 8
calibration and the estimates based on field measurements can therefore be considered as supporting each other.
A comparison with the observed profiles is shown in Figure 4. The agreement for the calibrated year 2015 is very good. The mean absolute error between the observed and predicted bed levels found by the search method was 1.7 m. The observed profiles from 1994 and 2001 have been used for validation. Although not as good as on the calibrated 2015 dataset, the agreement with these two profiles in 1994 and 2001 is also good. Therefore validation could be considered successful.
Figure 4 Observed and modelled bed levels.
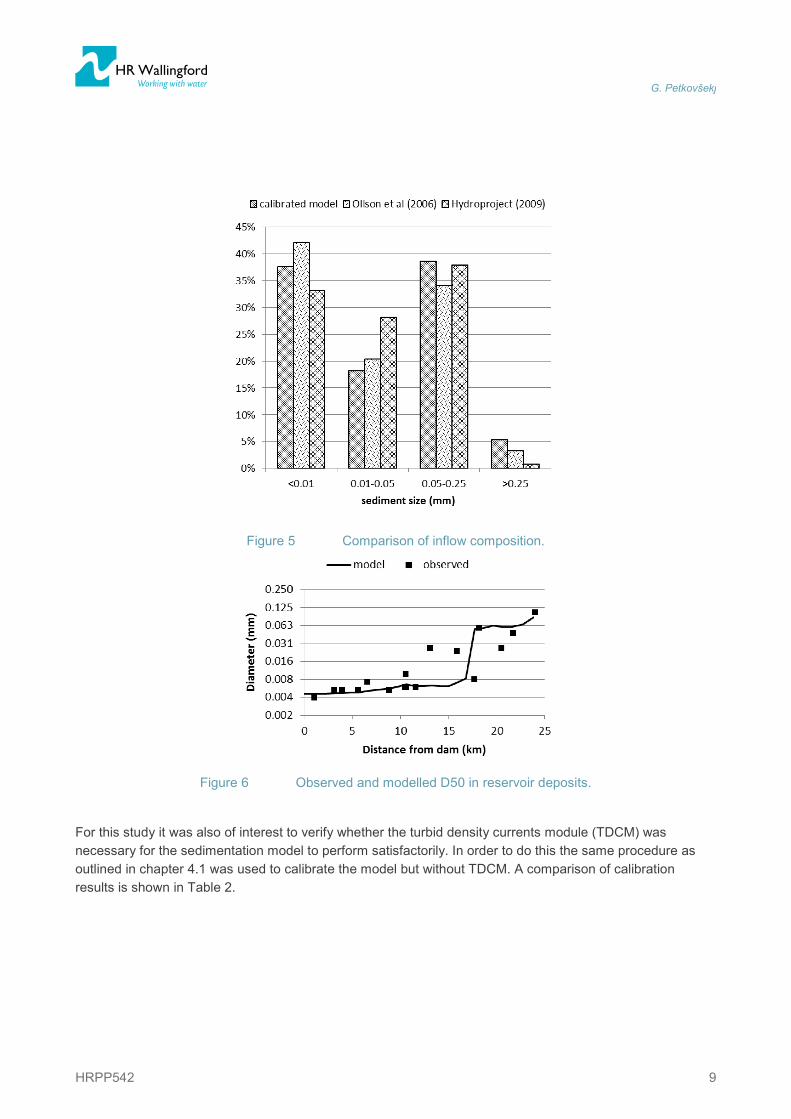
In terms of composition, a comparison of proportions obtained by model calibration to the surveyed bed levels and the data of Ollson et al. (2006) and Hydroconsult (2009) is shown in Figure 5. Again a comparison is good in particular with Ollson et al. (2006) data. It should be noted that proportions calculated from Hydroproject (2009) data refer to suspended sediment only hence the proportion of sediment bigger than 0.25 mm is very low. The proportion of sediment smaller than 0.05 mm is also distributed somewhat differently between the two smallest classes compared to the calibrated and Ollson et al. (2006) dataset.
Finally Figure 6 shows a comparison of observed median size (D50) of material deposited in the top 2 m of reservoir bed (HR Wallingford 2015c) with model predictions. Overall agreement is good although the observed values show more scatter, while the modelled values show a steady increase with a sharp change only around km 17. Between this point and dam, water is deep and bed is flat, thus only the finest sediment is able to reach this area. Upstream from that point water depth decreases and bed slope increases, making it possible for coarser silt particles to reach this area.
G. Petkovšekj
HRPP542 9
Figure 5 Comparison of inflow composition.
Figure 6 Observed and modelled D50 in reservoir deposits.
For this study it was also of interest to verify whether the turbid density currents module (TDCM) was necessary for the sedimentation model to perform satisfactorily. In order to do this the same procedure as outlined in chapter 4.1 was used to calibrate the model but without TDCM. A comparison of calibration results is shown in Table 2.
G. Petkovšekj
HRPP542 10
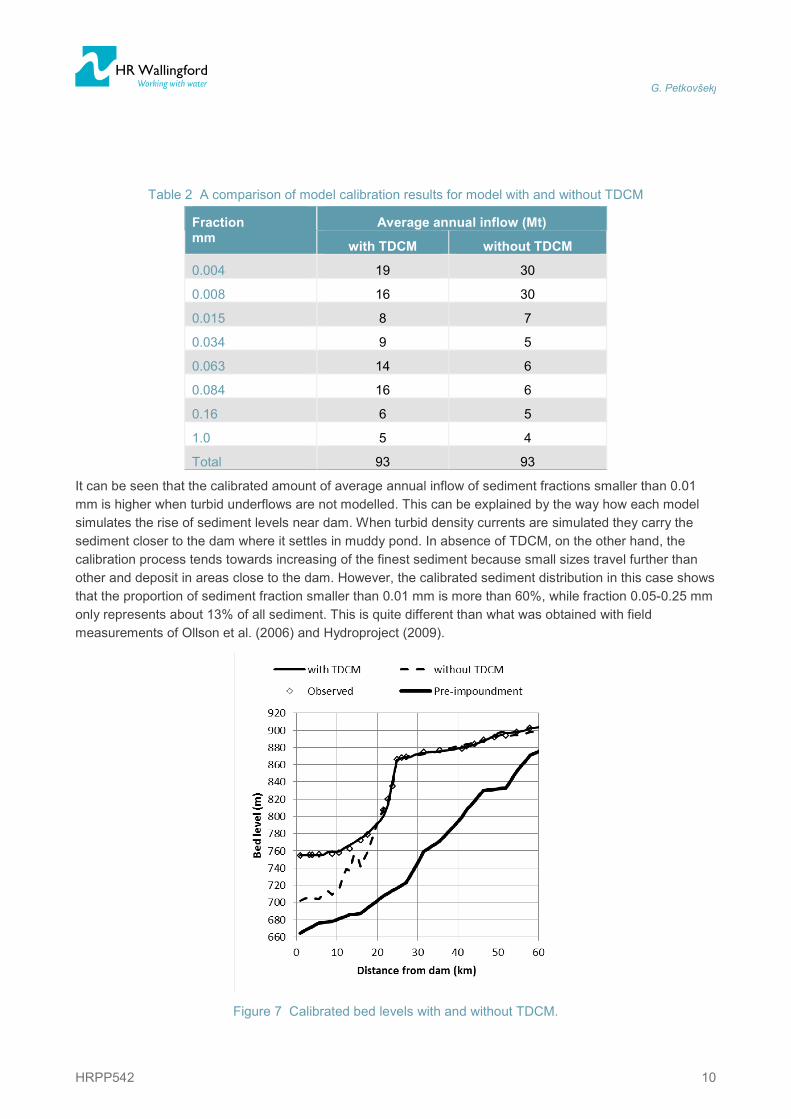
Table 2 A comparison of model calibration results for model with and without TDCM
Fraction mm
Average annual inflow (Mt)
with TDCM without TDCM
0.004 19 30
0.008 16 30
0.015 8 7
0.034 9 5
0.063 14 6
0.084 16 6
0.16 6 5
1.0 5 4
Total 93 93
It can be seen that the calibrated amount of average annual inflow of sediment fractions smaller than 0.01 mm is higher when turbid underflows are not modelled. This can be explained by the way how each model simulates the rise of sediment levels near dam. When turbid density currents are simulated they carry the sediment closer to the dam where it settles in muddy pond. In absence of TDCM, on the other hand, the calibration process tends towards increasing of the finest sediment because small sizes travel further than other and deposit in areas close to the dam. However, the calibrated sediment distribution in this case shows that the proportion of sediment fraction smaller than 0.01 mm is more than 60%, while fraction 0.05-0.25 mm only represents about 13% of all sediment. This is quite different than what was obtained with field measurements of Ollson et al. (2006) and Hydroproject (2009).
Figure 7 Calibrated bed levels with and without TDCM.

G. Petkovšekj
HRPP542 11
Furthermore, as mechanism of sediment transport and deposition with turbid underflow is quite different from that with free surface flow, the calibration results were not good in the latter case. This can be seen from Figure 7.
The mean absolute error between the observed and predicted bed levels for model without TDCM was 15.9 m, which is significantly higher than 1.7 m as in the case with TDCM.
5. Conclusions Long-term modelling of sedimentation for Nurek Reservoir Sedimentation Study required a modelling tool that had a capacity to simulate turbid density currents. As multiple long-term simulations as well as ease of future use by the Nurek HPP staff was required within this project, 3D models were not appropriate and terms of reference required a less complex approach.
Thus a one-dimensional long term quasi-steady reservoir sedimentation model RESSASS was updated with a turbid density current module (TDCM). The module is able to predict the occurrence of plunging and the location of the plunge point, calculate flow depths and velocities of submerged turbid density flows, and it can also predict development of muddy pond in the reservoir area near dam and venting of turbid underflow through a low level outlet.
The model was then applied to simulation of sedimentation in Nurek reservoir over the period from the start of its operation (end of 1972) till the latest bathymetric survey (September 2015). Due to uncertain amounts of sediment inflows an approach was taken to calibrate the model to the observed bed levels while using the sediment inflow estimates and observed composition of sediment in inflow and in reservoir deposits for validation.
Calibration results showed satisfactory matching between observed and modelled bed levels. The calibrated amounts of sediment inflow by fraction also match well both by amount and composition with the majority of the estimates collected from the literature. Comparison of D50 of modelled and observed bed deposits shows that they both follow a similar pattern, although the observed dataset shows more scatter than the modelled. On the other hand, calibration of model without TDCM did not produce good matching between the observed and modelled bed levels, leading to conclusion that TDCM must be used.
These findings support the choice of using the model with TDCM for modelling a general pattern of long term deposition in Nurek reservoir, in which turbid density currents play an important role. There is no apparent reason why this conclusion could not be extended to other such reservoirs although an independent verification for individual cases is recommended. For detailed modelling of deposition patterns that might be a concern in particular in the dam and intakes area, a 3D modelling of a shorter simulation period might be of interest to provide further confidence and details that cannot be predicted by a 1D model.
6. References Ackers, P. & White, W.R. 1973. Sediment transport: new approach and analysis. Journal of Hydraulics Division 99(11): 2041-2060.
Ackers, P. 1993. Sediment transport in open channels: Ackers and White update. Proc. Institution of Civil Engineers, Water, Maritime and Energy 101: 247-249 .

G. Petkovšekj
HRPP542 12
An, S. & Julien, P.Y. 2014. Three-Dimensional Modeling of Turbid Density Currents in Imha Reservoir, South Korea. Journal of Hydraulic Engineering, 140(5): 1-15.
Cao, Zh., Pender, G. & Liu, Q. 2015. Whole-Process Modeling of Reservoir Turbidity Currents by a Double Layer-Averaged Model. Journal of Hydraulic Engineering, 141(2): 1-19.
De Cesare, G. & Schleiss, A. 1999. Physical and numerical modelling of turbidity currents. In (multiple editors): Proceedings of Abstracts and Papers (on CD-ROM), XXVIII IAHR congress, Hydraulic Engineering for sustainable Water Resources Management at the Turn of the Millenium, 22-27 August 1999, Graz/Austria. Electronic edition.
HR Wallingford 2001. Measuring and predicting reservoir volume changes due to sedimentation: RESSASS Version 1.5. User manual. Wallingford: HR Wallingford.
HR Wallingford 2014. Reservoir Sedimentation Modelling. Update of RESSASS. HR Wallingford report MCY0455-RT001-R0. Wallingford: HR Wallingford.
HR Wallingford (2015a). Nurek Reservoir Sedimentation Study. Deliverable 1: Data Recovery. HR Wallingford report MCR5368-RT005. Wallingford: HR Wallingford.
HR Wallingford (2015b). Nurek Reservoir Sedimentation Study. Deliverable 2: Bathymetric Survey. HR Wallingford report MCR5368-RT007. Wallingford: HR Wallingford.
HR Wallingford (2015c). Nurek Reservoir Sedimentation Study. Interim Report. HR Wallingford report MCR5368-RT003. Wallingford: HR Wallingford.
Hydroproject 2009. Rogun HPP on Vakhsh River in Tajikistan. Natural conditions, Hydro meteorological conditions. Report 1861-II-2. Moscow: Hydroproject.
Luus, R. & Jaakola, T.H.I. 1973. Optimization by direct search and systematic reduction of the size of search region. American Institute of Chemical Engineers Journal 19 (4): 760–766
Morris, G. & Fan J. 1998. Reservoir sedimentation handbook. New York : McGraw-Hill.
Morris, G. 2011. Assessment of Reservoir Sedimentation and Sustained Use Strategies: Nurek Reservoir on Vakhsh River, Tajikistan. Report for World Bank 27 Oct 2011.
Ollson, O., Normatov, I., Sorokin, A. & Froebrich, J. 2006. Sedimentation processes and future reservoir capacities of the Nurek reservoir. In: V.M. Bolgov (ed.), Extreme hydrological events in Aral and Caspian sea region. The proceedings of International Scientific Conference, Moscow, 18-21 October 2006. Moscow: Russian Academy of Sciences.
Olsen, N.R.B. & Tesaker E. 1995. Numerical and physical modeling of turbidity current. In M.A. Leschziner (ed.), Industrial hydraulics and multi-phase flows; Proc of 26th IAHR Congress, Volume 2, London, 11-15 September 1995. London : Thomas Telford.
Partheniades, E. 1965. Erosion and deposition of cohesive soils. Journal of Hydraulics Division 91: 105-138.
Petkovsek, G. & Roca, M. 2013. Importance of selection of processes for modeling long term reservoir sedimentation. In: Fukuoka et al. (ed.), Advances in River Sediment Research, Proc of the 12th International Symposium on river Sedimentation, Kyoto, Japan, 2-5 September 2013. London: Taylor and Francis Group.
Toniolo, H., Parker, G. & Voller, V. 2007. Role of Ponded Turbidity Currents in Reservoir Trap Efficiency. Journal of Hydraulic Engineering, 133(6): 579-595.

G. Petkovšekj
HRPP542 13
Westrich, B. & Juraschek, M. 1985. Flow transport capacity for suspended sediment. Proc. 21th Congress IAHR, 19-23 August 1985, Melbourne, Australia. Melbourne: Barton, A.C.T. Institution of Engineers.
White, R. 2001. Evacuating sediments from reservoirs. London: Thomas Telford.
Zhang, Y., Hu, Ch., Wang, Y. 2005. 1-D Mathematical model for heavily sediment-laden rivers and its applications. Proc. Of US-China Workshop on Advanced Computational Modelling in Hydroscience & Engineering. Oxford, Mississippi, USA, 19-21 September. Electronic edition.