Embed Size (px)
Citation preview
1 GWM
Edelweiss Investment Research
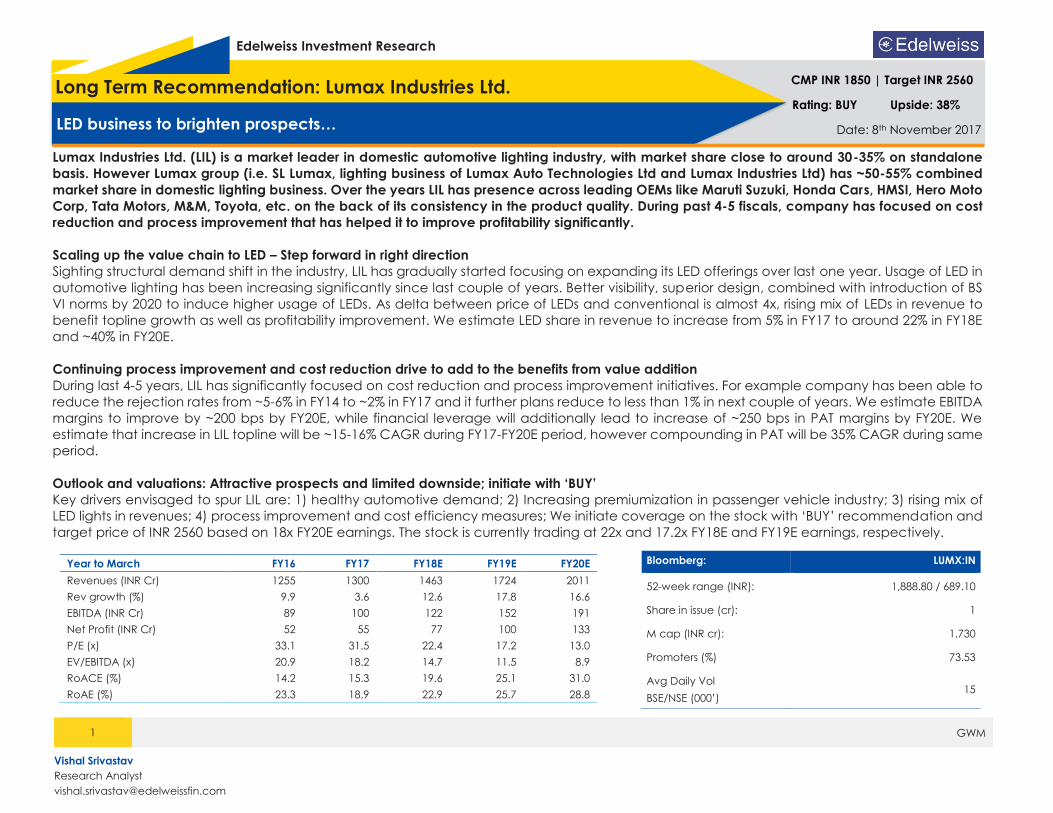
Lumax Industries Ltd. (LIL) is a market leader in domestic automotive lighting industry, with market share close to around 30-35% on standalone
basis. However Lumax group (i.e. SL Lumax, lighting business of Lumax Auto Technologies Ltd and Lumax Industries Ltd) has ~50-55% combined
market share in domestic lighting business. Over the years LIL has presence across leading OEMs like Maruti Suzuki, Honda Cars, HMSI, Hero Moto
Corp, Tata Motors, M&M, Toyota, etc. on the back of its consistency in the product quality. During past 4-5 fiscals, company has focused on cost
reduction and process improvement that has helped it to improve profitability significantly.
Scaling up the value chain to LED – Step forward in right direction
Sighting structural demand shift in the industry, LIL has gradually started focusing on expanding its LED offerings over last one year. Usage of LED in
automotive lighting has been increasing significantly since last couple of years. Better visibility, superior design, combined with introduction of BS
VI norms by 2020 to induce higher usage of LEDs. As delta between price of LEDs and conventional is almost 4x, rising mix of LEDs in revenue to
benefit topline growth as well as profitability improvement. We estimate LED share in revenue to increase from 5% in FY17 to around 22% in FY18E
and ~40% in FY20E.
Continuing process improvement and cost reduction drive to add to the benefits from value addition
During last 4-5 years, LIL has significantly focused on cost reduction and process improvement initiatives. For example company has been able to
reduce the rejection rates from ~5-6% in FY14 to ~2% in FY17 and it further plans reduce to less than 1% in next couple of years. We estimate EBITDA
margins to improve by ~200 bps by FY20E, while financial leverage will additionally lead to increase of ~250 bps in PAT margins by FY20E. We
estimate that increase in LIL topline will be ~15-16% CAGR during FY17-FY20E period, however compounding in PAT will be 35% CAGR during same
period.
Outlook and valuations: Attractive prospects and limited downside; initiate with ‘BUY’
Key drivers envisaged to spur LIL are: 1) healthy automotive demand; 2) Increasing premiumization in passenger vehicle industry; 3) rising mix of
LED lights in revenues; 4) process improvement and cost efficiency measures; We initiate coverage on the stock with ‘BUY’ recommendation and
target price of INR 2560 based on 18x FY20E earnings. The stock is currently trading at 22x and 17.2x FY18E and FY19E earnings, respectively.
Year to March FY16 FY17 FY18E FY19E FY20E
Revenues (INR Cr) 1255 1300 1463 1724 2011
Rev growth (%) 9.9 3.6 12.6 17.8 16.6
EBITDA (INR Cr) 89 100 122 152 191
Net Profit (INR Cr) 52 55 77 100 133
P/E (x) 33.1 31.5 22.4 17.2 13.0
EV/EBITDA (x) 20.9 18.2 14.7 11.5 8.9
RoACE (%) 14.2 15.3 19.6 25.1 31.0
RoAE (%) 23.3 18.9 22.9 25.7 28.8
Long Term Recommendation: Lumax Industries Ltd.
LED business to brighten prospects…
CMP INR 1850 | Target INR 2560
Rating: BUY Upside: 38%
Date: 8th November 2017
Bloomberg: LUMX:IN
52-week range (INR): 1,888.80 / 689.10
Share in issue (cr): 1
M cap (INR cr): 1,730
Promoters (%) 73.53
Avg Daily Vol
BSE/NSE (000’) 15
Vishal Srivastav
Research Analyst

Lumax Industries Ltd.
2 GWM
Healthy demand scenario for all key user industries in near to medium term period, owing to economic buoyancy to drive growth for LIL. Also rising
share of high realisation LED lightings and continued focus on improving efficiency is expected to spur growth not only in topline but also
profitability. At an expensive valuation of 17x FY19E and 13x FY20E, increasing ROCE from 15% in FY17 to 31% in FY20E and declining debt equity
from 0.3x in FY17 to 0.02x in FY20E is comforting
Healthy demand scenario
in key user segment in near
to medium
Significant value addition
with rise in LED penetration
and process improvement
to drive profitability
Improving margins, ROCE
and declining debt equity
to aid better valuation
FY15 FY16 FY17 FY18E FY19E FY20E
Revenue 1143 1255 1300 1463 1724 2011
EBITDA 59 89 100 122 152 191
EBITDA margins 5.2% 7.1% 7.7% 8.3% 8.8% 9.5%
PAT margins 1.5% 4.2% 4.2% 5.3% 5.8% 6.6%
At CMP, FY20E P/E is
13.0x
At Target Price,
FY20E PE is 18x
Upside of
38%
FY19E-20E RoCE of
25%-31%
FY15 FY16 FY17 FY18E FY19E FY20E
RoCE 8.1% 14.2% 15.3% 19.6% 25.1% 31.0%
Debt Equity 0.9 0.5 0.3 0.2 0.1 0.0
FY20E EPS CMP / Target
13x (CMP) 142.2 1850
18x (CMP) 142.2 2560
Lumax Industries Ltd.
3 GWM
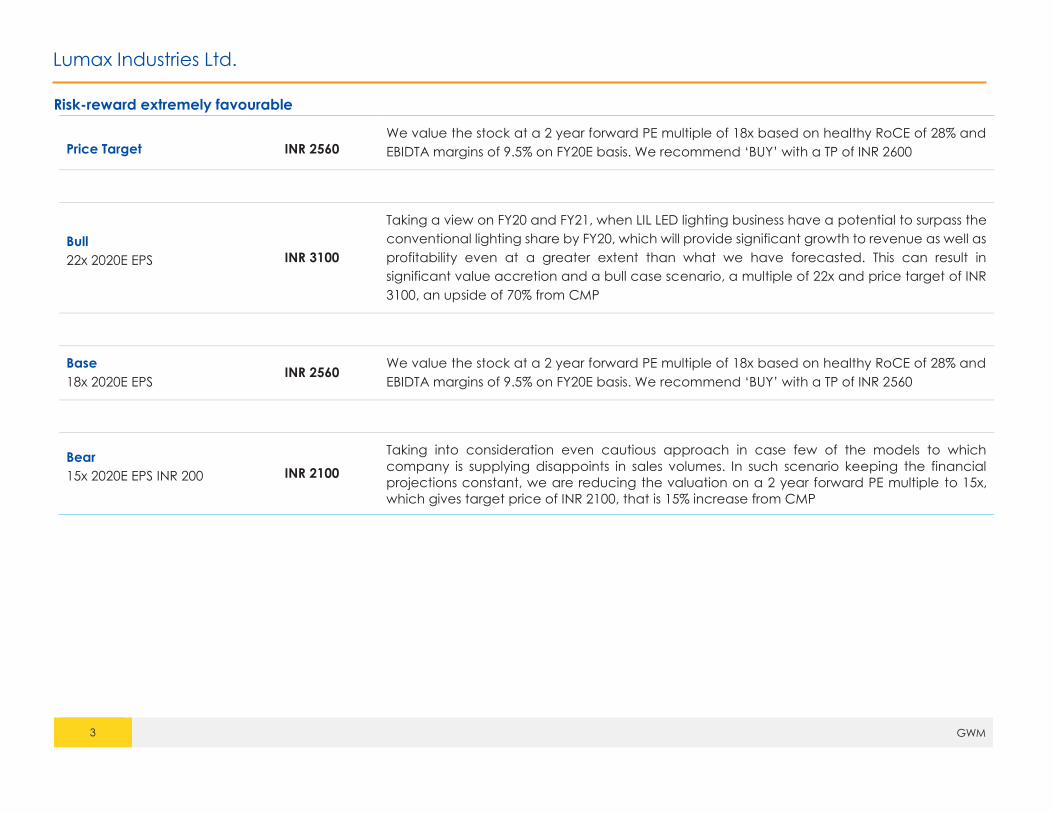
Risk-reward extremely favourable
Price Target INR 2560
We value the stock at a 2 year forward PE multiple of 18x based on healthy RoCE of 28% and
EBIDTA margins of 9.5% on FY20E basis. We recommend ‘BUY’ with a TP of INR 2600
Bull
22x 2020E EPS INR 3100
Taking a view on FY20 and FY21, when LIL LED lighting business have a potential to surpass the
conventional lighting share by FY20, which will provide significant growth to revenue as well as
profitability even at a greater extent than what we have forecasted. This can result in
significant value accretion and a bull case scenario, a multiple of 22x and price target of INR
3100, an upside of 70% from CMP
Base
18x 2020E EPS INR 2560
We value the stock at a 2 year forward PE multiple of 18x based on healthy RoCE of 28% and
EBIDTA margins of 9.5% on FY20E basis. We recommend ‘BUY’ with a TP of INR 2560
Bear
15x 2020E EPS INR 200 INR 2100
Taking into consideration even cautious approach in case few of the models to which
company is supplying disappoints in sales volumes. In such scenario keeping the financial
projections constant, we are reducing the valuation on a 2 year forward PE multiple to 15x,
which gives target price of INR 2100, that is 15% increase from CMP
Lumax Industries Ltd.
4 GWM
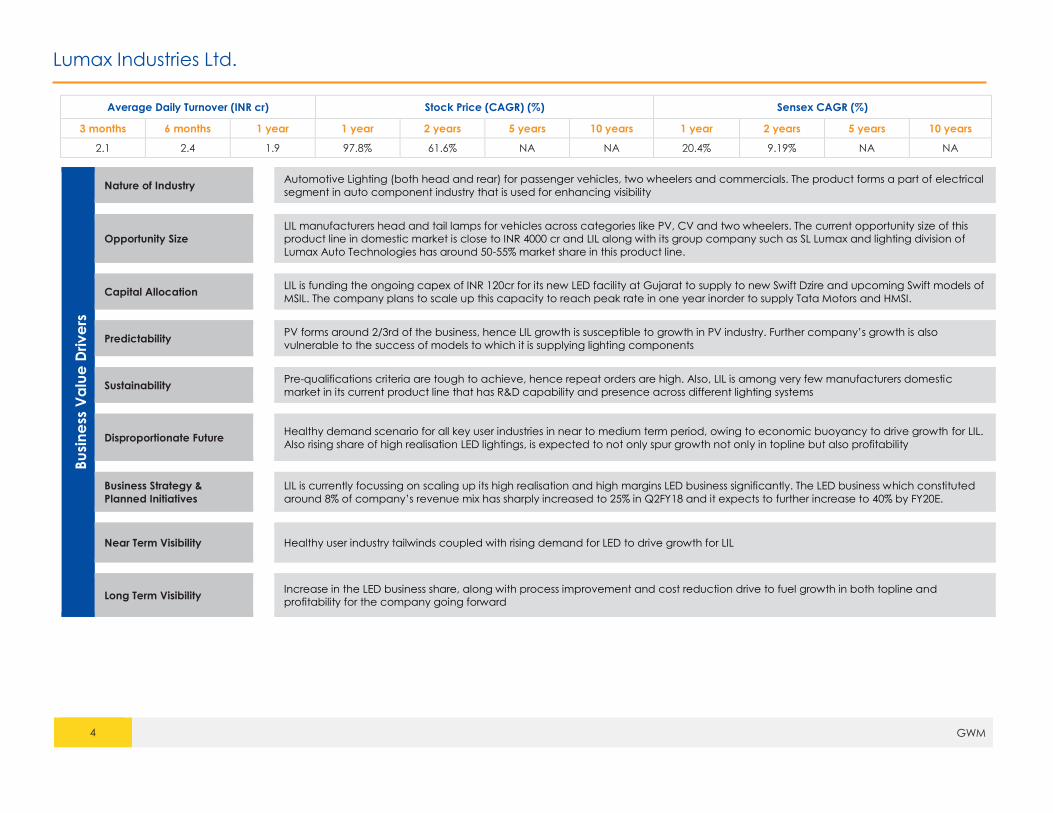
Average Daily Turnover (INR cr) Stock Price (CAGR) (%) Sensex CAGR (%)
3 months 6 months 1 year 1 year 2 years 5 years 10 years 1 year 2 years 5 years 10 years
2.1 2.4 1.9 97.8% 61.6% NA NA 20.4% 9.19% NA NA
Bu
sin
ess
Va
lue
Driv
ers
Nature of Industry Automotive Lighting (both head and rear) for passenger vehicles, two wheelers and commercials. The product forms a part of electrical
segment in auto component industry that is used for enhancing visibility
Opportunity Size LIL manufacturers head and tail lamps for vehicles across categories like PV, CV and two wheelers. The current opportunity size of this
product line in domestic market is close to INR 4000 cr and LIL along with its group company such as SL Lumax and lighting division of
Lumax Auto Technologies has around 50-55% market share in this product line.
Capital Allocation LIL is funding the ongoing capex of INR 120cr for its new LED facility at Gujarat to supply to new Swift Dzire and upcoming Swift models of
MSIL. The company plans to scale up this capacity to reach peak rate in one year inorder to supply Tata Motors and HMSI.
Predictability PV forms around 2/3rd of the business, hence LIL growth is susceptible to growth in PV industry. Further company’s growth is also
vulnerable to the success of models to which it is supplying lighting components
Sustainability Pre-qualifications criteria are tough to achieve, hence repeat orders are high. Also, LIL is among very few manufacturers domestic
market in its current product line that has R&D capability and presence across different lighting systems
Disproportionate Future Healthy demand scenario for all key user industries in near to medium term period, owing to economic buoyancy to drive growth for LIL.
Also rising share of high realisation LED lightings, is expected to not only spur growth not only in topline but also profitability
Business Strategy &
Planned Initiatives LIL is currently focussing on scaling up its high realisation and high margins LED business significantly. The LED business which constituted
around 8% of company’s revenue mix has sharply increased to 25% in Q2FY18 and it expects to further increase to 40% by FY20E.
Near Term Visibility Healthy user industry tailwinds coupled with rising demand for LED to drive growth for LIL
Long Term Visibility Increase in the LED business share, along with process improvement and cost reduction drive to fuel growth in both topline and
profitability for the company going forward
Lumax Industries Ltd.
5 GWM
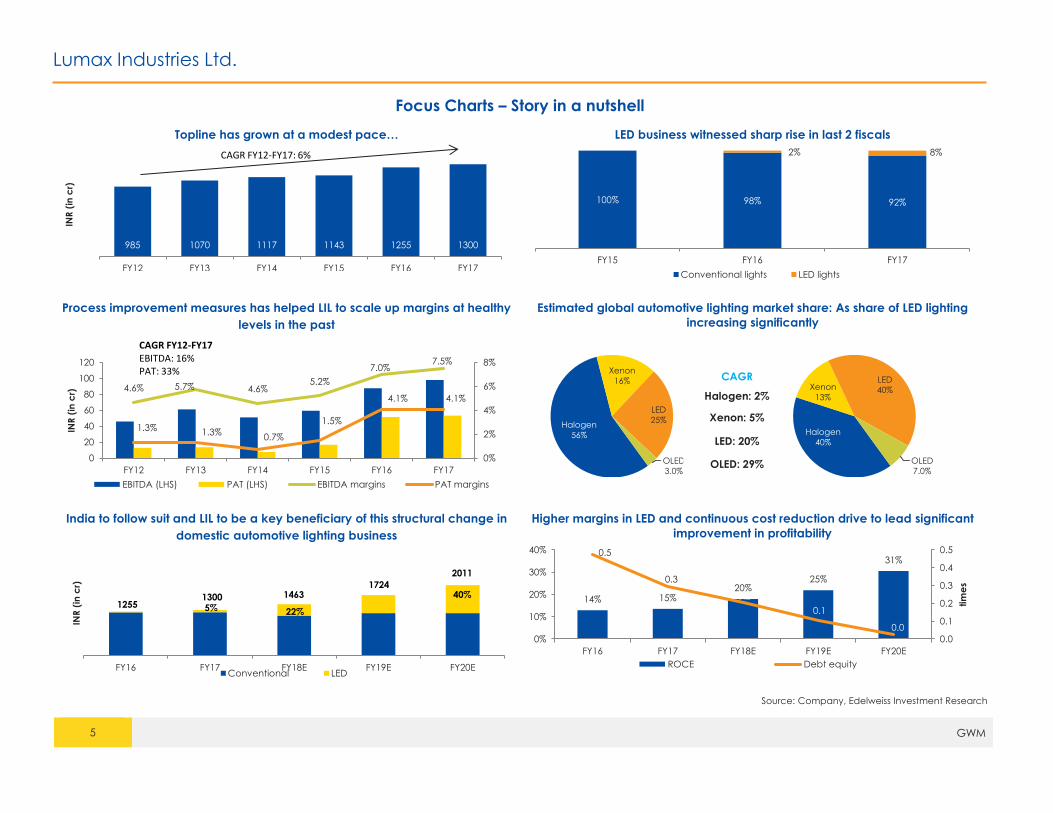
Focus Charts – Story in a nutshell
Topline has grown at a modest pace… LED business witnessed sharp rise in last 2 fiscals
Process improvement measures has helped LIL to scale up margins at healthy
levels in the past
Estimated global automotive lighting market share: As share of LED lighting
increasing significantly
India to follow suit and LIL to be a key beneficiary of this structural change in
domestic automotive lighting business
Higher margins in LED and continuous cost reduction drive to lead significant
improvement in profitability
Source: Company, Edelweiss Investment Research
985 1070 1117 1143 1255 1300
FY12 FY13 FY14 FY15 FY16 FY17
INR
(in
cr)
CAGR FY12-FY17: 6%
100% 98% 92%
2% 8%
FY15 FY16 FY17
Conventional lights LED lights
4.6% 5.7% 4.6%5.2%
7.0%7.5%
1.3% 1.3%0.7%
1.5%
4.1% 4.1%
0%
2%
4%
6%
8%
0
20
40
60
80
100
120
FY12 FY13 FY14 FY15 FY16 FY17
INR
(in
cr)
EBITDA (LHS) PAT (LHS) EBITDA margins PAT margins
CAGR FY12-FY17EBITDA: 16%PAT: 33%
FY16 FY17 FY18E FY19E FY20E
INR
(in
cr)
Conventional LED
12551300 1463
1724
2011
22%
40%
5%14% 15%
20%25%
31%0.5
0.3
0.2
0.1
0.0
0.0
0.1
0.2
0.3
0.4
0.5
0%
10%
20%
30%
40%
FY16 FY17 FY18E FY19E FY20E
tim
es
ROCE Debt equity
Halogen
56%
Xenon
16%
LED
25%
OLED
3.0%
Halogen
40%
Xenon
13%
LED
40%
OLED
7.0%
CAGR
Halogen: 2%
Xenon: 5%
LED: 20%
OLED: 29%
Lumax Industries Ltd.
6 GWM
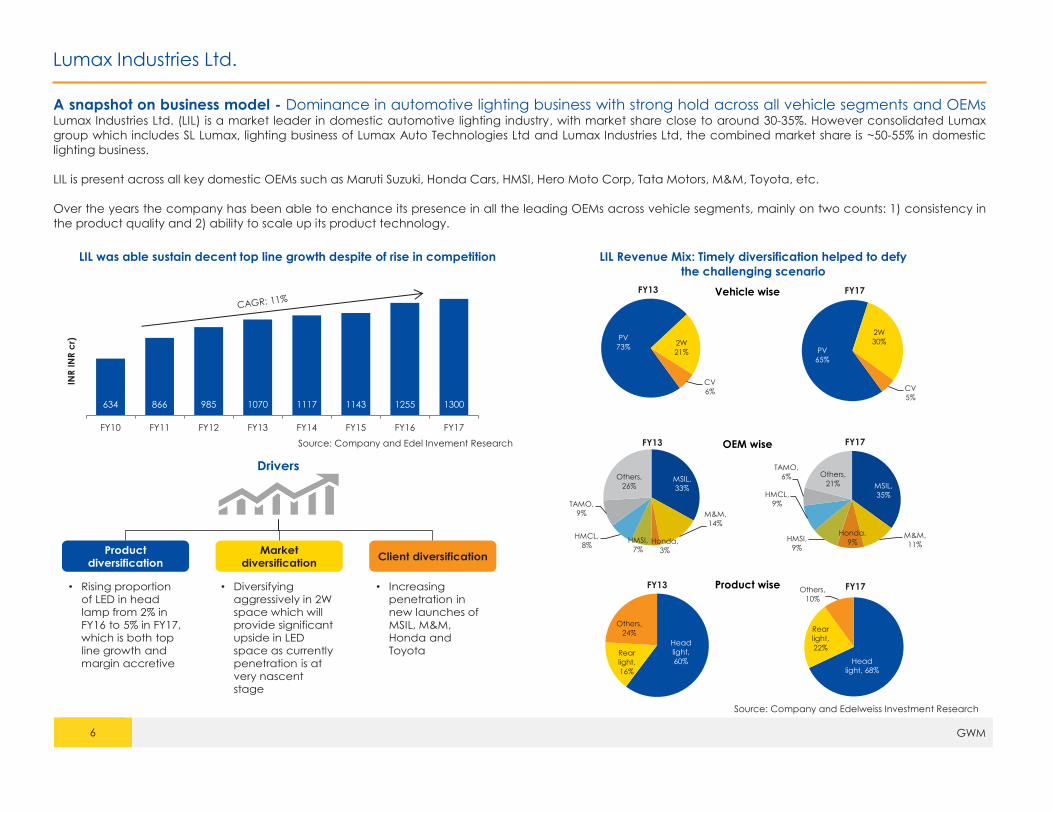
A snapshot on business model - Dominance in automotive lighting business with strong hold across all vehicle segments and OEMs Lumax Industries Ltd. (LIL) is a market leader in domestic automotive lighting industry, with market share close to around 30-35%. However consolidated Lumax
group which includes SL Lumax, lighting business of Lumax Auto Technologies Ltd and Lumax Industries Ltd, the combined market share is ~50-55% in domestic
lighting business.
LIL is present across all key domestic OEMs such as Maruti Suzuki, Honda Cars, HMSI, Hero Moto Corp, Tata Motors, M&M, Toyota, etc.
Over the years the company has been able to enchance its presence in all the leading OEMs across vehicle segments, mainly on two counts: 1) consistency in
the product quality and 2) ability to scale up its product technology.
LIL was able sustain decent top line growth despite of rise in competition LIL Revenue Mix: Timely diversification helped to defy
the challenging scenario
Source: Company and Edel Invement Research
Source: Company and Edelweiss Investment Research
634 866 985 1070 1117 1143 1255 1300
FY10 FY11 FY12 FY13 FY14 FY15 FY16 FY17
INR
IN
R c
r)
Drivers
Product
diversification
Market
diversificationClient diversification
• Rising proportion
of LED in head
lamp from 2% in
FY16 to 5% in FY17,
which is both top
line growth and
margin accretive
• Diversifying
aggressively in 2W
space which will
provide significant
upside in LED
space as currently
penetration is at
very nascent
stage
• Increasing
penetration in
new launches of
MSIL, M&M,
Honda and
Toyota
MSIL,
35%
M&M,
11%
Honda,
9%HMSI,
9%
HMCL,
9%
TAMO,
6% Others,
21%
FY17
Head
light, 68%
Rear
light,
22%
Others,
10%
FY17
Head
light,
60%Rear
light,
16%
Others,
24%
FY13
MSIL,
33%
M&M,
14%
Honda,
3%
HMSI,
7%
HMCL,
8%
TAMO,
9%
Others,
26%
FY13
PV
73%2W
21%
CV
6%
FY13
PV
65%
2W
30%
CV
5%
FY17Vehicle wise
OEM wise
Product wise
Lumax Industries Ltd.
7 GWM
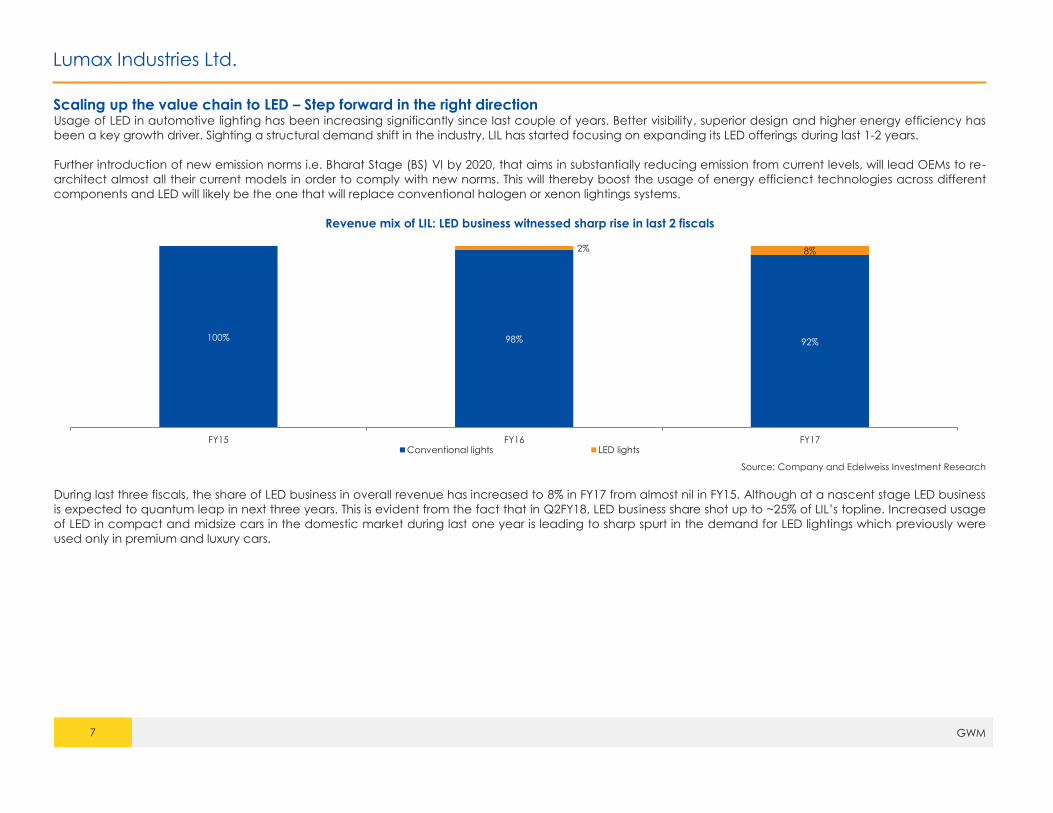
Scaling up the value chain to LED – Step forward in the right direction Usage of LED in automotive lighting has been increasing significantly since last couple of years. Better visibility, superior design and higher energy efficiency has
been a key growth driver. Sighting a structural demand shift in the industry, LIL has started focusing on expanding its LED offerings during last 1-2 years.
Further introduction of new emission norms i.e. Bharat Stage (BS) VI by 2020, that aims in substantially reducing emission from current levels, will lead OEMs to re-
architect almost all their current models in order to comply with new norms. This will thereby boost the usage of energy efficienct technologies across different
components and LED will likely be the one that will replace conventional halogen or xenon lightings systems.
Revenue mix of LIL: LED business witnessed sharp rise in last 2 fiscals
Source: Company and Edelweiss Investment Research
During last three fiscals, the share of LED business in overall revenue has increased to 8% in FY17 from almost nil in FY15. Although at a nascent stage LED business
is expected to quantum leap in next three years. This is evident from the fact that in Q2FY18, LED bus iness share shot up to ~25% of LIL’s topline. Increased usage
of LED in compact and midsize cars in the domestic market during last one year is leading to sharp spurt in the demand for LED lightings which previously were
used only in premium and luxury cars.
100% 98% 92%
2% 8%
FY15 FY16 FY17Conventional lights LED lights
Lumax Industries Ltd.
8 GWM
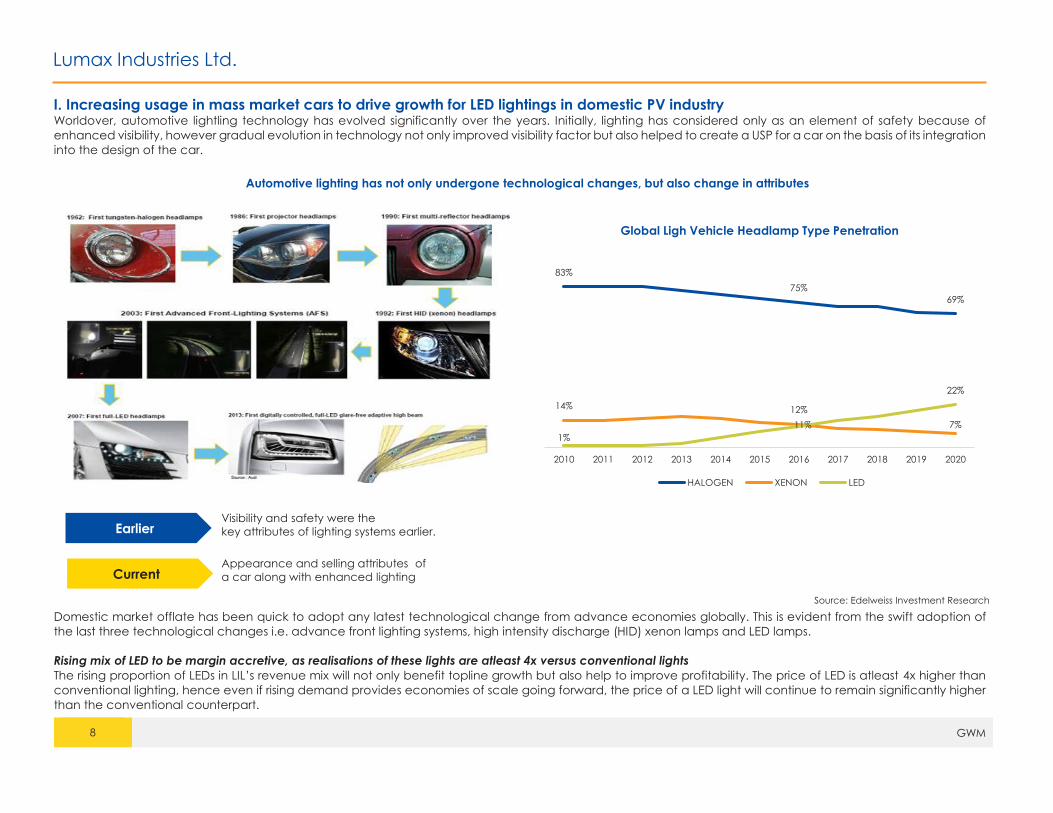
I. Increasing usage in mass market cars to drive growth for LED lightings in domestic PV industry Worldover, automotive lightling technology has evolved significantly over the years. Initially, lighting has considered only as an element of safety because of
enhanced visibility, however gradual evolution in technology not only improved visibility factor but also helped to create a USP for a car on the basis of its integration
into the design of the car.
Automotive lighting has not only undergone technological changes, but also change in attributes
Source: Edelweiss Investment Research
Domestic market offlate has been quick to adopt any latest technological change from advance economies globally. This is evident from the swift adoption of
the last three technological changes i.e. advance front lighting systems, high intensity discharge (HID) xenon lamps and LED lamps.
Rising mix of LED to be margin accretive, as realisations of these lights are atleast 4x versus conventional lights
The rising proportion of LEDs in LIL’s revenue mix will not only benefit topline growth but also help to improve profitability. The price of LED is atleast 4x higher than
conventional lighting, hence even if rising demand provides economies of scale going forward, the price of a LED light will continue to remain significantly higher
than the conventional counterpart.
EarlierVisibility and safety were the
key attributes of lighting systems earlier.
CurrentAppearance and selling attributes of
a car along with enhanced lighting
83%
75%
69%
14% 12%
7%
1%
11%
22%
2010 2011 2012 2013 2014 2015 2016 2017 2018 2019 2020
Global Ligh Vehicle Headlamp Type Penetration
HALOGEN XENON LED

Lumax Industries Ltd.
9 GWM
Price difference between LED and conventional lighting for same models
Source: Edelweiss Investment Research
India following a similar transition path towards LED as global market
Energy saving and low emission levels are driving LED’s popularity in automobile
lighting globally. This is evident from the increased usage of LED lighting in high
volume smaller cars which earlier was used only in luxury car models.
Decreasing prices of LED, higher energy efficiency and high luminosity is driving
increased usage of LEDs in vehicles.
Estimated global automotive lighting market share: LED lights to be one of the
fastest growing in near to medium term period
Source: Company and Edelweiss Investment Research
The present market size of LED in domestic automotive lights is estimated
to be minuscule i.e. market share of around 10-12%.
Nevertheless, similar to global transition, rapid increase in models having
LED offerings, particularly in the mass market small and mid-size car
categories, demand for LED lights will likely increase manyfold in the near-
to-medium term.
Estimated composition in domestic automotive lighting market
Source: Edelweiss Investment Research
Popularity of LED models increasing at a rapid pace…
One component that is expected to certainly undergo change in the
near future as the country prepares for transition into the next level of
emission norms, is autmotive lighting.
Empahsis on energy conservation will dirve replacement of the high
energy consuming halogen and xenon lamps with LEDs.
Further comparatively greater visibility and better design will lead to
demand for LED rising specifically in mass market compact cars, small
SUVs and mid-size cars.
Normal Dzire lamps LED Dzire lamps
INR 3500-4000 INR 16000-18000
Normal Honda City lamps LED Honda City lamps
INR 7000-8000INR 20000-22000
Halogen
56%
Xenon
16%
LED
25%
OLED
3.0%
Halogen
40%
Xenon
13%
LED
40%
OLED
7.0%
3-5% 10-12%
FY16 FY17
LED Conventional
CAGR
Halogen: 2%
Xenon: 5%
LED: 20%
OLED: 29%

Lumax Industries Ltd.
10 GWM
Car models with LED variants have increased significantly in last 5 years
Source: Company and Edelweiss Investment Research
… however, LED penetration still nascent in two-wheeler industry
Two wheeler industry signficantly lags PV in the usage of LED. This is evident from the fact that two wheeler models with LED variants constitutes merely 6-7% in the
overall industry offerings. Hence we believe, the penetration of LED in two wheelers will increase at a rapid pace in the near term.
Car models with LED variants have increased significantly in last 5 years
Source: Company and Edelweiss Investment Research
5%
20%28%
FY13 FY17 Apr-Jun FY18
% Car models with LED variants % Car models without LED variants
3% 5% 7%
FY13 FY16 FY17
% 2W models with LED % 2W models without LED

Lumax Industries Ltd.
11 GWM
II. Surpassing industry growth on most ocassions – A comforting scenario Being a market leader in the automotive lighting industry, LIL’s overall growth rates mirrors the key user industry’s (two-wheeler, CV and PV) growth trajectory.
However, effective diversification has ensured that LIL’s revenue growth has surpassed industry growth on most occasions since FY10.
LIL revenue growth vs key user industry growth trajectory
Source: Company and Edelweiss Investment Research
PVs constituted close to 2/3rd of LIL’s business in FY17, however focus on two wheeler has increased significantly in last 4-5 years
Traditionaly, PVs have been the mainstay of LIL’s business but over the last 4-5 years LIL has been able to increase its two-wheeler business at a considerable pace
i.e. from ~21% in FY13 to ~30% in FY17. Incremental new orders from players like HMCL, Yamaha, and Suzuki have helped the company negate the slowdown in
growth from PV business.
Vehicle segment wise revenue share
CAGR FY13-FY17
PV: 2%
Two wheeler: 15%
CV: 0%
Source: Company and Edelweiss Investment Research
0%
5%
10%
15%
20%
25%
30%
35%
40%
FY10 FY11 FY12 FY13 FY14 FY15 FY16 FY17
Key user industry growth Sales revenues growth
CAGR FY10-FY17
Revenue growth: 11%
Key user industry: 9%
PV
65%
2W
30%
CV
5%
FY17
PV
68%
2W
28%
CV
4%
H1FY18
PV
73%2W
21%
CV
6%
FY13
Lumax Industries Ltd.
12 GWM
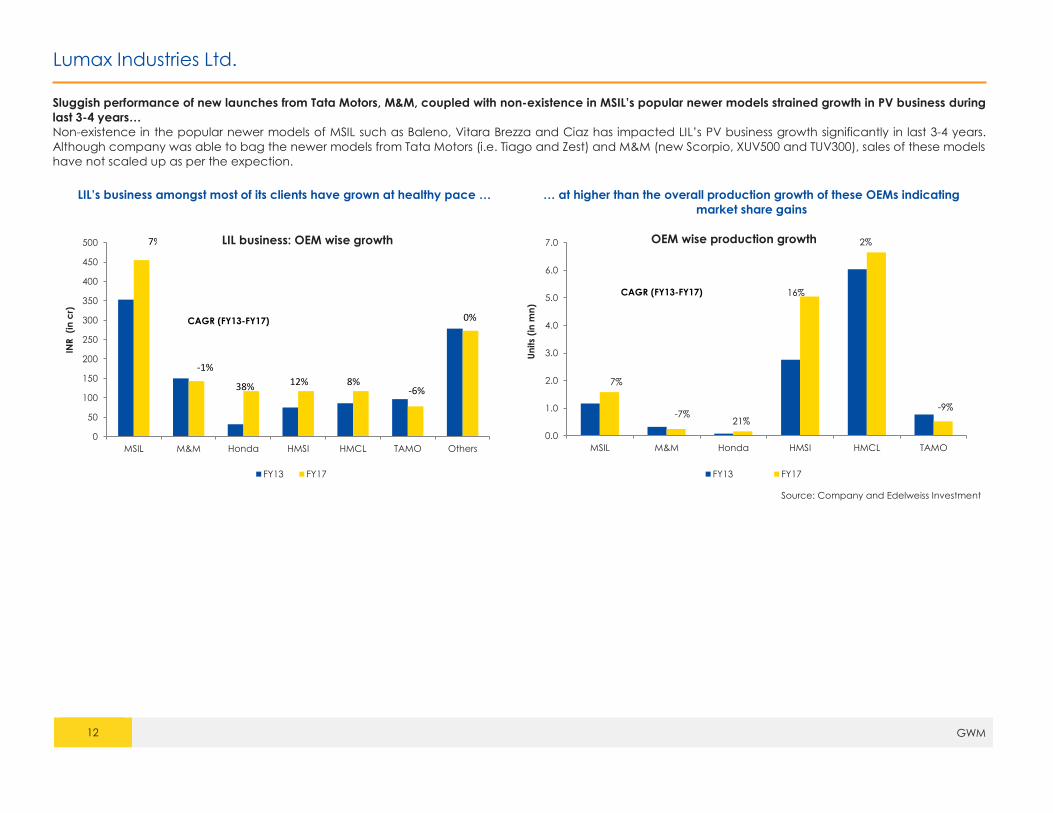
Sluggish performance of new launches from Tata Motors, M&M, coupled with non-existence in MSIL’s popular newer models strained growth in PV business during
last 3-4 years…
Non-existence in the popular newer models of MSIL such as Baleno, Vitara Brezza and Ciaz has impacted LIL’s PV business growth significantly in last 3-4 years.
Although company was able to bag the newer models from Tata Motors (i.e. Tiago and Zest) and M&M (new Scorpio, XUV500 and TUV300), sales of these models
have not scaled up as per the expection.
LIL’s business amongst most of its clients have grown at healthy pace … … at higher than the overall production growth of these OEMs indicating
market share gains
Source: Company and Edelweiss Investment
0
50
100
150
200
250
300
350
400
450
500
MSIL M&M Honda HMSI HMCL TAMO Others
INR
(i
n c
r)
FY13 FY17
7%
-1%
38% 12% 8%-6%
0%CAGR (FY13-FY17)
0.0
1.0
2.0
3.0
4.0
5.0
6.0
7.0
MSIL M&M Honda HMSI HMCL TAMO
Un
its
(in
mn
)
FY13 FY17
7%
-7%21%
16%
2%
-9%
CAGR (FY13-FY17)
LIL business: OEM wise growth OEM wise production growth
Lumax Industries Ltd.
13 GWM
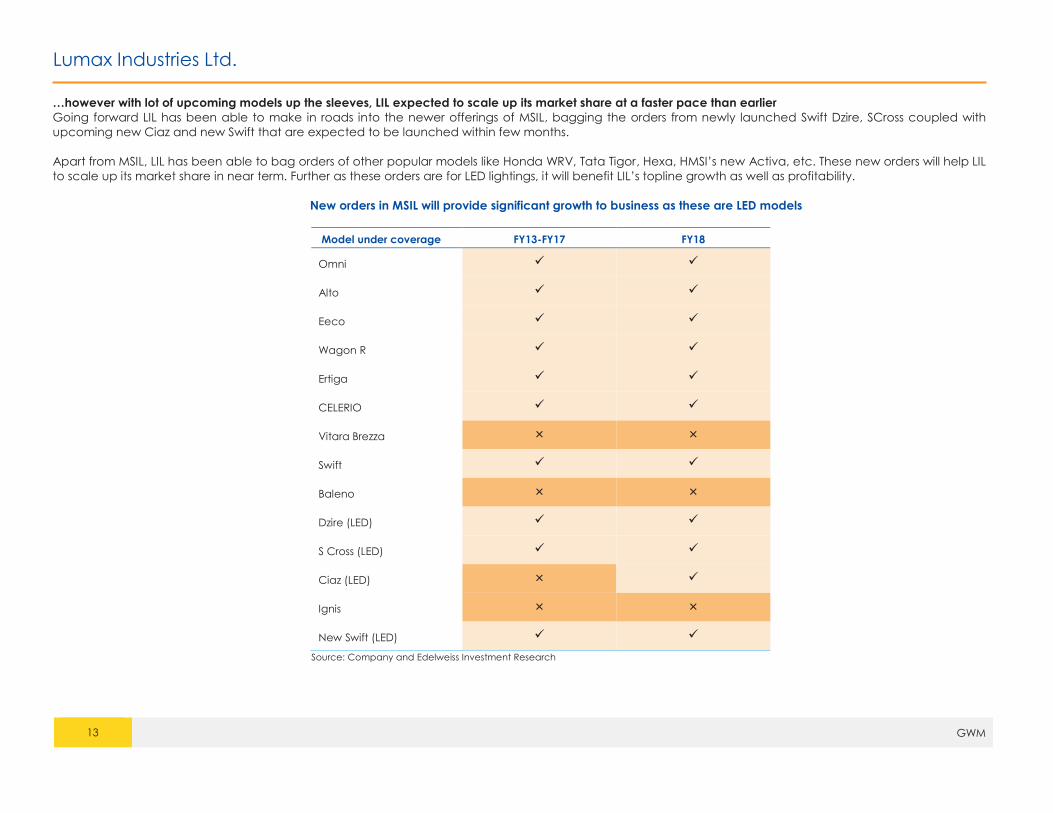
…however with lot of upcoming models up the sleeves, LIL expected to scale up its market share at a faster pace than earlier
Going forward LIL has been able to make in roads into the newer offerings of MSIL, bagging the orders from newly launched Swift Dzire, SCross coupled with
upcoming new Ciaz and new Swift that are expected to be launched within few months.
Apart from MSIL, LIL has been able to bag orders of other popular models like Honda WRV, Tata Tigor, Hexa, HMSI’s new Activa, etc. These new orders will help LIL
to scale up its market share in near term. Further as these orders are for LED lightings, it will benefit LIL’s topline growth as well as profitability.
New orders in MSIL will provide significant growth to business as these are LED models
Source: Company and Edelweiss Investment Research
Model under coverage FY13-FY17 FY18
Omni
Alto
Eeco
Wagon R
Ertiga
CELERIO
Vitara Brezza × ×
Swift
Baleno × ×
Dzire (LED)
S Cross (LED)
Ciaz (LED) ×
Ignis × ×
New Swift (LED)

Lumax Industries Ltd.
14 GWM
III. Introduction of BS VI would provide significant push in the usage of LED lamps in automotive industry Introduction of BS VI would require rearchitecting almost all the vehicle module as new norms significantly cuts down the emission level from the current one. This
would consequently lead to rediesigning and refurbishing of majority of existing components with lighter and energy efficient components to make the vehicle
lighter and fuel efficient.
Drop in prices of LED driven by economies of scale and stringent emission norms to fuel growth for LED lights
As benefits of economies of scale starts seeping in with the rise in the usage, the price of LED automotive lighting is becoming affordable even to install in small
and midsize cars, which 3-4 years back were installed only in premium and luxury cars.
We believe the LED automotive lighting market is in a high growth phase. Moreover, as the awareness to make vehicles more energy efficient is increasing, demand
for LED is expected to rise considerably from this levels in the domestic market.
Product Life Cycle Analysis of Automotive Lighting Industry
Source: Edelweiss Investment Research
GR
OW
TH
Laser
OLED
LED
HalogenXenon
EMERGING GROWTH MATURITY DECLINETIME
Product Life Cycle Analysis of Automotive Lighting Industry
Lumax Industries Ltd.
15 GWM
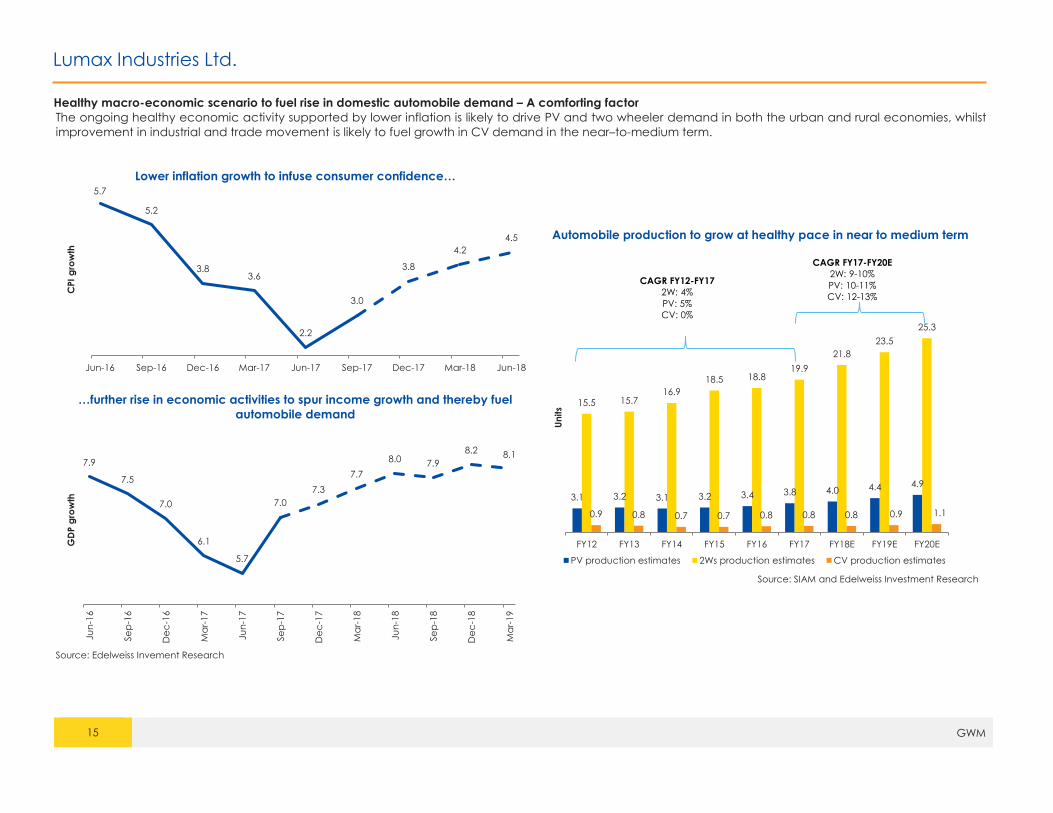
Healthy macro-economic scenario to fuel rise in domestic automobile demand – A comforting factor
The ongoing healthy economic activity supported by lower inflation is likely to drive PV and two wheeler demand in both the urban and rural economies, whilst
improvement in industrial and trade movement is likely to fuel growth in CV demand in the near–to-medium term.
Lower inflation growth to infuse consumer confidence…
…further rise in economic activities to spur income growth and thereby fuel
automobile demand
Automobile production to grow at healthy pace in near to medium term
Source: SIAM and Edelweiss Investment Research
Source: Edelweiss Invement Research
5.7
5.2
3.83.6
2.2
3.0
3.8
4.2
4.5
Jun-16 Sep-16 Dec-16 Mar-17 Jun-17 Sep-17 Dec-17 Mar-18 Jun-18
CPI
gro
wth
7.9
7.5
7.0
6.1
5.7
7.0
7.3
7.7
8.0 7.9
8.2 8.1
Ju
n-1
6
Se
p-1
6
De
c-1
6
Ma
r-1
7
Ju
n-1
7
Se
p-1
7
De
c-1
7
Ma
r-1
8
Ju
n-1
8
Se
p-1
8
De
c-1
8
Ma
r-1
9
GD
P g
row
th 3.1 3.2 3.1 3.2 3.4 3.8 4.0 4.4 4.9
15.5 15.716.9
18.5 18.819.9
21.8
23.5
25.3
0.9 0.8 0.7 0.7 0.8 0.8 0.8 0.9 1.1
FY12 FY13 FY14 FY15 FY16 FY17 FY18E FY19E FY20E
Un
its
PV production estimates 2Ws production estimates CV production estimates
CAGR FY12-FY17
2W: 4%
PV: 5%
CV: 0%
CAGR FY17-FY20E
2W: 9-10%
PV: 10-11%
CV: 12-13%
Lumax Industries Ltd.
16 GWM
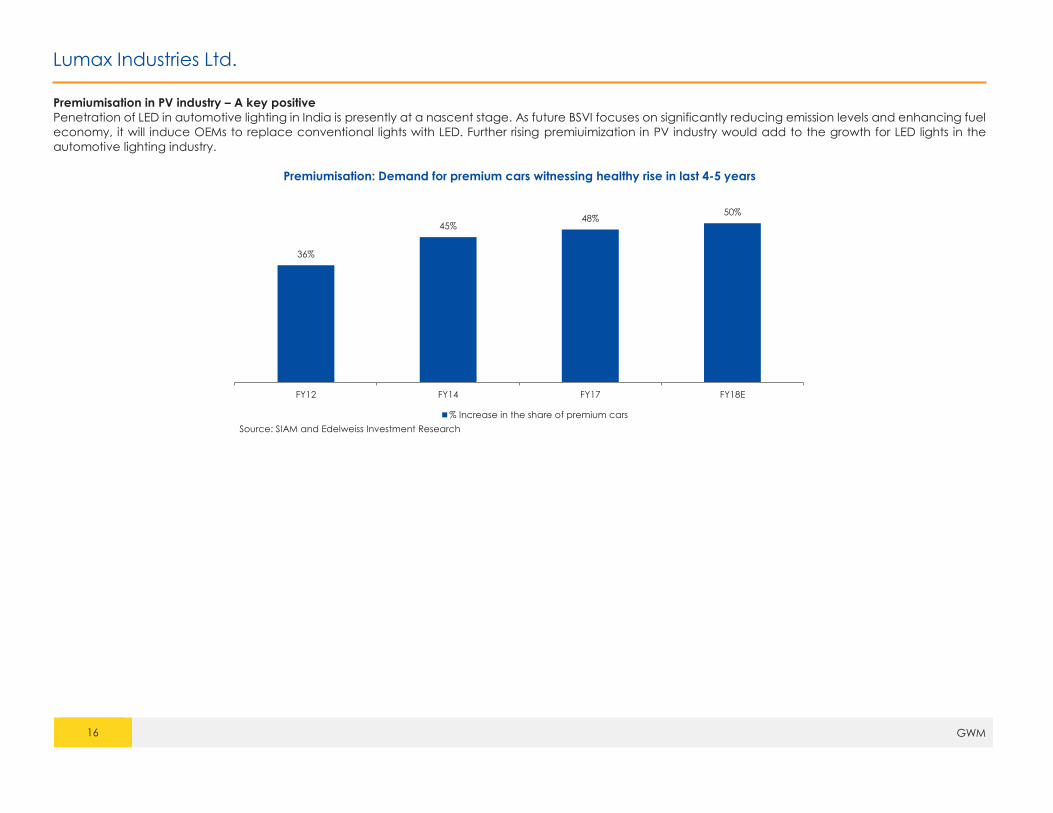
Premiumisation in PV industry – A key positive
Penetration of LED in automotive lighting in India is presently at a nascent stage. As future BSVI focuses on significantly reducing emission levels and enhancing fuel
economy, it will induce OEMs to replace conventional lights with LED. Further rising premiuimization in PV industry would add to the growth for LED lights in the
automotive lighting industry.
Premiumisation: Demand for premium cars witnessing healthy rise in last 4-5 years
Source: SIAM and Edelweiss Investment Research
36%
45%48%
50%
FY12 FY14 FY17 FY18E
% Increase in the share of premium cars
Lumax Industries Ltd.
17 GWM
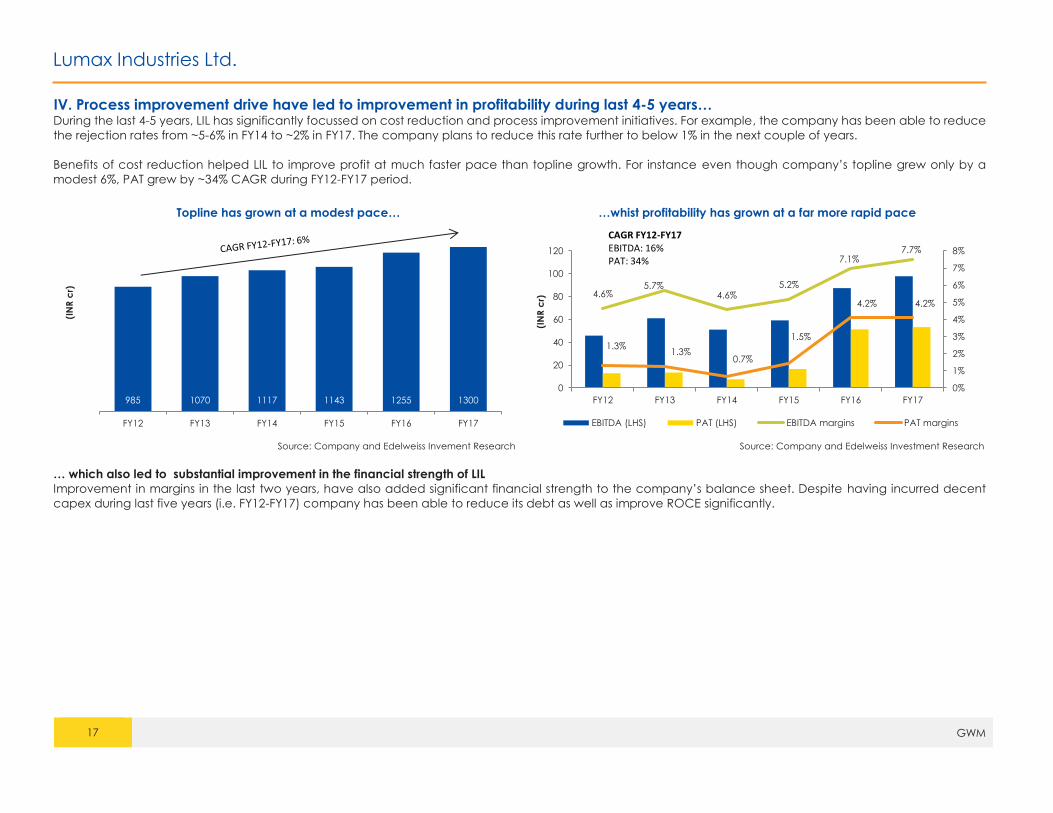
IV. Process improvement drive have led to improvement in profitability during last 4-5 years… During the last 4-5 years, LIL has significantly focussed on cost reduction and process improvement initiatives. For example, the company has been able to reduce
the rejection rates from ~5-6% in FY14 to ~2% in FY17. The company plans to reduce this rate further to below 1% in the next couple of years.
Benefits of cost reduction helped LIL to improve profit at much faster pace than topline growth. For instance even though company’s topline grew only by a
modest 6%, PAT grew by ~34% CAGR during FY12-FY17 period.
Topline has grown at a modest pace… …whist profitability has grown at a far more rapid pace
Source: Company and Edelweiss Invement Research Source: Company and Edelweiss Investment Research
… which also led to substantial improvement in the financial strength of LIL
Improvement in margins in the last two years, have also added significant financial strength to the company’s balance sheet. Despite having incurred decent
capex during last five years (i.e. FY12-FY17) company has been able to reduce its debt as well as improve ROCE significantly.
985 1070 1117 1143 1255 1300
FY12 FY13 FY14 FY15 FY16 FY17
(IN
R c
r)
4.6%5.7%
4.6%5.2%
7.1%7.7%
1.3%1.3%
0.7%
1.5%
4.2% 4.2%
0%
1%
2%
3%
4%
5%
6%
7%
8%
0
20
40
60
80
100
120
FY12 FY13 FY14 FY15 FY16 FY17
(IN
R c
r)
EBITDA (LHS) PAT (LHS) EBITDA margins PAT margins
CAGR FY12-FY17EBITDA: 16%PAT: 34%
Lumax Industries Ltd.
18 GWM
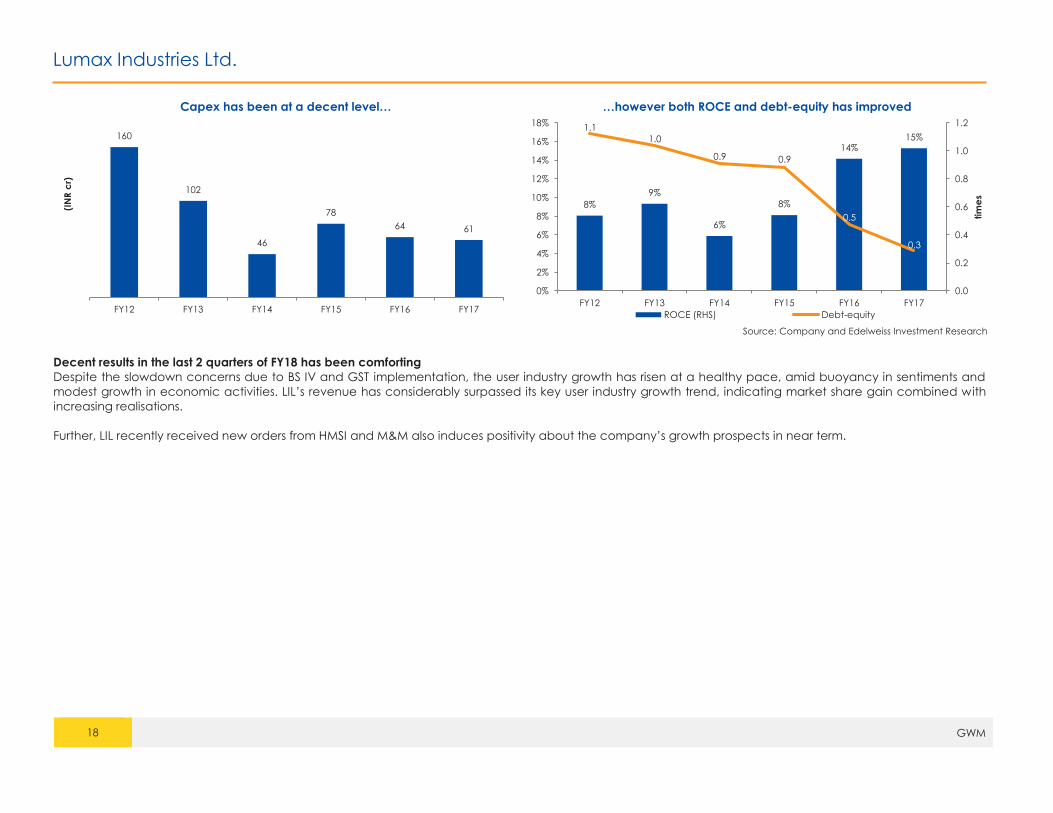
Capex has been at a decent level… …however both ROCE and debt-equity has improved
Source: Company and Edelweiss Investment Research
Decent results in the last 2 quarters of FY18 has been comforting
Despite the slowdown concerns due to BS IV and GST implementation, the user industry growth has risen at a healthy pace, amid buoyancy in sentiments and
modest growth in economic activities. LIL’s revenue has considerably surpassed its key user industry growth trend, indicating market share gain combined w ith
increasing realisations.
Further, LIL recently received new orders from HMSI and M&M also induces positivity about the company’s growth prospects in near term.
160
102
46
78
64 61
FY12 FY13 FY14 FY15 FY16 FY17
(IN
R c
r)
8%
9%
6%
8%
14%15%
1.1
1.0
0.9 0.9
0.5
0.3
0.0
0.2
0.4
0.6
0.8
1.0
1.2
0%
2%
4%
6%
8%
10%
12%
14%
16%
18%
FY12 FY13 FY14 FY15 FY16 FY17
tim
es
ROCE (RHS) Debt-equity

Lumax Industries Ltd.
19 GWM
Quarterly financials
(INR cr) Q2FY17 Q2FY18 Y-o-Y growth H1FY17 H1FY18 Y-o-Y growth
Net Sales 304.2 379.6 25% 607.0 720.1 19%
Other Operating Income 0.0 0.0 0.0
Total Income 304.2 379.6 25% 607.0 720.1 19%
Raw material 188.8 245.8 30% 381.7 469.0 23%
Employee Expenses 40.2 45.2 12% 78.3 88.6 13%
Other Expenses 49.7 58.4 18% 98.2 107.7 10%
TOTAL EXPENDITURE 278.6 349.4 25% 558.1 665.2 19%
EBITDA 25.6 30.2 18% 48.9 54.9 12%
Other Income 1.1 0.8 -31% 6.1 2.5 -58%
EBITDA incl OI 26.7 31.0 16% 55.0 57.4 4%
Depreciation 10.4 11.6 12% 20.6 22.8 11%
PBIT 16.3 19.4 19% 34.4 34.6 1%
Interest 2.9 1.2 -60% 5.9 2.4 -59%
PBT 13.4 18.2 36% 28.5 32.2 13%
Profit from associates 6.4 6.7 4% 6.4 13.8 114%
PBT 19.9 24.9 26% 34.9 46.0 32%
Tax 2.9 4.2 46% 5.1 10.0 98%
PAT 17.0 20.8 22% 29.8 35.9 20%
GRM 37.9% 35.3% 37.1% 34.9%
EBITDA margins 8.4% 8.0% 8.1% 7.6%
PAT margins 5.6% 5.5% 4.9% 5.0%
Key user industry production growth (units)
PV 1013424 1034024 2% 1863993 1961175 5%
CV 188937 210971 12% 394549 373048 -5%
Two wheeler 5567085 6267056 13% 10740654 11904287 11%
Total 6769446 7512051 11% 12999196 14238510 10%
Source: Company and Edelweiss Investment Research
Lumax Industries Ltd.
20 GWM
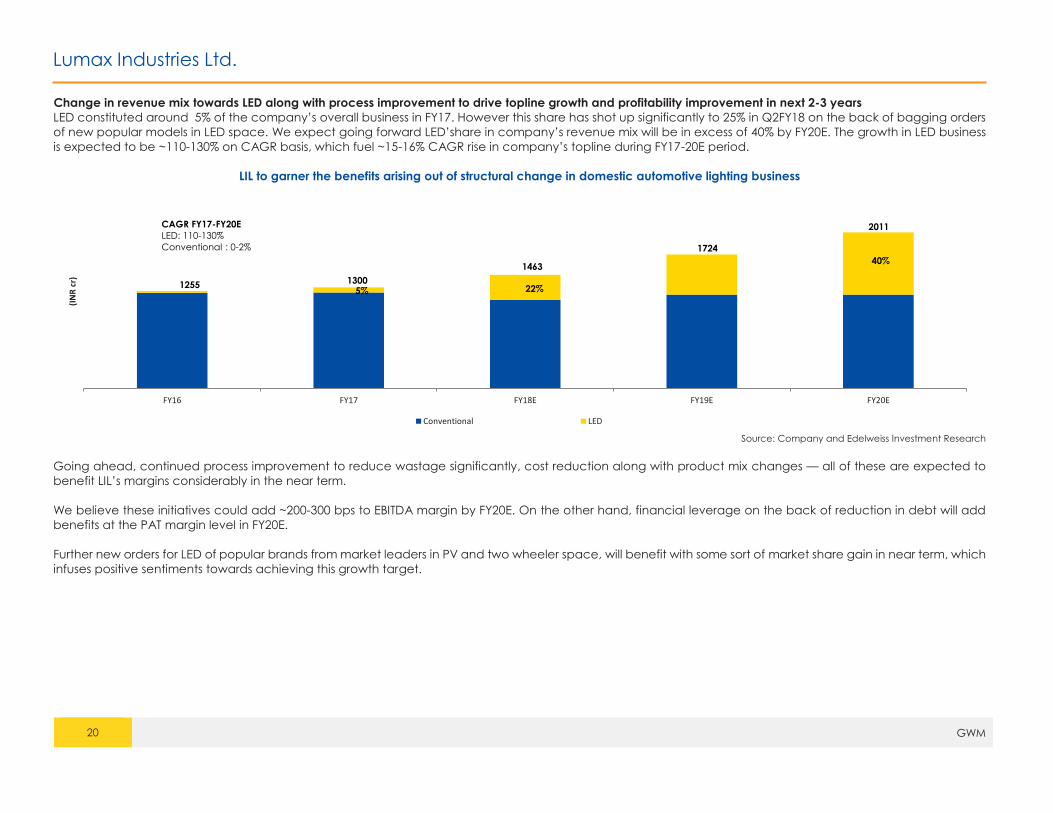
Change in revenue mix towards LED along with process improvement to drive topline growth and profitability improvement in next 2-3 years
LED constituted around 5% of the company’s overall business in FY17. However this share has shot up significantly to 25% in Q2FY18 on the back of bagging orders
of new popular models in LED space. We expect going forward LED’share in company’s revenue mix will be in excess of 40% by FY20E. The growth in LED business
is expected to be ~110-130% on CAGR basis, which fuel ~15-16% CAGR rise in company’s topline during FY17-20E period.
LIL to garner the benefits arising out of structural change in domestic automotive lighting business
Source: Company and Edelweiss Investment Research
Going ahead, continued process improvement to reduce wastage significantly, cost reduction along with product mix changes — all of these are expected to
benefit LIL’s margins considerably in the near term.
We believe these initiatives could add ~200-300 bps to EBITDA margin by FY20E. On the other hand, financial leverage on the back of reduction in debt will add
benefits at the PAT margin level in FY20E.
Further new orders for LED of popular brands from market leaders in PV and two wheeler space, will benefit with some sort of market share gain in near term, which
infuses positive sentiments towards achieving this growth target.
FY16 FY17 FY18E FY19E FY20E
(IN
R c
r)
Conventional LED
CAGR FY17-FY20E
LED: 110-130%
Conventional : 0-2%
1255 1300
1463
1724
2011
22%
40%
5%
Lumax Industries Ltd.
21 GWM
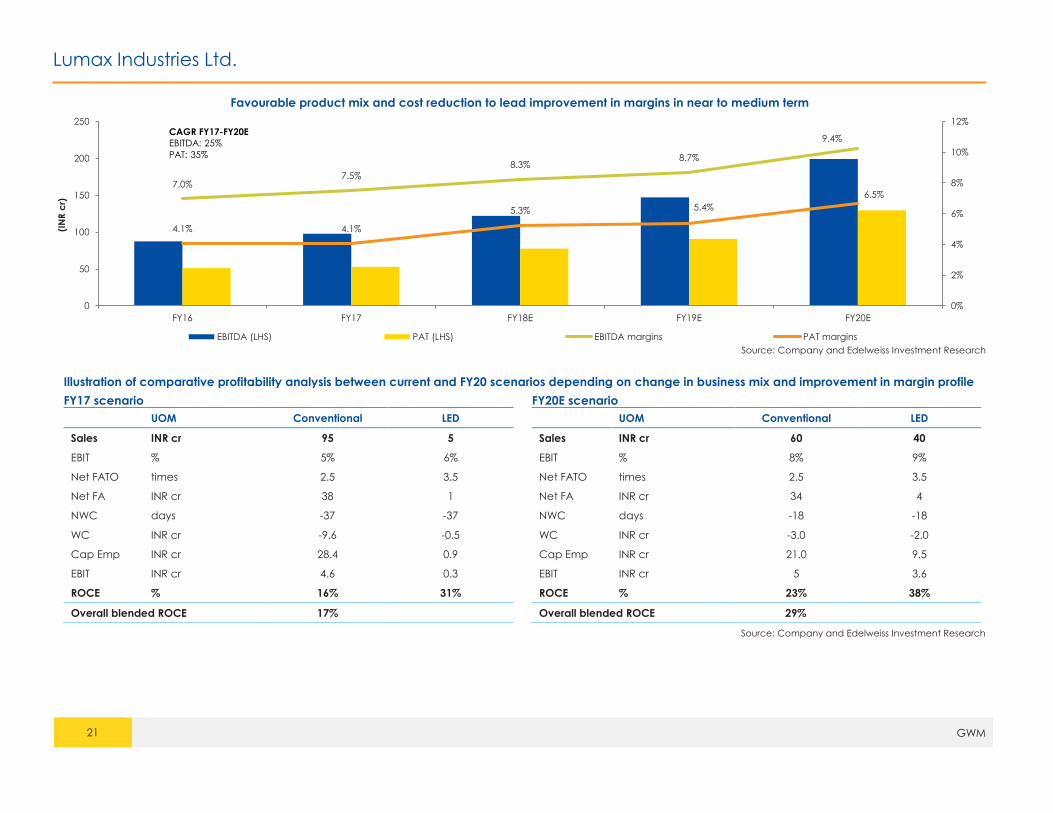
Favourable product mix and cost reduction to lead improvement in margins in near to medium term
Source: Company and Edelweiss Investment Research
Illustration of comparative profitability analysis between current and FY20 scenarios depending on change in business mix and improvement in margin profile
FY17 scenario
UOM Conventional LED
Sales INR cr 95 5
EBIT % 5% 6%
Net FATO times 2.5 3.5
Net FA INR cr 38 1
NWC days -37 -37
WC INR cr -9.6 -0.5
Cap Emp INR cr 28.4 0.9
EBIT INR cr 4.6 0.3
ROCE % 16% 31%
Overall blended ROCE 17%
FY20E scenario
UOM Conventional LED
Sales INR cr 60 40
EBIT % 8% 9%
Net FATO times 2.5 3.5
Net FA INR cr 34 4
NWC days -18 -18
WC INR cr -3.0 -2.0
Cap Emp INR cr 21.0 9.5
EBIT INR cr 5 3.6
ROCE % 23% 38%
Overall blended ROCE 29%
Source: Company and Edelweiss Investment Research
7.0%7.5%
8.3%8.7%
9.4%
4.1% 4.1%
5.3% 5.4%
6.5%
0%
2%
4%
6%
8%
10%
12%
0
50
100
150
200
250
FY16 FY17 FY18E FY19E FY20E
(IN
R c
r)
EBITDA (LHS) PAT (LHS) EBITDA margins PAT margins
CAGR FY17-FY20E
EBITDA: 25%
PAT: 35%
Lumax Industries Ltd.
22 GWM
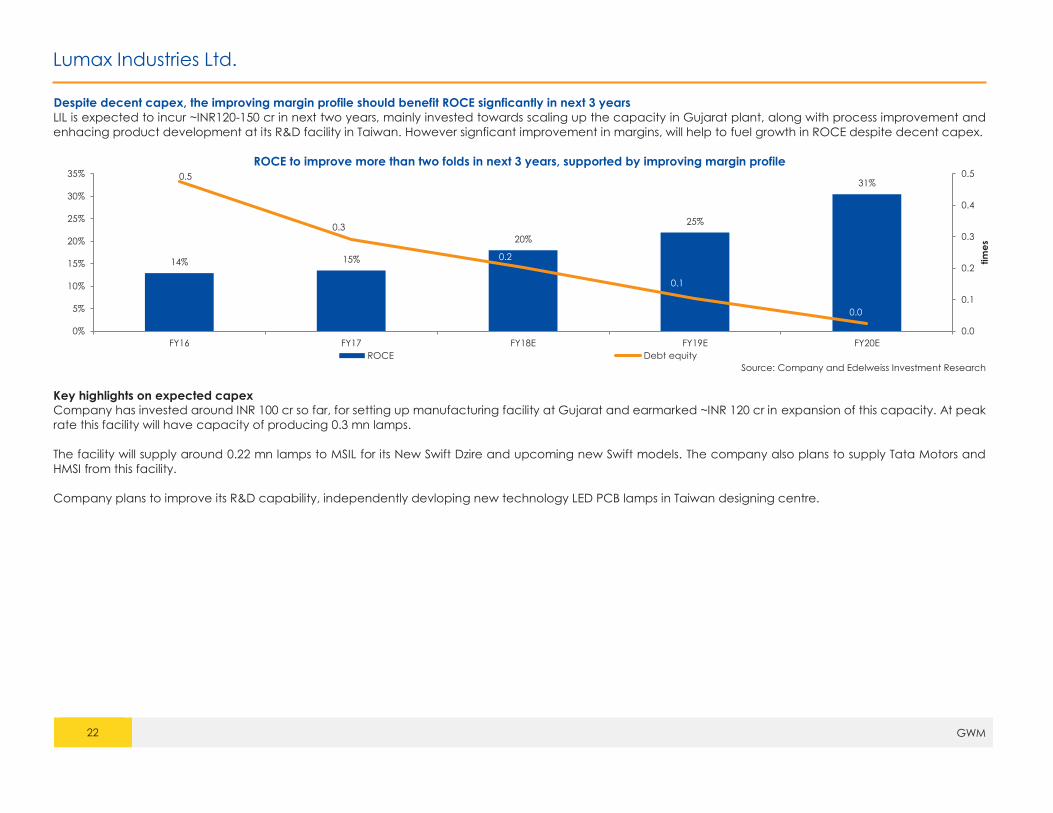
Despite decent capex, the improving margin profile should benefit ROCE signficantly in next 3 years
LIL is expected to incur ~INR120-150 cr in next two years, mainly invested towards scaling up the capacity in Gujarat plant, along with process improvement and
enhacing product development at its R&D facility in Taiwan. However signficant improvement in margins, will help to fuel growth in ROCE despite decent capex.
ROCE to improve more than two folds in next 3 years, supported by improving margin profile
Source: Company and Edelweiss Investment Research
Key highlights on expected capex
Company has invested around INR 100 cr so far, for setting up manufacturing facility at Gujarat and earmarked ~INR 120 cr in expansion of this capacity. At peak
rate this facility will have capacity of producing 0.3 mn lamps.
The facility will supply around 0.22 mn lamps to MSIL for its New Swift Dzire and upcoming new Swift models. The company also plans to supply Tata Motors and
HMSI from this facility.
Company plans to improve its R&D capability, independently devloping new technology LED PCB lamps in Taiwan designing centre.
14% 15%
20%
25%
31%0.5
0.3
0.2
0.1
0.0
0.0
0.1
0.2
0.3
0.4
0.5
0%
5%
10%
15%
20%
25%
30%
35%
FY16 FY17 FY18E FY19E FY20E
tim
es
ROCE Debt equity

Lumax Industries Ltd.
23 GWM
V. Impressive earning growth in next 3 years provides signifcant upside to valuation from these levels as well Strong growth in earnings in next 2-3 years driven by signficant improvement in both topline and margins is expected to drive upside in valuation from these current
levels as well in near to medium term period. We estimate EPS to grow almost 2.5x, which is ~34% increase on CAGR basis during FY17-FY20E period.
Even though stock price has rallied significantly in last 2 months, currently 1-year and 2-year average PE is below the 8-year average, Indicating significant
upside is still intact
Source: Company and Edelweiss Investment Research
26
13
27 26
46
23
8
13
1719
0
5
10
15
20
25
30
35
40
45
50
FY10 FY11 FY12 FY13 FY14 FY15 FY16 FY17 FY18E FY19E
tim
es
PE 1 yr Forward (LHS) Average
13
7
2326
52
19
78 9
14
0
10
20
30
40
50
60
FY10 FY11 FY12 FY13 FY14 FY15 FY16 FY17 FY18E FY19E
tim
es
PE 2 yr Forward (LHS) Average
Lumax Industries Ltd.
24 GWM
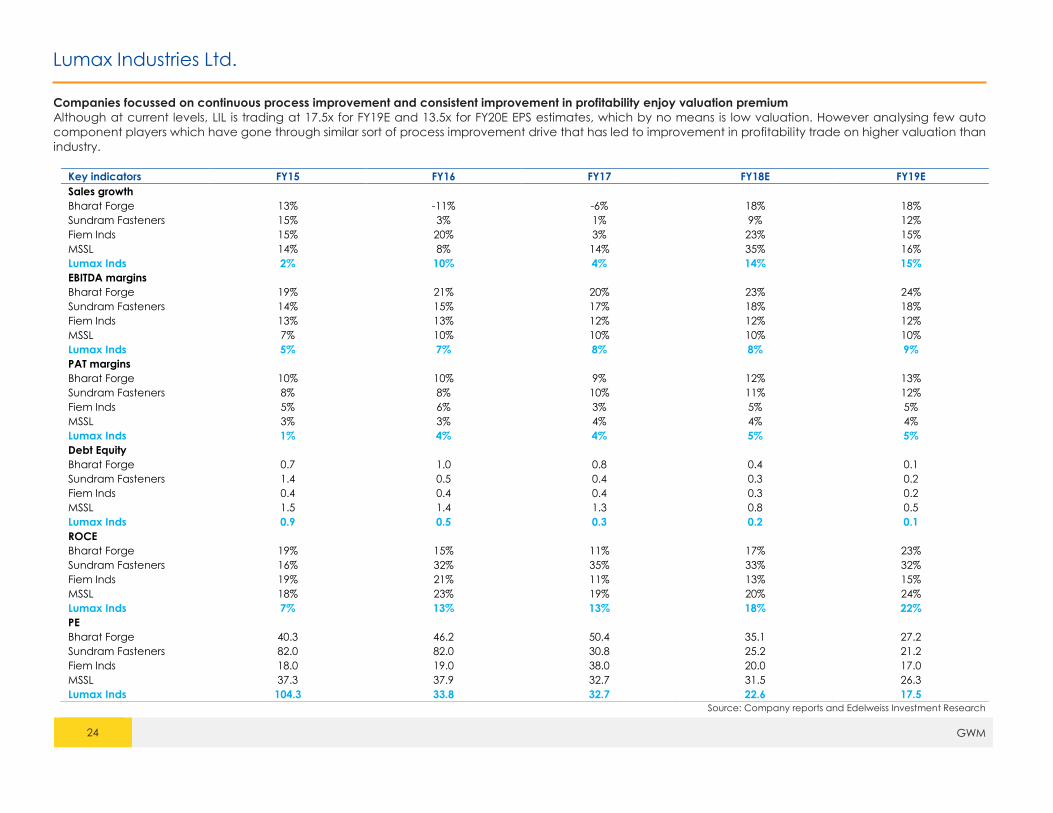
Companies focussed on continuous process improvement and consistent improvement in profitability enjoy valuation premium
Although at current levels, LIL is trading at 17.5x for FY19E and 13.5x for FY20E EPS estimates, which by no means is low valuation. However analysing few auto
component players which have gone through similar sort of process improvement drive that has led to improvement in profitability trade on higher valuation than
industry.
Key indicators FY15 FY16 FY17 FY18E FY19E
Sales growth
Bharat Forge 13% -11% -6% 18% 18%
Sundram Fasteners 15% 3% 1% 9% 12%
Fiem Inds 15% 20% 3% 23% 15%
MSSL 14% 8% 14% 35% 16%
Lumax Inds 2% 10% 4% 14% 15%
EBITDA margins
Bharat Forge 19% 21% 20% 23% 24%
Sundram Fasteners 14% 15% 17% 18% 18%
Fiem Inds 13% 13% 12% 12% 12%
MSSL 7% 10% 10% 10% 10%
Lumax Inds 5% 7% 8% 8% 9%
PAT margins
Bharat Forge 10% 10% 9% 12% 13%
Sundram Fasteners 8% 8% 10% 11% 12%
Fiem Inds 5% 6% 3% 5% 5%
MSSL 3% 3% 4% 4% 4%
Lumax Inds 1% 4% 4% 5% 5%
Debt Equity
Bharat Forge 0.7 1.0 0.8 0.4 0.1
Sundram Fasteners 1.4 0.5 0.4 0.3 0.2
Fiem Inds 0.4 0.4 0.4 0.3 0.2
MSSL 1.5 1.4 1.3 0.8 0.5
Lumax Inds 0.9 0.5 0.3 0.2 0.1
ROCE
Bharat Forge 19% 15% 11% 17% 23%
Sundram Fasteners 16% 32% 35% 33% 32%
Fiem Inds 19% 21% 11% 13% 15%
MSSL 18% 23% 19% 20% 24%
Lumax Inds 7% 13% 13% 18% 22%
PE
Bharat Forge 40.3 46.2 50.4 35.1 27.2
Sundram Fasteners 82.0 82.0 30.8 25.2 21.2
Fiem Inds 18.0 19.0 38.0 20.0 17.0
MSSL 37.3 37.9 32.7 31.5 26.3
Lumax Inds 104.3 33.8 32.7 22.6 17.5
Source: Company reports and Edelweiss Investment Research
Lumax Industries Ltd.
25 GWM
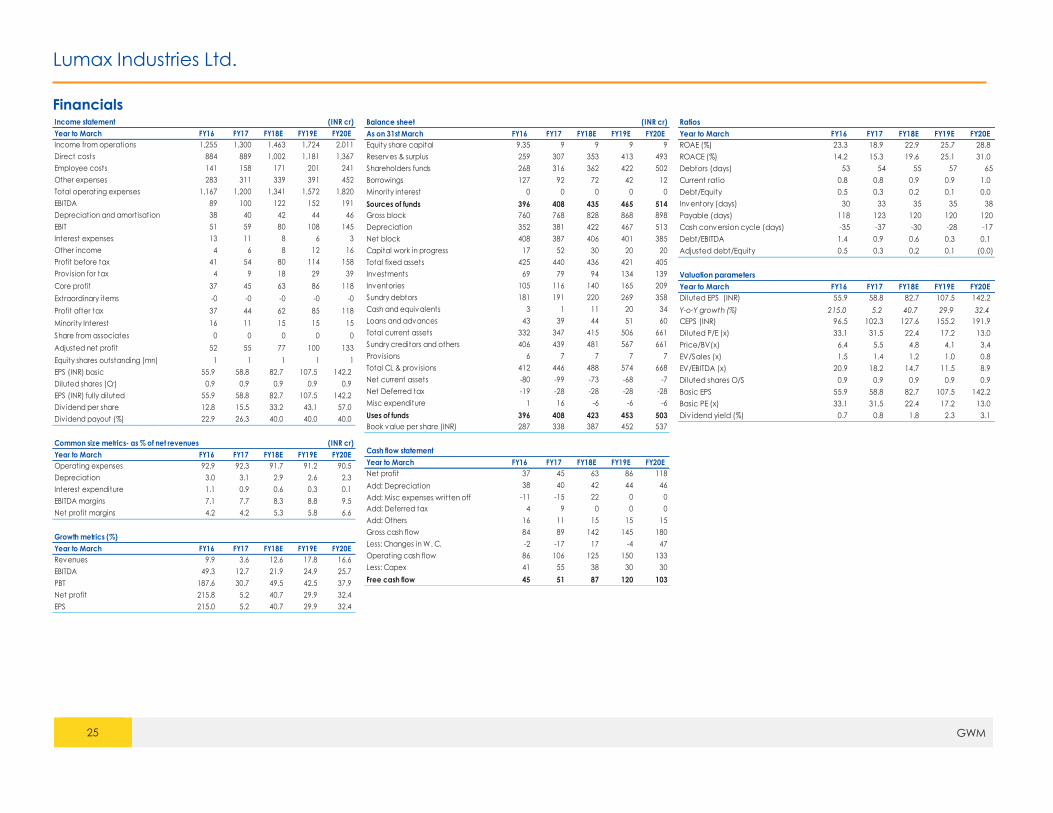
Financials
Income statement (INR cr)
Year to March FY16 FY17 FY18E FY19E FY20E
Income from operations 1,255 1,300 1,463 1,724 2,011
Direct costs 884 889 1,002 1,181 1,367
Employee costs 141 158 171 201 241
Other expenses 283 311 339 391 452
Total operating expenses 1,167 1,200 1,341 1,572 1,820
EBITDA 89 100 122 152 191
Depreciation and amortisation 38 40 42 44 46
EBIT 51 59 80 108 145
Interest expenses 13 11 8 6 3
Other income 4 6 8 12 16
Profit before tax 41 54 80 114 158
Provision for tax 4 9 18 29 39
Core profit 37 45 63 86 118
Extraordinary items -0 -0 -0 -0 -0
Profit after tax 37 44 62 85 118
Minority Interest 16 11 15 15 15
Share from associates 0 0 0 0 0
Adjusted net profit 52 55 77 100 133
Equity shares outstanding (mn) 1 1 1 1 1
EPS (INR) basic 55.9 58.8 82.7 107.5 142.2
Diluted shares (Cr) 0.9 0.9 0.9 0.9 0.9
EPS (INR) fully diluted 55.9 58.8 82.7 107.5 142.2
Div idend per share 12.8 15.5 33.2 43.1 57.0
Div idend payout (%) 22.9 26.3 40.0 40.0 40.0
Common size metrics- as % of net revenues (INR cr)
Year to March FY16 FY17 FY18E FY19E FY20E
Operating expenses 92.9 92.3 91.7 91.2 90.5
Depreciation 3.0 3.1 2.9 2.6 2.3
Interest expenditure 1.1 0.9 0.6 0.3 0.1
EBITDA margins 7.1 7.7 8.3 8.8 9.5
Net profit margins 4.2 4.2 5.3 5.8 6.6
Growth metrics (%)
Year to March FY16 FY17 FY18E FY19E FY20E
Revenues 9.9 3.6 12.6 17.8 16.6
EBITDA 49.3 12.7 21.9 24.9 25.7
PBT 187.6 30.7 49.5 42.5 37.9
Net profit 215.8 5.2 40.7 29.9 32.4
EPS 215.0 5.2 40.7 29.9 32.4
Balance sheet (INR cr)
As on 31st March FY16 FY17 FY18E FY19E FY20E
Equity share capital 9.35 9 9 9 9
Reserves & surplus 259 307 353 413 493
Shareholders funds 268 316 362 422 502
Borrowings 127 92 72 42 12
Minority interest 0 0 0 0 0
Sources of funds 396 408 435 465 514
Gross block 760 768 828 868 898
Depreciation 352 381 422 467 513
Net block 408 387 406 401 385
Capital work in progress 17 52 30 20 20
Total fixed assets 425 440 436 421 405
Investments 69 79 94 134 139
Inventories 105 116 140 165 209
Sundry debtors 181 191 220 269 358
Cash and equivalents 3 1 11 20 34
Loans and advances 43 39 44 51 60
Total current assets 332 347 415 506 661
Sundry creditors and others 406 439 481 567 661
Provisions 6 7 7 7 7
Total CL & provisions 412 446 488 574 668
Net current assets -80 -99 -73 -68 -7
Net Deferred tax -19 -28 -28 -28 -28
Misc expenditure 1 16 -6 -6 -6
Uses of funds 396 408 423 453 503
Book value per share (INR) 287 338 387 452 537
-32 -111 -160
Cash flow statement
Year to March FY16 FY17 FY18E FY19E FY20E
Net profit 37 45 63 86 118
Add: Depreciation 38 40 42 44 46
Add: Misc expenses written off -11 -15 22 0 0
Add: Deferred tax 4 9 0 0 0
Add: Others 16 11 15 15 15
Gross cash flow 84 89 142 145 180
Less: Changes in W. C. -2 -17 17 -4 47
Operating cash flow 86 106 125 150 133
Less: Capex 41 55 38 30 30
Free cash flow 45 51 87 120 103
Ratios
Year to March FY16 FY17 FY18E FY19E FY20E
ROAE (%) 23.3 18.9 22.9 25.7 28.8
ROACE (%) 14.2 15.3 19.6 25.1 31.0
Debtors (days) 53 54 55 57 65
Current ratio 0.8 0.8 0.9 0.9 1.0
Debt/Equity 0.5 0.3 0.2 0.1 0.0
Inventory (days) 30 33 35 35 38
Payable (days) 118 123 120 120 120
Cash conversion cycle (days) -35 -37 -30 -28 -17
Debt/EBITDA 1.4 0.9 0.6 0.3 0.1
Adjusted debt/Equity 0.5 0.3 0.2 0.1 (0.0)
Valuation parameters
Year to March FY16 FY17 FY18E FY19E FY20E
Diluted EPS (INR) 55.9 58.8 82.7 107.5 142.2
Y-o-Y growth (%) 215.0 5.2 40.7 29.9 32.4
CEPS (INR) 96.5 102.3 127.6 155.2 191.9
Diluted P/E (x) 33.1 31.5 22.4 17.2 13.0
Price/BV(x) 6.4 5.5 4.8 4.1 3.4
EV/Sales (x) 1.5 1.4 1.2 1.0 0.8
EV/EBITDA (x) 20.9 18.2 14.7 11.5 8.9
Diluted shares O/S 0.9 0.9 0.9 0.9 0.9
Basic EPS 55.9 58.8 82.7 107.5 142.2
Basic PE (x) 33.1 31.5 22.4 17.2 13.0
Div idend yield (%) 0.7 0.8 1.8 2.3 3.1
Lumax Industries Ltd.
26 GWM
Edelweiss Broking Limited, 1st Floor, Tower 3, Wing B, Kohinoor City Mall, Kohinoor City, Kirol Road, Kurla(W)
Board: (91-22) 4272 2200
Vinay Khattar
Head Research
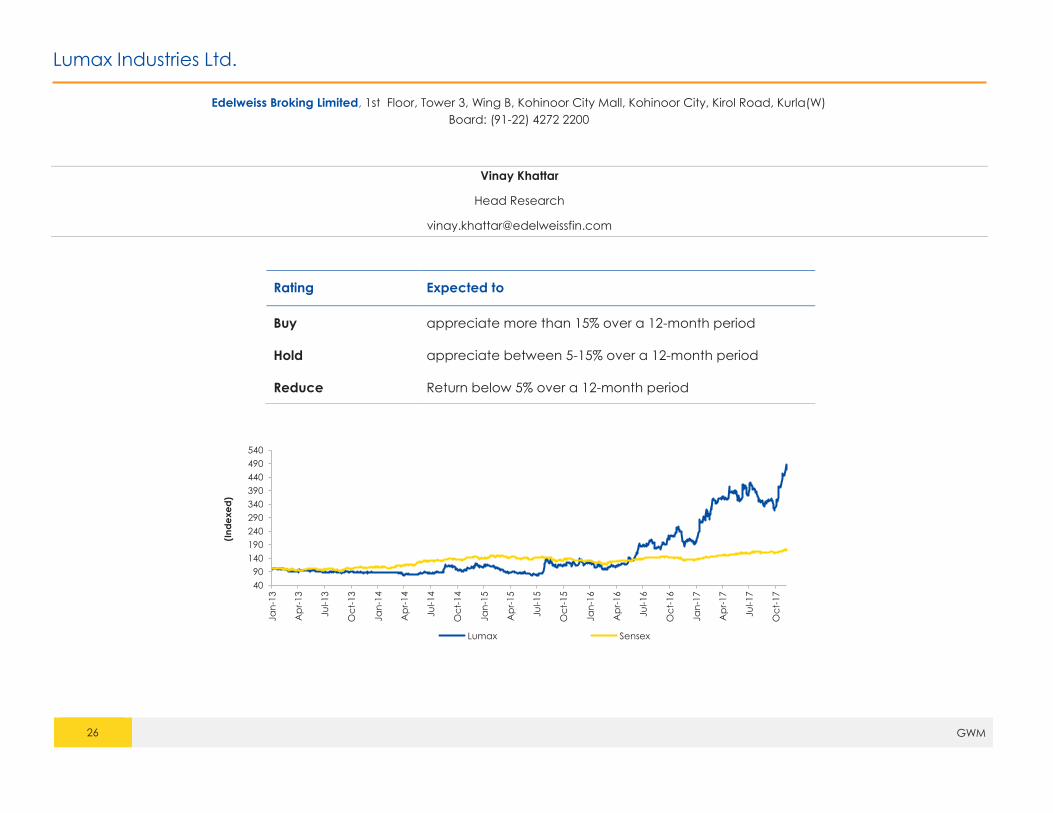
Rating Expected to
Buy appreciate more than 15% over a 12-month period
Hold appreciate between 5-15% over a 12-month period
Reduce Return below 5% over a 12-month period
40
90
140
190
240
290
340
390
440
490
540
Ja
n-1
3
Ap
r-13
Ju
l-13
Oc
t-13
Ja
n-1
4
Ap
r-14
Ju
l-14
Oc
t-14
Ja
n-1
5
Ap
r-15
Ju
l-15
Oc
t-15
Ja
n-1
6
Ap
r-16
Ju
l-16
Oc
t-16
Ja
n-1
7
Ap
r-17
Ju
l-17
Oc
t-17
(In
de
xe
d)
Lumax Sensex
Disclaimer
27 GWM
Edelweiss Broking Limited (“EBL” or “Research Entity”) is regulated by the Securities and Exchange Board of India (“SEBI”) and is licensed to carry on the business of broking, depository services and related activities. The business of EBL and its
Associates (list available on www.edelweissfin.com) are organized around five broad business groups – Credit including Housing and SME Finance, Commodities, Financial Markets, Asset Management and Life Insurance.
Broking services offered by Edelweiss Broking Limited under SEBI Registration No.: INZ000005231; Name of the Compliance Officer: Mr. Brijmohan Bohra, Email ID: [email protected] Corporate Office: Edelweiss House, Off
CST Road, Kalina, Mumbai - 400098; Tel. 18001023335/022-42722200/022-40094279
This Report has been prepared by Edelweiss Broking Limited in the capacity of a Research Analyst having SEBI Registration No.INH000000172 and distributed as per SEBI (Research Analysts) Regulations 2014. This report does not constitute an offer
or solicitation for the purchase or sale of any financial instrument or as an official confirmation of any transaction. The information contained herein is from publicly available data or other sources believed to be reliable. This report is provided
for assistance only and is not intended to be and must not alone be taken as the basis for an investment decision. The user assumes the entire risk of any use made of this information. Each recipient of this report should make such investigation
as it deems necessary to arrive at an independent evaluation of an investment in the securities of companies referred to in this document (including the merits and risks involved), and should consult his own advisors to determine the merits and
risks of such investment. The investment discussed or views expressed may not be suitable for all investors.
This information is strictly confidential and is being furnished to you solely for your information. This information should not be reproduced or redistributed or passed on directly or indirectly in any form to any other person or published, copied, in
whole or in part, for any purpose. This report is not directed or intended for distribution to, or use by, any person or entity who is a citizen or resident of or located in any locality, state, country or other jurisdiction, where such distribution, publication,
availability or use would be contrary to law, regulation or which would subject EBL and associates / group companies to any registration or licensing requirements within such jurisdiction. The distribution of this report in certain jurisdictions may
be restricted by law, and persons in whose possession this report comes, should observe, any such restrictions. The information given in this report is as of the date of this report and there can be no assurance that future results or events will be
consistent with this information. This information is subject to change without any prior notice. EBL reserves the right to make modifications and alterations to this statement as may be required from time to time. EBL or any of its associates / group
companies shall not be in any way responsible for any loss or damage that may arise to any person from any inadvertent error in the information contained in this report. EBL is committed to providing independent and transparent
recommendation to its clients. Neither EBL nor any of its associates, group companies, directors, employees, agents or representatives shall be liable for any damages whether direct, indirect, special or consequential including loss of revenue
or lost profits that may arise from or in connection with the use of the information. Our proprietary trading and investment businesses may make investment decisions that are inconsistent with the recommendations expressed herein. Past
performance is not necessarily a guide to future performance .The disclosures of interest statements incorporated in this report are provided solely to enhance the transparency and should not be treated as endorsement of the views expressed
in the report. The information provided in these reports remains, unless otherwise stated, the copyright of EBL. All layout, design, original artwork, concepts and other Intellectual Properties, remains the property and copyright of EBL and may not
be used in any form or for any purpose whatsoever by any party without the express written permission of the copyright holders.
EBL shall not be liable for any delay or any other interruption which may occur in presenting the data due to any reason including network (Internet) reasons or snags in the system, break down of the system or any other equipment, server
breakdown, maintenance shutdown, breakdown of communication services or inability of the EBL to present the data. In no event shall EBL be liable for any damages, including without limitation direct or indirect, special, incidental, or
consequential damages, losses or expenses arising in connection with the data presented by the EBL through this report.
We offer our research services to clients as well as our prospects. Though this report is disseminated to all the customers simultaneously, not all customers may receive this report at the same time. We will not treat recipients as customers by virtue
of their receiving this report.
EBL and its associates, officer, directors, and employees, research analyst (including relatives) worldwide may: (a) from time to time, have long or short posit ions in, and buy or sell the securities thereof, of company(ies), mentioned herein or (b)
be engaged in any other transaction involving such securities and earn brokerage or other compensation or act as a market maker in the financial instruments of the subject company/company(ies) discussed herein or act as advisor or
lender/borrower to such company(ies) or have other potential/material conflict of interest with respect to any recommendation and related information and opinions at the time of publication of research report or at the time of public
appearance. EBL may have proprietary long/short position in the above mentioned scrip(s) and therefore should be considered as interested. The views provided herein are general in nature and do not consider risk appetite or investment
objective of any particular investor; readers are requested to take independent professional advice before investing. This should not be construed as invitation or solicitation to do business with EBL.
EBL or its associates may have received compensation from the subject company in the past 12 months. EBL or its associates may have managed or co-managed public offering of securities for the subject company in the past 12 months. EBL
or its associates may have received compensation for investment banking or merchant banking or brokerage services from the subject company in the past 12 months. EBL or its associates may have received any compensation for products
or services other than investment banking or merchant banking or brokerage services from the subject company in the past 12 months. EBL or its associates have not received any compensation or other benefits from the Subject Company or
third party in connection with the research report. Research analyst or his/her relative or EBL’s associates may have financial interest in the subject company. EBL, its associates, research analyst and his/her relative may have other
potential/material conflict of interest with respect to any recommendation and related information and opinions at the time of publication of research report or at the time of public appearance.
Participants in foreign exchange transactions may incur risks arising from several factors, including the following: ( i) exchange rates can be volatile and are subject to large fluctuations; ( ii) the value of currencies may be affected by numerous
market factors, including world and national economic, political and regulatory events, events in equity and debt markets and changes in interest rates; and (iii) currencies may be subject to devaluation or government imposed exchange
controls which could affect the value of the currency. Investors in securities such as ADRs and Currency Derivatives, whose values are affected by the currency of an underlying security, effectively assume currency risk.
Research analyst has served as an officer, director or employee of subject Company: No
EBL has financial interest in the subject companies: No
EBL’s Associates may have actual / beneficial ownership of 1% or more securities of the subject company at the end of the month immediately preceding the date of publication of research report.
Research analyst or his/her relative has actual/beneficial ownership of 1% or more securities of the subject company at the end of the month immediately preceding the date of publication of research report: No
EBL has actual/beneficial ownership of 1% or more securities of the subject company at the end of the month immediately preceding the date of publication of research report: No
Subject company may have been client during twelve months preceding the date of distribution of the research report.
There were no instances of non-compliance by EBL on any matter related to the capital markets, resulting in significant and material disciplinary action during the last three years.

Disclaimer
28 GWM
A graph of daily closing prices of the securities is also available at www.nseindia.com
Analyst Certification:
The analyst for this report certifies that all of the views expressed in this report accurately reflect his or her personal views about the subject company or companies and its or their securities, and no part of his or her compensation was, is or will
be, directly or indirectly related to specific recommendations or views expressed in this report.
Additional Disclaimer for U.S. Persons
Edelweiss is not a registered broker – dealer under the U.S. Securities Exchange Act of 1934, as amended (the“1934 act”) and under applicable state laws in the United States. In addition Edelweiss is not a registered investment adviser under the
U.S. Investment Advisers Act of 1940, as amended (the "Advisers Act" and together with the 1934 Act, the "Acts), and under applicable state laws in the United States. Accordingly, in the absence of specific exemption under the Acts, any
brokerage and investment services provided by Edelweiss, including the products and services described herein are not available to or intended for U.S. persons.
This report does not constitute an offer or invitation to purchase or subscribe for any securities or solicitation of any investments or investment services and/or shall not be considered as an advertisement tool. "U.S. Persons" are generally defined
as a natural person, residing in the United States or any entity organized or incorporated under the laws of the United States. US Citizens living abroad may also be deemed "US Persons" under certain rules.
Transactions in securities discussed in this research report should be effected through Edelweiss Financial Services Inc.
Additional Disclaimer for U.K. Persons
The contents of this research report have not been approved by an authorised person within the meaning of the Financial Services and Markets Act 2000 ("FSMA").
In the United Kingdom, this research report is being distributed only to and is directed only at (a) persons who have professional experience in matters relating to investments falling within Article 19(5) of the FSMA (Financial Promotion) Order 2005
(the “Order”); (b) persons falling within Article 49(2)(a) to (d) of the Order (including high net worth companies and unincorporated associations); and (c) any other persons to whom it may otherwise lawfully be communicated (all such persons
together being referred to as “relevant persons”).
This research report must not be acted on or relied on by persons who are not relevant persons. Any investment or investment activity to which this research report relates is available only to relevant persons and will be engaged in only with
relevant persons. Any person who is not a relevant person should not act or rely on this research report or any of its contents. This research report must not be distributed, published, reproduced or disclosed (in whole or in part) by recipients to
any other person.
Additional Disclaimer for Canadian Persons
Edelweiss is not a registered adviser or dealer under applicable Canadian securities laws nor has it obtained an exemption from the adviser and/or dealer registration requirements under such law. Accordingly, any brokerage and investment
services provided by Edelweiss, including the products and services described herein, are not available to or intended for Canadian persons.
This research report and its respective contents do not constitute an offer or invitation to purchase or subscribe for any securities or solicitation of any investments or investment services.
Disclosures under the provisions of SEBI (Research Analysts) Regulations 2014 (Regulations)
Edelweiss Broking Limited ("EBL" or "Research Entity") is regulated by the Securities and Exchange Board of India ("SEBI") and is licensed to carry on the business of broking, depository services and related activities. The business of EBL and its
associates are organized around five broad business groups – Credit including Housing and SME Finance, Commodities, Financial Markets, Asset Management and Life Insurance. There were no instances of non-compliance by EBL on any matter
related to the capital markets, resulting in significant and material disciplinary action during the last three years. This research report has been prepared and distributed by Edelweiss Broking Limited ("Edelweiss") in the capacity of a Research
Analyst as per Regulation 22(1) of SEBI (Research Analysts) Regulations 2014 having SEBI Registration No.INH000000172.