Embed Size (px)
Citation preview

Long-term Monitoring and Visualization
Analysis System for Permafrost Change on
Qinghai-Tibet Plateau
Jiuyuan Huo1,2
1 Cold and Arid Regions Environmental and Engineering Research Institute, CAS, Lanzhou, China
2 Information Center, Lanzhou Jiaotong University, Lanzhou, China
Email: [email protected]
Yaonan Zhang1*
1 Cold and Arid Regions Environmental and Engineering Research Institute, CAS, Lanzhou, China
Email: yaonan@ lzb.ac.cn
Abstract—The Qinghai-Tibet Railway goes through
continuous high altitude permafrost regions on the Qinghai-
Tibet plateau. The melting of ice in permafrost will lead to
weaken the road foundation, cause the roadbed to collapse
and other adverse effects. In order to obtain the detailed
change information of the permafrost, understand climate
change process and relationship of subgrade stability and
permafrost changes, we discussed the 44 different forms of
subgrade monitoring sites established to monitor the ground
temperature and the roadbed deformation and a
visualization and analysis software of permafrost change
process to analyze the long-term monitoring data in this
paper. The system offers the basic data for further
permafrost researching and for scientific basis of subgrade
stability early warning. And it also provides a new research
idea for geo-data visualization and analysis.
Index Terms—Permafrost Change, Roadbed Stability,
Temperature Monitoring, Long-term Monitoring System,
Contour Map, Visualization Analysis
I. INTRODUCTION
Permafrost regions in the Qinghai-Tibet plateau are the
highest elevation and largest areas permafrost region in
the world within the middle and low latitudes. Permafrost
area is about 1.3 × 10⁶ km
2, accounting for 70% of total
area of the permafrost in China, and altitude of
permafrost distribution area usually over 4000 m [1, 2].
Permafrost on the plateau is characterized by high
temperature, ranging between 0 °C and − 4.0 °C, and
consequently by a weak thermal stability. In the
background of global warming, the Tibetan Plateau
warming climate will influence the development and
distribution of permafrost. Permafrost temperature,
thickness and spatial change of distribution are the
responses climate change. Surface excavation, vegetation
eradication and embankments construction in the human
engineering activities will result in strong thermal erosion
for permafrost, change heat exchange conditions of soil
and atmosphere, and give rise to change of temperature
balance state, interfere permafrost environment and
ecological balance of natural environment. Permafrost
degradation will make the strength and frozen soil
bearing capacity lower down, damage the stability of
permafrost embankment deeply [3, 4, 5, 6, 7, 8].
Qinghai-Tibet Railway (QTR), a total length of 1937
km, are north from Xining, Qinghai, and southern to
Lhasa, Tibet. It mainly crossed the permafrost areas,
which about 4,000m to 5,000m altitude in the Qinghai-
Tibet Plateau, and has an average elevation of 4,500
meters. The QTR crossed about 550 km of permafrost
regions, including 275 km of warm permafrost regions,
221 km of ice-rich permafrost regions, and 124 km of
warm and ice-rich permafrost regions [9]. To address
thermal stability of the high temperature and high ice
content permafrost, design ideas of cooling embankment
and reducing the permafrost temperature were adopted in
the QTR to ensure the thermal stability of permafrost
under the embankment [10, 11, 12, 13, 14].
Although, the preliminary geoscience technical
investigation on permafrost along the QTR has been
initiated during the 1960s and lasted about 40 years.
Many researches have been carried out on the distribution
characteristics, mechanical characteristics, change
predictions, and many other aspects of Tibetan Plateau
permafrost study. For the complicated geological
conditions of the QTR project, the research of
maintenance and construction of QTR till has strong
meaning of exploration and practicality. How to correctly
understand, permafrost development under climate
change and engineering construction, as well as the
relationship between the stability of railway embankment
and permafrost changes have become serious issues.
An important prerequisite to guarantee the longevity of
infrastructure in permafrost regions is a sufficiently
detailed preliminary study, and the most essential step is
to determine the permafrost presence and its ice content
[15, 16]. Thus, to solve these issues, a long-term
Corresponding author: Yaonan Zhang, Department of Computer and Network, Cold and Arid Regions Environmental and Engineering
Research Institute, CAS, Lanzhou, China, 730000
JOURNAL OF COMPUTERS, VOL. 7, NO. 8, AUGUST 2012 1927
© 2012 ACADEMY PUBLISHERdoi:10.4304/jcp.7.8.1927-1934

monitoring system has been built up in permafrost
regions along the QTR, the permafrost temperature of
surrounding embankment, sedimentation and deformation
have been monitored to collect critical data [17, 18].
These data monitored by the long-term monitoring
system could help to make an accurate grasp of trends
and judgments to the embankment stability, and make a
scientific prevention and diagnosis engineering disease
early, and also provide an important guarantee to
prediction, early warning, and problem analysis of the
roadbed.
Contour map is a general designation of a series of
equivalent lines distributed on a map. It could analyze the
spatial characteristics of physical elements, and grasp the
overall features of the spatial variation. Contour map is
widely used in many, especially in the field of geography,
large amounts of data are needed to be drawn into the
contours map for analysis and research. Visual analysis of
contour map is taken to analyze the monitored data of
temperature change of road foundation under the QTR,
and to facilitate the researchers to discover scientific laws
of the permafrost change process in an intuitive manner.
Surfer mapping software is one of the widely used data
visualization applications in the study area of geoscience.
Surfer supports a variety of data formats, has powerful
functions, and results beautiful and practical drawing
results. The long-term monitoring system has produced
large amounts of data in the monitoring process,
problems of inefficiency, labor waste and effect the
progress of research to track the new trends quickly will
be resulted in the traditional way of clicking menu item to
handling data and mapping for analysis. In order to
improve the efficiency of plotting of contour maps and
provide the researchers an analysis environment,
visualization and analysis software of permafrost change
process is developed by the hybrid programming of VB
and Surfer software.
The change process and stability of permafrost within
the observed region could be understood timely and
accurately. According the analysis results, some measures
could be taken to the relevant region to protect the
stability and reliable operation of the QTR.
II. RELATED WORK
Ground temperatures and embankment deformations
monitoring have been proposed as means of detecting
changes in permafrost regions, thus, there were more
scientists take research in this field in domestic and
international.
Charles Harris presented a review of the changing state
of European permafrost. They focused on methodological
developments and data collection over the last decade or
so, including research associated with the continent-scale
network of instrumented permafrost boreholes established
between 1998 and 2001 [16]. Results obtained during the
International Polar Year (IPY) on the thermal state of
permafrost and the active layer in the Antarctic are
presented in [19]. They also discussed the development of
boreholes network for permafrost and active-layer
monitoring. Mauro Guglielmin introduced active layer
and permafrost monitoring at two sites in Northern
Victoria Land, Boulder Clay and Oasi. And automatic
and year-round recording of ground temperatures and of
the main climatic parameters was carried out [20]. The
Geological Survey of Canada (GSC) has been developing
and maintaining a network of active-layer and permafrost
thermal monitoring sites which contribute to the
Canadian Permafrost Monitoring Network and the Global
Terrestrial Network for Permafrost. The presented results
indicate that the response of permafrost temperature to
recent climate change and variability varies across the
Canadian permafrost region [21].
In the research of QTR project, many Chinese
researchers have done a lot of work. Wei Ma, et al.,
summarized characteristics of embankment deformation
based on field monitoring datasets along the QTR. And
further analyses were carried out at some typical
monitoring profiles to discuss mechanisms of these
embankment deformations [22]. Based on dynamic
triaxial test at low temperature of the frozen clay from the
Beiluhe permafrost subgrade along the QTR, Zhanyuan
Zhu et al., studied residual deformation laws and dynamic
subsidence prediction model of permafrost subgrade
under train traffic [23]. On the base of in situ engineering
tests of the crushed rock embankment, the embankment
of crushed rock slope protection and the ventilated duct
embankment in Qinghai-Tibet railway, the basic data of
actively adjusting and cooling roadbed measures in
permafrost regions have been obtained through
monitoring the ground temperature in the roadbed [24].
Although these monitoring systems have collected a
large collection of data, but there is no fast and
convenient visualization environment for researchers in
carrying out scientific research. And contour map is a
common useful tool to analyze spatial characteristics of
physical quantity elements in practice. To address the
problem and develop more scientific, more visual and
faster engineering drawing software, we use VB with
Surfer software to develop a contour map visualization
software system to analyze the change process of
permafrost underneath the embankment of QTR in this
paper.
III. LONG-TERM MONITORING SYSTEM OF
PERMAFROST REGIONS
A long-term monitoring system has been deployed
along the QTR. Through the combinations of different
types of permafrost with different engineering measures,
ground temperatures and embankment deformations at 44
monitoring sites along the 550 km of permafrost regions
from the northern boundary of permafrost distribution,
Xidatan, to the southern boundary of permafrost
distribution, Anduo, were monitored continuously [17,
18]. The monitoring sections in the sites contain all types
of permafrost along the QTR, and it provides strong
support for subgrade stability research in different
permafrost conditions. The aims of establishment the
long-term permafrost monitoring system: To monitor
regular pattern of the change of ground temperature of
permafrost in the condition of warmer climate and the
1928 JOURNAL OF COMPUTERS, VOL. 7, NO. 8, AUGUST 2012
© 2012 ACADEMY PUBLISHER
growing impact of human activities. To predict and
forecast the development trends and embankment
stability of permafrost. To monitor impact of permafrost
degradation to ecological environment and engineering
construction.
At one monitoring site, ground temperatures and
embankment deformations were monitored
simultaneously. Ground temperatures were measured by
strings of thermistors installed in boreholes [25, 26].
Embankment deformation monitoring was done manually
on a monthly basis. In this paper, focuses were mainly on
ground temperature monitoring system. Past ground
temperature monitoring data were manually collected on
the field, and it result in the high cost and less efficiency.
As the monitoring sites involves more than 500 km along
the QTR, the frequency of monitoring and continuity of
data collection will be effected in this way. To collect and
access data timely, Campbell CR3000 automatic data
collection instruments were installed on some
temperature monitoring points. Monitored data also will
be transmitted through communication network of China
Mobile Company, General Packet Radio Service (GPRS)
to achieve data center.
A. Select Monitoring Sites
Long-term permafrost monitoring system conformed to
the following principles in selecting monitoring sites.
Firstly, monitor the key and weakness sections of QTR.
Second, select the warm and ice-rich area. Finally, try to
select flat terrain success for the consideration of future
observation. Based on the above principles, the overall
geographic distribution and elevation of monitoring sites
has been selected were shown in Figure 1.
B. Monitoring Contents
To understand the heat transfer process in the railway
embankment and climate response process, different
forms of ground temperature observation systems were
set up according to different types of road embankment.
We adopted the thermal resistance as the temperature
sensor and the indoor accuracy of calibration is ±
0.05 °C.
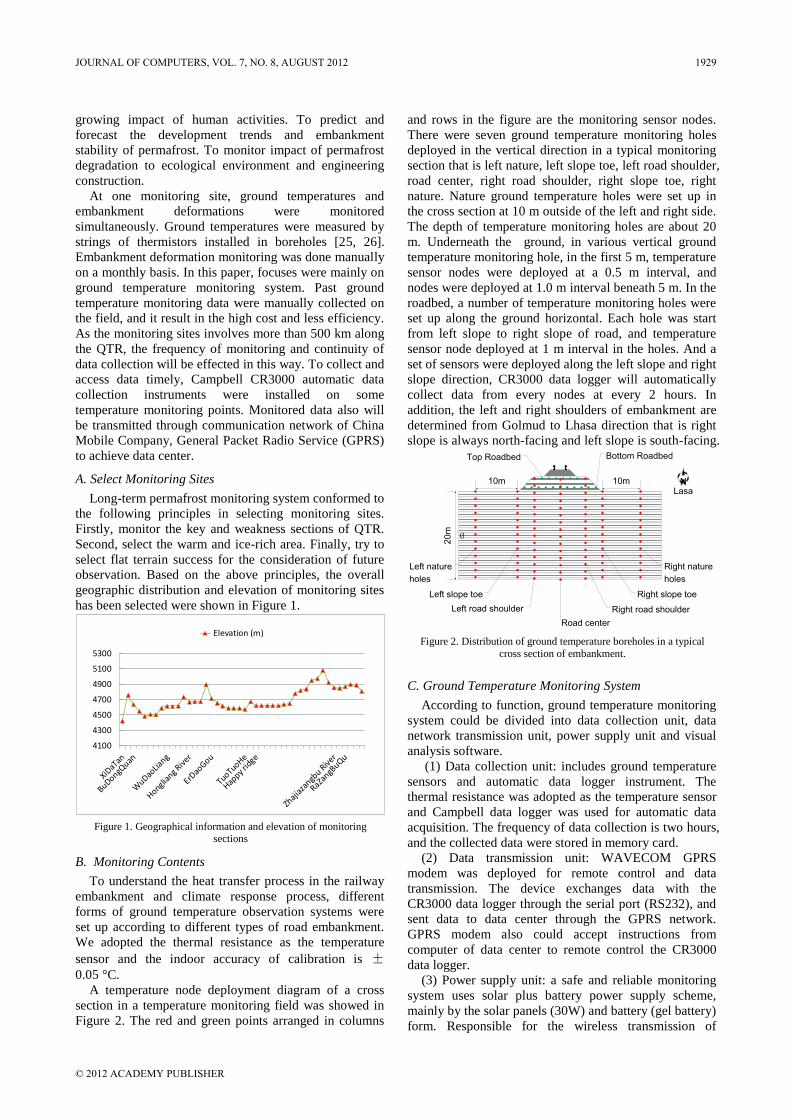
A temperature node deployment diagram of a cross
section in a temperature monitoring field was showed in
Figure 2. The red and green points arranged in columns
and rows in the figure are the monitoring sensor nodes.
There were seven ground temperature monitoring holes
deployed in the vertical direction in a typical monitoring
section that is left nature, left slope toe, left road shoulder,
road center, right road shoulder, right slope toe, right
nature. Nature ground temperature holes were set up in
the cross section at 10 m outside of the left and right side.
The depth of temperature monitoring holes are about 20
m. Underneath the ground, in various vertical ground
temperature monitoring hole, in the first 5 m, temperature
sensor nodes were deployed at a 0.5 m interval, and
nodes were deployed at 1.0 m interval beneath 5 m. In the
roadbed, a number of temperature monitoring holes were
set up along the ground horizontal. Each hole was start
from left slope to right slope of road, and temperature
sensor node deployed at 1 m interval in the holes. And a
set of sensors were deployed along the left slope and right
slope direction, CR3000 data logger will automatically
collect data from every nodes at every 2 hours. In
addition, the left and right shoulders of embankment are
determined from Golmud to Lhasa direction that is right
slope is always north-facing and left slope is south-facing.
C. Ground Temperature Monitoring System
According to function, ground temperature monitoring
system could be divided into data collection unit, data
network transmission unit, power supply unit and visual
analysis software.
(1) Data collection unit: includes ground temperature
sensors and automatic data logger instrument. The
thermal resistance was adopted as the temperature sensor
and Campbell data logger was used for automatic data
acquisition. The frequency of data collection is two hours,
and the collected data were stored in memory card.
(2) Data transmission unit: WAVECOM GPRS
modem was deployed for remote control and data
transmission. The device exchanges data with the
CR3000 data logger through the serial port (RS232), and
sent data to data center through the GPRS network.
GPRS modem also could accept instructions from
computer of data center to remote control the CR3000
data logger.
(3) Power supply unit: a safe and reliable monitoring
system uses solar plus battery power supply scheme,
mainly by the solar panels (30W) and battery (gel battery)
form. Responsible for the wireless transmission of
10m10m
Ø
20
m
NLasa
Left nature
holes
Left slope toe
Left road shoulder
Right nature
holes
Right slope toe
Right road shoulder
Road center
Top Roadbed Bottom Roadbed
Figure 2. Distribution of ground temperature boreholes in a typical
cross section of embankment.
4100
4300
4500
4700
4900
5100
5300
Elevation (m)
Figure 1. Geographical information and elevation of monitoring sections
JOURNAL OF COMPUTERS, VOL. 7, NO. 8, AUGUST 2012 1929
© 2012 ACADEMY PUBLISHER
electricity supply concerns terminal equipment, power
and data acquisition needs to ensure the normal operation
of field monitoring equipment.
(4) Visual analysis software: Visual analysis software
for long-term monitoring system of the QTR has been
developed to facilitate effectively visual analyze the
monitoring data. Visual Basic6.0 was selected as the
development environment to embedded call Surfer 8.0 for
drawing contour maps of ground temperature. The
software will be described in detail in later chapters.
D. Descript Monitoring Data
Monitoring data of temperature sensor nodes in ground
temperature monitoring system collected by Campbell
CR3000, and its data file format shown in Table 1. The
data was collected from each temperature sensor in cross
section in the time-series, and the time series of
monitoring nodes was in the first column of the table, the
second column to the last column is the resistance value
collected by each sensor at the timestamp in the time
series. The temperature sensors could monitor the
temperature changes nearby its location and obtain the
resistance value. According to the conversion formula
and the sensor's parameters calibrated in factory, the
resistance values should be converted to temperature
values.
As Surfer software drawing contour maps, special
requirement of data format was needed. A general
requirement is the text format, containing the data items
such as the location coordinates of observation points (for
example, coordinate x, coordinate y) and attributes (for
example, ground temperature). Before drawing contour
map by Surfer, the monitored data should be converted to
this format.
IV. THE DESIGN OF VISUALIZATION SOFTWARE
A. Concept Design
The seamless and automation connection could be
established between Surfer software and VB visual
programming languages. Automation method was
adopted by Surfer 8.0 to expose its interfaces, and these
ActiveX Automation objects covers almost all the
features of Surfer. There are two tasks should be
accomplished by VB programmers in writing the
embedded program of Surfer software. First, writing a
program of the main frame under the original code model
of VB. Second, writing a visualization software module
to call Surfer software by referring Surfer Automation
API.
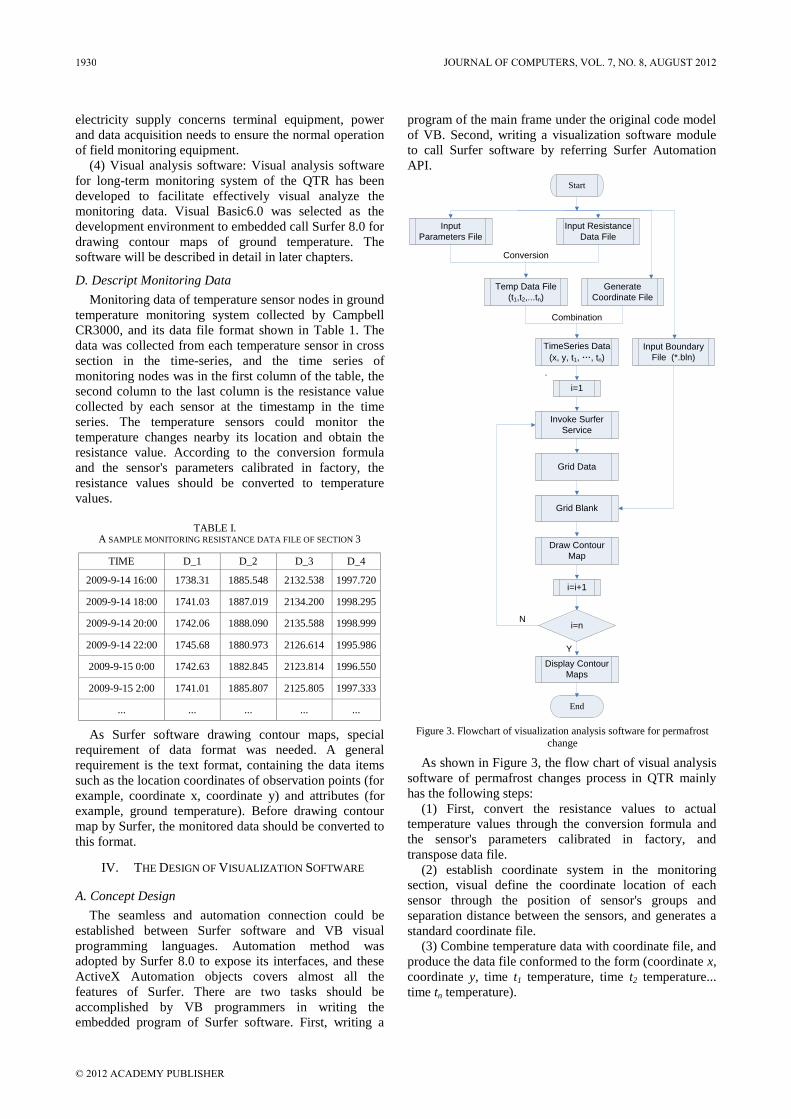
As shown in Figure 3, the flow chart of visual analysis
software of permafrost changes process in QTR mainly
has the following steps:
(1) First, convert the resistance values to actual
temperature values through the conversion formula and
the sensor's parameters calibrated in factory, and
transpose data file.
(2) establish coordinate system in the monitoring
section, visual define the coordinate location of each
sensor through the position of sensor's groups and
separation distance between the sensors, and generates a
standard coordinate file.
(3) Combine temperature data with coordinate file, and
produce the data file conformed to the form (coordinate x,
coordinate y, time t1 temperature, time t2 temperature...
time tn temperature).
TABLE I. A SAMPLE MONITORING RESISTANCE DATA FILE OF SECTION 3
TIME D_1 D_2 D_3 D_4
2009-9-14 16:00 1738.31 1885.548 2132.538 1997.720
2009-9-14 18:00 1741.03 1887.019 2134.200 1998.295
2009-9-14 20:00 1742.06 1888.090 2135.588 1998.999
2009-9-14 22:00 1745.68 1880.973 2126.614 1995.986
2009-9-15 0:00 1742.63 1882.845 2123.814 1996.550
2009-9-15 2:00 1741.01 1885.807 2125.805 1997.333
... ... ... ... ...
·
Conversion
Combination
Start
End
Input
Parameters File
Input Resistance
Data File
Temp Data File
(t1,t2,...tn)
Generate
Coordinate File
TimeSeries Data
(x, y, t1, …, tn)
Input Boundary
File (*.bln)
i=1
Invoke Surfer
Service
Grid Data
Grid Blank
Draw Contour
Map
i=n
i=i+1
Y
N
Display Contour
Maps
Figure 3. Flowchart of visualization analysis software for permafrost change
1930 JOURNAL OF COMPUTERS, VOL. 7, NO. 8, AUGUST 2012
© 2012 ACADEMY PUBLISHER

(4) Take the first, second and the ith column data (x, y,
ti), embedded call Surfer daemon to convert data into
Surfer .grd file format.
(5) Call Surfer daemon to generate a temperature
contour map from the .grd file generated in the third step,
and limit the range of coordinates by blank file.
Attributes such as color and axis parameters could be
automatically set in this process.
(6) Repeat the above fourth and fifth step n times to
generate all contour maps at the monitoring cross-section
at time series. Through observation and comparison of
these contour maps of permafrost region, the change and
stability of permafrost could be analyzed.
B. Visualization Software Functions
1) Convert Resistance Data to Temperature Data
According to the conversion equation and the sensor's
parameters calibrated from factory, the resistance values
monitored by sensor nodes should be converted to
temperature values. Equation (1) is the conversion
equation of resistance value to temperature value. There
are 7 parameters in the equation, Pa is parameter A, Pb is
parameter B, Pxa is parameter XA, Pyb is parameter YB,
Pzc is parameter ZC, LN is length of wire, Wr is the
resistance of wire and Rr is the resistance value measured
by sensor.
PzcPaWrRrLN
PbPyb
PaWrRrLNPbPxaT
16.273**
16.273**
2
. (1)
2) Generate Coordinates of Sensors
To draw contour maps, a plane coordinate system
should be established for each section and define the
coordinate location of each sensor. The visualization
software could visually determine coordinates of each
sensor and generate a standard coordinate file.
3) Combine Data with Coordinates
As shown in Table 2, temperature data file should be
combined with the coordinate file to generate complete
temperature data file of the monitoring section. The first
column is the name of temperature sensors, the second
column to the third columns are the coordinate x and y of
the sensor, the fourth column to the last column is the
temperature value of each sensor at the timestamp in the
time series.
4) Draw Contour Maps
After preparation of the temperature data, visualization
software could embedded call the Surfer software to draw
contour map. Complete set of temperature contour maps
would be generated at each timestamp follow time series.
An unfilled contour map and a filled contour map of
permafrost temperature within a temperature observation
section 3 of roadbed in QTR at 10:00 on September 3,
2009 were shown in Figure 4.a and Figure 4.b.
5) Display Contour Maps
Contour maps could be viewed and browsed easily and
quickly in this function. Users browse contour maps at
different interval to dynamically analyze the process of
permafrost change at different regions and at different
time.
V. MONITORING RESULTS AND ANALYSES
A. Compare Interpolation Methods of Contour Map
One of the key steps of drawing contour map of is
interpolate discrete points data into regular grid points
data, thus the selection of spatial interpolation method of
contour drawing would affect the result of contour map
rendering. Surfer 8.0 offers 12 kinds of interpolation
method that are Kriging method, Inverse Distance to a
Power method, Minimum Curvature method, Modified
Shepard's Method, Natural Neighbor method, Nearest
Neighbor method, Polynomial Regression method, Radial
Basis Function method, Triangulation with Linear
Interpolation method. Kriging method is more accurate
other interpolation methods for middle and small discrete
data. Kriging is a method of interpolation named after a
South African mining engineer named D. G. Krige [27,
28]. For the powerful interpolation functions, Kriging
method has become the preferred method to deal with (X,
Y, Z) data. Therefore, it was adopted in this paper for
contour mapping and analysis.
B. Analyses and Discussions of Permafrost Change
The development of visualization software was
accomplished in December 2010. Currently, the ground
temperature monitoring system and visualization software
work well, and a more complete long-term temperature
monitoring data has been received. In this section, we
analyzed the monitoring results of the long-term
monitoring system and made a preliminary analysis to
understand the permafrost change and the process of
freezing and thawing under the embankment of QTR.
1) Temperature Change in Monitoring Permafrost
-10 -5 0 5 10
b.Filled contour map
m
℃
-15
-9
-3
0
3
9
15
-10 -5 0 5 10
a.Unfilled contour map
-20
-15
-10
-5
0
Figure 4. Unfilled and filled contour map of ground temperature of embankment in section 3 (at 20:00 on September 14, 2009)
TABLE II. THE FINAL DATA FILE COMBINED FROM TEMPERATURE DATA AND
COORDINATE DATA OF SENSOR NODES IN SECTION 3
No. X Y 2009-9-14
16:00
2009-9-14
18:00
2009-9-14
20:00
2009-9-14
22:00
D_1 -11 -0.2 8.43 8.38 8.37 8.31
D_2 -11 -0.7 8.3 8.28 8.26 8.36
D_3 -11 -1.2 4.37 4.35 4.33 4.44
D_4 -11 -1.7 3.57 3.57 3.56 3.6
... ... ... ... ... ... ...
JOURNAL OF COMPUTERS, VOL. 7, NO. 8, AUGUST 2012 1931
© 2012 ACADEMY PUBLISHER
To analyze temperature change of permafrost in
monitoring section, we compared ground temperature of
sensors deployed in different locations of left slope toe,
left road shoulder, road center, right road shoulder, and
right slope toe of embankment at section 11.
As shown in Figure 5, results from ground temperature
monitoring at the section showed that between the
embankment and road surface, temperature of road center
was higher than the left shoulder and right shoulder,
difference of left shoulder and right shoulder temperature
was slightly. Underneath the road surface, the changes of
temperature were gradually obvious. The temperature of
left slope toe was always higher than monitoring nodes
deployed in other locations. The temperature of right
shoulder, road center and right slope toe were close to the
left slope toe, but the temperature of the right slope toe
was significantly lower than the other. Compared to other
locations, under the 3m to 12m of road surface, the
temperature of right slope toe was lower about 0.2 to 0.9
degree, but after 12m of the road surface, its temperature
was close to other locations.
As can be seen from Figure 5, at 5.0 m under the road
surface, the temperature of each location has the biggest
difference. We compared ground temperature curve of
permafrost at the depth of 5.0 m under the road surface in
Section 7 shown in Figure 6 to compare the temperature
changes. In 20 days from September 14, 2009 to October
05, 2009, in the embankment at 5.0 m, the average
temperature of Right Slope Toe of embankment at 5.0 m
underneath road was lower about 0.2 to 0.3 degree than
other locations.
Although the QTR was basically north-south, but the
monitoring sections showed the effect of “yin-yang
slope", that is the temperature of soil under the left slope
toe is higher than the temperature of soil under the right
slope toe, temperature field of soil under the embankment
is asymmetric. Previous studies showed that the "yin-
yang slope" effect of embankment would cause the rate
of sedimentation of the sunny side of embankment slope
is greater than the shady side, and lead to uneven
subgrade deformation and sunny longitudinal cracks to
give rise to effect the stability of the roadbed [29, 30].
2) Frost heave process of embankment analysis
Frost heave of embankment is the result of many
factors, such as soil conditions of embankment, moisture
changes and atmospheric temperature. The embankment
soil is internal factor of frost heave. The premise of frost
heave of embankment is the temperature field change. As
the temperature is lowered from positive temperature to
negative temperature, the embankment soil began to
freeze, and the corresponding temperature is called the
freezing temperature of soil. 0 °C was taken as the
freezing temperature in this experiment [31].
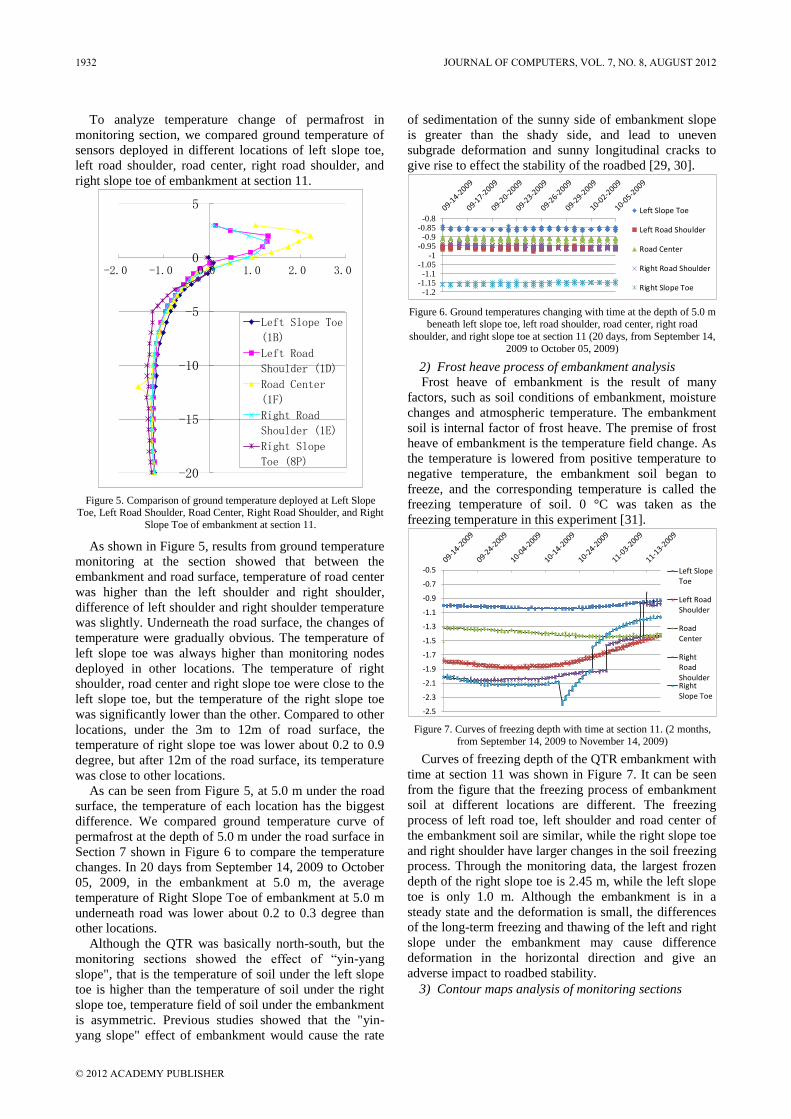
Curves of freezing depth of the QTR embankment with
time at section 11 was shown in Figure 7. It can be seen
from the figure that the freezing process of embankment
soil at different locations are different. The freezing
process of left road toe, left shoulder and road center of
the embankment soil are similar, while the right slope toe
and right shoulder have larger changes in the soil freezing
process. Through the monitoring data, the largest frozen
depth of the right slope toe is 2.45 m, while the left slope
toe is only 1.0 m. Although the embankment is in a
steady state and the deformation is small, the differences
of the long-term freezing and thawing of the left and right
slope under the embankment may cause difference
deformation in the horizontal direction and give an
adverse impact to roadbed stability.
3) Contour maps analysis of monitoring sections
-1.2-1.15
-1.1-1.05
-1-0.95
-0.9-0.85
-0.8Left Slope Toe
Left Road Shoulder
Road Center
Right Road Shoulder
Right Slope Toe
Figure 6. Ground temperatures changing with time at the depth of 5.0 m beneath left slope toe, left road shoulder, road center, right road
shoulder, and right slope toe at section 11 (20 days, from September 14,
2009 to October 05, 2009)
-2.5
-2.3
-2.1
-1.9
-1.7
-1.5
-1.3
-1.1
-0.9
-0.7
-0.5 Left SlopeToe
Left RoadShoulder
RoadCenter
RightRoadShoulderRightSlope Toe
Figure 7. Curves of freezing depth with time at section 11. (2 months, from September 14, 2009 to November 14, 2009)
-20
-15
-10
-5
0
5
-2.0 -1.0 0.0 1.0 2.0 3.0
Left Slope Toe
(1B)
Left Road
Shoulder (1D)
Road Center
(1F)
Right Road
Shoulder (1E)
Right Slope
Toe (8P)
Figure 5. Comparison of ground temperature deployed at Left Slope Toe, Left Road Shoulder, Road Center, Right Road Shoulder, and Right
Slope Toe of embankment at section 11.
1932 JOURNAL OF COMPUTERS, VOL. 7, NO. 8, AUGUST 2012
© 2012 ACADEMY PUBLISHER

The contour map of variation of freezing and thawing
process of soil under embankment at Section 3 from
September 14, 2009 to December 14, 2009 was shown in
Figure 8. It can be seen that after 13 m under the
embankment, the permafrost layer of this three-month
period has little changes and is relatively stable. But
between the road surface and 13 m under the
embankment, the permafrost temperature changes greatly.
Freezing depth was about 2.4 m in September, and it rose
to about 0 m of the embankment in December. The
temperature change of right shoulder is significantly
larger than the left shoulder, temperature of left shoulder
changed from the initial 4 degree to minus 3 degree,
while the temperature of right shoulder changed from
about 8 degree to more than minus 10 degree. Such a
drastic temperature changes would lead to the freezing
and thawing process of right side of embankment faster
and more obvious than the left side, and will result in the
embankment deformation of the road and impact the
stability of the roadbed greatly.
At 10 m to 18 m underneath the embankment in
section 3, a melt interlayer (red area under the
embankment in the Figure 8) has been produced. Melt
interlayer would promote the natural converge of water,
cause the further expansion of melt interlayer, which led
to the embankment has a persistent deformation [32].
VI. CONCLUSIONS AND FUTURE WORK
The establishment of long-term monitoring system of
permafrost along the QTR would help the researchers to
monitor the weather, frozen ground temperature and the
subgrade deformation of QTR embankment on
permafrost regions, and better understand the interaction
of permafrost and engineering as well as the impacts of
permafrost changes to the stability of the embankment.
Automation technology was adopted to combine VB
6.0 and Surfer software 8.0 to develop contour maps
visual analysis software. Practice has proved that it only
take about 300s by using the visual software to draw one
hundred high-resolution contour maps.
After comparison and analysis of contour maps of
ground temperature in monitoring section 3 drawn by
using 12 different interpolation methods, Kriging method
is more accurate in the medium and small discrete data
interpolation. Kriging interpolation method was selected
for contour mapping and analysis in this paper.
Through the analysis of temperature changes in
different locations in the monitoring section, monitoring
sections showed the effect of “yin-yang slope", that is the
temperature of soil under the left slope toe is higher than
the temperature of soil under the right slope toe,
temperature field of soil under the embankment is
asymmetric. By analyzing the curves of freezing depth of
the QTR embankment with time at section 11, it could be
found that the largest frozen depth of the right slope toe is
2.45 m, while the left slope toe is only 1.0 m. It may
cause difference deformation in the horizontal direction.
The contour maps of the monitoring sections show that
the temperature change of right shoulder is significantly
larger than the left shoulder. These issues would lead to
the freezing and thawing process of right side of
embankment faster than the left side, and will result in the
embankment deformation of the road and impact the
stability of the roadbed.
This system would provide the basic data for further
permafrost research, a scientific basis for early warning
for the stability of the embankment and new research
method for geo data visualization and analysis. But
contour map analysis is only one of the analysis methods,
three-dimension maps could be involved and attempt to
find more new scientific issues in the future.
ACKNOWLEDGMENT
This work is supported by Informationization
Foundation of Chinese Academy of Sciences (CAS),
"The E-Science Environment for Ecological and
Hydrological Model Research in Heihe River Basin"
(Grant number: 29O920C61); Project for Incubation of
Specialists in Glaciology and Geocryology of National
Natural Science Foundation of China (Grant number:
J0930003/ J0109); and Second Phase of the CAS Action-
Plan for West Development (Grant number: KZCX2-
XB2-09-03).
REFERENCES
[1] Cheng Guodong. “Problems on zonation of high-altitude
permafrost”. Acta Geographica Sinica, vol. 39, No. 2, pp.
185-193, 1984.
[2] Jin Huijun, Zhao Lin, Wang Shaoling, Jin Rui. “Thermal
regimes and degradation modes of permafrost along the
Qinghai-Tibet Highway”, Science in China Series D (Earth
Sciences), vol. 49, No 11, pp. 1170-1183, 2006.
[3] Cheng Guodong, Wu Tonghua. “Responses of permafrost to
climate change and their environmental significance,
Qinghai-Tibet Plateau”. Journal of Geophysical Research,
vol. 112 , No. F02S03, pp. 1-10, 2007.
[4] Jin Huijun, Yu Qihao, Wang Shaoling, Lü Lanzhi. “Changes
in permafrost environments along the Qinghai-Tibet
-20
-15
-10
-5
0
-15
-7
-1
3
11
2009-09-14 2009-10-14 2009-11-14 2009-12-14
℃
Figure 8. Contour maps of variation of freezing and thawing process of soil under embankment at Section 3 (3 months, from September 14, 2009 to December 14, 2009)
JOURNAL OF COMPUTERS, VOL. 7, NO. 8, AUGUST 2012 1933
© 2012 ACADEMY PUBLISHER
engineering corridor induced by anthropogenic activities
and climate warming”. Cold Regions Science and
Technology, vol. 53, No. 3, pp. 317-333, 2008.
[5] Wu Qingbai, Liu Yongzhi. “Ground temperature monitoring
and its recent change in Qinghai-Tibet Plateau”. Cold
Regions Science and Technology, vol. 38, No. 2-3, pp. 85-
92, 2004.
[6] Simonsen E. Isacsson U. “Thaw weakening of pavement
structures in cold region”. Cold Regions Science and
Technology, vol. 29, No. 2, pp.135-151, 1999.
[7] Kane D L, Hinkel K M, Goering D J, et al. “Non-conductive
heat transfer associated with frozen soils”. Global and
Planetary Change, vol. 29, No. 4, pp.275-292, 2001.
[8] Anderland Orlando B., Ladanyi Branko. Frozen Ground
Engineering. John Wiley & Sons. Inc., Hoboken, New
Jersy, 2004.
[9] Wu Qingbai, Cheng Guodong, Ma wei. “Technical
approaches on permafrost thermal stability for Qinghai-
Tibet Railway”. Geomechanics and Geoengineering, vol. 1,
No. 2, pp. 119-128, 2006.
[10] Cheng Guodong. “A roadbed cooling approach for the
construction of Qinghai-Tibet Railway”. Cold Regions
Science and Technology, vol. 42, No. 2, pp. 169-176, 2005.
[11] Goering D J. “Passively cooled railway embankments for
use in permafrost areas”. Journal oI Cold Regions
Engineering, vol. 17, No. 3, pp. 119-133, 2003.
[12] Wu Qingbai, Shi Bin, Fang Haiyang. “Engineering
geological characteristics and process of permafrost along
Qinghai-Xizang Highway”. Engineering Geology, vol. 28,
No. 3-4, pp. 387-396, 2003.
[13] Gapeyev, S.I., Strengthening permafrost foundation by
cooling Construction. Literature Press, Leningrad, 1969
[14] Kondratyev, V.G., “New Methods of Strengthening
Roadbed Bases on Very Icy Permafrost Soils”.
Proceedings of International Symposium of Cold Regions
Engineering. Industry Technology Press, Harbin, pp. 1-6,
1996.
[15] C. Bommer, M. Phillips, L.U. Arenson. “Practical
recommendations for planning, constructing and
maintaining infrastructure in mountain permafrost”.
Permafrost and Periglacial Processes, vol. 21, No. 1, pp.
97-104, 2010.
[16] C. Harris, L.U.Arenson, H.H. Christiansen, et.al..
“Permafrost and climate in Europe: monitoring and
modeling thermal, geomorphological and geotechnical
responses”. Earth Science Reviews, vol. 92, No. 3-4, pp.
117-171, 2009.
[17] Yu Hui, Wu Qingbai, Liu Yongzhi. “The Long-Term
Monitoring System on Permafrost Regions along the
Qinghai-Tibet Railway”. Journal of Glaciology and
Geocryology, vol. 30, No. 3, pp. 475-481, 2008.
[18] Wu Qingbai, Liu Yongzhi, Yu Hui. “The monitoring
network of permafrost conditions and embankment
performance along the Qinghai-Tibet Railway”.
Proceedings of 9th International Conference on
Permafrost, Alaska, USA, pp. 1963-1968, 2008.
[19] Goncalo V., James B. “Thermal State of Permafrost and
Active-layer Monitoring in the Antarctic: Advances During
the International Polar Year 2007–2009”, Permafrost and
Periglac. Process, vol. 21, pp. 182-197, 2010.
[20] Mauro G., “Ground Surface Temperature (GST), Active
Layer and Permafrost Monitoring in Continental
Antarctica”, Permafrost and Periglac. Process, vol. 17, pp.
133-143, 2006.
[21] Sharon L. S., Margo M. B., Dan R., “Recent Trends from
Canadian Permafrost Thermal Monitoring Network Sites”,
Permafrost and Periglac. Process, vol. 16, pp. 19-30, 2005.
[22] Ma Wei, Mu Yanhu, Wu Qingbai, Sun Zhizhong, Liu
Yongzhi. “Characteristics and mechanisms of embankment
deformation along the Qinghai-Tibet Railway in
permafrost regions”, Cold Regions Science and
Technology, vol. 67, No. 3, pp. 178-186, 2011.
[23] Zhu Zhanyuan, Ling Xianzhang, Chen Shijun, Zhang Feng,
Wang Lina, Wang Ziyu, Zou Zuyin. “Experimental
investigation on the train-induced subsidence prediction
model of Beiluhe permafrost subgrade along the Qinghai-
Tibet Railway in China”. Cold Regions Science and
Technology, vol. 62, No. 1, pp. 67-75, June 2010.
[24] Ma Wei, Shi Conghui, Wu Qingbai, Zhang Luxin, Wu
Zhijian. “Monitoring study on technology of the cooling
roadbed in permafrost region of Qinghai-Tibet plateau”.
Cold Regions Science and Technology, vol.44, No.1, pp.1-
11, 2006.
[25] Ma Wei, Liu Duan, Wu Qingbai. “Monitoring and analysis
of embankment deformation in permafrost regions of
Qinghai-Tibet Railway”. Rock and Soil Mechanics, vol. 29,
No. 3, pp. 571-579, 2008.
[26] Wu Qingbai, Liu Yongzhi. “Ground temperature
monitoring and its recently change in Qinghai-Tibet
Plateau”. Cold Regions Science and Technology, vol. 38,
No. 2-3, pp.85-89, 2004.
[27] http://www.ems-i.com/gmshelp/Interpolation/Interpolation
_ Schemes/Kriging/Kriging.htm
[28] http://en.wikipedia.org/wiki/Kriging
[29] Pei Jianzhong, Dou Mingjian, Hu Changshun. “Forming
mechanism of embankment longitudinal cracks in
permafrost regions. Journal of Glaciology and
Geocryology”, vol.28, No. 1, pp. 716-721, 2006.
[30] Song Jingzhen, Wang Lianjun, Shen Yupeng. “Study on
the difference between the southern and northern slopes of
the embankment in permafrost region on Qinghai-Tibet
Plateau”. China Railway Science, vol. 27, No. 2, pp. 6-70,
2006.
[31] Xia Qiong, Yang Youhai, Dou Shun. “Frost Heaving
Characteristics of Lanzhou-Xinjiang Railway Subgrade
and the Treatment of Frost Damage”. Journal of
Glaciology and Geocryology, vol. 33, No. 1, pp. 164-170,
2011.
[32] Li Zhong, Xu Wenming, Cheng Mingchang. “Settlement
characteristics of Qinghai-Tibet Railway embankment on
permafrost subgrade in Qingshui River region of Tibet
Plateau”. Journal of Engineering Geology, vol. 14, No. 6,
pp. 824-829, 2006.
Jiuyuan Huo is currently a Ph.D.
candidate in Cold and Arid Regions
Environmental and Engineering Research
Institute (CAREERI), CAS. He is also
senior engineer in Lanzhou Jiaotong
University. His technical interests include
Wireless Sensor Network, Grid Computer,
and Visualization.
Yaonan Zhang is a Professor and the
Dean of Department of Computer and
Network of CAREERI, CAS. He received
his doctorate from CAREERI in 2006. He
has led or participated in over 20 major
research projects in network, high-
performance computing, database and
others since 1986. His current research
interests include Network, High-
performance Computing, Grid, and E-Science.
1934 JOURNAL OF COMPUTERS, VOL. 7, NO. 8, AUGUST 2012
© 2012 ACADEMY PUBLISHER