Embed Size (px)
Citation preview
LONG TERM MONITORING AND ASSESSMENT OF NATURAL RESOURCES:
REMOTE SENSING AS A COMPONENT OF AN INTEGRATED APPROACH – THE
CASE STUDY OF THE LAKE VICTORIA BASIN IN KENYA
Ambrose Oroda1, Stephen Anyango2, Charles Situma3 and
Anne Branthomme4
1 INRA National Consultant – Remote Sensing and Mapping 2 INRA Overall National Consultant – Kenyatta University
3 INRA National Project Coordinator – Department of Resource Surveys and Remote Sensing (DRSRS) 4 INRA Kenya Project Manager – FAO, Rome
ABSTRACT
Human well-being and progress are vitally dependent upon the ecosystems goods and services such as
food, freshwater, wood-fuel, fibre and medicines. Other services include meeting man’s spiritual,
recreational and educational needs, and stabilizing soils and climate. The demands for these goods and
services have been on the increase due to population pressure, in some cases resulted in over-exploitation
and negative alteration of the ecosystems hence modifying their basic physical properties and disrupting
the complex interactions that typified the original ecosystems. The Kenyan economy is principally natural
resources based, the main sources of livelihoods being agriculture, livestock production, exploitation of
forest resources, and tourism. Land and the resources thereon are, therefore, very critical for Kenya.
Degradation of these resources threatens the economic, social, political and the physical well-being of the
country and results into increased levels of poverty and food insecurity. The need for current and accurate
information on land resources to formulate sound policies cannot be overemphasised. However, there
remains limited knowledge and awareness on the impacts and severity of environmental degradation
issues in Kenya. Periodic spatial land cover and land use assessments are important generators of
information on the state of the environment and the conditions of natural resources. It has also been
recognised that various components and resources in an ecosystem are closely interrelated and as such
there is need to assess and manage them in an integrated and holistic manner to enhance the knowledge
and understanding of how they interact. In Kenya, assessments of natural resources have been mainly
sector based, usually driven by narrow information needs by policy makers or institutions that target one
particular aspect or a particular resource. As such the concept of the Integrated Natural Resource
Assessment (INRA), an ecosystem based approach to address biodiversity and ecosystems functions and
services in a more holistic way, was conceived. INRA aimed at establishing a monitoring system that can
generate information on the state of the environment and natural resources for policy formulation, land
use planning, and conservation and sustainable utilization of natural resources. The INRA started with a
pilot supported under the FAO-Netherlands Partnership Programme (FNPP) and covered forest,
agriculture, wildlife and water resources. Remote Sensing (RS) is an efficient tool to track and
monitor both spatial and temporal transformations on land landscape through land cover and land
use mapping. When combined with in situ ecosystems assessments and other biophysical and
socio-economic data, land cover and land use maps provide very important information that
allows various analyses of ecosystem conditions and can show linkages between various human
management practices and uses of natural resources. The integration and manipulation of spatial
data into Geographical Information System (GIS) makes it possible to carry out analyses that
help in understanding land use change processes and dynamics. This paper describes how, within
the INRA concept, high-resolution satellite remote sensing was used to monitor the status of land
cover and land use between 2000 and 2008 within the Lake Victoria basin in Kenya. The region
is one of the most densely populated (300 persons per km2) and has one of the highest poverty
rates globally. The area was found to be predominantly agricultural (about 95%).
1. INTRODUCTION
Human well-being and progress are vitally
dependent upon the ecosystems that provide
various goods and services including food,
freshwater, wood-fuel, fibre and medicines
(WRI, 2003). The ecosystems also meet man’s
spiritual, recreational and educational needs
while stabilizing soils and climate as well. The
demands for ecosystems goods and services are
on the increase due to population pressure, in
some cases resulting in over-exploitation and
altering of the ecosystems negatively (Hare and
Ogallo, 1993, UNEP, 2005, Husle, 2007). The
increased utilisation has led to changes in the
ecosystems structures and how they function
and, consequently, to modification in their basic
physical properties and to disruption of the
complex interactions that typified the original
ecosystems.
The Kenyan economy is principally natural
resources based, the main source of livelihood
for the majority of Kenyans being agriculture,
livestock production, and forestry. Tourism,
based on wildlife viewing within protected
areas, is Kenya’s greatest foreign exchange
earner, and one of the largest employers. Land
and the resources thereon are, therefore, very
critical for Kenya, and constitute the basis for
survival. However, like in many other African
and developing countries, their degradation
(through accelerated deforestation,
desertification, soil degradation, accelerated
industrial pollution, decrease in biodiversity,
increase in invasive non-palatable species,
decrease in the quality and quantity of water,
depletion of mineral and wildlife resources)
threatens the economic, social, political and the
physical well-being of the country, and the
resources integrity. This, increasingly,
diminishes the population’s ability to obtain
their basic needs and subsequently results into
increased levels of poverty and food insecurity.
This scenario is worsened by climatic variability
that negatively impacts the environment as well
as natural resources (UNEP and GoK, 2000;
2006).
While the need for current and accurate
information on land resources to build sound
policies is being more and more recognized,
there is still a lack of knowledge, understanding
and awareness on the severity of these
environmental issues in Kenya at both the local
and national levels. Periodic spatial land cover
and land use assessments are important
generators of information on the state of
environment as well as on the conditions and
trends of the natural resources. These
assessments can also provide information on
environmental hotspots resulting from
unsustainable utilisation of the natural resources
such as deforestation, degraded wildlife habitats,
diminishing biodiversity, loss of wetlands as
well as water degradation sites.
The various components and resources in an
ecosystem are closely interrelated and there is
need to manage, and assess them in an integrated
manner. Therefore, a holistic approach of
assessment of natural resource is desirable to
enhance the knowledge and understanding of the
interactions between, for example, land use
management practices and the natural resources
and ecosystems functions and services they
provide. However assessments of natural
resources in Kenya have been mainly sector
based, usually driven by limited information
needs by policy makers or institutions that target
one particular aspect or a particular resource. As
such the concept of the Integrated Natural
Resource Assessment (INRA) in Kenya, to
address biodiversity and ecosystems functions
and services in a more holistic way through an
ecosystem approach, was conceived. INRA aims
at establishing a monitoring system that can
generate information on the state and changes of
the environment and natural resources for policy
formulation, land use planning, conservation and
sustainable utilization of natural resources.
The INRA started with a pilot supported under
the FAO-Netherlands Partnership Programme
(FNPP) and covered, in particular, forest,
agriculture, wildlife and water resources with a
particular focus on agro-biodiversity and
ecosystems services and integrity (FAO & GoK,
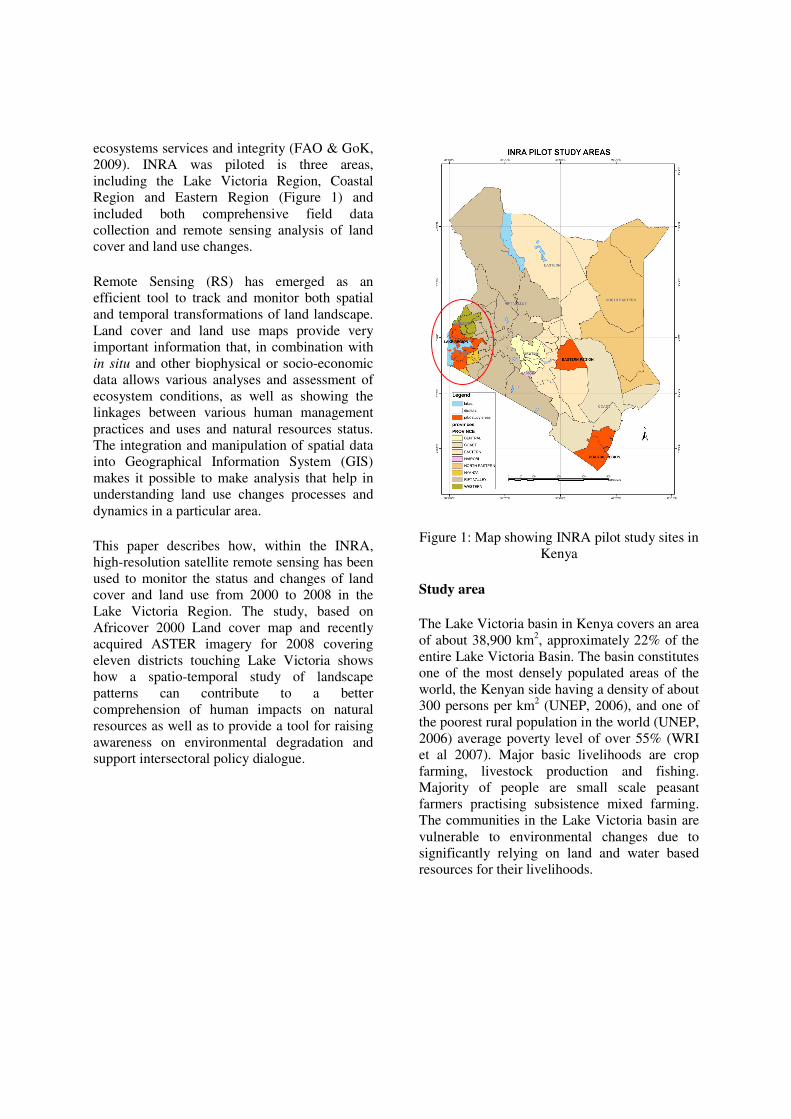
2009). INRA was piloted is three areas,
including the Lake Victoria Region, Coastal
Region and Eastern Region (Figure 1) and
included both comprehensive field data
collection and remote sensing analysis of land
cover and land use changes.
Remote Sensing (RS) has emerged as an
efficient tool to track and monitor both spatial
and temporal transformations of land landscape.
Land cover and land use maps provide very
important information that, in combination with
in situ and other biophysical or socio-economic
data allows various analyses and assessment of
ecosystem conditions, as well as showing the
linkages between various human management
practices and uses and natural resources status.
The integration and manipulation of spatial data
into Geographical Information System (GIS)
makes it possible to make analysis that help in
understanding land use changes processes and
dynamics in a particular area.
This paper describes how, within the INRA,
high-resolution satellite remote sensing has been
used to monitor the status and changes of land
cover and land use from 2000 to 2008 in the
Lake Victoria Region. The study, based on
Africover 2000 Land cover map and recently
acquired ASTER imagery for 2008 covering
eleven districts touching Lake Victoria shows
how a spatio-temporal study of landscape
patterns can contribute to a better
comprehension of human impacts on natural
resources as well as to provide a tool for raising
awareness on environmental degradation and
support intersectoral policy dialogue.
Figure 1: Map showing INRA pilot study sites in
Kenya
Study area
The Lake Victoria basin in Kenya covers an area
of about 38,900 km2, approximately 22% of the
entire Lake Victoria Basin. The basin constitutes
one of the most densely populated areas of the
world, the Kenyan side having a density of about
300 persons per km2 (UNEP, 2006), and one of
the poorest rural population in the world (UNEP,
2006) average poverty level of over 55% (WRI
et al 2007). Major basic livelihoods are crop
farming, livestock production and fishing.
Majority of people are small scale peasant
farmers practising subsistence mixed farming.
The communities in the Lake Victoria basin are
vulnerable to environmental changes due to
significantly relying on land and water based
resources for their livelihoods.
2. MATERIALS AND METHODS
2.1 Remote sensing data used
Two sets of Landsat Satellite images of the years
2000-2001 and 2006-2008 and a selection of
ASTER images of varying dates between 2006
and 2008 covering the eleven districts of the
Lake Victoria Region were acquired. The two
sets of satellite imageries were used to track
temporal changes on the resources in the study
area. On-line selection of the satellite images
was done based on the date of images,
seasonality and percentage of cloud cover. The
most recent Landsat ETM+ images were
downloaded free of charge from the Global Land
Cover Facility (GLCF) web site
http://www.landcover.org/. ASTER images were
purchased from the United States Geological
Survey (USGS). All the images acquired were
single band digital and pre-processed
(radiometrically corrected, terrain corrected and
geometrically corrected) and in GEOTIFF
format. The ASTER images were acquired at
level - 1B, calibrated radiance images for each
band. The images were projected to Universal
Transverse Mercator (UTM) WGS84 zone 36
South.
AFRICOVER land cover dataset served as a
basis for the classification and analysis of
satellite images.
2.2 Image processing procedures
Image processing procedures carried out
included creating image composites to form
multi-band images. The images were imported
into ERDAS Imagine (ERDAS format, .img).
The Landsat composite images were made
by using three bands of the Enhanced
Thematic Mapper (ETM+) sensor forming
the false colour image where bands were red
represents the Near Infrared (ETM+ band 4),
green represents Red (ETM+ band 3) and
blue represents green (ETM+ band 2). This
results into RGB where it is equated to
NRG. ASTER composites images were
made from bands 1, 2 and 3N in the VNIR
bands.
The .img images were re-exported back to
GEOTIFF format. All the images and the
AFRICOVER shapefiles were re-projected to
UTM WGS 84 Zone 36 South.
Each of the images was georeferenced using the
“Transform using links” in GeoVis software
based on the AFRICOVER layers to ensure they
perfectly overlaid before the interpretation
exercise. The images were enhanced using linear
stretching using Image Works, a module of the
PCI image processing software in order to
improve their clarity during interpretation. Some
of the images were enhanced using photoshop
software and re-exported into ERDAS Imagine
for georefencing and projection. The Landsat
and ASTER images were geocoded using
ERDAS software. The ASTER images were
mosaiqued so that they could cover the study
area. The Landsat and the mosaics of ASTER
were used for change detection.
2.3. Classification scheme
The classification legend used in this study is
based on a dichotomous approach and defines
land cover and land use classes based on four
levels of classification (see Figure 2). These
classes are defined in details in the INRA Field
Manual (FAO & GoK, 2007). The first level is
composed of the global classes designed for the
assessment of resources at global level and is
based on the classification system developed by
the FAO global Forest Resources Assessment
(FRA) to ensure harmonisation between
countries for regional or global assessments. The
global classes include Forests, Other wooded
land, Other land and Inland water. The second,
third and fourth levels are country specific, and
include additional classes designed to meet
specific national and sub-national information
needs. The second level applies to all classes and
differentiates between land use/cover types; the
third level only applies to forest and describes
naturalness of forests; while the fourth level
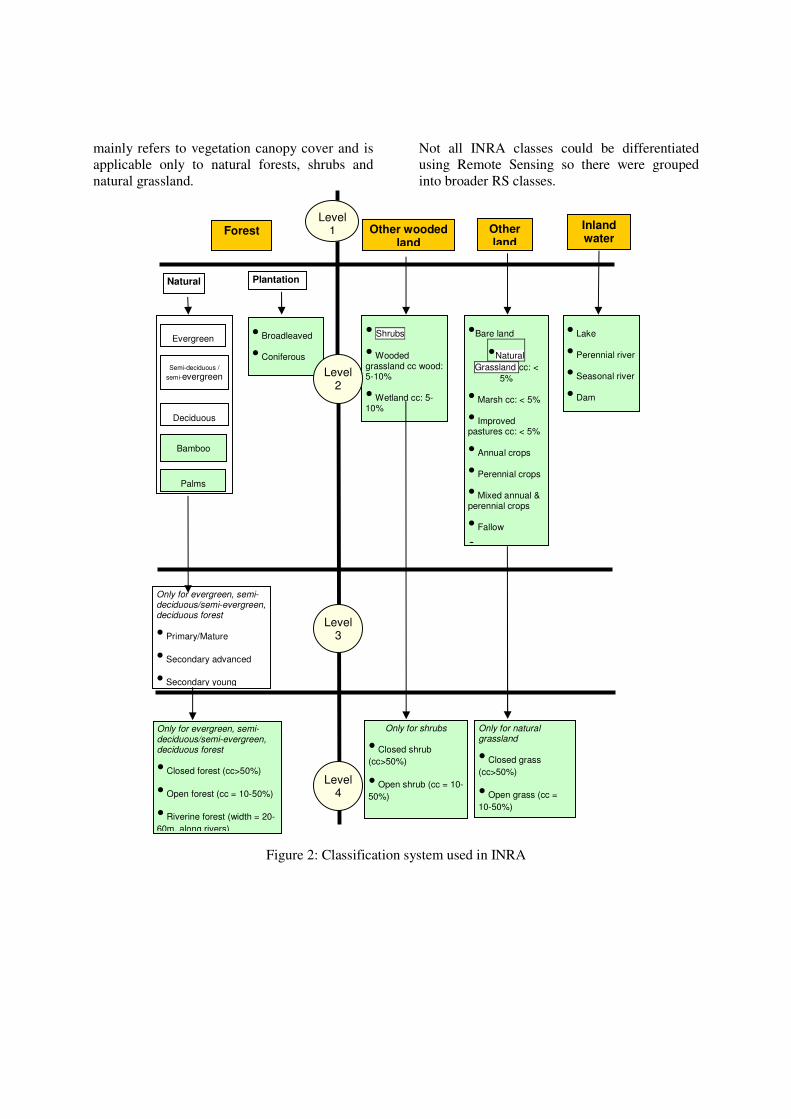
mainly refers to vegetation canopy cover and is
applicable only to natural forests, shrubs and
natural grassland.
Not all INRA classes could be differentiated
using Remote Sensing so there were grouped
into broader RS classes.
Figure 2: Classification system used in INRA
Forest
Evergreen
Natural Plantation
s
Only for evergreen, semi-deciduous/semi-evergreen, deciduous forest
• Primary/Mature
• Secondary advanced
• Secondary young
Level 3
Other wooded
land
Other
land
Inland
water
• Shrubs
• Wooded grassland cc wood: 5-10%
• Wetland cc: 5-10%
•Bare land
•Natural
Grassland cc: <
5%
• Marsh cc: < 5%
• Improved pastures cc: < 5%
• Annual crops
• Perennial crops
• Mixed annual & perennial crops
• Fallow
• Wood lot
• Lake
• Perennial river
• Seasonal river
• Dam
•
Level 1
Semi-deciduous /
semi-evergreen
Deciduous
Bamboo
Palms
• Broadleaved
• Coniferous
Level 2
Level 4
Only for evergreen, semi-deciduous/semi-evergreen, deciduous forest
• Closed forest (cc>50%)
• Open forest (cc = 10-50%)
• Riverine forest (width = 20-
60m, along rivers)
Only for shrubs
• Closed shrub
(cc>50%)
• Open shrub (cc = 10-
50%)
Only for natural grassland
• Closed grass
(cc>50%)
• Open grass (cc =
10-50%)
2.3. Classification and change detection
procedures
2.3.1 Reclassification and review of Africover
dataset for 2000/2000:
The AFRICOVER land cover layers (initially
derived from Landsat satellite images of
2000/2001) were reclassified based on the INRA
Remote Sensing classes. These AFRICOVER
data was reclassified according to INRA land
use/ land cover classification based on the Land
Cover Classification System (LCCS). The
polygons/classes of the dataset were adjusted
using the 2000 Landsat imagery, experience and
field knowledge. The polygons were produced
using GEOVIS, a vector-based editing system
specifically designed for thematic interpretation.
It also has a direct link with the Land Cover
Classification System (LCCS), which enables
immediate assignment of specific land cover and
land use classes to the interpretation polygons.
2.3.2 Interclass Change Detection between
Landsat imagery for 2000/2001 and Aster
imagery from 2006/2008:
Detailed interclass changes/trends detection
between 2000 and 2008 was carried out on-
screen using the prepared datasets of ASTER
images (2007/2008) and Landsat (2000/2001).
The swipe module in ERDAS Imagine Software
was applied.
The temporal changes were mapped out using
the land cover and land use layers generated
from 2000 and 2008 datasets. The changes were
mapped using the Geographical Vector
Interpretation Software (GeoVIS). The
interpretation scale ranged between 1:25000 and
1:50000.
The resulting classified vector maps were
exported into a Geographical Information
System (GIS) environment using appropriate
softwares including: ArcInfo, and ArcGIS and
Arcview to facilitate further GIS based
manipulations, analysis and modelling.
Further analysis of the results was carried out
using Microsoft Excel to generate graphics for
interpretation of the changes and presentation of
the results.
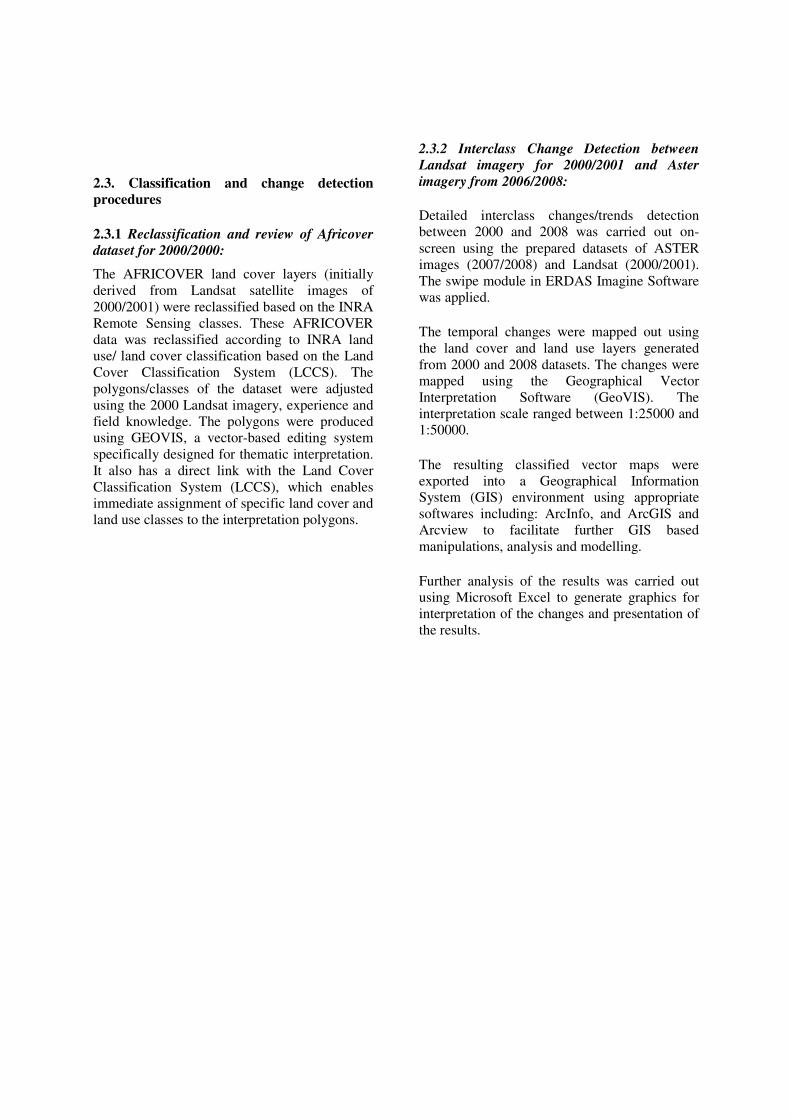
3. RESULTS AND DISCUSSION
3.1 Land cover and land use maps and changes
Figures 3 and 4 show the final land cover and land use maps of the study area, representing the different
land based resources in the Lake Victoria basin in 2000 and 2008. Figure 5 identifies changes that
occurred between 2000 and 2008.
Figure 3a: Land cover/land use 2000
Figure 3b: Land cover/land use 2008
Figure 4: Changes in land cover and land use 2000-2008 (change areas are in pink)
Year 2008
1%4%
71%
24%Forest
OWL
OL
IW
Year 2000
1% 7%
67%
25% Forest
OWL
OL
IW
Year 2000
60%
32%
3% 5% 0%OCA
OCM
OCP
OM
OG
Year 2008
61%
32%
3% 4%0% OCA
OCM
OCP
OM
OG
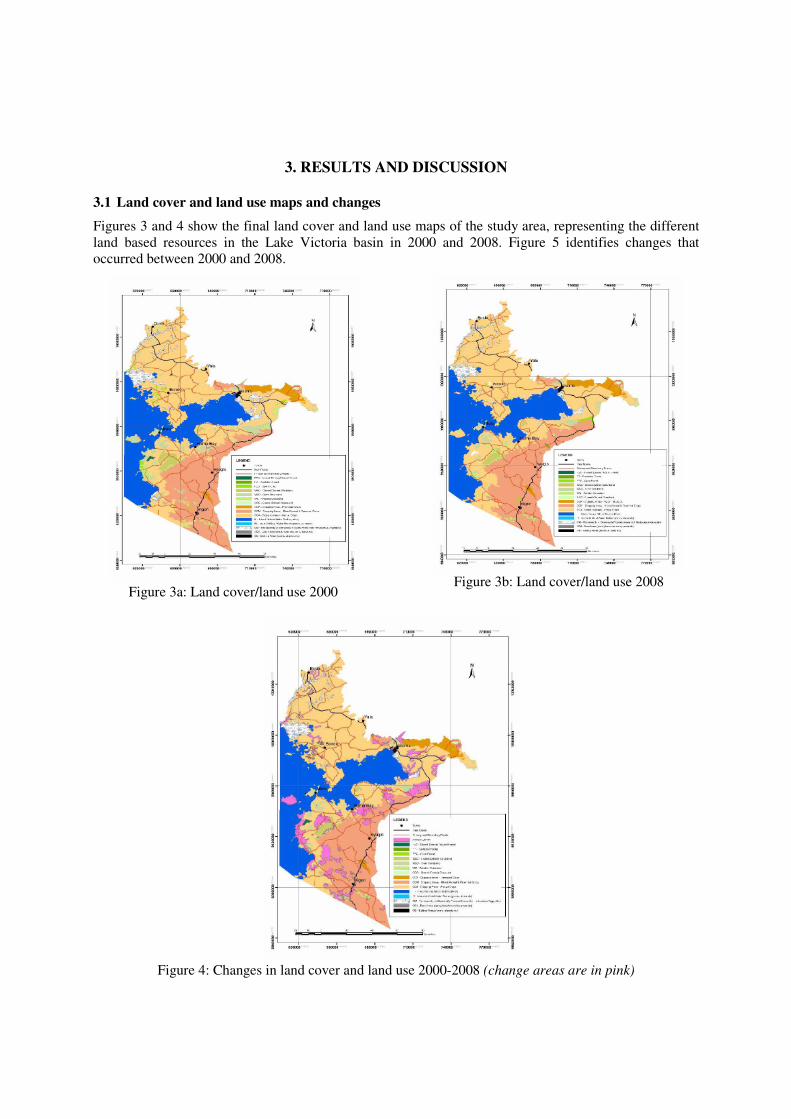
Figures 3, 4, 5 and Table 1 below show the
various land cover and land use classes found in
the study.
In the study area the results of the level 1 classes
are shown in Figures 5a and 5b below.
Figure 5a: Main land cover classes in 2000
Figure 5b: Main land cover classes in 2008
The most dominant class is the Other Lands
(OL) occupying 67% and 71% in 2000 and 2008
respectively. Inland Water (IW) class occupies
25% and 24% in 2000 and 2008 respectively.
The Forest class occupies 1% of the study area.
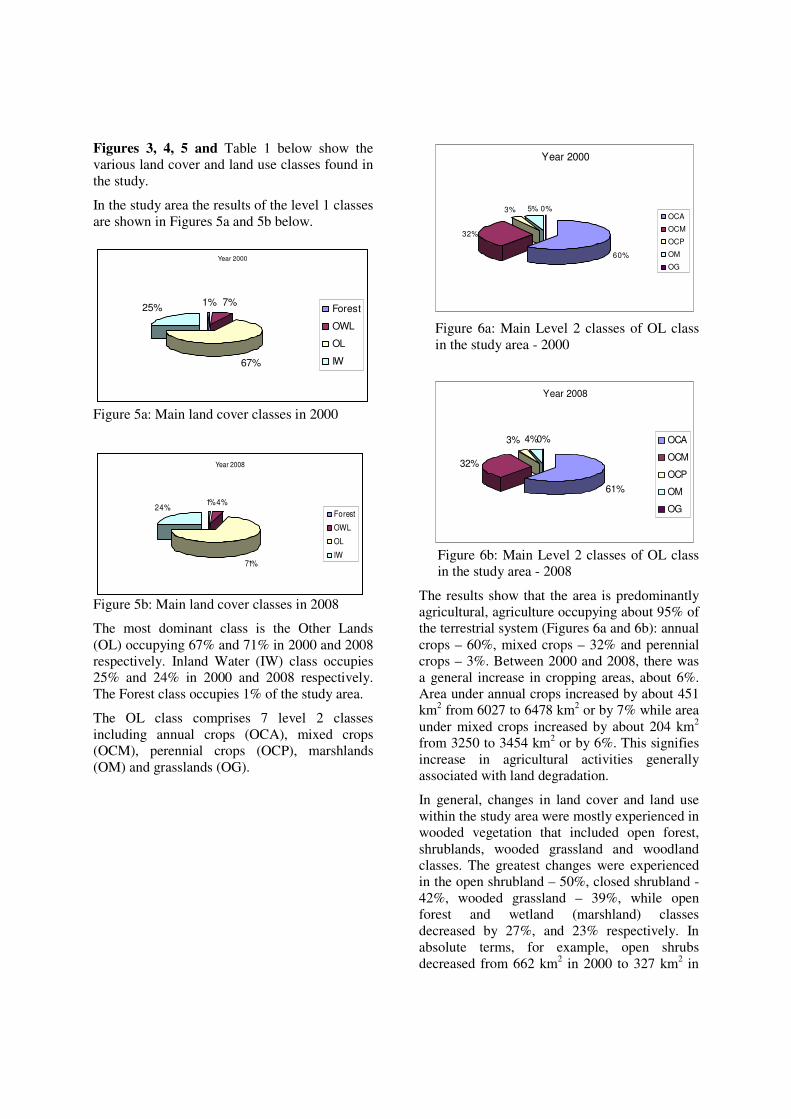
The OL class comprises 7 level 2 classes
including annual crops (OCA), mixed crops
(OCM), perennial crops (OCP), marshlands
(OM) and grasslands (OG).
Figure 6a: Main Level 2 classes of OL class
in the study area - 2000
Figure 6b: Main Level 2 classes of OL class
in the study area - 2008
The results show that the area is predominantly
agricultural, agriculture occupying about 95% of
the terrestrial system (Figures 6a and 6b): annual
crops – 60%, mixed crops – 32% and perennial
crops – 3%. Between 2000 and 2008, there was
a general increase in cropping areas, about 6%.
Area under annual crops increased by about 451
km2 from 6027 to 6478 km2 or by 7% while area
under mixed crops increased by about 204 km2
from 3250 to 3454 km2 or by 6%. This signifies
increase in agricultural activities generally
associated with land degradation.
In general, changes in land cover and land use
within the study area were mostly experienced in
wooded vegetation that included open forest,
shrublands, wooded grassland and woodland
classes. The greatest changes were experienced
in the open shrubland – 50%, closed shrubland -
42%, wooded grassland – 39%, while open
forest and wetland (marshland) classes
decreased by 27%, and 23% respectively. In
absolute terms, for example, open shrubs
decreased from 662 km2 in 2000 to 327 km
2 in
2008. The changes were mainly conversions into
agricultural lands. Such changes, unless
accompanied by proper land husbandry systems
and appropriate land use policies, are likely to
results into extensive land degradation and
massive loss of biodiversity, both floral and
faunal as well as altering the lake basin
ecosystems significantly.
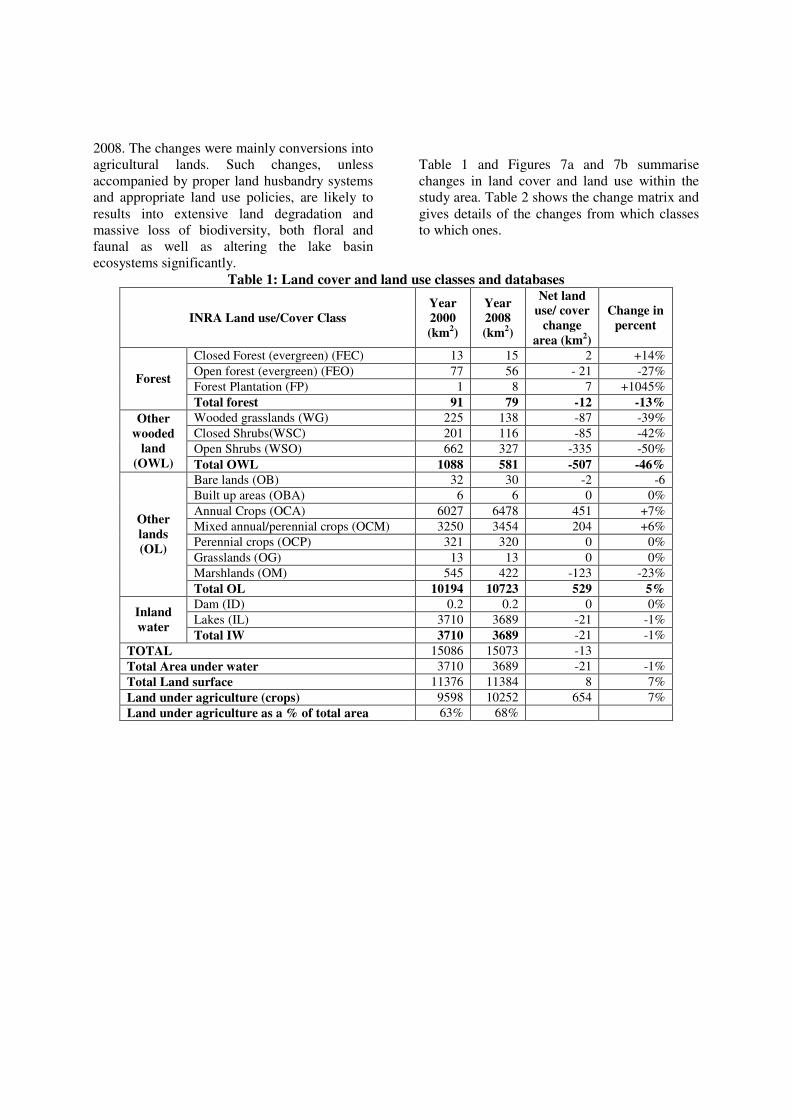
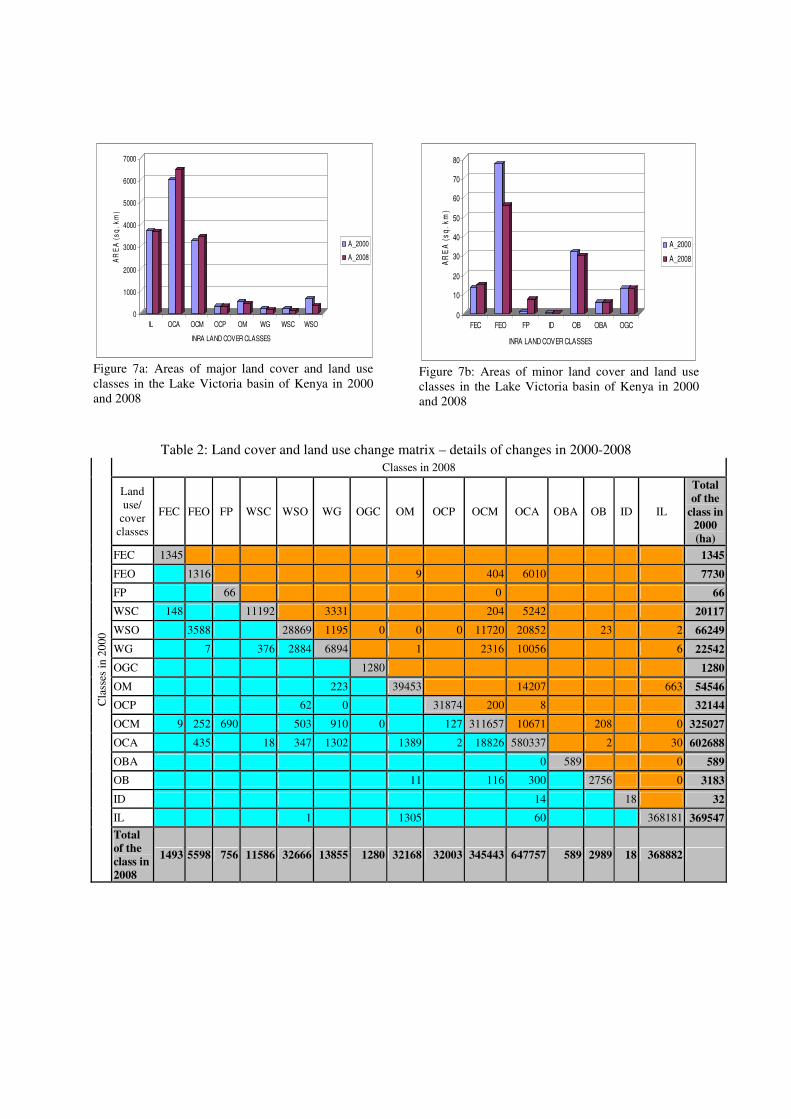
Table 1 and Figures 7a and 7b summarise
changes in land cover and land use within the
study area. Table 2 shows the change matrix and
gives details of the changes from which classes
to which ones.
Table 1: Land cover and land use classes and databases
INRA Land use/Cover Class
Year
2000
(km2)
Year
2008
(km2)
Net land
use/ cover
change
area (km2)
Change in
percent
Closed Forest (evergreen) (FEC) 13 15 2 +14%
Open forest (evergreen) (FEO) 77 56 - 21 -27%
Forest Plantation (FP) 1 8 7 +1045% Forest
Total forest 91 79 -12 -13%
Wooded grasslands (WG) 225 138 -87 -39%
Closed Shrubs(WSC) 201 116 -85 -42%
Open Shrubs (WSO) 662 327 -335 -50%
Other
wooded
land
(OWL) Total OWL 1088 581 -507 -46%
Bare lands (OB) 32 30 -2 -6
Built up areas (OBA) 6 6 0 0%
Annual Crops (OCA) 6027 6478 451 +7%
Mixed annual/perennial crops (OCM) 3250 3454 204 +6%
Perennial crops (OCP) 321 320 0 0%
Grasslands (OG) 13 13 0 0%
Marshlands (OM) 545 422 -123 -23%
Other
lands
(OL)
Total OL 10194 10723 529 5%
Dam (ID) 0.2 0.2 0 0%
Lakes (IL) 3710 3689 -21 -1% Inland
water Total IW 3710 3689 -21 -1%
TOTAL 15086 15073 -13
Total Area under water 3710 3689 -21 -1%
Total Land surface 11376 11384 8 7%
Land under agriculture (crops) 9598 10252 654 7%
Land under agriculture as a % of total area 63% 68%
0
1000
2000
3000
4000
5000
6000
7000
AR
EA
(s
q.
km
)
IL OCA OCM OCP OM WG WSC WSO
INRA LAND COVER CLASSES
A_2000
A_2008
Figure 7a: Areas of major land cover and land use
classes in the Lake Victoria basin of Kenya in 2000
and 2008
0
10
20
30
40
50
60
70
80
AR
EA
(s
q.
km
)
FEC FEO FP ID OB OBA OGC
INRA LAND COVER CLASSES
A_2000
A_2008
Figure 7b: Areas of minor land cover and land use
classes in the Lake Victoria basin of Kenya in 2000
and 2008
Table 2: Land cover and land use change matrix – details of changes in 2000-2008
Classes in 2008
Land use/
cover
classes
FEC FEO FP WSC WSO WG OGC OM OCP OCM OCA OBA OB ID IL
Total
of the
class in
2000
(ha)
FEC 1345 1345
FEO 1316 9 404 6010 7730
FP 66 0 66
WSC 148 11192 3331 204 5242 20117
WSO 3588 28869 1195 0 0 0 11720 20852 23 2 66249
WG 7 376 2884 6894 1 2316 10056 6 22542
OGC 1280 1280
OM 223 39453 14207 663 54546
OCP 62 0 31874 200 8 32144
OCM 9 252 690 503 910 0 127 311657 10671 208 0 325027
OCA 435 18 347 1302 1389 2 18826 580337 2 30 602688
OBA 0 589 0 589
OB 11 116 300 2756 0 3183
ID 14 18 32
IL 1 1305 60 368181 369547
Cla
sses
in
20
00
Total
of the
class in
2008
1493 5598 756 11586 32666 13855 1280 32168 32003 345443 647757 589 2989 18 368882
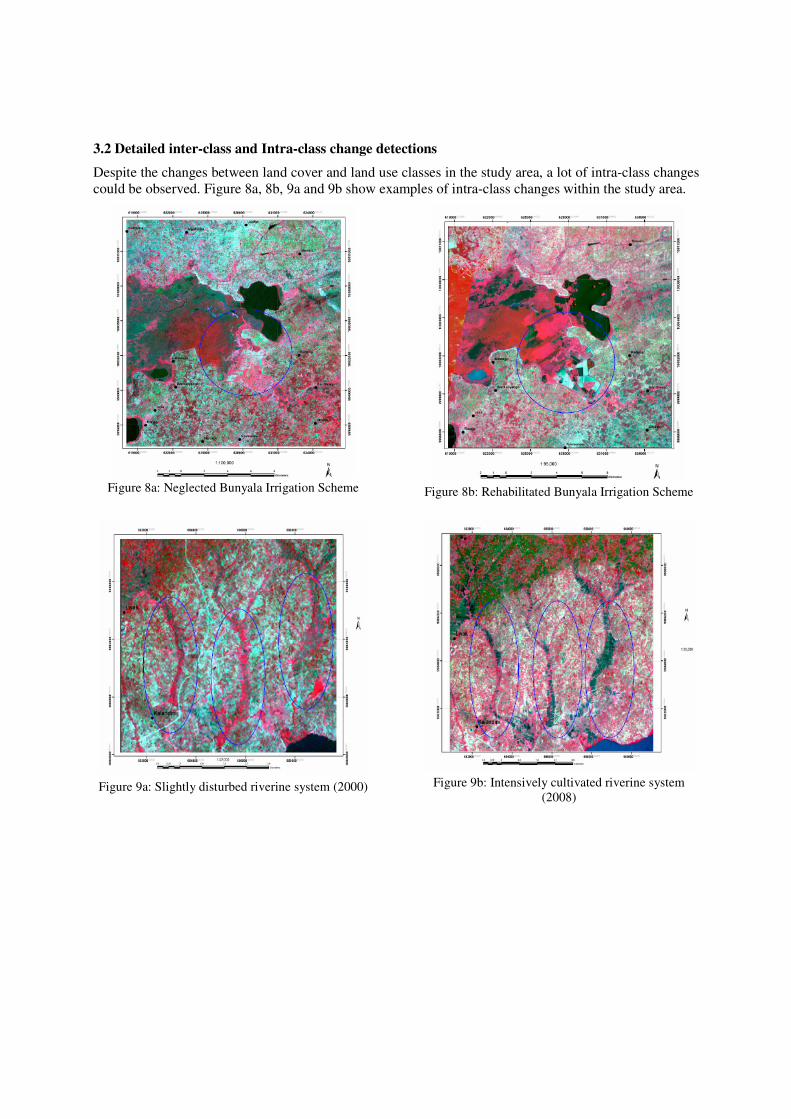
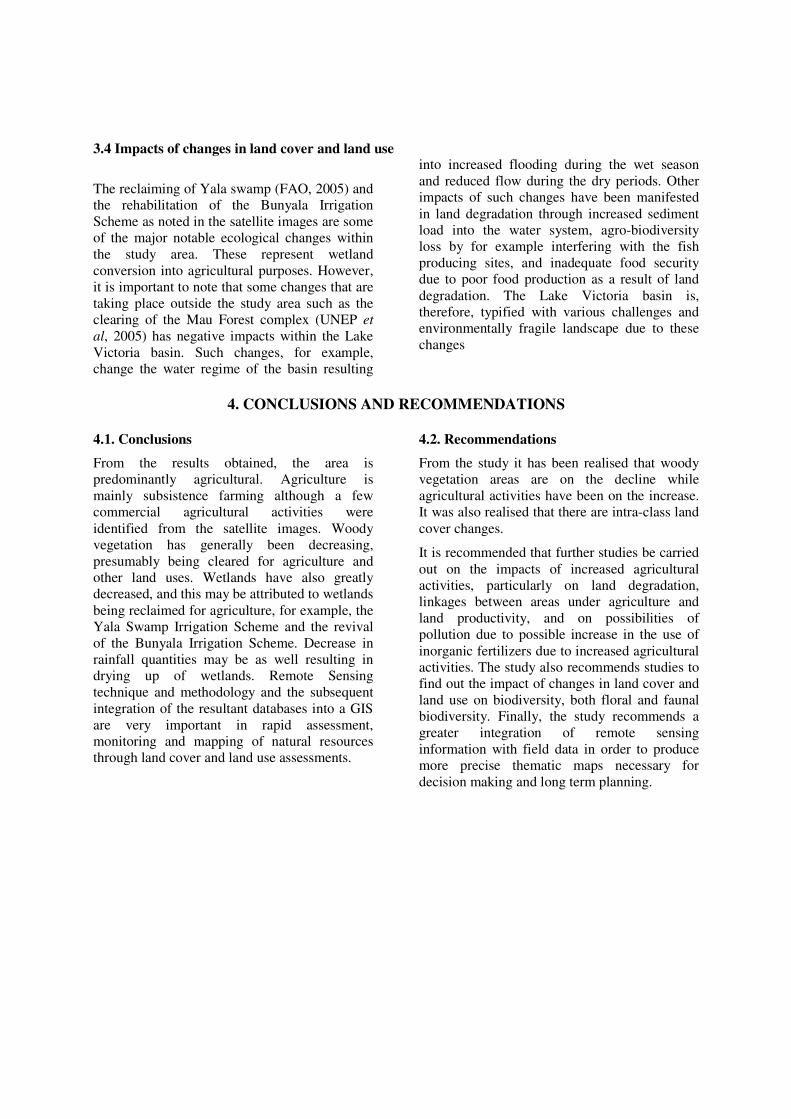
3.2 Detailed inter-class and Intra-class change detections
Despite the changes between land cover and land use classes in the study area, a lot of intra-class changes
could be observed. Figure 8a, 8b, 9a and 9b show examples of intra-class changes within the study area.
Figure 8a: Neglected Bunyala Irrigation Scheme
Figure 8b: Rehabilitated Bunyala Irrigation Scheme
Figure 9a: Slightly disturbed riverine system (2000)
Figure 9b: Intensively cultivated riverine system
(2008)
3.4 Impacts of changes in land cover and land use
The reclaiming of Yala swamp (FAO, 2005) and
the rehabilitation of the Bunyala Irrigation
Scheme as noted in the satellite images are some
of the major notable ecological changes within
the study area. These represent wetland
conversion into agricultural purposes. However,
it is important to note that some changes that are
taking place outside the study area such as the
clearing of the Mau Forest complex (UNEP et
al, 2005) has negative impacts within the Lake
Victoria basin. Such changes, for example,
change the water regime of the basin resulting
into increased flooding during the wet season
and reduced flow during the dry periods. Other
impacts of such changes have been manifested
in land degradation through increased sediment
load into the water system, agro-biodiversity
loss by for example interfering with the fish
producing sites, and inadequate food security
due to poor food production as a result of land
degradation. The Lake Victoria basin is,
therefore, typified with various challenges and
environmentally fragile landscape due to these
changes
4. CONCLUSIONS AND RECOMMENDATIONS
4.1. Conclusions
From the results obtained, the area is
predominantly agricultural. Agriculture is
mainly subsistence farming although a few
commercial agricultural activities were
identified from the satellite images. Woody
vegetation has generally been decreasing,
presumably being cleared for agriculture and
other land uses. Wetlands have also greatly
decreased, and this may be attributed to wetlands
being reclaimed for agriculture, for example, the
Yala Swamp Irrigation Scheme and the revival
of the Bunyala Irrigation Scheme. Decrease in
rainfall quantities may be as well resulting in
drying up of wetlands. Remote Sensing
technique and methodology and the subsequent
integration of the resultant databases into a GIS
are very important in rapid assessment,
monitoring and mapping of natural resources
through land cover and land use assessments.
4.2. Recommendations
From the study it has been realised that woody
vegetation areas are on the decline while
agricultural activities have been on the increase.
It was also realised that there are intra-class land
cover changes.
It is recommended that further studies be carried
out on the impacts of increased agricultural
activities, particularly on land degradation,
linkages between areas under agriculture and
land productivity, and on possibilities of
pollution due to possible increase in the use of
inorganic fertilizers due to increased agricultural
activities. The study also recommends studies to
find out the impact of changes in land cover and
land use on biodiversity, both floral and faunal
biodiversity. Finally, the study recommends a
greater integration of remote sensing
information with field data in order to produce
more precise thematic maps necessary for
decision making and long term planning.
REFERENCES
Baldyga, T. J. et al, 2007: Tracy J. Baldyga, Scott N. Miller, Kenneth L. Driese and Charles M. Gichaba,
2007: Assessing land cover change in Kenya’s Mau Forest region using remotely sensed data.
FAO, 2005: Land Cover Classification System: Environment and Natural Resources Series
FAO & GoK, 2007: Integrated Natural Resources Assessment in Kenya: Field Manual, 7th Edition.
FAO & GoK, 2009: Integrated Natural Resources Assessment in Kenya: Result from the pilot phase,
Draft.
Hare F. K. and L. A. J. Ogallo, 1993: Climate Variations, Drought and Desertification: World
Meteorological Organization – WMO – No. 653, 1993.
Husle, J. H., 2007: Sustainable Development at Risk: Ignoring the past. Cambridge University Press,
India Pvt. Ltd, India and International Development Research Centre (IDRC), Canada
UNEP, 2006: Lake Victoria Basin Environment Outlook: Environment and Development. UNEP,
Nairobi.
UNEP, 2005: One Planet Many People: Atlas of Our Changing Environment, UNEP, Nairobi, Kenya, pp
1-229
UNEP, 2005: One Planet Many People: Atlas of Our Changing Environment, UNEP, Nairobi, Kenya, pp
1-229
UNEP and GoK, 2006: Kenya Drought – Impacts on agriculture, livestock and wildlife. pp 33 – 38
UNEP and GoK, 2000: Devastating Drought in Kenya: Environmental impacts and response. pp 19 – 21
UNEP et al 2005: Maasai Mau Forest status report 2005
USA-Forest Service, 1996: Guidelines for the use of digital imagery for vegetation mapping. United
States Department of Agriculture – Forest Service, Washington DC, July, 1996, pp 7 – 54.
Von Haggen, 2002: Using GEOVIS and LCCS manual GCP/RAF/287/ITA: FAO-AFRICOVER, Food
and Agriculture Organisation of the United Nations, Rome, pp 1 - 2.
WRI, 2003: Millennium Ecosystem Assessment: Ecosystems and Human Well-Being, A Framework for
Assessment: World Resources Institute, Washington DC, pp 26 - 106
WRI , 2000: World Resources 2000-2001: People and Ecosystems: The Fraying Web of Life. World
Resources Institute, Washington DC, pp 3-145.
WRI et al, 2007: World Resources Institute; Department of Resource Surveys and Remote Sensing,
Ministry of Environment and Natural Resources, Kenya; Central Bureau of Statistics, Ministry of
Planning and National Development, Kenya; and International Livestock Research Institute, 2007.
Nature’s Benefits in Kenya, An Atlas of Ecosystems and Human Well-Being. Washington, D.C. and
Nairobi: World Resources Institute. Map 2.2. pp 15.