Embed Size (px)
Citation preview

Long-term File Activity and Inter-Reference Patterns
Lt. Colonel Tim GibsonHQ, Pacific Command
Attn: J641Camp Smith, HI, 96861
Ethan L. MillerDepartment of CSEE
University of Maryland,Baltimore County1000 Hilltop Circle
Baltimore, MD [email protected] 1
Darrell D. E. LongJack Baskin School
of EngineeringUniversity of CaliforniaSanta Cruz, CA [email protected] 2
We compare and contrast long-term file system activity for different Unixenvironments for periods of 120 to 280 days. Our focus is on findingcommon long-term activity trends and reference patterns. Our analysisshows that 90% of all files are not used after initial creation, those that areused are normally short-lived, and that if a file is not used in some mannerthe day after it is created, it will probably never be used. Additionally, wefind approximately 1% of all files are used daily. This information allows usto more accurately predict the files which are never used. These files canbe compressed or moved to tertiary storage enabling either more usersper disk or larger user disk quotas.
1 Supported by the NASA Ames Research Center under grant NAG 2-1094.2 Supported by International Business Machines Corporation (IBM).
1 IntroductionPhysical storage devices have long been the slowest
components of any computer system. While disk andtape storage devices have improved in the lastdecade, their performance has not kept pace withrapid increases in processor speed. This presents achallenge to storage system designers because fasterCPUs encourage both more and larger files, placing ahigher demand on the file system and storage devices.This problem has long been an issue forsupercomputer centers which have always managedhuge quantities of data, but recent advances in CPUperformance have brought traditional supercomputerpower to the desktop. Thus, system designers mustinsure that workstation file systems can keep up withthe increased bandwidth and capacity that increasedCPU speed brings. While much previous work hasfocused on improving short-term performance, wefocus on long-term reference patterns and theirinfluence on performance over days.
This paper is organized into nine sections. We beginby reviewing previous disk activity studies in Section 2.In Section 3, we briefly discuss our data collection andanalysis tools, which differ significantly from thoseused in earlier studies. We describe the different typesof computing environments from which we collecteddata in Section 4. The software written for this paper
analyzes the collected data and generates statistics.The simplest analysis mode provides informationabout daily activity. This is shown in Section 5.Analysis of long-term trends is shown in Section 6. Aninteresting product from this research is a comparisonof the same file system’s activity from either the filename view, or from the operating system's underlyingnumeric index. This comparison is done in Section 7.We summarize our findings in Section 8 and brieflydiscuss our future research in Section 9.2 Related Research
In the 1980’s, both Smith [20], and Ousterhout [15]made detailed studies of file activity on computingsystems. While their observations are still useful, someof the underlying structure has lost relevance. Forexample, Smith primarily observed text-based userfiles for thirteen months; the size and nature of today’smultimedia files, unforeseen when Smith collected hisdata, are much different from the text-based files hestudied. Ousterhout’s very detailed file traces wereconducted over three to four day periods. WhileOusterhout’s work is very useful, his traces werecollected over such a short time that long-term trendscannot be predicted from his data. Baker’s distributedfile system activity logs from 1991 [2] updateOusterhout’s work, concentrate on low-level diskactivity, and have the same short trace periods as

Ousterhout’s traces. More recently, Spasojevic andSatyanarayanan [23] analyzed the long-term behaviorof a wide-area distributed file system, focusing on theperformance of the Andrew File System. They wereprimarily interested in issues such as caching,replication, and reliability in a large, distributed filesystem, and used volumes rather than files as thebasis for their study, limiting its usefulness in showinglong-term behavior at the file level.
Other studies, [7,10,11,12] are directly applicable tosupercomputing centers, but may not apply to smallercomputing centers; both the size and number of files atsupercomputing centers far exceeds “normal”computing activities. Also, supercomputing centersusually have large tape libraries with tape robotsproviding near-line storage for their data files, in somecases exceeding hundreds of terabytes. In contrast,smaller computing centers do not have tape robotsand only use tape for archiving purposes—a trend thatwe believe may change as near-line storage robotswith either tape, digital-versatile–disk (DVD), or high-capacity magneto-optical drives, become moreaffordable and more practical.
Our work most closely resembles Strange’s diskstudies from 1992 [24]. We collect much of the sameinformation as Strange, and in fact corroborate a goodnumber of his findings. However, the traces used herecover twice the time period as Strange’s traces.Additionally, our analysis tool maintains a databaserecord for every file residing on the file system. Thisdatabase information allows us to keep track of howindividual records are accessed, modified, anddeleted. This temporal information on file activity isnew and has not been collected or analyzed before byother authors.3 Tools
Our tracing system was designed with one majorgoal: gather useful information without requiringoperating system kernels to be recompiled. Our tracegathering tool is a modified version of the GNU findutility, which can be used to collect information on allthe files in a file system or directory. The collectedinformation includes the file’s index node number (i-node), size, name, access time, i-node creation time,modification time, owner, and group. The tracingprogram can be run any time, and if the output isplaced into a directory or file system that is not beingstudied, the tracing process is invisible to itself.Additionally, the file’s name can be scrambled toensure user privacy on public systems whilepreserving information about the relationships of filesin the system.
The second component of our system sorts two tracefiles by i-node number, compares them, and generatesa file containing only references to files which havechanged, or have been created or deleted. Thisprogram reduces the long-term storage requirementsand the amount of data which is analyzed later.Difference files generated by this tool are fed into the
analysis program that generates statistics on the itemsshown in Table 1. An additional advantage of using filedifferences is the analysis tool runs faster because ofthe reduced amount of I/O.
Our statistics collection and analysis package for filesystems has some weaknesses. Ousterhout [15] notedthat 80% of all file creations have a lifetime of lessthan three minutes. Because the daemons, compilersand other programs that created these files duringOusterhout’s work still exist, we miss many of thetemporary files they create. However, our collectionsystem is designed to gather information about long-term disk use and file system activity and growth;temporary files that exist for less than three minuteswill not be moved to long-term storage and do notcontribute to long-term growth.
Additionally, the differencing program cannotdetermine how many times a file is accessed ormodified in a single day. It only notices that an accessor modification occurred and when the most recentevent happened. Fortunately, what matters from along-term perspective is that the file was used on acertain day, not how many times it was used.
The only way to collect more detailed information isto either run the tracing system more often or tochange the operating system kernel and generate alarge detailed log file. Both of these options place aheavier load on the computer system and wedeliberately decided against doing either. Additionally,while collecting data with kernel modifications mayprovide more data, it severely restricts the number andtype of computing installations willing to collect traces.We had a difficult time convincing systemadministrators to allow us to run our current collectionprogram; modifying multiple operating system kernelsand convincing the different system managers to usethe modified kernels (and to provide us the additionallog file disk space) was not a feasible solution.
Finally, there are two ways to “look” at any file on aUnix file system. The normal way is with the file’s pathand name, and is exactly what people and mostprograms do when they open or close a file. However,the Unix operating system does not use file names tomanage files. Instead, the operating system giveseach file a unique number. We examine the activitiesof both these file system views, based upon the filenames and the i-nodes, respectively. To distinguishbetween the two, we use the terms hierarchical namespace and numeric index. The reason to examinethese two views of the same file system activity is theyoften differ in significant ways. For example, thenumeric index system view has a large number of filedeletions and very few file modifications. This happensbecause most applications do not modify physical diskfiles, they simply erase the old version and replace itwith a new one. As a result, although a person mayedit the “same” file daily, in actuality a new file iscreated every time she saves the file. This is incontrast to the hierarchical name space view, based

on file names, where the number of file modificationsgreatly exceeds file deletions.
In order to study the hierarchical name space view ofthe file system activity, we use a small conversion
program which changes the file name in a trace fileinto a number based a MD-5 hash of the file name[16].
File Activity Statistics CollectedAccesses, Creates Total number of files and bytes. Produces histograms, grouped by file size, of the number of accesses or
creations.Deletions Same as Access, with deletions where the i-nodes are reused tracked separately from deletions where the i-
node is not reused.Modifications Same as Access with categories for files that are modified and increased in size, decreased in size, or
remained the same.Modification Differences(Deltas)
Same as Access with categories for files that are modified and increased in size or decreased in size. Tracksfiles by the amount of change. Produces a two dimensional histogram of file size versus the amount of themodification.
Change of Name, Owner, orGroup
Separate categories for change of name (Unix mv) change of owner (chown), change of group (chgrp).Outputs the number of files only.
Long-Term Deletions Separate data is kept for overall deletions, files that were accessed before deletion, files which were modifiedbefore deletions, how many times individual files were accessed or modified before deletion. Produces twodimensional histogram by file size and days the file ‘lived’ before it was deleted.
Inter-Access and Inter-Modification Period
Summary of accesses and modifications for the last 30 days. Two dimensional histogram by file size andhow many days pass between file accesses (or modifications) on individual files.
Files on System at AnalysisCompletion
Summary of file system status at the end of the trace period. Produces two dimensional histogram by file sizeand number of times files have been accessed or modified. One dimensional histogram, by file size, of filesthat have never been used.
Table 1. Statistics collected by the analysis program.
4 Computing Environments ExaminedWe collected and analyzed daily traces for analysis
on four different computing systems. Two are at theUniversity of Maryland, Baltimore County (UMBC), thethird is at the University of California at Santa Cruz(UCSC), and the fourth is at the U.S. Army’s AberdeenProving Ground. Table 2 summarizes these systems.The UMBC Computer Science (CS) department’s filesystem trace collection began in October 1996. Weexpanded our collection efforts on the CS systems inMay 1997, hence the long and short collection periods.
We also began collecting traces from the AberdeenProving Ground (APG) and the University ComputingServices (UCS) file systems in May 1997.
The University of California traces were collecteddaily with a different tracing process and do notcontain all long-term file system actions. Instead, theyprovide a listing of the file names, along with the file’ssize, access, modification, and creation times, whichwere modified during the past 24 hours. This affectsthe amount of analysis we can provide.
Aberdeen Proving Ground(APG)
UniversityComputing
Services (UCS)
CS Dept.(Long Period)
CS Dept.(Short Period)
Univ of CA,Santa Cruz
Average Number ofFiles on System
72,000 1,320,000 230,000 690,000 2,300,000
Disk Capacity(avg. percent full)
3.6 GB (80%) 35 GB (70%) 11 GB (70%) 28 GB (50%) 84 GB
Type(s) of FS traced User and System User only User only User and System User and SystemNumber of FS traced 7 user, 1 system 9 user 4 user 6 user, 2 system 49Type of System Administrative General-purpose Development Development DevelopmentNumber of Users 300 full-time, 2,000 email only ~15,000 ~500 ~500 ~500Trace Length 210 days 239 days 287 days 157 days 207 days
Table 2. Summary of Systems Examined
5 Basic File System ActivityThis section analyzes daily file activity using the file
system analyzer’s simplest mode, which has no long-term memory about individual files. As a result, itprovides very little information about individual fileactivity.5.1 Distribution of File Sizes
The first file system attribute we examined was thedistribution of file sizes across the different filesystems, as shown in Figure 1. This figure shows boththe percentage and cumulative percentage of files oneach system by file size groupings. The bar chart
shows the percentage of files in each size category,while the lines are the cumulative percentage.
The interesting thing to note in Figure 1 is that mostfiles are relatively small, more than half are less than 8KB. While the graph stops at 1 MB, this encompasses99.5% of the files collected at the university and 96%of the files on the APG system. The APG usersoccasionally had a large word processing, email files,keeping the APG averages lower than the CS andUCS system averages. Surprisingly, there is also littledifference in size distribution between the ComputerScience user and system-level file systems.

Figure 1. File Sizes, by size category and cumulative.
One of the most important facts to gather from Figure1 is that 80% or more of the files are smaller than 32KB. On the other hand, while only 25% are larger than8 KB, this 25% contains the majority of the bytes usedon the different systems, as shown in Figure 2. Thisfigure depicts the total number of megabytes used byfile size category on each system. The totals betweenthe different systems vary because the disk capacitiesare different.
Figure 2. Total disk spaced used by file size category.The bar chart shows distribution by size category, theline chart shows the same data cumulatively.
5.2 Usage by Transaction TypeThe software's simplest analysis mode provides a
variety of information on the number of files and bytesused daily on each file system. Figure 3 and Figure 4show the average daily file use per transaction type onthe different systems. Figure 3 shows, as a percentageof daily file activity, the percentage of files accessed,created, deleted, or modified. In all cases, the greatestpercentage is in the accessed category. Approximatelyone-half as many files are created and deletedcompared to those accessed. This is logical becausemany files are only accessed (e.g., program files, datafiles, and configuration files), rather than created ordeleted. The number of file modifications lags farbehind all other actions on the Computer Science
systems. The reason there are so few modifications onthe CS file systems is that many computerapplications, particularly the applications programmersuse, do not modify files, rather they create new filesand rename or delete the original.
Figure 3. Activity by type, percentage of totaltransactions.
For instance, when a programmer changes a file witha text editor and saves the changes, the followingsteps occur:
• User gives command to open the file/home/profile
• Operating System finds the i-node (e.g.,34,717) associated with /home/profile
• Operating System gets the file’s disk blocknumbers from the i-node
• Operating System reads the disk blocks andloads the file into memory (RAM)
• User makes changes and “saves” the file• Operating System writes the modified file to a
new set of disk blocks with a new i-node• Operating System frees the old disk blocks
and the old i-node• Operating System updates the file name
/home/profile to point to the new i-node.
As a result, from the viewpoint of the operatingsystem’s numeric index, saving the file with a texteditor results in a file creation and a file deletion, not afile modification. Most programs, including word-processors, use the same technique as the text editor.An exception to this general rule is electronic mail (e-mail) packages, which actually modify the filescontained in a user’s in-box. Note: the in-box forelectronic mail on Unix systems is one file, regardlessof how many messages are contained within the in-box.
The result of this exception for e-mail files is seen inFigure 4. Figure 4 is similar to Figure 3, except that itdisplays bytes instead of files. On both the UCS andthe APG systems, most users only use the computersystem for e-mail. The result is that while only 15% ofthe files on these systems are modified daily (asshown in Figure 3), these modifications account forover 70% of the bytes used daily (in Figure 4) on theUCS and APG systems. The Figure 4 increase inmodifications can also be seen in the ComputerScience traces; the increase is not as noticeable in the

CS data because most CS users do more with thesystem than read e-mail.
Figure 4. Activity by type, percentage of totaltransaction bytes.
While Figure 3 and Figure 4 provide interestingobservations about the manner in which users andapplications use and modify files, most importantlythey illustrate the need to optimize file accesses.5.3 Growth of Individual Files from Modifications
The basic analysis also provides information aboutthe ratio between modifications that make a file larger,modifications that leave the file the same size, andthose that make the file smaller. On the CS systems,all these categories of modification were approximatelythe same. However, on the UCS and APG systems,the number of files modified that increased in size wasdouble the other two categories added together. While46% of the modifications on the CS systems increaseda file by 512 bytes or less, 67% of the modifications onthe UCS system were in the 1 KB to 16 KB range.Again, we attribute this to the e-mail files, becausereceiving a few e-mail messages daily causes this typeof increase.
On the UCS system, e-mail activity also appears inhow files decrease in size. This occurs because manyusers keep their e-mail messages for a long time, withtheir single in-box file slowly growing in size. However,users eventually delete many of the old messages,usually at one time. On the UCS system, 48% of filemodifications occurred when a file lost between 4 KBand 32 KB. The APG system behavior is similar. Incontrast, 69% of the CS file modifications reduce filesless than 512 bytes, with only 16% falling into the 4 KBto 32 KB range. While the UCS and the APG activity isin keeping with how users handle e-mail files, theactivity on the CS systems is consistent withdevelopment activity. Both these findings andobservations are in accord with the different systemenvironments.
This file growth rate has direct implications foroperating system design. When a file needs toincrease in size, some operating systems allocateadditional space based on the file’s original size—thelarger the file the more space is allocated. In order torecover unused disk space, the operating system mustkeep track of the files that received additional space,and recover any unused disk space at a later time.However, as we have shown, files do not increase indirect proportion to their original size. Becauserelatively few Unix files increase in size at all, it may be
more efficient to allocate disk blocks differently. Forexample, disk blocks can even be allocated one blockat a time — writing some files will take longer, but theadditional CPU cycles to find unused disk blocks areeliminated.5.4 File System Growth
The previous sub-sections showed that:• Few numeric index files are modified;• At most, half of all numeric index modifications
result in a file size increase; and• Most numeric index file size increases from
modifications are less than 32 KB.
A logical question to ask after discovering these factsabout file modifications is ‘what causes file systems togrow?’ Figures 5 and 6 show byte creep on the CSand UCS systems. Byte creep is the cumulativenumber of bytes added to the system by creations andmodification increases, with the number of bytesdeleted or lost from modification decreases subtracted.Both the UCS and the CS file systems became largerduring the trace collection, however, the reasons forthese increases were different. For example, the UCSsystem increased primarily because existing filesbecame larger from file modifications. The number ofbytes gained or lost from file creations and deletionsremained relatively constant. Note: The spike in theUCS trace on day 55 and day 56 is caused by a diskdrive failure and a tape restore over a weekend.
Figure 5. Byte Creep on the UMBC UCS Systems(9 file systems, 239 days, May 1997—January 1998).
The CS file system, on the other hand, exhibitsmarkedly different behavior. Nearly all file systemgrowth on the CS system came from new files, whilefile system growth or loss from modifications remainedrelatively constant. We believe the cause of thisdisparity is the different user populations andapplications on the two systems. While the overall filesystem growth is the same in both cases, the cause isdifferent. The information in Figures 5 and 6 is of directinterest to system administrators for whom the sourceof file system growth is a constant question.5.5 Percentage of Files Used Daily
Both Figure 5 and Figure 6 require a break in thegraph’s y-axis to allow detail in the graph’s lowersection. This is because the proportion of bytes used
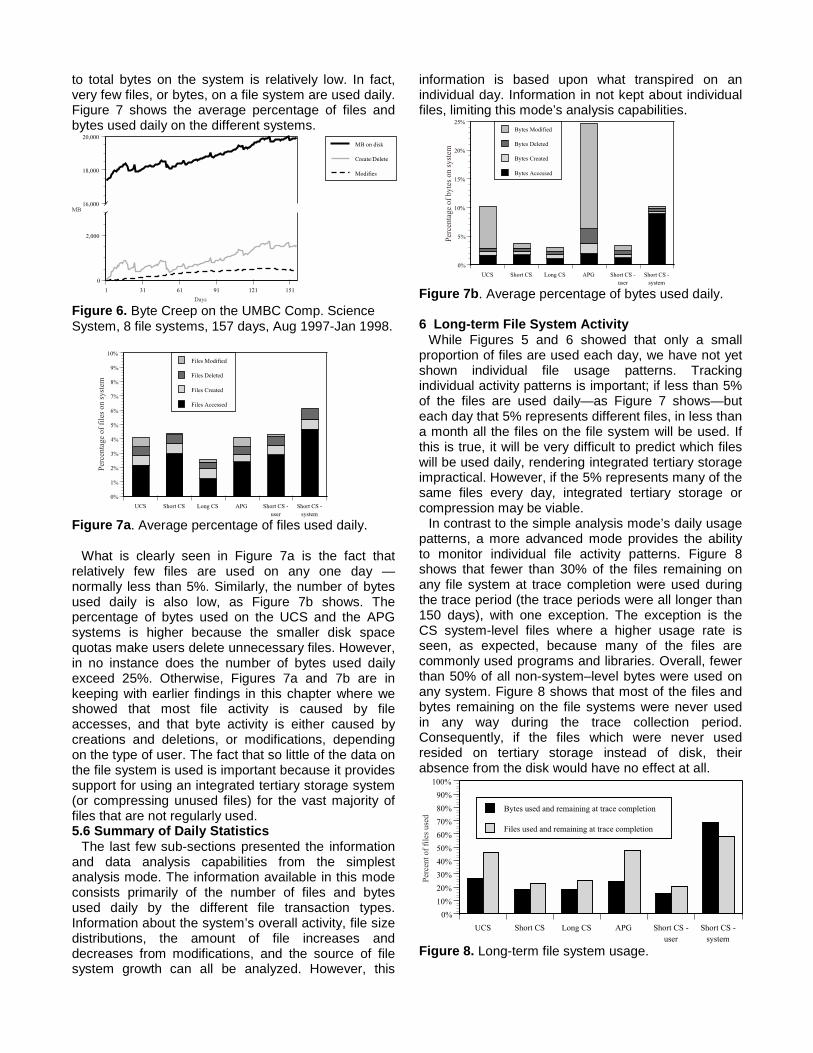
to total bytes on the system is relatively low. In fact,very few files, or bytes, on a file system are used daily.Figure 7 shows the average percentage of files andbytes used daily on the different systems.
Figure 6. Byte Creep on the UMBC Comp. ScienceSystem, 8 file systems, 157 days, Aug 1997-Jan 1998.
Figure 7a. Average percentage of files used daily.
What is clearly seen in Figure 7a is the fact thatrelatively few files are used on any one day —normally less than 5%. Similarly, the number of bytesused daily is also low, as Figure 7b shows. Thepercentage of bytes used on the UCS and the APGsystems is higher because the smaller disk spacequotas make users delete unnecessary files. However,in no instance does the number of bytes used dailyexceed 25%. Otherwise, Figures 7a and 7b are inkeeping with earlier findings in this chapter where weshowed that most file activity is caused by fileaccesses, and that byte activity is either caused bycreations and deletions, or modifications, dependingon the type of user. The fact that so little of the data onthe file system is used is important because it providessupport for using an integrated tertiary storage system(or compressing unused files) for the vast majority offiles that are not regularly used.5.6 Summary of Daily Statistics
The last few sub-sections presented the informationand data analysis capabilities from the simplestanalysis mode. The information available in this modeconsists primarily of the number of files and bytesused daily by the different file transaction types.Information about the system’s overall activity, file sizedistributions, the amount of file increases anddecreases from modifications, and the source of filesystem growth can all be analyzed. However, this
information is based upon what transpired on anindividual day. Information in not kept about individualfiles, limiting this mode’s analysis capabilities.
Figure 7b. Average percentage of bytes used daily.
6 Long-term File System ActivityWhile Figures 5 and 6 showed that only a small
proportion of files are used each day, we have not yetshown individual file usage patterns. Trackingindividual activity patterns is important; if less than 5%of the files are used daily—as Figure 7 shows—buteach day that 5% represents different files, in less thana month all the files on the file system will be used. Ifthis is true, it will be very difficult to predict which fileswill be used daily, rendering integrated tertiary storageimpractical. However, if the 5% represents many of thesame files every day, integrated tertiary storage orcompression may be viable.
In contrast to the simple analysis mode’s daily usagepatterns, a more advanced mode provides the abilityto monitor individual file activity patterns. Figure 8shows that fewer than 30% of the files remaining onany file system at trace completion were used duringthe trace period (the trace periods were all longer than150 days), with one exception. The exception is theCS system-level files where a higher usage rate isseen, as expected, because many of the files arecommonly used programs and libraries. Overall, fewerthan 50% of all non-system–level bytes were used onany system. Figure 8 shows that most of the files andbytes remaining on the file systems were never usedin any way during the trace collection period.Consequently, if the files which were never usedresided on tertiary storage instead of disk, theirabsence from the disk would have no effect at all.
Figure 8. Long-term file system usage.
One of the file system activity traits which can beinferred from Figure 8, particularly when compared toFigure 5 and Figure 6, is that some files are usedregularly. If this was not the case, and all files on thefile systems were used intermittently, the daily usagepercentages could be the same, but the end-of-tracepercentages would probably be higher. However, thisis not what happens, as we will show in the next threesub-sections.6.1 Long-term Repeated Usage
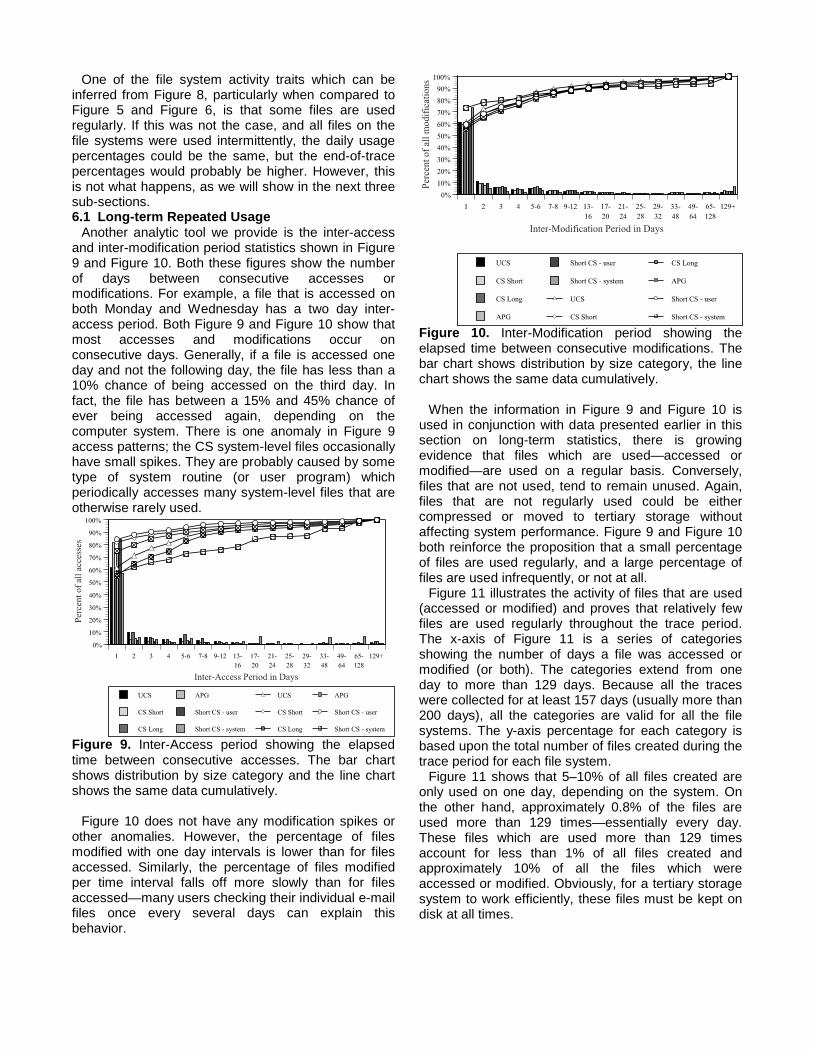
Another analytic tool we provide is the inter-accessand inter-modification period statistics shown in Figure9 and Figure 10. Both these figures show the numberof days between consecutive accesses ormodifications. For example, a file that is accessed onboth Monday and Wednesday has a two day inter-access period. Both Figure 9 and Figure 10 show thatmost accesses and modifications occur onconsecutive days. Generally, if a file is accessed oneday and not the following day, the file has less than a10% chance of being accessed on the third day. Infact, the file has between a 15% and 45% chance ofever being accessed again, depending on thecomputer system. There is one anomaly in Figure 9access patterns; the CS system-level files occasionallyhave small spikes. They are probably caused by sometype of system routine (or user program) whichperiodically accesses many system-level files that areotherwise rarely used.
Figure 9. Inter-Access period showing the elapsedtime between consecutive accesses. The bar chartshows distribution by size category and the line chartshows the same data cumulatively.
Figure 10 does not have any modification spikes orother anomalies. However, the percentage of filesmodified with one day intervals is lower than for filesaccessed. Similarly, the percentage of files modifiedper time interval falls off more slowly than for filesaccessed—many users checking their individual e-mailfiles once every several days can explain thisbehavior.
Figure 10. Inter-Modification period showing theelapsed time between consecutive modifications. Thebar chart shows distribution by size category, the linechart shows the same data cumulatively.
When the information in Figure 9 and Figure 10 isused in conjunction with data presented earlier in thissection on long-term statistics, there is growingevidence that files which are used—accessed ormodified—are used on a regular basis. Conversely,files that are not used, tend to remain unused. Again,files that are not regularly used could be eithercompressed or moved to tertiary storage withoutaffecting system performance. Figure 9 and Figure 10both reinforce the proposition that a small percentageof files are used regularly, and a large percentage offiles are used infrequently, or not at all.
Figure 11 illustrates the activity of files that are used(accessed or modified) and proves that relatively fewfiles are used regularly throughout the trace period.The x-axis of Figure 11 is a series of categoriesshowing the number of days a file was accessed ormodified (or both). The categories extend from oneday to more than 129 days. Because all the traceswere collected for at least 157 days (usually more than200 days), all the categories are valid for all the filesystems. The y-axis percentage for each category isbased upon the total number of files created during thetrace period for each file system.
Figure 11 shows that 5–10% of all files created areonly used on one day, depending on the system. Onthe other hand, approximately 0.8% of the files areused more than 129 times—essentially every day.These files which are used more than 129 timesaccount for less than 1% of all files created andapproximately 10% of all the files which wereaccessed or modified. Obviously, for a tertiary storagesystem to work efficiently, these files must be kept ondisk at all times.

Figure 11. Number of days a specific file was eitheraccessed or modified after it was created. Shown as apercentage of all files created during the trace period,logarithmic scale.
6.2 Reference LocalityThe fact that a very small number of files are used
nearly every day increases the likelihood that mostfiles which are used exhibit reference locality. Localityof reference is a term normally used with RAM andcache memories. When data is moved into the cachememory, it is very likely to be used again. Indeed, thisproperty is what makes cache memory systemsworthwhile. Caching stratagems try to ensure that dataneeded in the immediate future is kept in the cache.Because the file system can be viewed as a super-setof the RAM and cache data, it is possible that the fileson secondary storage also have the locality ofreference property. In fact, this is true, as Figure 12shows. One of the statistics the software collects is thenumber of files accessed and modified during the lastX of Y days. The data shown is from the 7 day interval.The y-axis in Figure 12 is based on the averagenumber of all files that were accessed or modified dailyper system. For example, on an average day, 36,994files were accessed daily on the UCS system.Likewise, an average of 2,380 files were used everyday in the last seven days. Thus, an average of 6.48%of the files accessed had been accessed daily for thelast week.
Figure 12. Average percent of files used in exactly lastX of 7 days. Shown as a percentage of the averagenumber of daily accesses and modifications.
This data allows us to verify the presence ofreference locality for file accesses and filemodifications. One note of interest about Figure 12 isthe fact that on every system more files are used everyday of the week than for any other single sub-period.
The only anomaly found in Figure 12 is the high levelof activity for the long UMBC Computer Sciencetraces. This is explained by the fact that the faculty3file system in the long CS traces became full andinactive during the trace collection period, and twoothers (faculty and grad2) became less active as thetrace period progressed. For example, the faculty3 filesystem averaged less than 220 file transactions perday, compared to 3,311 transactions per day on themost active file system from the same traces. As aresult, the combined activity level for these traces waslower than any other trace (see Figure 7 and Figure11). However, while these three file systems were lessactive than other file systems, the files which wereactive on these three tended to be more active than onother file systems. This is because some users wererunning out of disk space and had to keep unused filesat a minimum. The result is seen in Figure 12.Regardless, the overall activity level for the longComputer Science traces as a percentage of totalfiles—Figure 12 is a percentage of total accesses andmodifications—is relatively low, as shown in Figure 7and Figure 11.6.3 File Lifetimes
One reference locality characteristic that cache datahas is that the cache data is eventually replaced. Inthe case of file systems, this translates to the fileseither lapsing out of use or being deleted. Figure 8shows that most of the files on a file system are neverused. By comparing Figure 8 with Figure 7, it can beinferred that the number of files on the system whichwere used at least once increases over time. (In fact,the simulator shows this directly, but this graph is notshown for brevity.) The proposition that most files tendto lapse out of use can be supported by the facts thatmost files were not used during the trace periods, andthat most files which were used tended to only be useda few times.
In keeping with the theory of reference locality, thedeletion rate for used files should initially be fairly low,and increase as the files get older. This slowlyincreasing deletion rate for used files is shown inFigure 13. The deletions are shown as a percentage ofall files deleted with the same lifetime. For example,the UCS system has a value of 11.02% for the two daylifetime. This value is computed by dividing the numberof files which were used and then deleted two daysafter being created (15,373) by the total number offiles deleted two days after being created (139,491).Note: A file that is created one day and deleted beforethe next trace lives ‘zero’ days.
Figure 13 shows that files which are used tend to livelonger in comparison with files which are not used. Forexample, files which are used account for less than

20% of the files deleted in the first week after they arecreated. Thereafter, the percentage of files which wereused and deleted rises. This is true for all systemsexcept the APG system, where the lifetime of usedfiles varies widely. We believe the APG data is a resultof both the user behavior and strict disk quotas.However, even with the APG data, Figure 13 clearlyreinforces the theory of locality of reference byshowing that files which are used are deleted moreslowly than files which are not used. This is particularlytrue on all three university systems where few activefiles are deleted until 20 to 30 days have passed.
Figure 13. Lifetimes of used files as a percentage ofall files deleted with the same lifetime.
To put Figure 13 in perspective and to give thereader a grasp of both the file deletion rate and therelationship between deletions for used versus unusedfiles, we provide Figure 14. This figure shows thecumulative rate of deletions for files that were used(accessed or modified) and the cumulative rate ofdeletions for files that were created and never used.These rates are shown as a percentage of all the filesthat were deleted during the entire trace period. Forexample, approximately 30% of all deletions aredeletions of files that were on the system for only oneday (present at one trace and gone the next). Thefigure also shows that 85% of all deletions are uponfiles that were not used, except for the files on theAPG file system. Similarly, for the first two weeks,unused files at the university are deleted more quicklythan files that are used. At the two week point, unusedfiles are deleted at approximately the same rate asfiles that were used. Interestingly, the deletion rates forthe different file types are virtually identical on all threeuniversity systems.
The APG data is different from the university data.Unused files are deleted more slowly, while the usedfiles are deleted more quickly. The deletion rate on theAPG system increases for both types of file at the twomonth point, possibly from users conducting periodichousecleaning.6.4 Summary of Long-term File System Activity
The data and analysis presented in the precedingthree sub-sections are extremely important forunderstanding file system activity, and to ourknowledge the extensive data collection and analysisis unique. To summarize our findings:
Figure 14. File lifetimes for used and unused files as apercentage of total deletions.
• Files which are used have short inter-accessand inter-modification times;
• An extremely small number of files are usedevery day (normally less than 1% of all files on thefile system);
• Files which are being used exhibit referencelocality, where a file that is used is likely to beused again, and vice versa;
• Files which are not used for a several days areunlikely to be used again; and
• Files which are not used are deleted morequickly than files that have been used.
7. Hierarchical Name Space ActivityIn the preceding two sections we discussed and
analyzed disk activity as seen from the viewpoint ofthe operating system’s numeric index. As pointed outearlier, the disk activity shown by the numeric index isnot necessarily the same activity the user observesusing the hierarchical name space viewpoint. Thissection shows the key file system activity similaritiesand differences observed when data is collected usingthe hierarchical name space viewpoint instead of thenumeric index.
The most important thing to remember whencomparing the file system’s activity using thehierarchical name space (i.e., the hierarchical pathsand file names) with the numeric index is that they aremerely two different views of the same activity. Thetraces collected information regarding the activity ofthe physical files on the file system; any changesmade to the files during the trace period were made onboth the hierarchical name space view and thenumeric index view of the file system. Any differencesbetween these two views can be ascribed to what theview concentrates on: the hierarchical view focuses on

the file’s path and name, while the numeric indexfocuses on the operating system’s underlyingimplementation and numeric index.
7.1 Key Differences Between Hierarchical NameSpace and Numeric Index Activity
The only real difference between the hierarchicalname space view of the file system’s activity and thenumeric index view is in the area of file modificationsand file deletions. The physical file blocks referencedby the i-node’s numeric index are rarely modified,except in the case of e-mail files. In contrast, thehierarchical file names in the hierarchical name spaceare regularly modified. The result is that the number ofdeletions in the hierarchical name space drops offimmensely while the number of modifications aremuch greater.
This relationship is shown in Figure 15. Because thenumber of files in the hierarchical view and thenumeric index view are not the same—a single i-nodecan have multiple file names—Figure 15 is normalized.A value of 1.0 in Figure 15 denotes equivalencebetween the numeric index view and the hierarchicalname space view of the file system’s activity. A valuegreater than 1.0 shows that hierarchical name spaceview had proportionately more transactions than itsnumeric index counterpart. A value less than 1.0shows proportionately less transactions in thehierarchical name space.
Figure 15. Proportion of average transactions,hierarchical name space to numeric index. A value of1.0 denotes equivalence, greater than 1.0 shows moretransactions in the hierarchical name space.
Figure 15 shows that the ratio between numericindex activity and hierarchical name space activityremained relatively constant for file accesses and filecreations. On the other hand, file deletions are almostnon-existent in the hierarchical name space view ofthe file system, in return for a correspondingabundance of modifications. Essentially, manynumeric index deletions become hierarchical namespace modifications. Because the number ofmodifications are greater in the hierarchical namespace view, the distribution of file and bytetransactions is also different from the numeric indexview, as shown in Figure 16. (Figure 16 is the samedata plotted in Figure 7, except Figure 16 uses thehierarchical name space view instead of Figure 7’s
numeric index view.) While these differences aresignificant, they are essentially the only distinctionsbetween the hierarchical name space and the numericindex views of the same file system activity.7.2 Similarities between the Hierarchical NameSpace and the Numeric Index
Every other characteristic of file system activitydiscussed in Section 5 and Section 6 from theviewpoint of the numeric index is almost identical tothe hierarchical name space perspective. Thepercentage of files used daily and during the entiretrace are very close using either scheme. Similarly, thesize distribution of files on the system, the sizedistribution of files modified, and the amount filesincreased or decreased when modified using thenumeric index observations are nearly identical to thecorresponding hierarchical name space observations.
Figure 16a. Average percentage of files used daily.Hierarchical name space view only.
Figure 16b. Average percentage of bytes used daily.Hierarchical name space view only.
The periodic usage and reference locality observedin the numeric index is also present in the hierarchicalname space, although the activity drop-off rate isslightly slower in the hierarchical name space view.
An excellent example of reference locality in thehierarchical name space is provided by the traces fromthe University of California system. These traces onlycollected the names of files (i.e., the hierarchical namespace) which had been modified within the last 24hours. As a result, their usefulness is limited. However,they can show how many files in the hierarchical namespace are modified on consecutive days, as Figure 17does. Obviously, an average of 100% of the files weremodified ‘today,’ shown as Day 0 in the chart.However, only 42% were modified two days in a row.By the time a week has passed, the percentage of files

modified on every one of the previous seven days isless than 20%. The number of files modified onconsecutive days continues to drop, until only 3.8% ofthe files modified daily were modified every day of thelast 30 days.
Reference locality can be assumed to be a generalfile system characteristic because:
• It has been shown to exist on both the numericindex and hierarchical name space views of thetraces from UMBC and APG;
• It has been shown to exist in the University ofCalifornia traces; and
• It has been shown to exist by earlierresearchers (Jensen and Reed [7], Miller [11, 12,13])
Figure 17. Percentage of files from the University ofCalifornia traces, modified for N consecutive days in arow.
8 SummaryThis paper has provided a comprehensive look at
long-term file system activity. This type of data isuseful to both file system designers and systemadministrators because it provides an insight to dailyfile system activity. While this type of analysis hasbeen done before, it has not been done recently. Themost recent research of this detail is Satyanarayanan’swork in 1981 [18]. Clearly, the size and complexity offile systems has changed significantly since 1981, aswell as the types of applications being used, so a morerecent file system survey was needed.
The data provided by the long-term mode is of lessinterest to system administrators, but is very useful tofile system designers and migration algorithmresearchers. For example, the data on deletion ratesand reference locality can be directly applied to filesystem design. A case in point is in deciding when toclean file segments in a Log-structured File System(LFS). Studies of long-term file system activity cansignificantly assist in this area.
To our knowledge, the differences between thehierarchical name space and the numeric index viewsof file system activity have never been studied.Previous researchers (Baker [2], Burns [3], Kumar [8],Miller [11, 12, 13], Mummert [14], Ousterhout [15],Shirriff [19], and Strange [24]) examined file systemactivity at the hierarchical name space level, despitethe fact that many of them also collected the numericindex information. Occasionally, researchers haveused existing data and focused on the physical
components. For example, Gribble, et. al, [5, 6] usedOusterhout’s [15] and Baker’s [2] existing file systemtraces to check for self-similarity in file system activityat the read/write level. Yet, a specific examinationcomparing and contrasting numeric index andhierarchical name space activity has not been donebefore.
We have also presented evidence that showshierarchical name space and numeric index activityare similar in many respects. For example, bothpossess locality of reference, and the same basicactivity patterns. These basic activity patterns include:• Deleting files which are used at a lower rate than
files which are unused;• Periodic file usage; and• A high proportion of ‘used’ files either lapsing into
disuse or being deleted.
While hierarchical name space files share thesecharacteristics with the numeric index view of thesame activity, the hierarchical name space view has amuch lower deletion rate and a higher modificationrate. This has an impact on file migration algorithms.The majority of the numeric index activity is fileaccesses, creations, and deletions. Because a filemigration algorithm has no control over file creationsand file deletions, a file migration algorithm workingwith the numeric indexes has to contend primarily withfile accesses. In contrast, migration algorithms beingused with the hierarchical name space (i.e., thehierarchical file names) must deal with the same fileaccesses and many more file modifications.
Most programs access the underlying file systemthrough the Unix operating system’s hierarchical filename interface. As a result, the hierarchical file systemprovides researchers a better idea of user andprogram activity. However, the numeric index view ofthe file system is better for examining what theoperating system does internally, how it managesphysical devices, and how it stores data.
Modeling with the hierarchical file names is moreintuitive because people usually think of files asnames, not disk blocks and numeric indexes. On theother hand, the operating system manages the filesystem with the numeric indexes found in the i-nodes,and not with the file names.9. Future Research
Using the findings from this research, we have beenable to develop a tertiary storage migration algorithmthat “ages” files when they are not used [4, 22]. Thistechnique works an order of magnitude better than thecurrent “best” algorithm, space-time [20, 21, 24].
Our future research includes: applying this softwareand data collection technique to Windows NT, in orderto provide a comparison between NT file systemactivity and Unix; and developing an automatic systemwith the new technique to either compress unused filesor move these files to integrated tertiary storage.

References[1] Maurice J. Bach, The Design of the Unix
Operating System, Prentice Hall, Englewood Cliffs, NJ1990.
[2] Mary G. Baker, John H. Hartmon, Michael Kupfer,Ken W, Shirriff, and John K. Ousterhout,“Measurement of a Distributed File System,” OperatingSystem Review 25(5), Proceedings of the 13th ACMSymposium on Operating Systems Principles, 1991,pp. 198-212.
[3] Randal C. Burns, Darrell D. E. Long, “EfficientDistributed Backup with Delta Compression,”Proceedings of the Fifth Workshop on I/O in Paralleland Distributed Systems, ACM: San Jose, Nov. 1997,pp. 26-36.
[4] Timothy J. Gibson, Long-term File System Activityand the Efficacy of Automatic File Migration, DoctoralDissertation, University of Maryland, Baltimore County,May 1998.
[5] Steven D. Gribble, Gurmeet Singh Manku, Eric A.Brewer, Timothy J. Gibson and Ethan L. Miller, “Self-Similarity in File-System Traffic,” Proceedings of ACMSIGMETRICS '98, Madison, Wisconsin, June 1998,pp. 141-150.
[6] Steven D. Gribble, Gurmeet Singh Manku, andEric A. Brewer, “Self-similarity in File-systems:Measurements and Applications,” Unpublished Paper,Department of Computer Science, University ofCalifornia, Berkeley, 1996.
[7] David W. Jensen and Daniel A. Reed, “FileArchive Activity in a Supercomputer Environment.”Technical Report UIUCDCS-R-91-1672, Departmentof Computer Science, University of Illinois, Urbana, IL.
[8] Puneet Kumar and M. Satyanarayanan, “Log-based directory resolution in the Coda file system,”Proceedings of the Second International Conferenceon Parallel and Distributed Computing, January 1993,pp. 202–213.
[9] Samuel J. Leffler, et al., The Design andImplementation of the 4.3BSD UNIX OperatingSystem, Addison Wesley, Reading Massachusetts,1990.
[10] John Merrill and Eric Thanhardt, “EarlyExperience with Mass Storage on a UNIX-BasedSupercomputer,” Tenth IEEE Symposium on MassStorage Systems, Monterey, CA 1990, pp. 117-121.
[11] Ethan L. Miller and Randy H. Katz, “An Analysisof File Migration in a UNIX SupercomputingEnvironment,” USENIX Winter 1993 Conference, SanDiego, CA, January 1993, pp. 421-434.
[12] Ethan L. Miller and Randy H. Katz, “Analyzingthe I/O Behavior of Supercomputer Applications,”Eleventh IEEE Symposium on Mass Storage Systems,Monterey, CA 1991, pp. 51-55.
[13] Ethan L. Miller and Randy H. Katz, “Input/OutputBehavior of Supercomputing Applications,”Proceedings of Supercomputing ‘91, Albuquerque,NM, 1991, pp. 567-577.
[14] L. Mummert and M. Satyanarayanan, “Long-term Distributed File Reference Tracing:Implementation and Experience,” Software–Practiceand Experience, Volume 26(6), June 1996,pp. 705-736.
[15] John K. Ousterhout, Herve Da Costa, DavidHarrison, John Kunze, Mike Kupfer, and JamesThompson, “A Trace-Driven Analysis of the UNIX 4.2BSD File System.” Operating System Review 19(5),Proceedings of the 10th ACM Symposium onOperating Systems Principles, 1985, pp. 15-24
[16] R. L. Rivest, “The MD5 Message DigestAlgorithm,” RFC 1320, April 1992.
[17] Mendel Rosenblum and John K. Ousterhout,“The Design and Implementation of a Log-StructuredFile System,” Operating System Review 25(5),Proceedings of the 13th ACM Symposium onOperating Systems Principles, 1991, pp. 1-15.
[18] M. Satyanarayanan, “A Study of File sizes andFunctional Lifetimes,” Proceedings of the 8thSymposium on Operating systems Principles,Association of Computing Machinery, 1981,pp. 96-108.
[19] Ken W. Shirriff and John K. Ousterhout, “ATrace-Driven Analysis of Name and Attribute Cachingin a Distributed System,” USENIX Winter 1992Conference, San Francisco, CA, January 1993, pp.315–332.
[20] Alan Jay Smith, “Analysis of long term filereference patterns for application to file migrationalgorithms.” IEEE Transactions on SoftwareEngineering SE-7(4), 1981, pp. 403-417.
[21] Alan Jay Smith, “Long term file migration:development and evaluation of algorithms.”Communications of the ACM 24(8), 1981, pp. 521-532.
[22] Keith A. Smith and Margo I. Seltzer, “FileSystem Aging—Increasing Relevance of File SystemBenchmarks,” Proceedings of the 1997 SIGMETRICSConference, June 1997, Seattle, WA, pp. 203-213.
[23] Mirjana Spasojevic and M. Satyanarayanan, “AnEmpirical Study of a Wide-Area Distributed FileSystem,” ACM Transactions on Computer Systems14(2), May 1996, pp. 200-222.
[24] Stephen Strange, “Analysis of Long-Term UNIXFile Access Patterns for Application to Automatic FileMigration Strategies,” Technical Report UCB/CSD-92-700, Computer Science Division (EECS), University ofCalifornia, Berkeley, California, 1992.
[25] Trevor Blackwell, Jeffrey Harris, and MargoSeltzer, “Heuristic Cleaning Algorithms in Log-Structured File Systems,” Proceedings of the 1995USENIX Technical Conference, Berkeley, CA, Jan1995, pp. 277–287.