Embed Size (px)
Citation preview
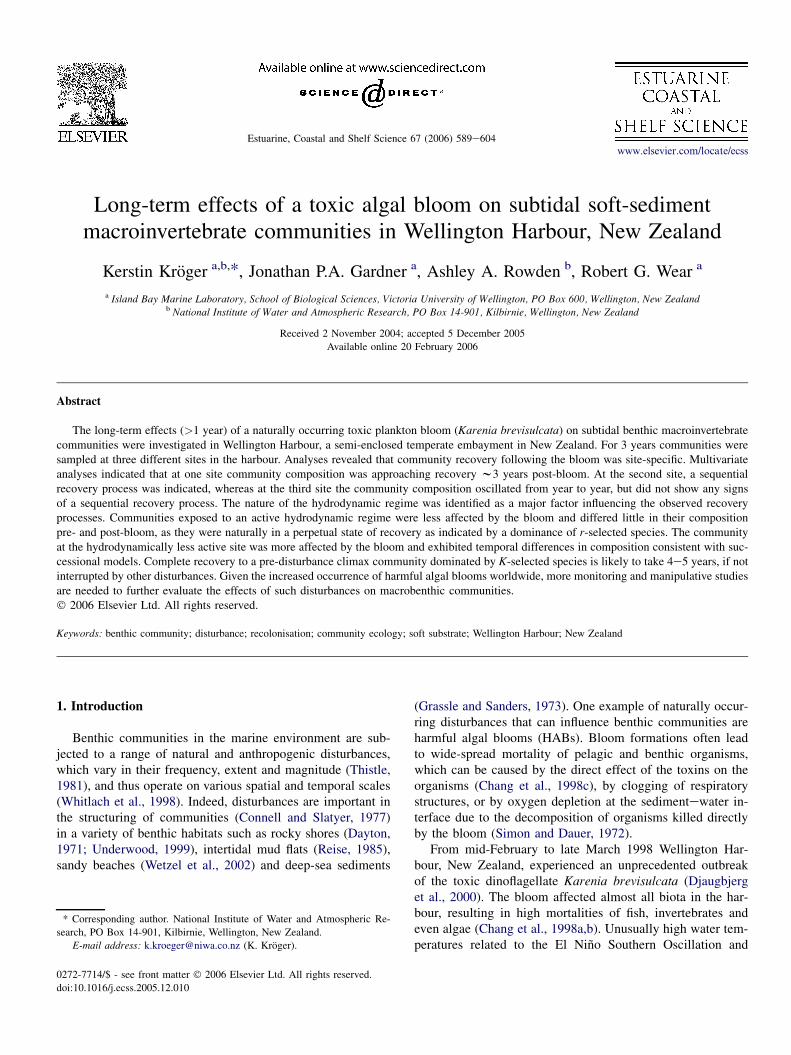
Estuarine, Coastal and Shelf Science 67 (2006) 589e604www.elsevier.com/locate/ecss
Long-term effects of a toxic algal bloom on subtidal soft-sedimentmacroinvertebrate communities in Wellington Harbour, New Zealand
Kerstin Kroger a,b,*, Jonathan P.A. Gardner a, Ashley A. Rowden b, Robert G. Wear a
a Island Bay Marine Laboratory, School of Biological Sciences, Victoria University of Wellington, PO Box 600, Wellington, New Zealandb National Institute of Water and Atmospheric Research, PO Box 14-901, Kilbirnie, Wellington, New Zealand
Received 2 November 2004; accepted 5 December 2005
Available online 20 February 2006
Abstract
The long-term effects (>1 year) of a naturally occurring toxic plankton bloom (Karenia brevisulcata) on subtidal benthic macroinvertebratecommunities were investigated in Wellington Harbour, a semi-enclosed temperate embayment in New Zealand. For 3 years communities weresampled at three different sites in the harbour. Analyses revealed that community recovery following the bloom was site-specific. Multivariateanalyses indicated that at one site community composition was approaching recovery w3 years post-bloom. At the second site, a sequentialrecovery process was indicated, whereas at the third site the community composition oscillated from year to year, but did not show any signsof a sequential recovery process. The nature of the hydrodynamic regime was identified as a major factor influencing the observed recoveryprocesses. Communities exposed to an active hydrodynamic regime were less affected by the bloom and differed little in their compositionpre- and post-bloom, as they were naturally in a perpetual state of recovery as indicated by a dominance of r-selected species. The communityat the hydrodynamically less active site was more affected by the bloom and exhibited temporal differences in composition consistent with suc-cessional models. Complete recovery to a pre-disturbance climax community dominated by K-selected species is likely to take 4e5 years, if notinterrupted by other disturbances. Given the increased occurrence of harmful algal blooms worldwide, more monitoring and manipulative studiesare needed to further evaluate the effects of such disturbances on macrobenthic communities.� 2006 Elsevier Ltd. All rights reserved.
Keywords: benthic community; disturbance; recolonisation; community ecology; soft substrate; Wellington Harbour; New Zealand
1. Introduction
Benthic communities in the marine environment are sub-jected to a range of natural and anthropogenic disturbances,which vary in their frequency, extent and magnitude (Thistle,1981), and thus operate on various spatial and temporal scales(Whitlach et al., 1998). Indeed, disturbances are important inthe structuring of communities (Connell and Slatyer, 1977)in a variety of benthic habitats such as rocky shores (Dayton,1971; Underwood, 1999), intertidal mud flats (Reise, 1985),sandy beaches (Wetzel et al., 2002) and deep-sea sediments
* Corresponding author. National Institute of Water and Atmospheric Re-
search, PO Box 14-901, Kilbirnie, Wellington, New Zealand.
E-mail address: [email protected] (K. Kroger).
0272-7714/$ - see front matter � 2006 Elsevier Ltd. All rights reserved.
doi:10.1016/j.ecss.2005.12.010
(Grassle and Sanders, 1973). One example of naturally occur-ring disturbances that can influence benthic communities areharmful algal blooms (HABs). Bloom formations often leadto wide-spread mortality of pelagic and benthic organisms,which can be caused by the direct effect of the toxins on theorganisms (Chang et al., 1998c), by clogging of respiratorystructures, or by oxygen depletion at the sedimentewater in-terface due to the decomposition of organisms killed directlyby the bloom (Simon and Dauer, 1972).
From mid-February to late March 1998 Wellington Har-bour, New Zealand, experienced an unprecedented outbreakof the toxic dinoflagellate Karenia brevisulcata (Djaugbjerget al., 2000). The bloom affected almost all biota in the har-bour, resulting in high mortalities of fish, invertebrates andeven algae (Chang et al., 1998a,b). Unusually high water tem-peratures related to the El Nino Southern Oscillation and
590 K. Kroger et al. / Estuarine, Coastal and Shelf Science 67 (2006) 589e604
abnormal calm wind patterns that led to the stratification of thewater column were important factors in triggering the bloom(Chang et al., 2001). The immediate impact of the bloom onbenthic macroinvertebrate communities and the first year ofcommunity recovery were investigated by Wear and Gardner(2001) and Gardner and Wear (2006) by comparing their re-sults to unpublished pre-bloom data (Haddon and Wear,1993; Wear and Anderlini, 1995). The authors’ findings indi-cated that the impact of the bloom on the benthic communitieswas spatially variable. Communities of fine sand/silt sedimentsin depositional areas showed higher reductions in mean abun-dance and mean number of species than communities of sandysediments being exposed to relatively high-energy currentregimes.
The Wellington Harbour bloom afforded the unique oppor-tunity to document the long-term effects of a toxic bloom onthe subtidal benthic communities of a large semi-enclosed em-bayment in a temperate region and thus to widen our under-standing of macrobenthic recolonisation and successionprocesses following a large-scale natural disturbance. In thepresent study, the long-term effects of this bloom are ad-dressed. The study was instigated in 1999 at three sites of con-trasting hydrodynamic conditions, following the immediateevaluation of post-bloom effects (Wear and Gardner, 2001;Gardner and Wear, 2006) to test the following hypothesis:macroinvertebrate community composition of a subtidal soft-sediment habitat continues to change >1 year after a toxicalgal bloom, and that such change is site-specific, i.e., sitesvary in their development of community composition depend-ing upon their degree of exposure to different hydrodynamicconditions.
2. Material and methods
2.1. Physical setting, hydrology and sediments
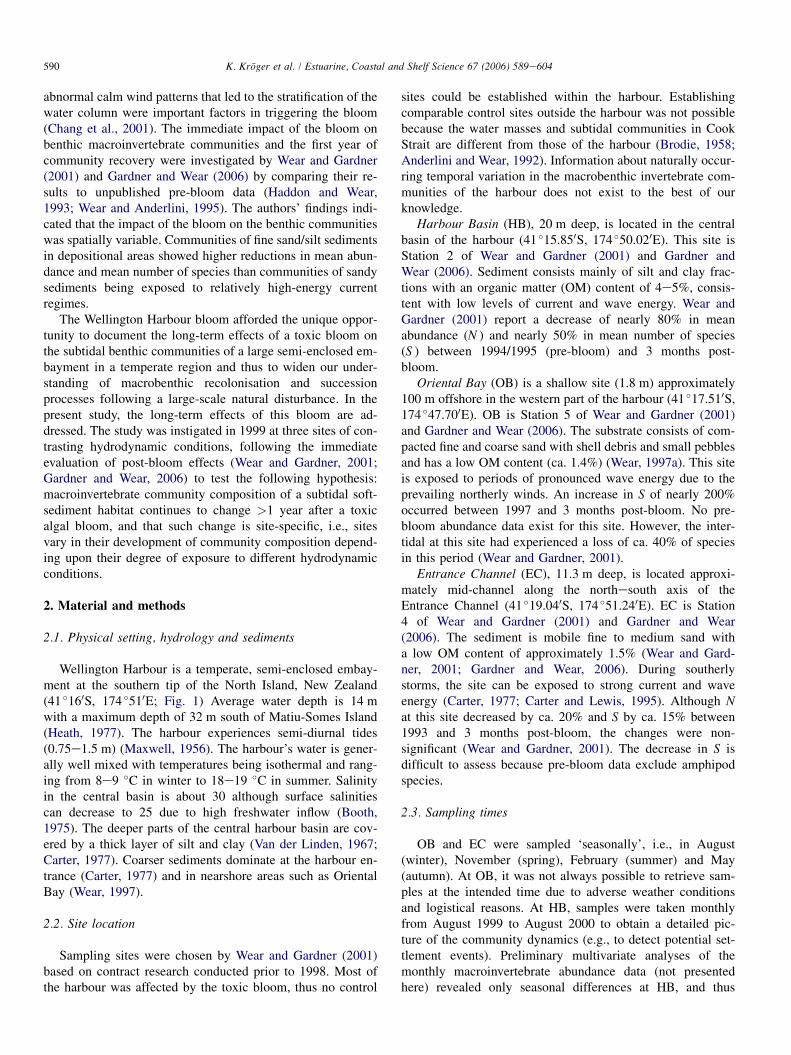
Wellington Harbour is a temperate, semi-enclosed embay-ment at the southern tip of the North Island, New Zealand(41 �160S, 174 �510E; Fig. 1) Average water depth is 14 mwith a maximum depth of 32 m south of Matiu-Somes Island(Heath, 1977). The harbour experiences semi-diurnal tides(0.75e1.5 m) (Maxwell, 1956). The harbour’s water is gener-ally well mixed with temperatures being isothermal and rang-ing from 8e9 �C in winter to 18e19 �C in summer. Salinityin the central basin is about 30 although surface salinitiescan decrease to 25 due to high freshwater inflow (Booth,1975). The deeper parts of the central harbour basin are cov-ered by a thick layer of silt and clay (Van der Linden, 1967;Carter, 1977). Coarser sediments dominate at the harbour en-trance (Carter, 1977) and in nearshore areas such as OrientalBay (Wear, 1997).
2.2. Site location
Sampling sites were chosen by Wear and Gardner (2001)based on contract research conducted prior to 1998. Most ofthe harbour was affected by the toxic bloom, thus no control
sites could be established within the harbour. Establishingcomparable control sites outside the harbour was not possiblebecause the water masses and subtidal communities in CookStrait are different from those of the harbour (Brodie, 1958;Anderlini and Wear, 1992). Information about naturally occur-ring temporal variation in the macrobenthic invertebrate com-munities of the harbour does not exist to the best of ourknowledge.
Harbour Basin (HB), 20 m deep, is located in the centralbasin of the harbour (41 �15.850S, 174 �50.020E). This site isStation 2 of Wear and Gardner (2001) and Gardner andWear (2006). Sediment consists mainly of silt and clay frac-tions with an organic matter (OM) content of 4e5%, consis-tent with low levels of current and wave energy. Wear andGardner (2001) report a decrease of nearly 80% in meanabundance (N ) and nearly 50% in mean number of species(S ) between 1994/1995 (pre-bloom) and 3 months post-bloom.
Oriental Bay (OB) is a shallow site (1.8 m) approximately100 m offshore in the western part of the harbour (41 �17.510S,174 �47.700E). OB is Station 5 of Wear and Gardner (2001)and Gardner and Wear (2006). The substrate consists of com-pacted fine and coarse sand with shell debris and small pebblesand has a low OM content (ca. 1.4%) (Wear, 1997a). This siteis exposed to periods of pronounced wave energy due to theprevailing northerly winds. An increase in S of nearly 200%occurred between 1997 and 3 months post-bloom. No pre-bloom abundance data exist for this site. However, the inter-tidal at this site had experienced a loss of ca. 40% of speciesin this period (Wear and Gardner, 2001).
Entrance Channel (EC), 11.3 m deep, is located approxi-mately mid-channel along the northesouth axis of theEntrance Channel (41 �19.040S, 174 �51.240E). EC is Station4 of Wear and Gardner (2001) and Gardner and Wear(2006). The sediment is mobile fine to medium sand witha low OM content of approximately 1.5% (Wear and Gard-ner, 2001; Gardner and Wear, 2006). During southerlystorms, the site can be exposed to strong current and waveenergy (Carter, 1977; Carter and Lewis, 1995). Although Nat this site decreased by ca. 20% and S by ca. 15% between1993 and 3 months post-bloom, the changes were non-significant (Wear and Gardner, 2001). The decrease in S isdifficult to assess because pre-bloom data exclude amphipodspecies.
2.3. Sampling times
OB and EC were sampled ‘seasonally’, i.e., in August(winter), November (spring), February (summer) and May(autumn). At OB, it was not always possible to retrieve sam-ples at the intended time due to adverse weather conditionsand logistical reasons. At HB, samples were taken monthlyfrom August 1999 to August 2000 to obtain a detailed pic-ture of the community dynamics (e.g., to detect potential set-tlement events). Preliminary multivariate analyses of themonthly macroinvertebrate abundance data (not presentedhere) revealed only seasonal differences at HB, and thus
591K. Kroger et al. / Estuarine, Coastal and Shelf Science 67 (2006) 589e604
NORTH ISLAND
SOUTH ISLAND
WellingtonHarbour
15 m
10 m
20 m
10 m
20 m
10 m
5 m
5 m
EC
OB
174°48'0"E
174°48'0"E
174°50'0"E
174°50'0"E
174°52'0"E
174°52'0"E
174°54'0"E
174°54'0"E
41°22'0"S
41°20'0"S 41°20'0"S
41°18'0"S 41°18'0"S
41°16'0"S 41°16'0"S
41°14'0"S 41°14'0"S
0 1 2 3 4 50.5
Kilometres
Matiu-SomesIsland
Petone
HARBOUR BASIN
Har
bour
Ent
ranc
eC
hann
el
N
HB
Hut
t Riv
er
Fig. 1. Chart of Wellington Harbour with sample sites marked. HB¼Harbour Basin, OB¼Oriental Bay and EC¼ Entrance Channel.
for the period August 2000 to May 2001, it was decided toadopt the ‘seasonal’ sampling regime of the OB and ECsites.
2.4. Sample replication
Best-fit cumulative species curves derived from five repli-cate grab samples taken in September 1999 were used to cal-culate the minimum number of grab samples needed to samplethe macroinvertebrates representatively without under-samplingthe rarer species. The curves indicated that by using fourreplicates the resulting loss of species would be negligiblesince the curve would still be in the upper 10% of the
asymptote. Hence, only four of the five replicate grabs (ran-domly chosen) were used in the present analyses.
2.5. Sampling
Sampling was conducted from the research vessel ‘Rau-kawa Challenger’. Differential GPS was used to relocate sam-pling sites. At HB and EC samples were taken with a van Veengrab (surface area 0.1 m2). For the compacted fine sand at theshallow OB site divers collected sediment from a 0.1 m2 area.Separate sediment sub-samples for OM content and grain sizeanalyses were taken from the surface of the sample (at ca. 6-monthly intervals). Samples for macroinvertebrate analysis
592 K. Kroger et al. / Estuarine, Coastal and Shelf Science 67 (2006) 589e604
were washed through stacked 500 and 1000 mm mesh sievesand individual fractions were kept separate. Material retainedin the sieves was fixed with 5% borax-buffered formalin be-fore washing in freshwater and transferring to 70% ethanolfor storage. At this point Rose Bengal was added.
Specimens were identified to the lowest possible taxonomiclevel. In some instances, identification was based on ‘morpho-species’, i.e., morphologically distinct individuals were treatedas distinct species. A reference collection was established toensure consistency of identification. For difficult taxa, espe-cially polychaetes, expert help was sought. The sampling re-gime in this study did not allow for the quantitativesampling of nematodes and nemerteans and thus these taxawere omitted from analysis.
For organic matter content (%OM) determination, sedimentsamples (n¼ 3) were homogenised (after removing organismsobvious to the naked eye), dried for 3 d at 60 �C and the dryweight determined before and after ashing the samples ina muffle furnace for 24 h at 450 �C (Holmes and McIntyre,1984). For grain size distribution analysis, sediment samples(n¼ 1) were dried at 60 �C for 3 d, weighed and washedthrough a set of stacked Wentworth grade sieves to a lowerlimit of 63 mm. The separate fractions were re-dried for 3 d at60 �C before retaking their weight (Holmes and McIntyre,1984). Mean grain size, sorting coefficient, skewness, kurtosisand granulometry were calculated for each sample using theGrain-Size 1-2 software programme (Barrett and Brooker,1989) using the indices of Folk and Ward (1957).
2.6. Data analyses
Univariate statistical tests were performed using the soft-ware package STATISTICA (version 6.0: Statsoft, Tulsa,Oklahoma, USA), whereas PRIMER (Plymouth Routines inMultivariate Environmental Research, Clarke and Warwick,2001) was used for multivariate analyses. Unless otherwisestated, Clarke and Warwick’s (2001) recommendations for sta-tistical analyses were followed. All analyses were carried outusing data from the combined sieve fractions.
Number of individuals (N ) and number of species (S ) werecalculated for each grab sample. Analysis of Variance(ANOVA) was performed to analyse N and S for differencesover time at each site. Cochran’s test and graphical testswere employed a posteriori to test for homoscedasticity andnormal distribution of the data. Tukey’s HSD post hoc multi-ple range tests were conducted to identify the periods of sig-nificant differences over time when results proved to besignificant ( p< 0.05).
For multivariate analyses of the macroinvertebrate communitystructure data were fourth-root transformed and standardisedfor among-sites analyses only. Non-metric multi-dimensionalscaling (n-MDS) plots were produced to visualise the (dis)-similarity of the community composition among samples.To test the null hypothesis of ‘no difference in the faunalcommunity composition among the three sites’ a one-wayanalysis of similarity, ANOSIM (Clarke and Green, 1988), wasperformed. Two-way crossed ANOSIM analyses (Warwick
et al., 1990) were carried out for each site separately totest the effect of the factors year (year 1¼ 1999, year 2¼2000, year 3¼ 2001) and season (spring¼ SeptembereNovember, summer¼DecembereFebruary, autumn¼MarcheMay, winter¼ JuneeAugust) on the community composition.The two null hypotheses tested were H01: no difference ofcommunity composition among years 1, 2 and 3, allowingfor any difference among seasons, and H02: no differenceof community composition among seasons, allowing forany difference among years. Some pairwise comparisonsfor OB and EC could not be performed because too few sam-ples were available. Similarity percentage analysis, SIMPER(Clarke, 1993; Clarke and Warwick, 2001), was employed tocompute average between-sites dissimilarities, site-specificsimilarities and inter-annual dissimilarities. Species contrib-uting consistently to the average similarity of groups anddissimilarity between groups (typifying and discriminatoryspecies, respectively), as indicated by the ratio of their aver-age individual contribution to the (dis)similarity and the stan-dard deviation of this value, were identified. The Index ofMultivariate Dispersion, IMD (Warwick and Clarke,1993b), was applied as a measure of community stress andthe Index of Multivariate Seriation, IMS (Clarke et al.,1993), as a means to detect responses to such stress. The un-derlying assumption for both indices is that increased vari-ability in the multivariate composition of communities isa sign of perturbation. For spatial differences in variabilitythe relative dispersion was computed for each site. TheIMD was determined by site-specific pairwise inter-yearcomparisons of the relative dispersions in order to investigatewhether the extent of annual variability differed since thetoxic bloom had occurred. The IMS (expressed as the Spear-man rank correlation r) was applied as a measure of the ex-tent to which temporal differences in community compositionat the three sites conformed to a linear sequence (H0: no se-riation exists). MDS ordinations were plotted for each siteand the sample points linked in temporal order to help visu-alise the degree of seriation, i.e., the extent of differences incommunity composition between each consecutive samplingdate. In the present study, samples were not taken at equallydistanced points in time and the number of samples per yeardiffered. However, the IMS is not particularly sensitive to theresulting differing variances per year since they influence sig-nificant sequential time drifts (high Spearman rank correla-tion r) only by diluting this effect (Clarke, 2002, pers.comm.).
MDS ordinations of pre- and post-bloom data were em-ployed to assess if the communities had returned to theirpre-bloom community composition. Group-averaged presenceeabsence data aggregated to order level was used to allowfor different mesh sizes used in and for potential inconsis-tencies in species identifications among the different studies(Clarke and Warwick, 2001). Pre-bloom samples were takenfor HB in December 1994eJanuary 1995 (Wear and Ander-lini, 1995), for OB in March and August 1997 (Wear,1997a,b) and for EC in December 1991eFebruary 1992(Haddon and Wear, 1993). Data from May 1998 to March
593K. Kroger et al. / Estuarine, Coastal and Shelf Science 67 (2006) 589e604
1999 were taken from Gardner and Wear (2006) with thepermission of the authors. Only data derived from the1000 mm fraction of samples taken from August 1999 toMay 2001 were used.
3. Results
3.1. Sediment analyses
The sediment at HB consisted mainly of fine to very finesilt (80e90%, grain size 4.9e8.1F), which was very poorlysorted. At OB and EC, the sediment was similar and consistedmainly of fine sand (>90%, grain size 2.1e4.6F), which wasmoderately well to moderately sorted. At HB, %OM wasabout four times higher than at the other two sites and rangedfrom 4.7 to 6.0% (�0.8 and �0.1, respectively). Outlier valuesoccurring in September 1999 (21.8 and 11.9%) were probablycaused by the accidental inclusion of faunal material and thuswere excluded from any further analyses. At OB, %OMranged from 1.2 to 1.6% (�0.1), whilst at EC, %OM rangedfrom 1.2 to 1.7% (�0.1 and �0.3, respectively).
3.2. Biological analyses
A total of 83,800 individuals belonging to 263 putative spe-cies were identified. At HB, 25,108 individuals of 156 putativespecies were identified from 60 samples taken on 15 samplingoccasions. Polychaetes were the most abundant group(59.8%), followed by crustaceans (20.3%) and molluscs(13.4%). The most abundant species were the amphipod Phox-ocephalidae sp. I (13.0%), and the polychaetes Maldane theo-dori (10.5%), ?Aphelochaeta sp. (8.6%) and Terebellides cf.stroemii (6.0%). Fewer samples were taken at OB (24 sampleson six sampling occasions), but they contained the most indi-viduals of the three sites sampled (43,657 individuals) and alsothe highest number of species (165 species). The fauna wasdominated by polychaetes (50.4%). Molluscs formed the sec-ond most abundant group (27.5%) and crustaceans rankedthird (18.3%). Most abundant species were the capitellid Bar-antolla sp. (18.4%), the ostracod Dolasterope quadrata(11.6%), the polychaete Owenia petersenae (10.6%) and thegastropod Anabathron hedleyi (5.7%). At EC, 15,035 individ-uals of 157 species were identified from 32 samples taken oneight sampling occasions. Crustaceans dominated the faunawith 52.3%, followed by polychaetes (30.9%), and molluscs(16.0%). The spionid polychaete Prionospio yuriel was themost abundant species (12.8%), followed by the bivalve Corb-ula zelandica (10.7%), and the amphipods Paraphoxus sp. A(10.4%) and Phoxocephalidae sp. E (7.4%).
3.3. Univariate diversity indices and species analyses
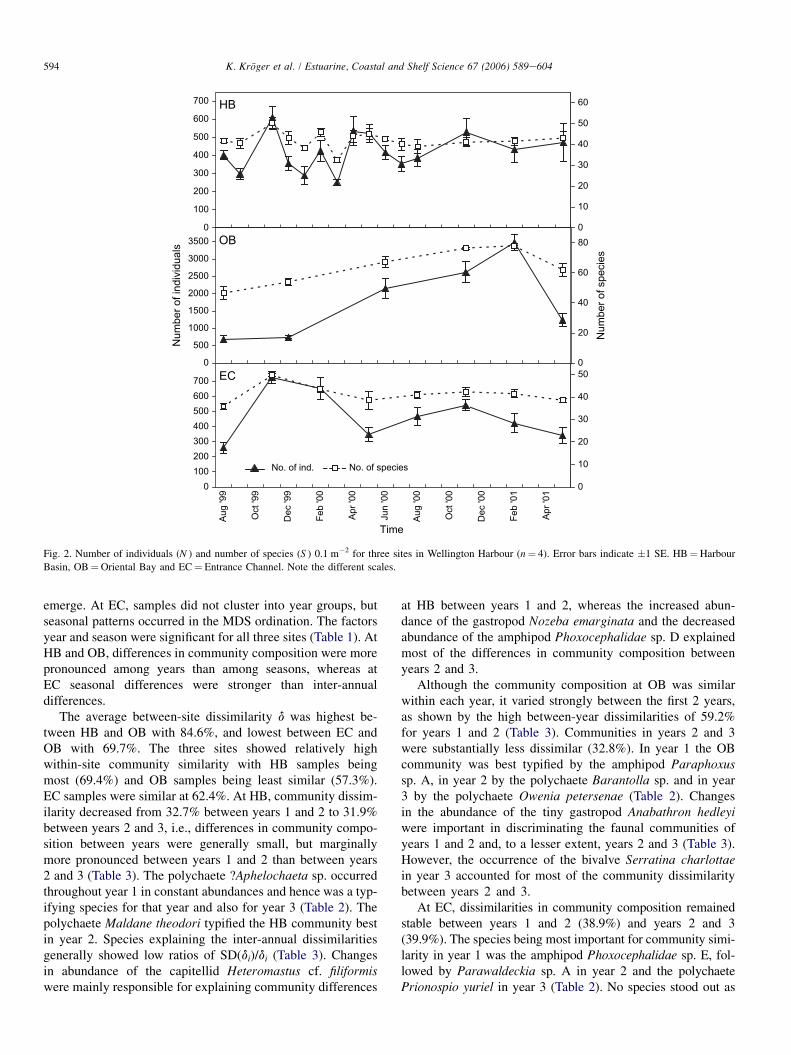
At HB, number of individuals (N ) and number of species(S ) fluctuated strongly from August 1999 until March 2000,but evened out for the remainder of the sampling period atca. 450 ind. 0.1 m�2 in ca. 45 species (Fig. 2). Differencesof N and S with time were significant (ANOVA; N:
F¼ 3.143, MS¼ 41277.7, df¼ 14, p¼ 0.002; S: F¼ 2.709,MS¼ 62.1, df¼ 14, p¼ 0.006). In November 1999, N wassignificantly different from N in September 1999, Januaryand March 2000. In March 2000, S was significantly differentfrom S in November 1999, February and May 2000. At OB, Nand S increased progressively between August 1999 and Feb-ruary 2001 to decrease markedly until May 2001. Differencesin N and S among months proved to be highly significant (N:F¼ 28.334, MS¼ 5003174, df¼ 5, p< 0.001; S: F¼ 16.596,MS¼ 618.44, df¼ 5, p< 0.001). Post hoc comparisonsshowed that every month differed from at least 2 other monthswith respect to N and S. Number of individuals at EC changedmarkedly in the first 6 months of the study but evened out fromAugust 2000. The number of species generally followed thesame pattern. Differences of N and S among months werehighly significant (N: F¼ 9.759, MS¼ 104393, df¼ 7,p< 0.001; S: F¼ 4.608, MS¼ 70.71, df¼ 7, p¼ 0.002).Post hoc comparisons revealed N in November 1999 to be dif-ferent from N in all other months except February and Novem-ber 2000. N in August 1999 differed from N in February andNovember 2000, and N in February 2000 differed also fromN in May 2000 and 2001. S in November 1999 was signifi-cantly different from S in August 1999, August 2000 andMay 2001.
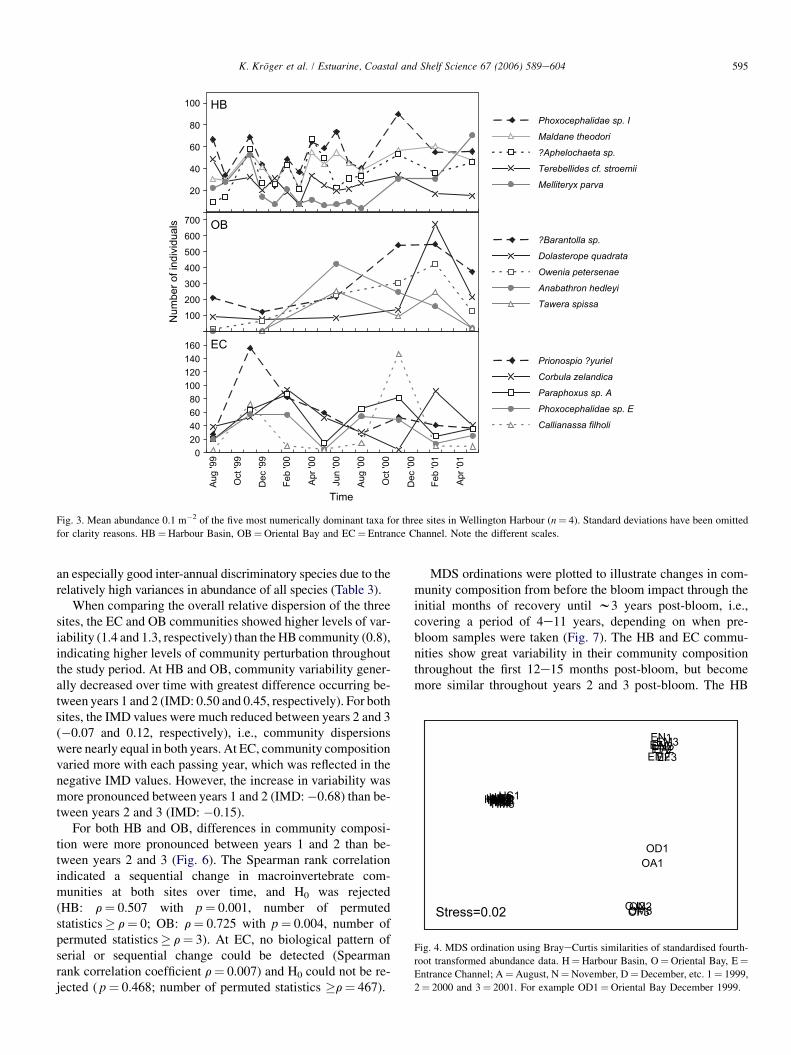
At HB, abundances of the five most numerically dominantspecies seemed to follow seasonal patterns with abundancesrising in spring (November 1999, 2000) and declining after-wards (Fig. 3). At OB, abundances of the five most numeri-cally dominant species were, in general, much higher than atHB and EC. Mean abundances increased until they peakedin February 2001 to decline sharply afterwards except forthe gastropod Anabathron hedleyi. Abundances at EC dis-played seasonal patterns with abundances peaking either inspring or early summer and declining over the winter period.
3.4. Multivariate analyses
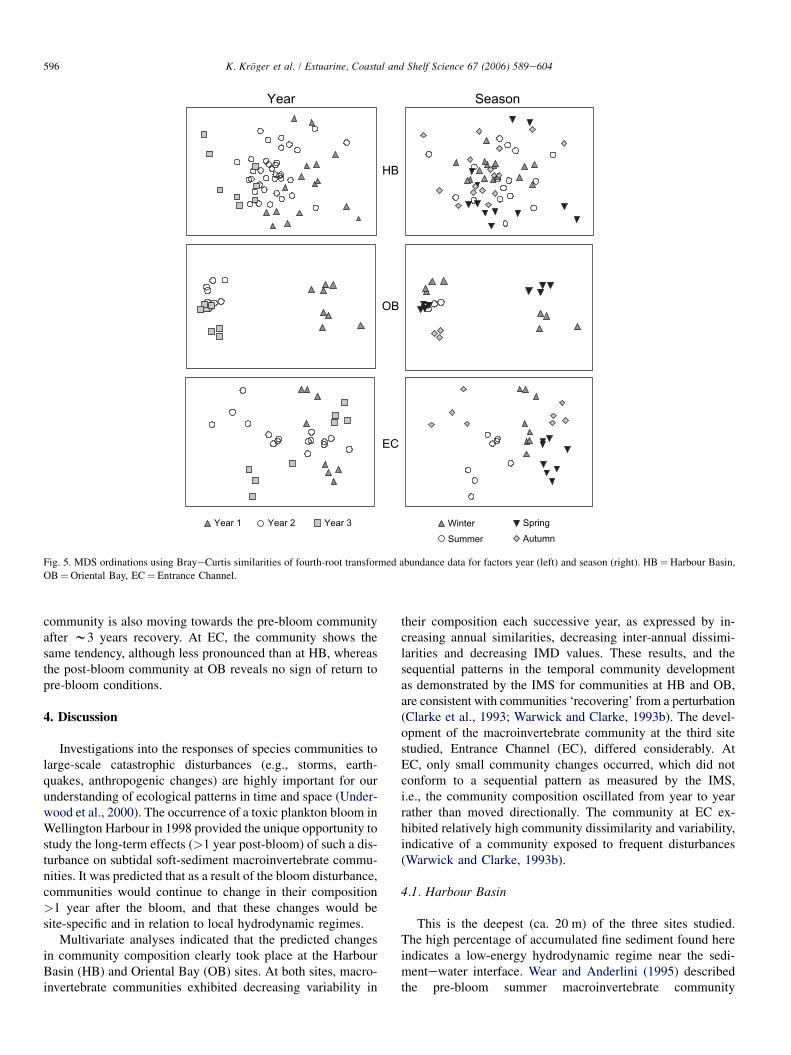
In the MDS ordination (Fig. 4) all three sites were clearlyseparated, with HB and EC samples forming discrete clusters,whereas the OB samples were split into two groups. The siteswere significantly different from each other in their communitycomposition (ANOSIM: global R¼ 0.998 with p¼ 0.001).Pairwise comparisons revealed OB and EC to be more sim-ilar to each other than to HB (HB vs OB and HB vs EC:R¼ 1.0 with p¼ 0.001; OB vs EC: R¼ 0.96 with p¼ 0.001).
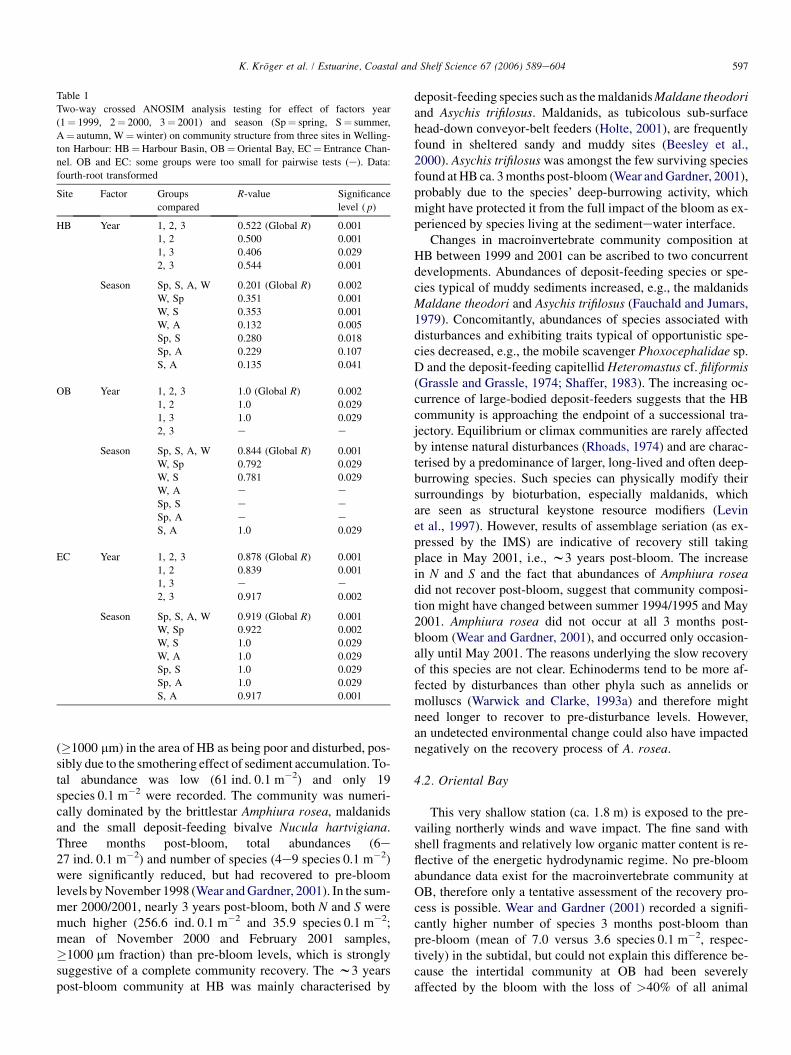
At HB (Fig. 5), samples were relatively evenly spread withno distinct clustering. Some evidence of structuring with re-spect to time is apparent with year 1 samples spread mainlyfrom the right side towards the top middle of the ordination,year 2 samples located from the mid- towards the lower centreand year 3 samples being placed from the middle towards theleft hand side. Seasonal patterns were not obvious. The rela-tively high stress levels of the MDS plots (0.24) indicatedthat the true sample relationships might be poorly represented.At OB, samples of years 2 and 3 clustered closely together.The year 1 samples were set apart with replicate samples ofeach month forming a sub-cluster. Seasonal patterns did not
594 K. Kroger et al. / Estuarine, Coastal and Shelf Science 67 (2006) 589e604
0
100
200
300
400
500
600
700
0
10
20
30
40
50
60
500
1000
1500
2000
2500
3000
3500
0
20
40
60
80
0100200300400500600700
0
10
20
30
40
50
HB
OB
EC
Time
0
Num
ber o
f ind
ivid
uals
Num
ber o
f spe
cies
Aug
'99
Dec
'99
Feb
'00
Apr '
00
Jun
'00
Aug
'00
Oct
'00
Dec
'00
Feb
'01
Apr '
01
Oct
'99
No. of ind. No. of species
Fig. 2. Number of individuals (N ) and number of species (S ) 0.1 m�2 for three sites in Wellington Harbour (n¼ 4). Error bars indicate �1 SE. HB¼Harbour
Basin, OB¼Oriental Bay and EC¼ Entrance Channel. Note the different scales.
emerge. At EC, samples did not cluster into year groups, butseasonal patterns occurred in the MDS ordination. The factorsyear and season were significant for all three sites (Table 1). AtHB and OB, differences in community composition were morepronounced among years than among seasons, whereas atEC seasonal differences were stronger than inter-annualdifferences.
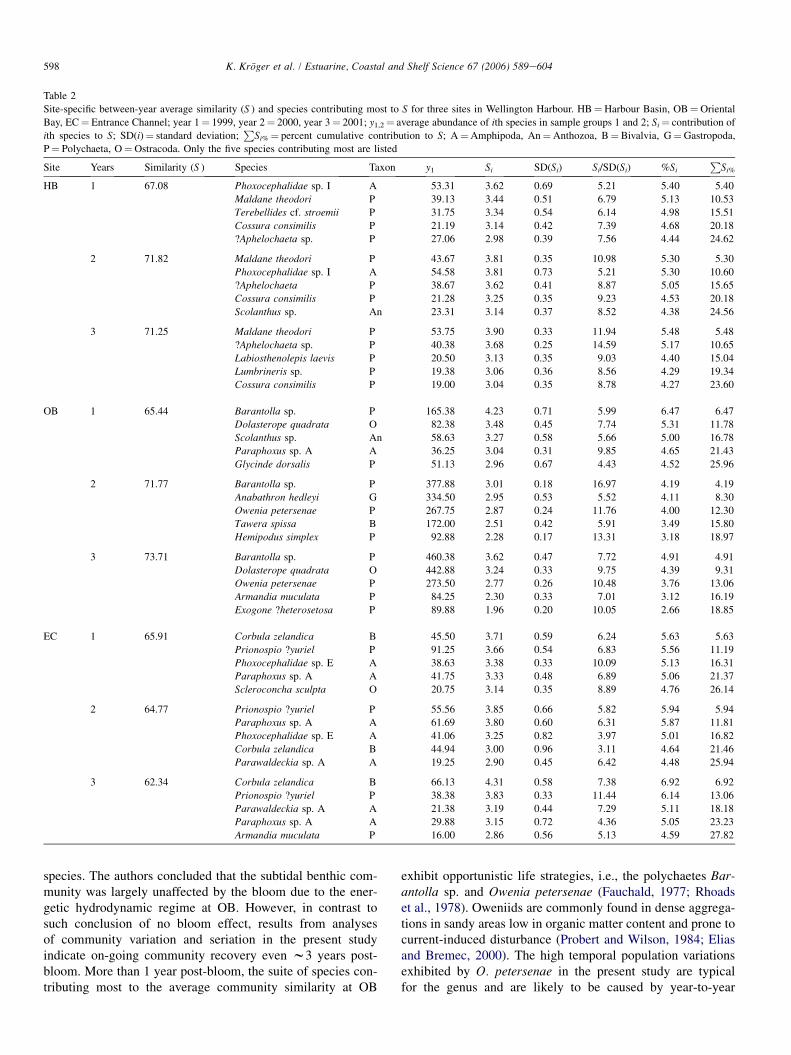
The average between-site dissimilarity d was highest be-tween HB and OB with 84.6%, and lowest between EC andOB with 69.7%. The three sites showed relatively highwithin-site community similarity with HB samples beingmost (69.4%) and OB samples being least similar (57.3%).EC samples were similar at 62.4%. At HB, community dissim-ilarity decreased from 32.7% between years 1 and 2 to 31.9%between years 2 and 3, i.e., differences in community compo-sition between years were generally small, but marginallymore pronounced between years 1 and 2 than between years2 and 3 (Table 3). The polychaete ?Aphelochaeta sp. occurredthroughout year 1 in constant abundances and hence was a typ-ifying species for that year and also for year 3 (Table 2). Thepolychaete Maldane theodori typified the HB community bestin year 2. Species explaining the inter-annual dissimilaritiesgenerally showed low ratios of SD(di)/di (Table 3). Changesin abundance of the capitellid Heteromastus cf. filiformiswere mainly responsible for explaining community differences
at HB between years 1 and 2, whereas the increased abun-dance of the gastropod Nozeba emarginata and the decreasedabundance of the amphipod Phoxocephalidae sp. D explainedmost of the differences in community composition betweenyears 2 and 3.
Although the community composition at OB was similarwithin each year, it varied strongly between the first 2 years,as shown by the high between-year dissimilarities of 59.2%for years 1 and 2 (Table 3). Communities in years 2 and 3were substantially less dissimilar (32.8%). In year 1 the OBcommunity was best typified by the amphipod Paraphoxussp. A, in year 2 by the polychaete Barantolla sp. and in year3 by the polychaete Owenia petersenae (Table 2). Changesin the abundance of the tiny gastropod Anabathron hedleyiwere important in discriminating the faunal communities ofyears 1 and 2 and, to a lesser extent, years 2 and 3 (Table 3).However, the occurrence of the bivalve Serratina charlottaein year 3 accounted for most of the community dissimilaritybetween years 2 and 3.
At EC, dissimilarities in community composition remainedstable between years 1 and 2 (38.9%) and years 2 and 3(39.9%). The species being most important for community simi-larity in year 1 was the amphipod Phoxocephalidae sp. E, fol-lowed by Parawaldeckia sp. A in year 2 and the polychaetePrionospio yuriel in year 3 (Table 2). No species stood out as
595K. Kroger et al. / Estuarine, Coastal and Shelf Science 67 (2006) 589e604
Time
020406080
100120140160
100
200
300
400
500
600
700
EC
20
40
60
80
100
Prionospio ?yuriel
Corbula zelandica
Paraphoxus sp. A
Phoxocephalidae sp. E
Callianassa filholi
?Barantolla sp.
Dolasterope quadrata
Owenia petersenae
Anabathron hedleyi
Tawera spissa
Phoxocephalidae sp. I
Maldane theodori
?Aphelochaeta sp.
Terebellides cf. stroemii
Melliteryx parva
HB
OB
Num
ber
of in
divi
dual
s
Aug
'99
Dec
'99
Feb
'00
Apr
'00
Jun
'00
Aug
'00
Oct
'00
Dec
'00
Feb
'01
Apr
'01
Oct
'99
Fig. 3. Mean abundance 0.1 m�2 of the five most numerically dominant taxa for three sites in Wellington Harbour (n¼ 4). Standard deviations have been omitted
for clarity reasons. HB¼Harbour Basin, OB¼Oriental Bay and EC¼ Entrance Channel. Note the different scales.
an especially good inter-annual discriminatory species due to therelatively high variances in abundance of all species (Table 3).
When comparing the overall relative dispersion of the threesites, the EC and OB communities showed higher levels of var-iability (1.4 and 1.3, respectively) than the HB community (0.8),indicating higher levels of community perturbation throughoutthe study period. At HB and OB, community variability gener-ally decreased over time with greatest difference occurring be-tween years 1 and 2 (IMD: 0.50 and 0.45, respectively). For bothsites, the IMD values were much reduced between years 2 and 3(�0.07 and 0.12, respectively), i.e., community dispersionswere nearly equal in both years. At EC, community compositionvaried more with each passing year, which was reflected in thenegative IMD values. However, the increase in variability wasmore pronounced between years 1 and 2 (IMD:�0.68) than be-tween years 2 and 3 (IMD: �0.15).
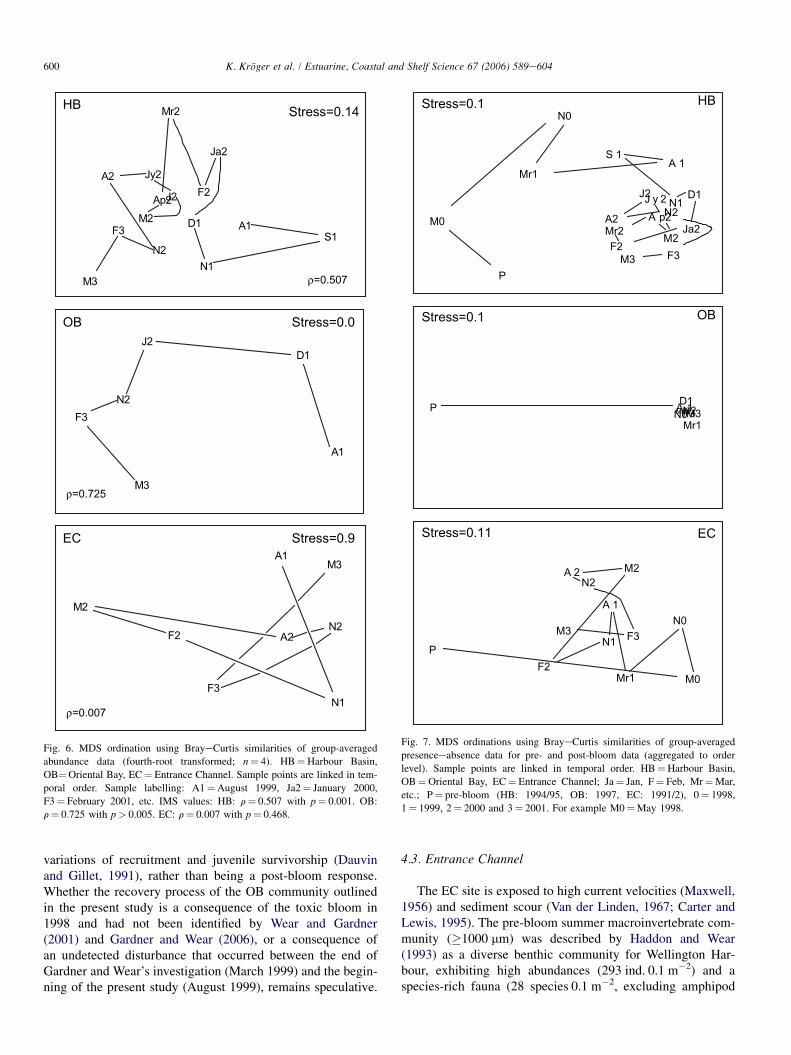
For both HB and OB, differences in community composi-tion were more pronounced between years 1 and 2 than be-tween years 2 and 3 (Fig. 6). The Spearman rank correlationindicated a sequential change in macroinvertebrate com-munities at both sites over time, and H0 was rejected(HB: r¼ 0.507 with p¼ 0.001, number of permutedstatistics� r¼ 0; OB: r¼ 0.725 with p¼ 0.004, number ofpermuted statistics� r¼ 3). At EC, no biological pattern ofserial or sequential change could be detected (Spearmanrank correlation coefficient r¼ 0.007) and H0 could not be re-jected ( p¼ 0.468; number of permuted statistics �r¼ 467).
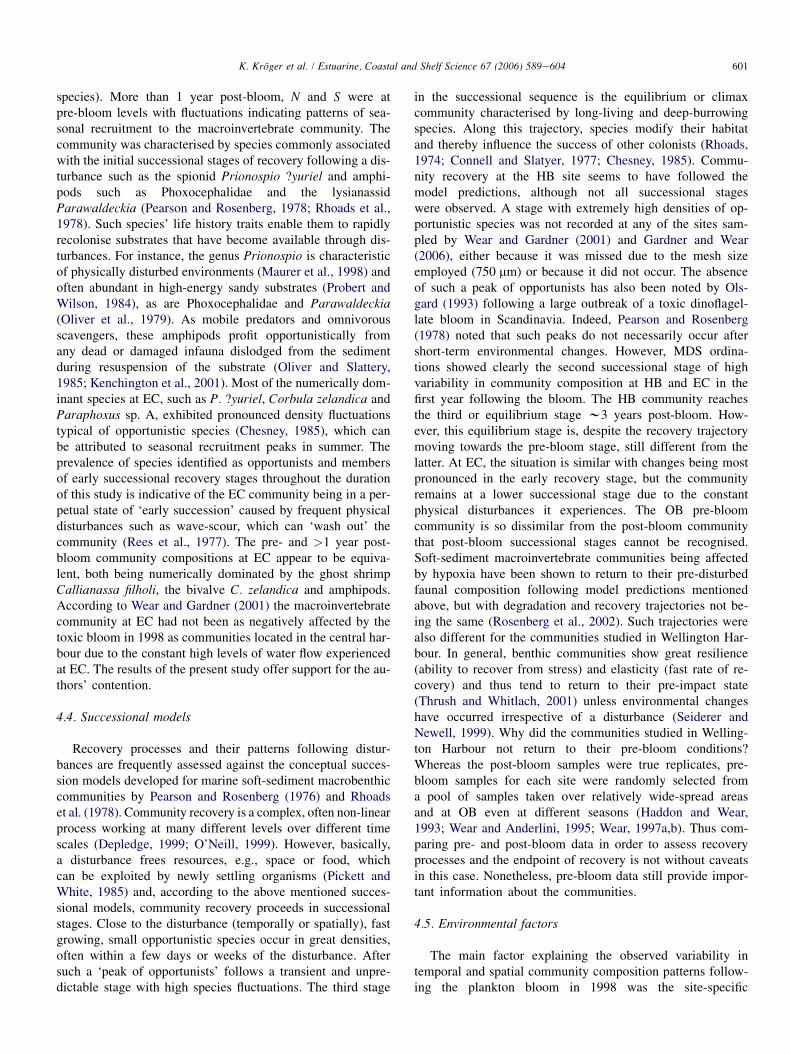
MDS ordinations were plotted to illustrate changes in com-munity composition from before the bloom impact through theinitial months of recovery until w3 years post-bloom, i.e.,covering a period of 4e11 years, depending on when pre-bloom samples were taken (Fig. 7). The HB and EC commu-nities show great variability in their community compositionthroughout the first 12e15 months post-bloom, but becomemore similar throughout years 2 and 3 post-bloom. The HB
HA1HS1HN1HD1HJa2HF2HMr2HAp2HM2HJ2HJy2HA2HN2HF3HM3
OA1OD1
OJ2ON2OF3OM3
EA1EN1EF2EM2EA2EN2EF3EM3
Stress: 0.02
Stress=0.02
Fig. 4. MDS ordination using BrayeCurtis similarities of standardised fourth-
root transformed abundance data. H¼Harbour Basin, O¼Oriental Bay, E¼Entrance Channel; A¼August, N¼November, D¼December, etc. 1¼ 1999,
2¼ 2000 and 3¼ 2001. For example OD1¼Oriental Bay December 1999.
596 K. Kroger et al. / Estuarine, Coastal and Shelf Science 67 (2006) 589e604
HB
OB
EC
Year Season
Spring WinterSummer Autumn
Year 1 Year 2 Year 3
Fig. 5. MDS ordinations using BrayeCurtis similarities of fourth-root transformed abundance data for factors year (left) and season (right). HB¼Harbour Basin,
OB¼Oriental Bay, EC¼ Entrance Channel.
community is also moving towards the pre-bloom communityafter w3 years recovery. At EC, the community shows thesame tendency, although less pronounced than at HB, whereasthe post-bloom community at OB reveals no sign of return topre-bloom conditions.
4. Discussion
Investigations into the responses of species communities tolarge-scale catastrophic disturbances (e.g., storms, earth-quakes, anthropogenic changes) are highly important for ourunderstanding of ecological patterns in time and space (Under-wood et al., 2000). The occurrence of a toxic plankton bloom inWellington Harbour in 1998 provided the unique opportunity tostudy the long-term effects (>1 year post-bloom) of such a dis-turbance on subtidal soft-sediment macroinvertebrate commu-nities. It was predicted that as a result of the bloom disturbance,communities would continue to change in their composition>1 year after the bloom, and that these changes would besite-specific and in relation to local hydrodynamic regimes.
Multivariate analyses indicated that the predicted changesin community composition clearly took place at the HarbourBasin (HB) and Oriental Bay (OB) sites. At both sites, macro-invertebrate communities exhibited decreasing variability in
their composition each successive year, as expressed by in-creasing annual similarities, decreasing inter-annual dissimi-larities and decreasing IMD values. These results, and thesequential patterns in the temporal community developmentas demonstrated by the IMS for communities at HB and OB,are consistent with communities ‘recovering’ from a perturbation(Clarke et al., 1993; Warwick and Clarke, 1993b). The devel-opment of the macroinvertebrate community at the third sitestudied, Entrance Channel (EC), differed considerably. AtEC, only small community changes occurred, which did notconform to a sequential pattern as measured by the IMS,i.e., the community composition oscillated from year to yearrather than moved directionally. The community at EC ex-hibited relatively high community dissimilarity and variability,indicative of a community exposed to frequent disturbances(Warwick and Clarke, 1993b).
4.1. Harbour Basin
This is the deepest (ca. 20 m) of the three sites studied.The high percentage of accumulated fine sediment found hereindicates a low-energy hydrodynamic regime near the sedi-mentewater interface. Wear and Anderlini (1995) describedthe pre-bloom summer macroinvertebrate community
597K. Kroger et al. / Estuarine, Coastal and Shelf Science 67 (2006) 589e604
(�1000 mm) in the area of HB as being poor and disturbed, pos-sibly due to the smothering effect of sediment accumulation. To-tal abundance was low (61 ind. 0.1 m�2) and only 19species 0.1 m�2 were recorded. The community was numeri-cally dominated by the brittlestar Amphiura rosea, maldanidsand the small deposit-feeding bivalve Nucula hartvigiana.Three months post-bloom, total abundances (6e27 ind. 0.1 m�2) and number of species (4e9 species 0.1 m�2)were significantly reduced, but had recovered to pre-bloomlevels by November 1998 (Wear and Gardner, 2001). In the sum-mer 2000/2001, nearly 3 years post-bloom, both N and S weremuch higher (256.6 ind. 0.1 m�2 and 35.9 species 0.1 m�2;mean of November 2000 and February 2001 samples,�1000 mm fraction) than pre-bloom levels, which is stronglysuggestive of a complete community recovery. The w3 yearspost-bloom community at HB was mainly characterised by
Table 1
Two-way crossed ANOSIM analysis testing for effect of factors year
(1¼ 1999, 2¼ 2000, 3¼ 2001) and season (Sp¼ spring, S¼ summer,
A¼ autumn, W¼winter) on community structure from three sites in Welling-
ton Harbour: HB¼Harbour Basin, OB¼Oriental Bay, EC¼ Entrance Chan-
nel. OB and EC: some groups were too small for pairwise tests (e). Data:
fourth-root transformed
Site Factor Groups
compared
R-value Significance
level ( p)
HB Year 1, 2, 3 0.522 (Global R) 0.001
1, 2 0.500 0.001
1, 3 0.406 0.029
2, 3 0.544 0.001
Season Sp, S, A, W 0.201 (Global R) 0.002
W, Sp 0.351 0.001
W, S 0.353 0.001
W, A 0.132 0.005
Sp, S 0.280 0.018
Sp, A 0.229 0.107
S, A 0.135 0.041
OB Year 1, 2, 3 1.0 (Global R) 0.002
1, 2 1.0 0.029
1, 3 1.0 0.029
2, 3 e e
Season Sp, S, A, W 0.844 (Global R) 0.001
W, Sp 0.792 0.029
W, S 0.781 0.029
W, A e e
Sp, S e e
Sp, A e eS, A 1.0 0.029
EC Year 1, 2, 3 0.878 (Global R) 0.001
1, 2 0.839 0.001
1, 3 e e
2, 3 0.917 0.002
Season Sp, S, A, W 0.919 (Global R) 0.001
W, Sp 0.922 0.002
W, S 1.0 0.029
W, A 1.0 0.029
Sp, S 1.0 0.029
Sp, A 1.0 0.029
S, A 0.917 0.001
deposit-feeding species such as the maldanids Maldane theodoriand Asychis trifilosus. Maldanids, as tubicolous sub-surfacehead-down conveyor-belt feeders (Holte, 2001), are frequentlyfound in sheltered sandy and muddy sites (Beesley et al.,2000). Asychis trifilosus was amongst the few surviving speciesfound at HB ca. 3 months post-bloom (Wear and Gardner, 2001),probably due to the species’ deep-burrowing activity, whichmight have protected it from the full impact of the bloom as ex-perienced by species living at the sedimentewater interface.
Changes in macroinvertebrate community composition atHB between 1999 and 2001 can be ascribed to two concurrentdevelopments. Abundances of deposit-feeding species or spe-cies typical of muddy sediments increased, e.g., the maldanidsMaldane theodori and Asychis trifilosus (Fauchald and Jumars,1979). Concomitantly, abundances of species associated withdisturbances and exhibiting traits typical of opportunistic spe-cies decreased, e.g., the mobile scavenger Phoxocephalidae sp.D and the deposit-feeding capitellid Heteromastus cf. filiformis(Grassle and Grassle, 1974; Shaffer, 1983). The increasing oc-currence of large-bodied deposit-feeders suggests that the HBcommunity is approaching the endpoint of a successional tra-jectory. Equilibrium or climax communities are rarely affectedby intense natural disturbances (Rhoads, 1974) and are charac-terised by a predominance of larger, long-lived and often deep-burrowing species. Such species can physically modify theirsurroundings by bioturbation, especially maldanids, whichare seen as structural keystone resource modifiers (Levinet al., 1997). However, results of assemblage seriation (as ex-pressed by the IMS) are indicative of recovery still takingplace in May 2001, i.e., w3 years post-bloom. The increasein N and S and the fact that abundances of Amphiura roseadid not recover post-bloom, suggest that community composi-tion might have changed between summer 1994/1995 and May2001. Amphiura rosea did not occur at all 3 months post-bloom (Wear and Gardner, 2001), and occurred only occasion-ally until May 2001. The reasons underlying the slow recoveryof this species are not clear. Echinoderms tend to be more af-fected by disturbances than other phyla such as annelids ormolluscs (Warwick and Clarke, 1993a) and therefore mightneed longer to recover to pre-disturbance levels. However,an undetected environmental change could also have impactednegatively on the recovery process of A. rosea.
4.2. Oriental Bay
This very shallow station (ca. 1.8 m) is exposed to the pre-vailing northerly winds and wave impact. The fine sand withshell fragments and relatively low organic matter content is re-flective of the energetic hydrodynamic regime. No pre-bloomabundance data exist for the macroinvertebrate community atOB, therefore only a tentative assessment of the recovery pro-cess is possible. Wear and Gardner (2001) recorded a signifi-cantly higher number of species 3 months post-bloom thanpre-bloom (mean of 7.0 versus 3.6 species 0.1 m�2, respec-tively) in the subtidal, but could not explain this difference be-cause the intertidal community at OB had been severelyaffected by the bloom with the loss of >40% of all animal
598 K. Kroger et al. / Estuarine, Coastal and Shelf Science 67 (2006) 589e604
Table 2
Site-specific between-year average similarity (S ) and species contributing most to S for three sites in Wellington Harbour. HB¼Harbour Basin, OB¼Oriental
Bay, EC¼ Entrance Channel; year 1¼ 1999, year 2¼ 2000, year 3¼ 2001; y1,2¼ average abundance of ith species in sample groups 1 and 2; Si¼ contribution of
ith species to S; SD(i)¼ standard deviation;P
Si%¼ percent cumulative contribution to S; A¼Amphipoda, An¼Anthozoa, B¼ Bivalvia, G¼Gastropoda,
P¼ Polychaeta, O¼Ostracoda. Only the five species contributing most are listed
Site Years Similarity (S ) Species Taxon y1 Si SD(Si) Si/SD(Si) %Si
PSi%
HB 1 67.08 Phoxocephalidae sp. I A 53.31 3.62 0.69 5.21 5.40 5.40
Maldane theodori P 39.13 3.44 0.51 6.79 5.13 10.53
Terebellides cf. stroemii P 31.75 3.34 0.54 6.14 4.98 15.51
Cossura consimilis P 21.19 3.14 0.42 7.39 4.68 20.18
?Aphelochaeta sp. P 27.06 2.98 0.39 7.56 4.44 24.62
2 71.82 Maldane theodori P 43.67 3.81 0.35 10.98 5.30 5.30
Phoxocephalidae sp. I A 54.58 3.81 0.73 5.21 5.30 10.60
?Aphelochaeta P 38.67 3.62 0.41 8.87 5.05 15.65
Cossura consimilis P 21.28 3.25 0.35 9.23 4.53 20.18
Scolanthus sp. An 23.31 3.14 0.37 8.52 4.38 24.56
3 71.25 Maldane theodori P 53.75 3.90 0.33 11.94 5.48 5.48
?Aphelochaeta sp. P 40.38 3.68 0.25 14.59 5.17 10.65
Labiosthenolepis laevis P 20.50 3.13 0.35 9.03 4.40 15.04
Lumbrineris sp. P 19.38 3.06 0.36 8.56 4.29 19.34
Cossura consimilis P 19.00 3.04 0.35 8.78 4.27 23.60
OB 1 65.44 Barantolla sp. P 165.38 4.23 0.71 5.99 6.47 6.47
Dolasterope quadrata O 82.38 3.48 0.45 7.74 5.31 11.78
Scolanthus sp. An 58.63 3.27 0.58 5.66 5.00 16.78
Paraphoxus sp. A A 36.25 3.04 0.31 9.85 4.65 21.43
Glycinde dorsalis P 51.13 2.96 0.67 4.43 4.52 25.96
2 71.77 Barantolla sp. P 377.88 3.01 0.18 16.97 4.19 4.19
Anabathron hedleyi G 334.50 2.95 0.53 5.52 4.11 8.30
Owenia petersenae P 267.75 2.87 0.24 11.76 4.00 12.30
Tawera spissa B 172.00 2.51 0.42 5.91 3.49 15.80
Hemipodus simplex P 92.88 2.28 0.17 13.31 3.18 18.97
3 73.71 Barantolla sp. P 460.38 3.62 0.47 7.72 4.91 4.91
Dolasterope quadrata O 442.88 3.24 0.33 9.75 4.39 9.31
Owenia petersenae P 273.50 2.77 0.26 10.48 3.76 13.06
Armandia muculata P 84.25 2.30 0.33 7.01 3.12 16.19
Exogone ?heterosetosa P 89.88 1.96 0.20 10.05 2.66 18.85
EC 1 65.91 Corbula zelandica B 45.50 3.71 0.59 6.24 5.63 5.63
Prionospio ?yuriel P 91.25 3.66 0.54 6.83 5.56 11.19
Phoxocephalidae sp. E A 38.63 3.38 0.33 10.09 5.13 16.31
Paraphoxus sp. A A 41.75 3.33 0.48 6.89 5.06 21.37
Scleroconcha sculpta O 20.75 3.14 0.35 8.89 4.76 26.14
2 64.77 Prionospio ?yuriel P 55.56 3.85 0.66 5.82 5.94 5.94
Paraphoxus sp. A A 61.69 3.80 0.60 6.31 5.87 11.81
Phoxocephalidae sp. E A 41.06 3.25 0.82 3.97 5.01 16.82
Corbula zelandica B 44.94 3.00 0.96 3.11 4.64 21.46
Parawaldeckia sp. A A 19.25 2.90 0.45 6.42 4.48 25.94
3 62.34 Corbula zelandica B 66.13 4.31 0.58 7.38 6.92 6.92
Prionospio ?yuriel P 38.38 3.83 0.33 11.44 6.14 13.06
Parawaldeckia sp. A A 21.38 3.19 0.44 7.29 5.11 18.18
Paraphoxus sp. A A 29.88 3.15 0.72 4.36 5.05 23.23
Armandia muculata P 16.00 2.86 0.56 5.13 4.59 27.82
species. The authors concluded that the subtidal benthic com-munity was largely unaffected by the bloom due to the ener-getic hydrodynamic regime at OB. However, in contrast tosuch conclusion of no bloom effect, results from analysesof community variation and seriation in the present studyindicate on-going community recovery even w3 years post-bloom. More than 1 year post-bloom, the suite of species con-tributing most to the average community similarity at OB
exhibit opportunistic life strategies, i.e., the polychaetes Bar-antolla sp. and Owenia petersenae (Fauchald, 1977; Rhoadset al., 1978). Oweniids are commonly found in dense aggrega-tions in sandy areas low in organic matter content and prone tocurrent-induced disturbance (Probert and Wilson, 1984; Eliasand Bremec, 2000). The high temporal population variationsexhibited by O. petersenae in the present study are typicalfor the genus and are likely to be caused by year-to-year
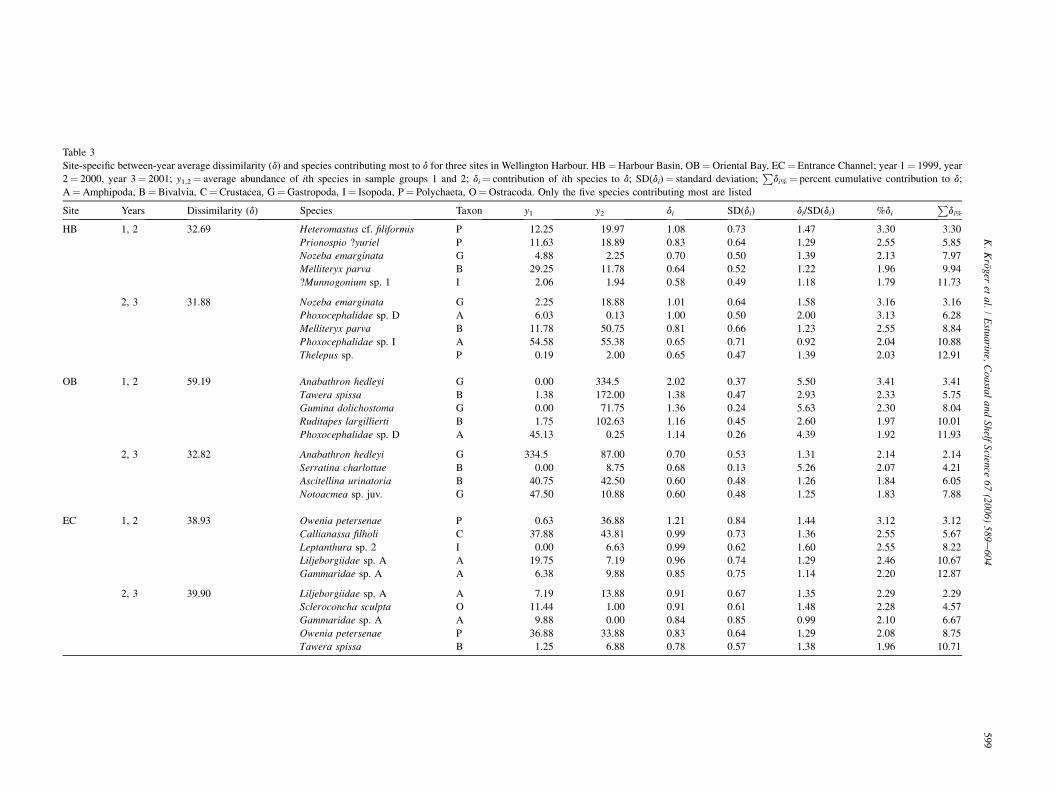
Table
Site-sp riental Bay, EC¼ Entrance Channel; year 1¼ 1999, year
2¼ 20 eviation;P
di%¼ percent cumulative contribution to d;
A¼A re listed
Site SD(di) di/SD(di) %di
Pdi%
HB 0.73 1.47 3.30 3.30
0.64 1.29 2.55 5.85
0.50 1.39 2.13 7.97
0.52 1.22 1.96 9.94
0.49 1.18 1.79 11.73
0.64 1.58 3.16 3.16
0.50 2.00 3.13 6.28
0.66 1.23 2.55 8.84
0.71 0.92 2.04 10.88
0.47 1.39 2.03 12.91
OB 0.37 5.50 3.41 3.41
0.47 2.93 2.33 5.75
0.24 5.63 2.30 8.04
0.45 2.60 1.97 10.01
0.26 4.39 1.92 11.93
0.53 1.31 2.14 2.14
0.13 5.26 2.07 4.21
0.48 1.26 1.84 6.05
0.48 1.25 1.83 7.88
EC 0.84 1.44 3.12 3.12
0.73 1.36 2.55 5.67
0.62 1.60 2.55 8.22
0.74 1.29 2.46 10.67
0.75 1.14 2.20 12.87
0.67 1.35 2.29 2.29
0.61 1.48 2.28 4.57
0.85 0.99 2.10 6.67
0.64 1.29 2.08 8.75
0.57 1.38 1.96 10.71
59
9K
.K
rogeret
al./
Estuarine,
Coastal
andShelf
Science67
(2006)589
e604
3
ecific between-year average dissimilarity (d) and species contributing most to d for three sites in Wellington Harbour. HB¼Harbour Basin, OB¼O
00, year 3¼ 2001; y1,2¼ average abundance of ith species in sample groups 1 and 2; di¼ contribution of ith species to d; SD(di)¼ standard d
mphipoda, B¼Bivalvia, C¼ Crustacea, G¼Gastropoda, I¼ Isopoda, P¼ Polychaeta, O¼Ostracoda. Only the five species contributing most a
Years Dissimilarity (d) Species Taxon y1 y2 di
1, 2 32.69 Heteromastus cf. filiformis P 12.25 19.97 1.08
Prionospio ?yuriel P 11.63 18.89 0.83
Nozeba emarginata G 4.88 2.25 0.70
Melliteryx parva B 29.25 11.78 0.64
?Munnogonium sp. 1 I 2.06 1.94 0.58
2, 3 31.88 Nozeba emarginata G 2.25 18.88 1.01
Phoxocephalidae sp. D A 6.03 0.13 1.00
Melliteryx parva B 11.78 50.75 0.81
Phoxocephalidae sp. I A 54.58 55.38 0.65
Thelepus sp. P 0.19 2.00 0.65
1, 2 59.19 Anabathron hedleyi G 0.00 334.5 2.02
Tawera spissa B 1.38 172.00 1.38
Gumina dolichostoma G 0.00 71.75 1.36
Ruditapes largillierti B 1.75 102.63 1.16
Phoxocephalidae sp. D A 45.13 0.25 1.14
2, 3 32.82 Anabathron hedleyi G 334.5 87.00 0.70
Serratina charlottae B 0.00 8.75 0.68
Ascitellina urinatoria B 40.75 42.50 0.60
Notoacmea sp. juv. G 47.50 10.88 0.60
1, 2 38.93 Owenia petersenae P 0.63 36.88 1.21
Callianassa filholi C 37.88 43.81 0.99
Leptanthura sp. 2 I 0.00 6.63 0.99
Liljeborgiidae sp. A A 19.75 7.19 0.96
Gammaridae sp. A A 6.38 9.88 0.85
2, 3 39.90 Liljeborgiidae sp. A A 7.19 13.88 0.91
Scleroconcha sculpta O 11.44 1.00 0.91
Gammaridae sp. A A 9.88 0.00 0.84
Owenia petersenae P 36.88 33.88 0.83
Tawera spissa B 1.25 6.88 0.78
600 K. Kroger et al. / Estuarine, Coastal and Shelf Science 67 (2006) 589e604
variations of recruitment and juvenile survivorship (Dauvinand Gillet, 1991), rather than being a post-bloom response.Whether the recovery process of the OB community outlinedin the present study is a consequence of the toxic bloom in1998 and had not been identified by Wear and Gardner(2001) and Gardner and Wear (2006), or a consequence ofan undetected disturbance that occurred between the end ofGardner and Wear’s investigation (March 1999) and the begin-ning of the present study (August 1999), remains speculative.
ρ=0.507
ρ=0.725
ρ=0.007
HB
OB
EC Stress=0.9
Stress=0.0
Stress=0.14
A1S1
N1
D1
Ja2
F2
Mr2
Ap2M2
J2
Jy2 A2
N2
F3
M3
A1
D1J2
N2F3
M3
A1
N1
F2
M2
A2N2
F3
M3
Fig. 6. MDS ordination using BrayeCurtis similarities of group-averaged
abundance data (fourth-root transformed; n¼ 4). HB¼Harbour Basin,
OB¼Oriental Bay, EC¼ Entrance Channel. Sample points are linked in tem-
poral order. Sample labelling: A1¼August 1999, Ja2¼ January 2000,
F3¼ February 2001, etc. IMS values: HB: r¼ 0.507 with p¼ 0.001. OB:
r¼ 0.725 with p> 0.005. EC: r¼ 0.007 with p¼ 0.468.
4.3. Entrance Channel
The EC site is exposed to high current velocities (Maxwell,1956) and sediment scour (Van der Linden, 1967; Carter andLewis, 1995). The pre-bloom summer macroinvertebrate com-munity (�1000 mm) was described by Haddon and Wear(1993) as a diverse benthic community for Wellington Har-bour, exhibiting high abundances (293 ind. 0.1 m�2) and aspecies-rich fauna (28 species 0.1 m�2, excluding amphipod
OBStress=0.1
ECStress=0.11
HBStress=0.1
P
M0
N0
Mr1A 1
S 1
N1D1
Ja2F2
Mr2A p2
M2
J2J y 2
A2 N2
F3M3
P M0N0Mr1
A 1D1J2N2F3M3
P
M0
N0
Mr1
A 1
N1
F2
M2A 2N2
F3M3
Fig. 7. MDS ordinations using BrayeCurtis similarities of group-averaged
presenceeabsence data for pre- and post-bloom data (aggregated to order
level). Sample points are linked in temporal order. HB¼Harbour Basin,
OB¼Oriental Bay, EC¼ Entrance Channel; Ja¼ Jan, F¼ Feb, Mr¼Mar,
etc.; P¼ pre-bloom (HB: 1994/95, OB: 1997, EC: 1991/2), 0¼ 1998,
1¼ 1999, 2¼ 2000 and 3¼ 2001. For example M0¼May 1998.
601K. Kroger et al. / Estuarine, Coastal and Shelf Science 67 (2006) 589e604
species). More than 1 year post-bloom, N and S were atpre-bloom levels with fluctuations indicating patterns of sea-sonal recruitment to the macroinvertebrate community. Thecommunity was characterised by species commonly associatedwith the initial successional stages of recovery following a dis-turbance such as the spionid Prionospio ?yuriel and amphi-pods such as Phoxocephalidae and the lysianassidParawaldeckia (Pearson and Rosenberg, 1978; Rhoads et al.,1978). Such species’ life history traits enable them to rapidlyrecolonise substrates that have become available through dis-turbances. For instance, the genus Prionospio is characteristicof physically disturbed environments (Maurer et al., 1998) andoften abundant in high-energy sandy substrates (Probert andWilson, 1984), as are Phoxocephalidae and Parawaldeckia(Oliver et al., 1979). As mobile predators and omnivorousscavengers, these amphipods profit opportunistically fromany dead or damaged infauna dislodged from the sedimentduring resuspension of the substrate (Oliver and Slattery,1985; Kenchington et al., 2001). Most of the numerically dom-inant species at EC, such as P. ?yuriel, Corbula zelandica andParaphoxus sp. A, exhibited pronounced density fluctuationstypical of opportunistic species (Chesney, 1985), which canbe attributed to seasonal recruitment peaks in summer. Theprevalence of species identified as opportunists and membersof early successional recovery stages throughout the durationof this study is indicative of the EC community being in a per-petual state of ‘early succession’ caused by frequent physicaldisturbances such as wave-scour, which can ‘wash out’ thecommunity (Rees et al., 1977). The pre- and >1 year post-bloom community compositions at EC appear to be equiva-lent, both being numerically dominated by the ghost shrimpCallianassa filholi, the bivalve C. zelandica and amphipods.According to Wear and Gardner (2001) the macroinvertebratecommunity at EC had not been as negatively affected by thetoxic bloom in 1998 as communities located in the central har-bour due to the constant high levels of water flow experiencedat EC. The results of the present study offer support for the au-thors’ contention.
4.4. Successional models
Recovery processes and their patterns following distur-bances are frequently assessed against the conceptual succes-sion models developed for marine soft-sediment macrobenthiccommunities by Pearson and Rosenberg (1976) and Rhoadset al. (1978). Community recovery is a complex, often non-linearprocess working at many different levels over different timescales (Depledge, 1999; O’Neill, 1999). However, basically,a disturbance frees resources, e.g., space or food, whichcan be exploited by newly settling organisms (Pickett andWhite, 1985) and, according to the above mentioned succes-sional models, community recovery proceeds in successionalstages. Close to the disturbance (temporally or spatially), fastgrowing, small opportunistic species occur in great densities,often within a few days or weeks of the disturbance. Aftersuch a ‘peak of opportunists’ follows a transient and unpre-dictable stage with high species fluctuations. The third stage
in the successional sequence is the equilibrium or climaxcommunity characterised by long-living and deep-burrowingspecies. Along this trajectory, species modify their habitatand thereby influence the success of other colonists (Rhoads,1974; Connell and Slatyer, 1977; Chesney, 1985). Commu-nity recovery at the HB site seems to have followed themodel predictions, although not all successional stageswere observed. A stage with extremely high densities of op-portunistic species was not recorded at any of the sites sam-pled by Wear and Gardner (2001) and Gardner and Wear(2006), either because it was missed due to the mesh sizeemployed (750 mm) or because it did not occur. The absenceof such a peak of opportunists has also been noted by Ols-gard (1993) following a large outbreak of a toxic dinoflagel-late bloom in Scandinavia. Indeed, Pearson and Rosenberg(1978) noted that such peaks do not necessarily occur aftershort-term environmental changes. However, MDS ordina-tions showed clearly the second successional stage of highvariability in community composition at HB and EC in thefirst year following the bloom. The HB community reachesthe third or equilibrium stage w3 years post-bloom. How-ever, this equilibrium stage is, despite the recovery trajectorymoving towards the pre-bloom stage, still different from thelatter. At EC, the situation is similar with changes being mostpronounced in the early recovery stage, but the communityremains at a lower successional stage due to the constantphysical disturbances it experiences. The OB pre-bloomcommunity is so dissimilar from the post-bloom communitythat post-bloom successional stages cannot be recognised.Soft-sediment macroinvertebrate communities being affectedby hypoxia have been shown to return to their pre-disturbedfaunal composition following model predictions mentionedabove, but with degradation and recovery trajectories not be-ing the same (Rosenberg et al., 2002). Such trajectories werealso different for the communities studied in Wellington Har-bour. In general, benthic communities show great resilience(ability to recover from stress) and elasticity (fast rate of re-covery) and thus tend to return to their pre-impact state(Thrush and Whitlach, 2001) unless environmental changeshave occurred irrespective of a disturbance (Seiderer andNewell, 1999). Why did the communities studied in Welling-ton Harbour not return to their pre-bloom conditions?Whereas the post-bloom samples were true replicates, pre-bloom samples for each site were randomly selected froma pool of samples taken over relatively wide-spread areasand at OB even at different seasons (Haddon and Wear,1993; Wear and Anderlini, 1995; Wear, 1997a,b). Thus com-paring pre- and post-bloom data in order to assess recoveryprocesses and the endpoint of recovery is not without caveatsin this case. Nonetheless, pre-bloom data still provide impor-tant information about the communities.
4.5. Environmental factors
The main factor explaining the observed variability intemporal and spatial community composition patterns follow-ing the plankton bloom in 1998 was the site-specific
602 K. Kroger et al. / Estuarine, Coastal and Shelf Science 67 (2006) 589e604
hydrodynamic regime. This regime influences community re-covery in several ways by determining the physical environ-ment with regard to sediment and food availability, therebyshaping the type of community that is found naturally in anarea, and where the community is located on a reK continuum(Pearson and Rosenberg, 1987). The location on the reK-con-tinuum in response to the particular site-history, e.g., the highfrequency of disturbances experienced at a site (such as OBand particularly EC), is important for the community’s resil-ience to disturbance (Giller and Gee, 1987). Secondly, the hy-drodynamic regime modifies the impact of a disturbance suchas a toxic plankton bloom on benthic communities. Benthiccommunities situated in accumulation areas of fine sediments(such as HB) tend to get more negatively affected by toxicplankton blooms due to a combination of higher quantitiesof sinking toxic material and a high degree of bioturbationat such sites (Olsgard, 1993). In hydrodynamically active areassuch as OB and EC, depositional rates would have been lowerthan at HB. Any accumulation of toxic cells on the sedimentsurface would have in all likelihood been removed quicklydue to higher lateral transport rates. Thirdly, the hydrodynamicregime influences the recovery processes in terms of supply ofcolonists (Thrush and Whitlach, 2001). In the case of a large-scale impact such as the toxic bloom in Wellington Harbour,larvae are the main source of colonisers (Gunther, 1992). Tim-ing of a disturbance is also important for recovery processes intemperate zones with recovery proceeding faster after summerand spring disturbances than after autumn disturbances (Beu-kema et al., 1999; Dittmann et al., 1999). This is due to the in-fluence of some large-scale factors such as cycles inreproduction and mortality and food availability on the avail-ability and survival of recolonisers. Because the water massesand subtidal communities of Cook Straight differ widely fromthose of the harbour (Maxwell, 1956; Booth, 1975), it is likelythat most of the recolonising larvae originated within the har-bour, i.e., were derived from the general pool of survivors ofthe toxic plankton bloom.
4.6. Recovery times
More than 3 years post-bloom, the HB community has re-covered well, although it is not possible to specify when com-plete community recovery, assuming that no other disturbanceresets the recovery process to an earlier successional stage, hasor will be attained. Typical sediment accumulation sites suchas HB might take 4e5 years to recover completely (Gjosæteret al., 2000). At high-energy sites such as EC, and to a lesserextent OB, macroinvertebrate communities might remain ina state of constant recovery due to frequent physical distur-bance. Most intertidal and subtidal communities tend to returnto their pre-impact state within 2e4 years after a HAB (Dauerand Simon, 1976; Southgate et al., 1984; Olsgard, 1993;Gjosæter et al., 2000). Following hypoxia in a Swedish fjord,the communities regained their pre-impact composition within2 years (Rosenberg et al., 2002). Such recovery times comparefavourably with, for instance, recovery times after oil spills(e.g., Elmgren et al., 1983; Jewett et al., 1999) or the
abatement of organic pollution (e.g., Rosenberg, 1976), whichcan take >6 years. Unlike oil spills or waste discharges, HABsdo not leave lasting potentially harmful residuals on the sea-floor, nor do they change the sediment structure as storms(e.g., Rees et al., 1977; Yeo and Risk, 1979) or bottom trawl-ing (e.g., Roberts et al., 2000; Sparks-McConkey and Watling,2001) can do. In their effects on benthic communities, HABsare similar to anoxic events, for which recovery times of oneto several years have been reported dependent on the succes-sional stage of the community prior to oxygen depletion(Diaz and Rosenberg, 1995).
In conclusion, our findings indicate that, although initial re-covery of benthic macroinvertebrate communities strongly im-pacted by a large-scale toxic bloom proceeded rapidly, signs ofcommunity perturbation are still detectable w3 years post-impact. Faced with an increase in HAB occurrences world-wide (Smayda, 1990), there is clearly a call for long-termmonitoring and manipulative studies to further our understand-ing of the effects of severe naturally occurring disturbances onsoft-sediment macroinvertebrate communities.
Acknowledgements
We thank Joanne Long, Robert Williamson and SusannaWood for their help in the field and/or laboratory. Specialthanks go to Geoff Read, Niel Bruce (National Institute ofWater and Atmospheric Research, Wellington), Bruce Mar-shall (Museum of New Zealand Te Papa Tongarewa), StephenEager (Victoria University Wellington) and Lesley Bolton-Ritchie (Environment Canterbury) for their help in speciesidentification. This study is part of K.K.’s PhD thesis andwas supported by a Victoria University of Wellington Post-Graduate Targeted Scholarship.
References
Anderlini, V.C., Wear, R.G., 1992. The effect of sewage and natural seasonal
disturbances on benthic macrofaunal communities in Fitzroy Bay, Welling-
ton, New Zealand. Marine Pollution Bulletin 24 (1), 21e26.
Barrett, P.J., Brooker, M.R., 1989. Grain Size at VUW. School of Earth
Sciences, Victoria University of Wellington, New Zealand.
Beesley, P.L., Ross, G.J.B., Glasby, C.J. (Eds.), 2000. Polychaetes & Allies: The
Southern Synthesis. Fauna of Australia. CSIRO Publishing, Melbourne.
Beukema, J.J., Flach, E.C., Dekker, R., Starink, M., 1999. A long-term study
of the recovery of the macrozoobenthos on large defaunated plots on a tidal
flat in the Wadden Sea. Journal of Sea Research 42, 235e254.
Booth, J.D., 1975. Seasonal and tidal variation in the hydrology of Wellington
Harbour. New Zealand Journal of Marine and Freshwater Research 9 (3),
333e354.
Brodie, J.W., 1958. A note on tidal circulation in Port Nicholson, New Zea-
land. New Zealand Journal of Geology and Geophysics 1, 684e702.
Carter, L., 1977. Sand transport, Wellington Harbour entrance, New Zealand.
New Zealand Journal of Geology and Geophysics 20 (2), 335e351.
Carter, L., Lewis, K., 1995. Variability of the modern sand cover on a tide and
storm driven inner shelf, south Wellington, New Zealand. New Zealand
Journal of Geology and Geophysics 38, 451e470.
Chang, F.H., Chiswell, S.M., Uddstrom, M.D., 2001. Occurrence and distribu-
tion of Karenia brevisulcata (Dinophyceae) during the 1998 summer toxic
outbreaks on the central east coast of New Zealand. Phycologia 40 (3),
215e222.
603K. Kroger et al. / Estuarine, Coastal and Shelf Science 67 (2006) 589e604
Chang, F.H., McKoy, J., Uddstrom, M., 1998a. New Zealand Gymnodinium sp.
linked to fish kills. Harmful Algae News 17, 1e5.
Chang, F.H., McKoy, J., Uddstrom, M., 1998b. The summer 1998 Gymnodi-
nium cf. mikimotoi blooms on the East coast and in Wellington Harbour
of New Zealand. In: MAF Proceedings of the Marine Biotoxin Science
Workshop No. 9. MAF, Wellington, New Zealand.
Chang, F.H., Redfearn, P., Diggles, B., Glasby, C., Allen, S., 1998c. Some
characteristics of Wellington Harbour Gymnodinium toxins: impacts on
marine animals and algae. In: MAF Proceedings of the Marine Biotoxins
Science Workshop. MAF, Wellington, New Zealand.
Chesney, E.J., 1985. Succession in soft-bottom benthic environments: are pio-
neering species really outcompeted? Nineteenth European Marine Biology
Symposium 1984. Cambridge University Press, Plymouth, Devon, UK.
Clarke, K.R., 1993. Non-parametric multivariate analyses of changes in com-
munity structure. Australian Journal of Ecology 18, 117e143.
Clarke, K.R., Green, R.H., 1988. Statistical design and analysis for a ‘biolog-
ical effects’ study. Marine Ecology Progress Series 46, 213e226.
Clarke, K.R., Warwick, R.M., 2001. Change in Marine Communities: An Ap-
proach to Statistical Analysis and Interpretation. Plymouth Marine Laboratory.
Clarke, K.R., Warwick, R.M., Brown, B.E., 1993. An index showing break-
down of seriation, related to disturbance, in a coral-reef assemblage. Ma-
rine Ecology Progress Series 102, 153e160.
Connell, J.H., Slatyer, R.O., 1977. Mechanisms of succession in natural com-
munities and their role in community stability and organization. American
Naturalist 111 (982), 1119e1144.
Dauer, D.M., Simon, J.L., 1976. Repopulation of the polychaete fauna of an
intertidal habitat following natural defaunation: species equilibrium. Oeco-
logia (Berlin) 22, 99e117.
Dauvin, J.-C., Gillet, P., 1991. Spatio-temporal variability in population struc-
ture of Owenia fusiformis Delle Chiaje (Annelida: Polychaeta) from the
Bay of Seine (eastern English Channel). Journal of Experimental Marine
Biology and Ecology 152, 105e122.
Dayton, P.K., 1971. Competition, disturbance, and community organization:
the provision and subsequent utilization of space in a rocky intertidal com-
munity. Ecological Monographs 41, 351e389.
Depledge, M.H., 1999. Recovery of ecosystems and their components follow-
ing exposure to pollution. Journal of Aquatic Ecosystem Stress and Recov-
ery 6, 199e206.
Diaz, R.J., Rosenberg, R., 1995. Marine benthic hypoxia: a review of its eco-
logical effects and the behavioural responses of benthic macrofauna.
Oceanography and Marine Biology: An Annual Review 33, 245e303.
Dittmann, S., Gunther, C.-P., Schleier, U., 1999. Recolonization of tidal flats
after disturbance. In: Dittmann, S. (Ed.), The Wadden Sea Ecosystem Sta-
bility Properties and Mechanisms. Springer-Verlag, Berlin/Heidelberg/
New York, pp. 175e192.
Djaugbjerg, N., Hansen, G., Larsen, J., Moestrup, Ø., 2000. Phylogeny of
some of the major genera of dinoflagellates based on ultrastructure and
partial LSU rDNA sequence data, including the erection of three new gen-
era of unarmoured dinoflagellates. Phycologia 39 (4), 302e317.
Elias, R., Bremec, C.S., 2000. Polychaete assemblages in a southern shallow
shelf area affected by sewage discharge. Bulletin of Marine Science 67
(1), 661e662.
Elmgren, R., Hansson, S., Larsson, U., Sundelin, B., Boehm, P., 1983. The
Tsesis oil spill: acute and long-term impact on the benthos. Marine Biol-
ogy 73 (1), 51e65.
Fauchald, K., 1977. The polychaete worms e definitions and keys to the or-
ders, families and genera. Natural History Museum of Los Angeles County.
Fauchald, K., Jumars, P.A., 1979. The diet of worms: a study of polychaete
feeding guilds. Oceanography and Marine Biology: An Annual Review
17, 193e284.
Folk, R.L., Ward, W.C., 1957. Brazos River bar: a study in the significance of
grain size parameters. Journal of Sedimentary Petrology 27 (1), 3e26.
Gardner, J.P.A., Wear, R.G., 2006. Changes in subtidal macro-invertebrate com-
munity structure in Wellington Harbour (New Zealand) following a large-
scale natural die-off. New Zealand Journal of Marine and Freshwater
Research 40 (1), 29e42.
Giller, P.S., Gee, J.H.R., 1987. The analysis of community organization: the
influence of equilibrium, scale and terminology. In: Gee, J.R.,
Giller, P.S. (Eds.), Organization of Communities Past and Present. Black-
well Scientific Publications, Oxford, pp. 519e542.
Gjosæter, J., Lekve, K., Stenseth, N.C., Leinaas, H.P., Christie, H., Dahl, E.,
Danielssen, D.S., Edvardsen, B., Olsgard, F., Oug, E., Paasche, E., 2000.
A long-term perspective on the Chrysochromulina bloom on the Norwe-
gian Skagerrak coast 1988: a catastrophe or an innocent incident? Marine
Ecology Progress Series 207, 201e218.
Grassle, J.F., Grassle, J.P., 1974. Opportunistic life histories and genetic systems
in marine benthic polychaetes. Journal of Marine Research 32, 253e284.
Grassle, J.F., Sanders, H.L., 1973. Life histories and the role of disturbances.
Deep-Sea Research 20, 643e659.
Gunther, C.P., 1992. Dispersal of intertidal invertebrates: a strategy to react to
disturbances of different scales? Journal of Sea Research 30, 45e56.
Haddon, M., Wear, R.G., 1993. Ecological survey of proposed dredge sites
in Wellington Harbour. VUW Coastal Marine Research Unit Report
No. 22 e Report prepared for Port Wellington Ltd., Wellington, 78 pp.
(unpublished).
Heath, R.A., 1977. Circulation and hydrology of Wellington Harbour. New
Zealand Oceanographic Survey 12, 8.
Holmes, N.A., McIntyre, A.D. (Eds.), 1984. Methods for the Study of Marine
Benthos. Blackwell Scientific Publications, Oxford/London/Edinburgh.
Holte, B., 2001. Possible ecological effects from maldanid (Annelida, Poly-
chaeta) ‘‘superdominance’’ in a small North Norwegian sill system. Ophe-
lia 55 (1), 69e75.
Jewett, S.C., Dean, T.A., Smith, R.O., Blanchard, A., 1999. ‘Exxon Valdez’
oil spill: impacts and recovery in the soft-bottom benthic community in
and adjacent to eelgrass beds. Marine Ecology Progress Series 185,
59e83.
Kenchington, E.L.R., Prena, J., Gilkinson, K.D., Gordon Jr., D.C.,
MacIsaac, K., Bourbonnais, C., Schwinghamer, P.J., Rowell, T.W.,
McKeown, D.L., Vass, W.P., 2001. Effects of experimental otter trawling
on the macrofauna of a sandy bottom ecosystem on the Grand Banks of
Newfoundland. Canadian Journal of Fisheries and Aquatic Sciences 58,
1043e1057.
Levin, L.A., Blair, N., DeMaster, D., Plaia, G., Fornes, W., Martin, C.,
Thomas, C., 1997. Rapid subduction of organic matter by maldanid poly-
chaetes on the North Carolina slope. Journal of Marine Research 55, 595e
611.
Maurer, D., Gerlinger, T., Nguyen, H., 1998. The response of two spionid
polychaetes to natural processes and anthropogenic activities on the San
Pedro Shelf, California. Ophelia 48 (3), 185e206.
Maxwell, B.E., 1956. Hydrobiological observations for Wellington Harbour.
Transactions of the Royal Society of New Zealand 83 (3), 493e503.
Oliver, J.S., Slattery, P.N., 1985. Destruction and opportunity on the sea floor:
effects of gray whale feeding. Ecology 66, 1965e1975.
Oliver, J.S., Slattery, P.N., Hulberg, L.W., Nybakken, J.W., 1979. Relation-
ships between wave disturbance and zonation of benthic invertebrate com-
munities along a subtidal high-energy beach in Monterey Bay, California.
Fishery Bulletin 78 (2), 437e454.
Olsgard, F., 1993. Do toxic algal blooms affect subtidal soft-bottom commu-
nities? Marine Ecology Progress Series 102, 269e286.
O’Neill, R.V., 1999. Recovery in complex ecosystems. Journal of Aquatic
Ecosystem Stress and Recovery 6, 181e187.
Pearson, T.H., Rosenberg, R., 1976. A comparative study of the effects on the
marine environment of wastes from cellulose industries in Scotland and
Sweden. Ambio 5, 77e79.
Pearson, T.H., Rosenberg, R., 1978. Macrobenthic succession in relation to or-
ganic enrichment and pollution of the marine environment. Oceanography
and Marine Biology: An Annual Review 16, 229e311.
Pearson, T.H., Rosenberg, R., 1987. Feast and famine: structuring factors in
marine benthic communities. Organization of Communities Past and Pres-
ent. The 27th Symposium of the British Ecological Society, 1986, Aberyst-
wyth, Dyfed, UK.
Pickett, S.T.A., White, P.A. (Eds.), 1985. The Ecology of Natural Disturbance
and Patch Dynamics. Academic Press, Inc./Harcourt Brace Jovanovich,
Orlando.
Probert, P.K., Wilson, J.B., 1984. Continental shelf benthos off Otago Penin-
sula, New Zealand. Estuarine, Coastal and Shelf Science 19, 373e391.
604 K. Kroger et al. / Estuarine, Coastal and Shelf Science 67 (2006) 589e604
Rees, E.I.S., Nicholaidou, A., Laskaridou, P., 1977. The effects of storms on
the dynamics of shallow water benthic associations. Biology of Benthic
Organisms. Eleventh European Symposium on Marine Biology, Galway,
October 1976, Galway (Eire). Pergamon Press, Oxford.
Reise, K., 1985. Tidal Flat Ecology: An Experimental Approach to Species In-
teractions. Springer-Verlag, Berlin/New York.
Rhoads, D.C., 1974. Organismesediment relations on the muddy sea floor.
Oceanography and Marine Biology: An Annual Review 12, 263e300.
Rhoads, D.C., McCall, P.L., Yingst, J.Y., 1978. Disturbance and production on
the estuarine seafloor. American Scientist 66 (5), 577e586.
Roberts, J., Harvey, S., Lamont, P., Gage, J., Humphery, J., 2000. Seabed photog-
raphy, environmental assessment and evidence for deep-water trawling on the
continental margin west of the Hebrides. Hydrobiologia 441 (1e3), 173e183.
Rosenberg, R., 1976. Benthic faunal dynamics during succession following
pollution abatement in a Swedish estuary. Oikos 27, 414e427.
Rosenberg, R., Agrenius, S., Hellman, B., Nilsson, H.C., Norling, K., 2002.
Recovery of marine benthic habitats and fauna in a Swedish fjord follow-
ing improved oxygen conditions. Marine Ecology Progress Series 234,
43e53.
Seiderer, L.J., Newell, R.C., 1999. Analysis of the relationship between sedi-
ment composition and benthic community structure in coastal deposits:
implications for marine aggregate dredging. ICES Journal of Marine Sci-
ence 56, 757e765.
Shaffer, P.L., 1983. Population ecology of Heteromastus filiformis (Polychaeta:
Capitellidae). Netherlands Journal of Sea Research 17 (1), 106e125.
Simon, J.L., Dauer, D.M., 1972. A quantitative evaluation of red-tide induced mass
mortalities of benthic invertebrates. Environmental Letters 3 (4), 229e234.
Smayda, T.J., 1990. Novel and nuisance phytoplankton blooms in the sea: ev-
idence for a global epidemic. In: Graneli, E., et al. (Eds.), Toxic Marine
Phytoplankton. Elsevier, New York, pp. 29e40.
Southgate, T., Wilson, K., Cross, T.F., Myers, A.A., 1984. Recolonization of
a rocky shore in S.W. Ireland following a toxic bloom of the dinoflagellate
Gyrodinium aureolum. Journal of the Marine Biological Association of the
United Kingdom 64, 485e492.
Sparks-McConkey, P., Watling, L., 2001. Effects on the ecological integrity of
a soft-bottom habitat from a trawling disturbance. Hydrobiologia 1e3, 73e85.
Thistle, D., 1981. Natural physical disturbance and communities of marine soft
bottoms. Marine Ecology Progress Series 6, 223e228.
Thrush, S.F., Whitlach, R.B., 2001. Recovery dynamics in benthic communi-
ties: balancing detail with simplification. In: Reise, K. (Ed.), Ecological
Comparisons of Sedimentary Shores, vol. 151. Springer-Verlag, Berlin/
Heidelberg, pp. 297e316.
Underwood, A.J., 1999. Physical disturbances and their direct effect on an in-
direct effect: responses of an intertidal assemblage to a severe storm. Jour-
nal of Experimental Marine Biology and Ecology 232, 125e140.
Underwood, A.J., Chapman, M.G., Connell, S.D., 2000. Observations in
ecology: you can’t make progress on processes without understanding
the patterns. Journal of Experimental Marine Biology and Ecology 250,
97e115.
Van der Linden, W.J.M., 1967. A textural analysis of Wellington Harbour sed-
iments. New Zealand Journal of Marine and Freshwater Research 1,
26e37.
Warwick, R.M., Clarke, K.R., 1993a. Comparing the severity of disturbance:
a meta-analysis of marine macrobenthic community data. Marine Ecology
Progress Series 92, 221e231.
Warwick, R.M., Clarke, K.R., 1993b. Increased variability as a symptom of
stress in marine communities. Journal of Experimental Marine Biology
and Ecology 172, 215e226.
Warwick, R.M., Clarke, K.R., Gee, J.M., 1990. The effect of disturbance by
soldier crabs, Mictyris platycheles H. Milne Edwards, on meiobenthic com-
munity structure. Journal of Experimental Marine Biology and Ecology
135, 19e33.
Wear, R.G., 1997a. Oriental Bay beach project e marine ecological survey.
Report prepared for Acroyd Walshe Ltd., 22 pp. (unpublished).
Wear, R.B., 1997b. Oriental Bay breakwater construction and beach refurbish-
ment proposal e marine ecological survey. Report prepared for Acroyd
Walshe Ltd., 42 pp. (unpublished).
Wear, R.G., Anderlini, V.C., 1995. Ecological survey of proposed and previous
sediment relocation sites in Wellington Harbour. V.U.W. Coastal Marine
Research Unit Report No. 26 e Report prepared for Port Wellington
Ltd., Wellington, 30 pp. (unpublished).
Wear, R.G., Gardner, J.P.A., 2001. Biological effects of the toxic algal bloom
of February and March 1998 on the benthos of Wellington Harbour, New
Zealand. Marine Ecology Progress Series 218, 63e76.
Wetzel, M.A., Weber, A., Giere, O., 2002. Re-colonization of anoxic/sulfidic
sediments by marine nematodes after experimental removal of macroalgal
cover. Marine Biology 141 (4), 679e689.
Whitlach, R.B., Lohrer, A.M., Thrush, S.F., Pridmore, R.D., Hewitt, J.E.,
Cummings, V.J., Zajac, R.N., 1998. Scale-dependent benthic recoloniza-
tion dynamics: life stage-based dispersal and demographic consequences.
Hydrobiologia 375/376, 217e226.
Yeo, R.K., Risk, M.J., 1979. Intertidal catastrophes: effect of storms and
hurricanes on intertidal benthos of the Minas Basin, Bay of Fundy. Journal
of the Fisheries Research Board of Canada 36 (6), 667e669.