Embed Size (px)
Citation preview
Session 18 PD, Long Term Care: Cost of Care Study
Moderator:
Janet L. Perrie, FSA, MAAA
Presenters: Peggy L. Hauser, FSA, MAAA
Debapriya Mitra
SOA Antitrust Disclaimer SOA Presentation Disclaimer
Cost of Formal Long Term Care StudyPresented by
Peggy Hauser, PricewaterhouseCoopersDebapriya Mitra, Genworth
Moderated byJanet Perrie, PricewaterhouseCoopers
October 24, 2016
Cost of Formal Long Term Care Study
• Background/Objectives• Methodology• Results• Implications/Uses
2
Antitrust
3
Active participation in the Society of Actuaries is an important aspect of membership. However, any Society activity that arguably could be perceived as a restraint of trade exposes the SOA and its members to antitrust risk. Accordingly, meeting participants should refrain from any discussion which may provide the basis for an inference that they agreed to take any action relating to prices, services, production, allocation of markets or any other matter having a market effect. These discussions should be avoided both at official SOA meetings and informal gatherings and activities. In addition, meeting participants should be sensitive to other matters that may raise particular antitrust concern: membership restrictions, codes of ethics or other forms of self-regulation, product standardization or certification. The following are guidelines that should be followed at all SOA meetings, informal gatherings and activities:
• DON’T discuss your own, your firm’s or others’ prices or fees for service, or anything that might affect prices or fees, such as costs, discounts, terms of sale or profit margins.
• DON’T stay at a meeting where any such price talk occurs.
• DON’T make public announcements or statements about your own or your firm’s prices or fees, or those of competitors, at any SOA meeting or activity.
• DON’T talk about what other entities or their members or employees plan to do in particular geographic or product markets or with particular customers.
• DON’T speak or act on behalf of the SOA or any of its committees unless specifically authorized to do so.
• DO alert SOA staff or legal counsel about any concerns regarding proposed statements to be made by the association on behalf of a committee or section.
• DO consult with your own legal counsel or the SOA before raising any matter or making any statement that you think may involve competitively sensitive information.
• DO be alert to improper activities, and don’t participate if you think something is improper.
If you have specific questions, seek guidance from your own legal counsel or from the SOA’s executive director or legal counsel.
Cost of Formal Long Term Care Study
4
Peggy Hauser, FSA, MAAAPricewaterhouseCoopers
5
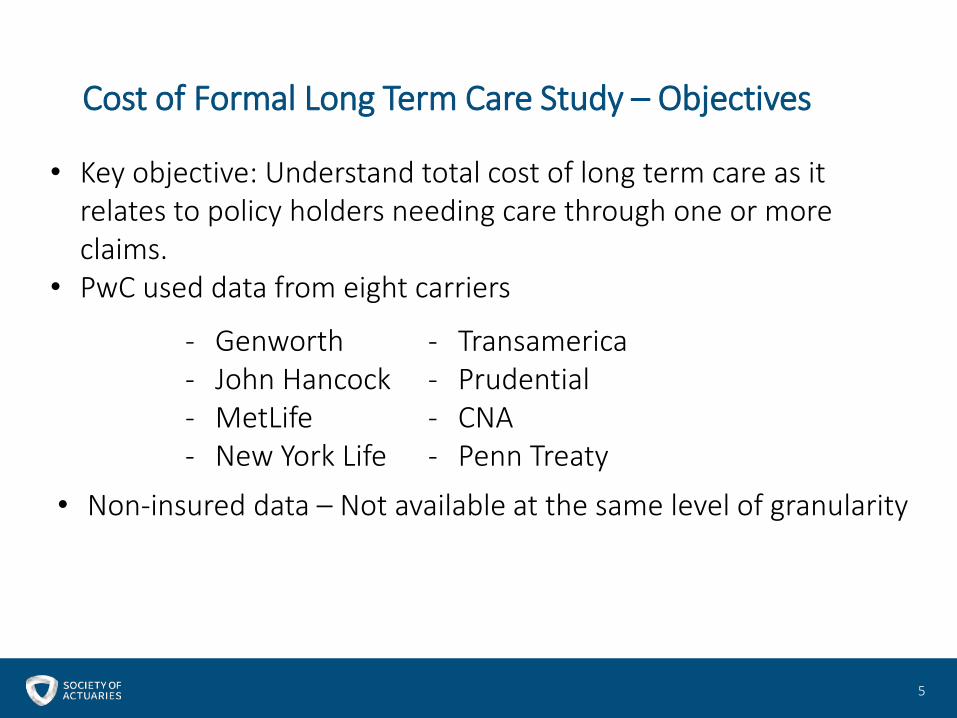
• Key objective: Understand total cost of long term care as it relates to policy holders needing care through one or more claims.
• PwC used data from eight carriers
- Genworth- John Hancock- MetLife- New York Life
- Transamerica- Prudential- CNA- Penn Treaty
• Non-insured data – Not available at the same level of granularity
Cost of Formal Long Term Care Study – Objectives
6
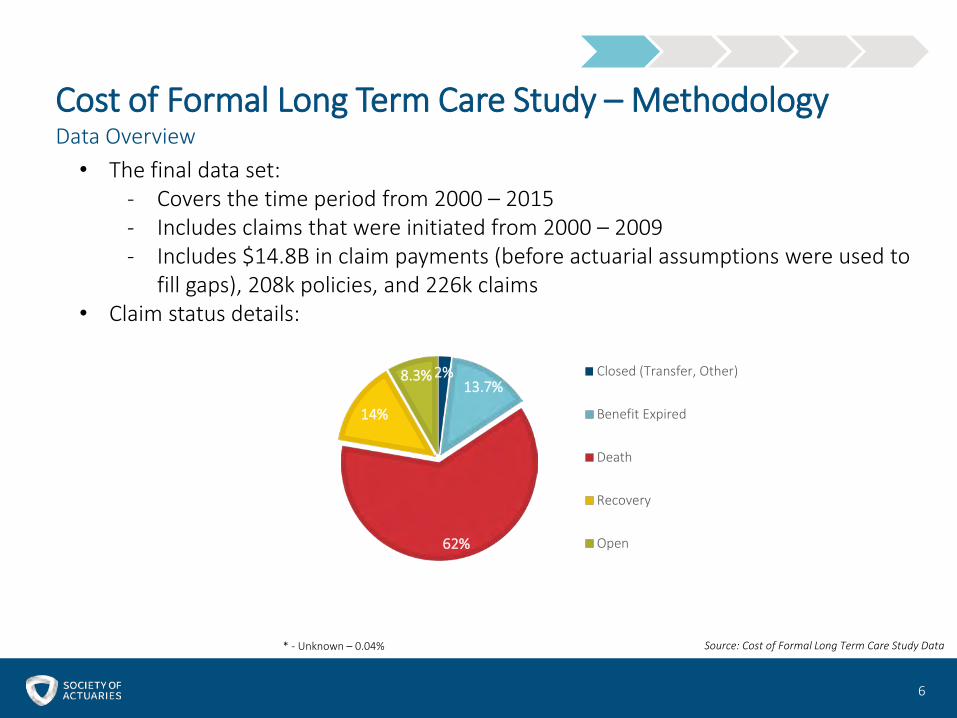
Cost of Formal Long Term Care Study – MethodologyData Overview• The final data set:
- Covers the time period from 2000 – 2015- Includes claims that were initiated from 2000 – 2009- Includes $14.8B in claim payments (before actuarial assumptions were used to
fill gaps), 208k policies, and 226k claims• Claim status details:
2%13.7%
62%
14%
8.3% Closed (Transfer, Other)
Benefit Expired
Death
Recovery
Open
* - Unknown – 0.04% Source: Cost of Formal Long Term Care Study Data
7
Claim Payments
Inflate to 2016
Elimination Period
Above Daily Benefit Limits
Beyond Benefit
Exhaustion
1 2 3 4
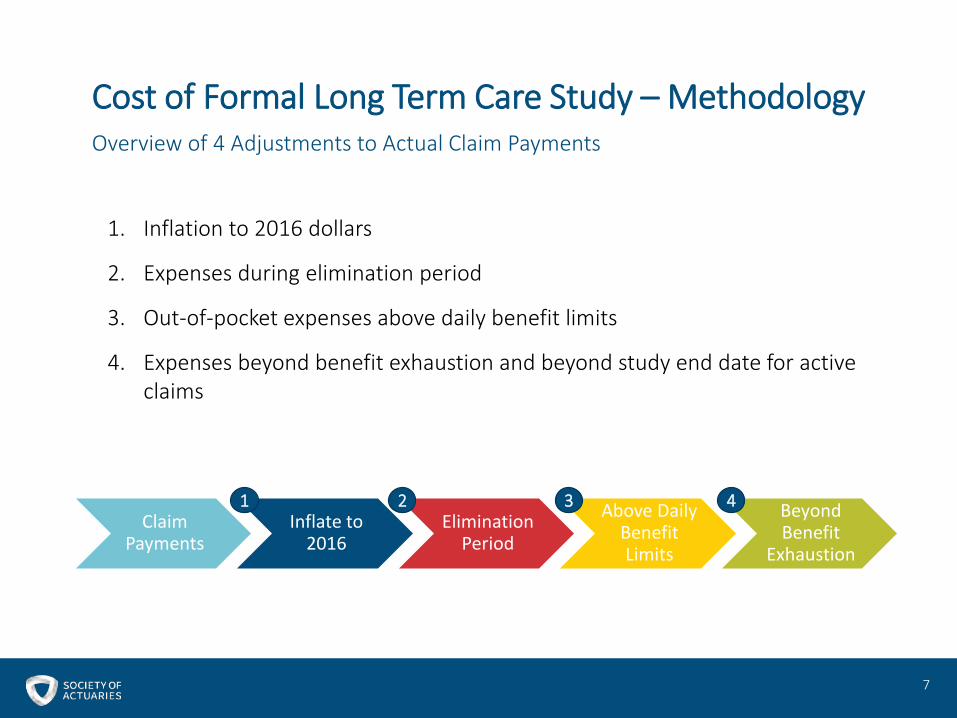
1. Inflation to 2016 dollars
2. Expenses during elimination period
3. Out-of-pocket expenses above daily benefit limits
4. Expenses beyond benefit exhaustion and beyond study end date for active claims
Cost of Formal Long Term Care Study – MethodologyOverview of 4 Adjustments to Actual Claim Payments
8
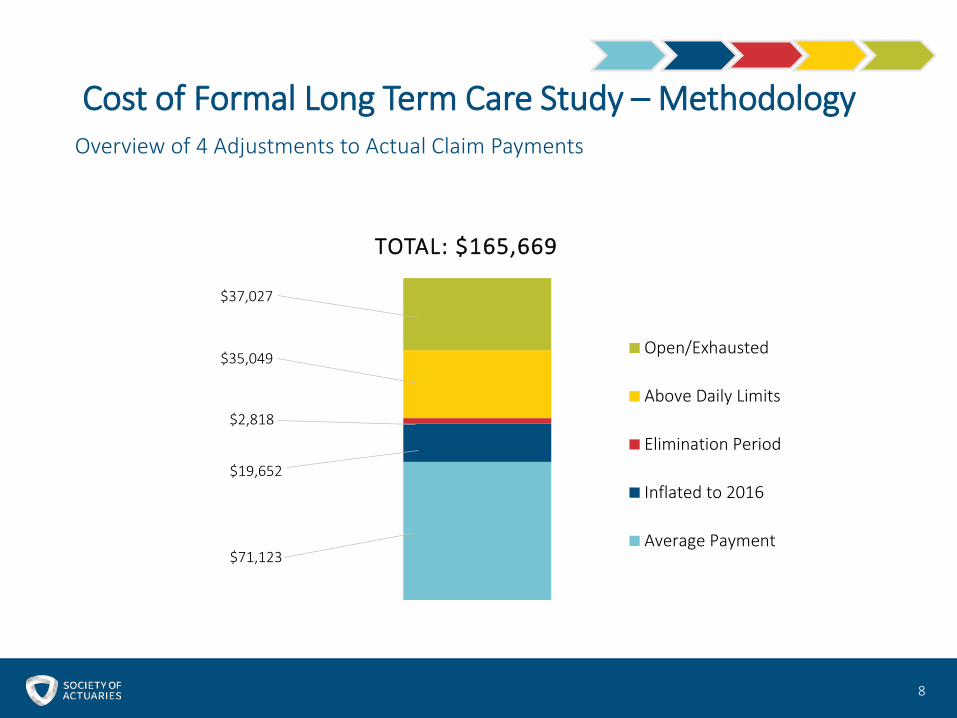
Cost of Formal Long Term Care Study – MethodologyOverview of 4 Adjustments to Actual Claim Payments
TOTAL: $165,669
Open/Exhausted
Above Daily Limits
Elimination Period
Inflated to 2016
Average Payment
$37,027
$35,049
$2,818
$19,652
$71,123
9
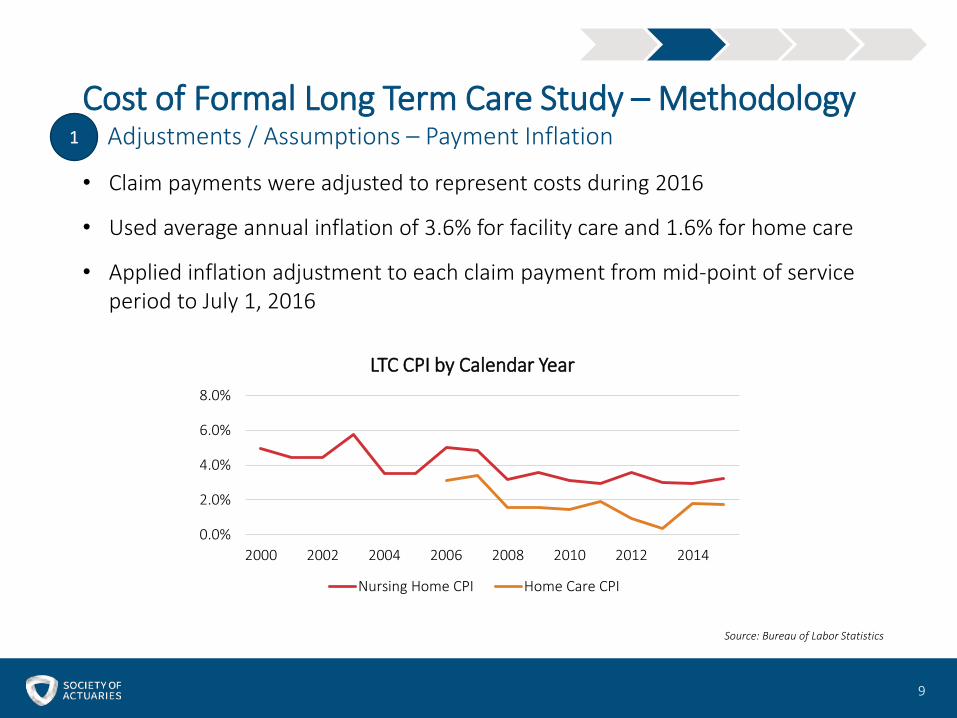
Cost of Formal Long Term Care Study – Methodology1 Adjustments / Assumptions – Payment Inflation
• Claim payments were adjusted to represent costs during 2016
• Used average annual inflation of 3.6% for facility care and 1.6% for home care
• Applied inflation adjustment to each claim payment from mid-point of service period to July 1, 2016
0.0%
2.0%
4.0%
6.0%
8.0%
2000 2002 2004 2006 2008 2010 2012 2014
LTC CPI by Calendar Year
Nursing Home CPI Home Care CPI
Source: Bureau of Labor Statistics
10
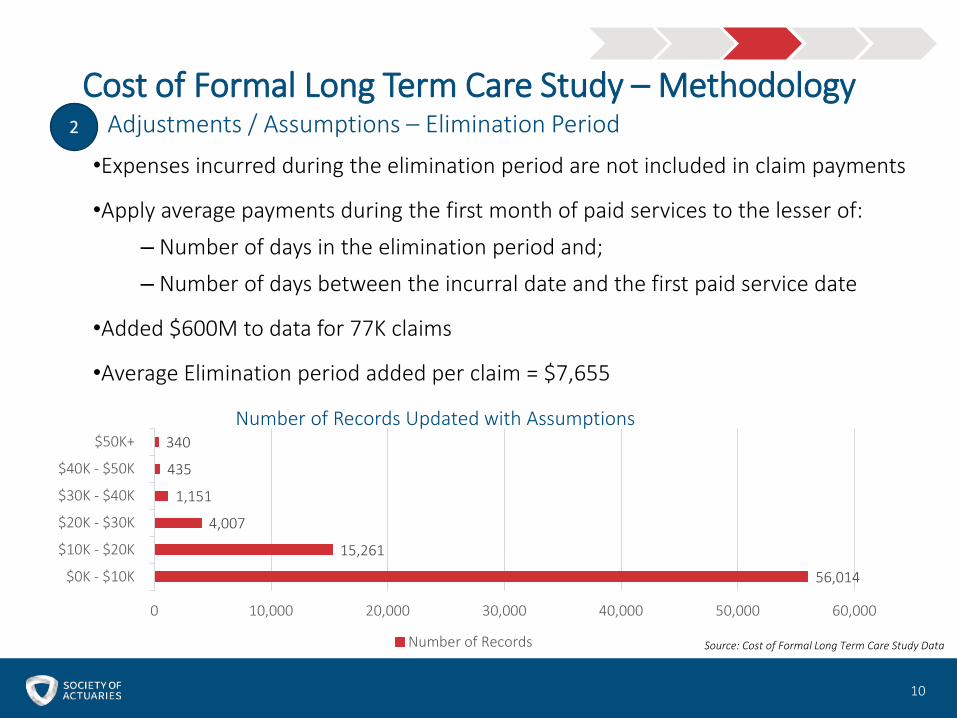
Cost of Formal Long Term Care Study – Methodology2 Adjustments / Assumptions – Elimination Period•Expenses incurred during the elimination period are not included in claim payments
•Apply average payments during the first month of paid services to the lesser of:
– Number of days in the elimination period and;
– Number of days between the incurral date and the first paid service date
•Added $600M to data for 77K claims
•Average Elimination period added per claim = $7,655
56,014
15,261
4,007
1,151
435
340
0 10,000 20,000 30,000 40,000 50,000 60,000
$0K - $10K
$10K - $20K
$20K - $30K
$30K - $40K
$40K - $50K
$50K+Number of Records Updated with Assumptions
Number of Records Source: Cost of Formal Long Term Care Study Data
11
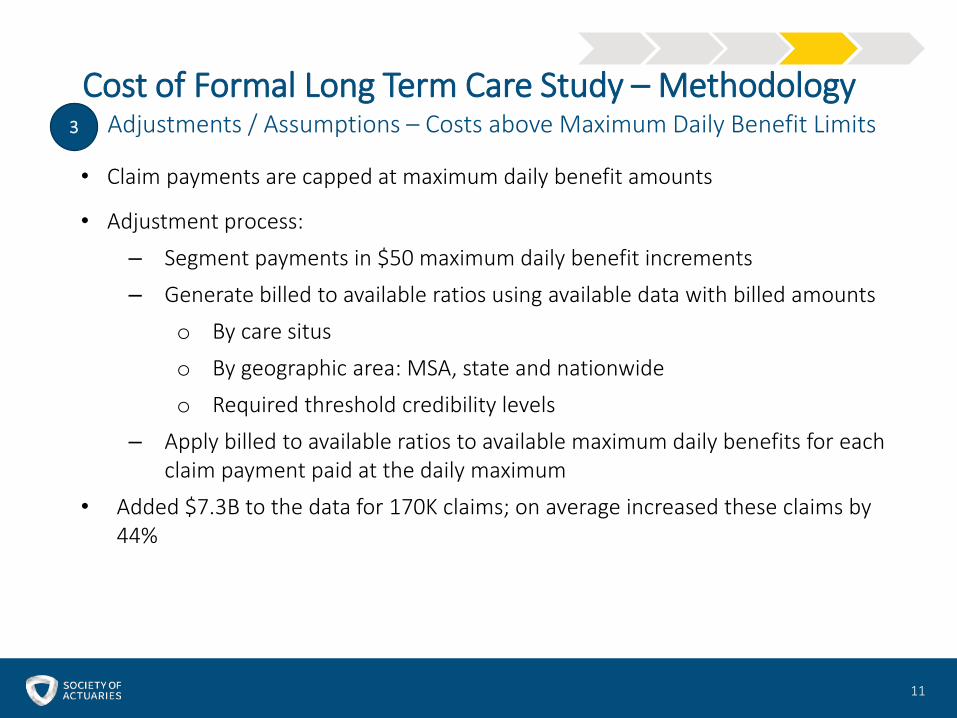
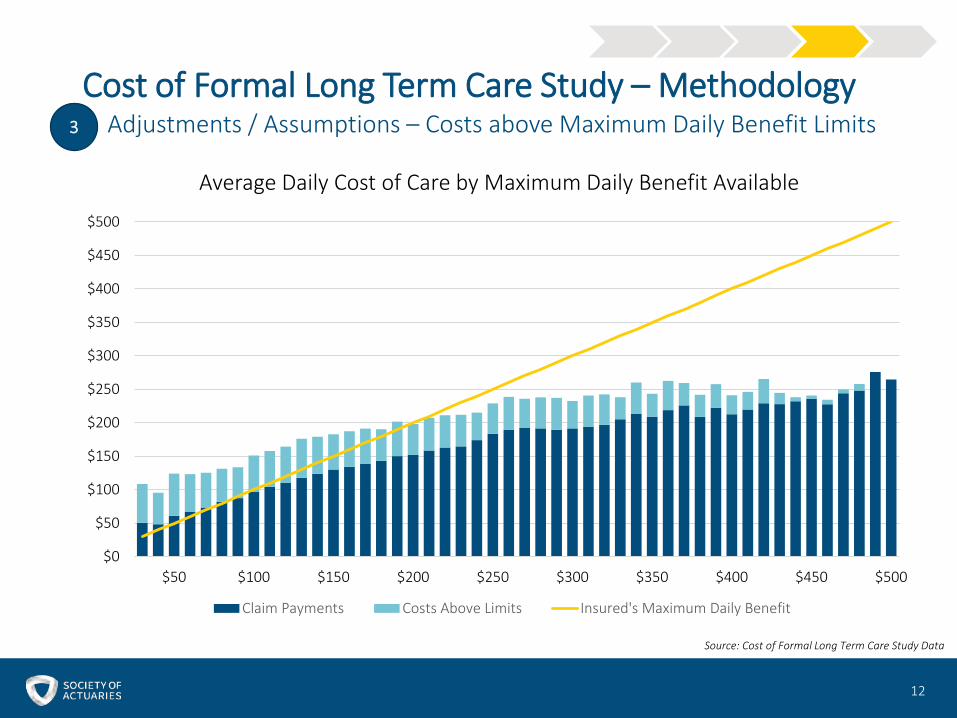
Cost of Formal Long Term Care Study – Methodology3 Adjustments / Assumptions – Costs above Maximum Daily Benefit Limits
• Claim payments are capped at maximum daily benefit amounts
• Adjustment process:
– Segment payments in $50 maximum daily benefit increments
– Generate billed to available ratios using available data with billed amounts
o By care situs
o By geographic area: MSA, state and nationwide
o Required threshold credibility levels
– Apply billed to available ratios to available maximum daily benefits for each claim payment paid at the daily maximum
• Added $7.3B to the data for 170K claims; on average increased these claims by 44%
12
Cost of Formal Long Term Care Study – Methodology3 Adjustments / Assumptions – Costs above Maximum Daily Benefit Limits
$0
$50
$100
$150
$200
$250
$300
$350
$400
$450
$500
$50 $100 $150 $200 $250 $300 $350 $400 $450 $500
Average Daily Cost of Care by Maximum Daily Benefit Available
Claim Payments Costs Above Limits Insured's Maximum Daily Benefit
Source: Cost of Formal Long Term Care Study Data
13
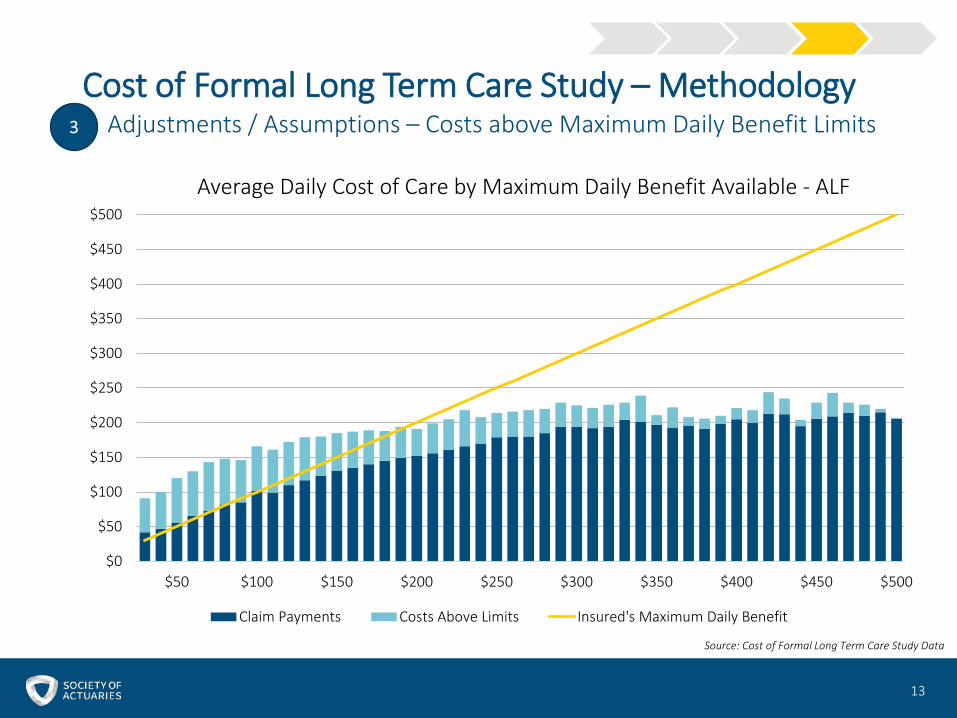
Cost of Formal Long Term Care Study – Methodology3 Adjustments / Assumptions – Costs above Maximum Daily Benefit Limits
$0
$50
$100
$150
$200
$250
$300
$350
$400
$450
$500
$50 $100 $150 $200 $250 $300 $350 $400 $450 $500
Average Daily Cost of Care by Maximum Daily Benefit Available - ALF
Claim Payments Costs Above Limits Insured's Maximum Daily Benefit
Source: Cost of Formal Long Term Care Study Data
14
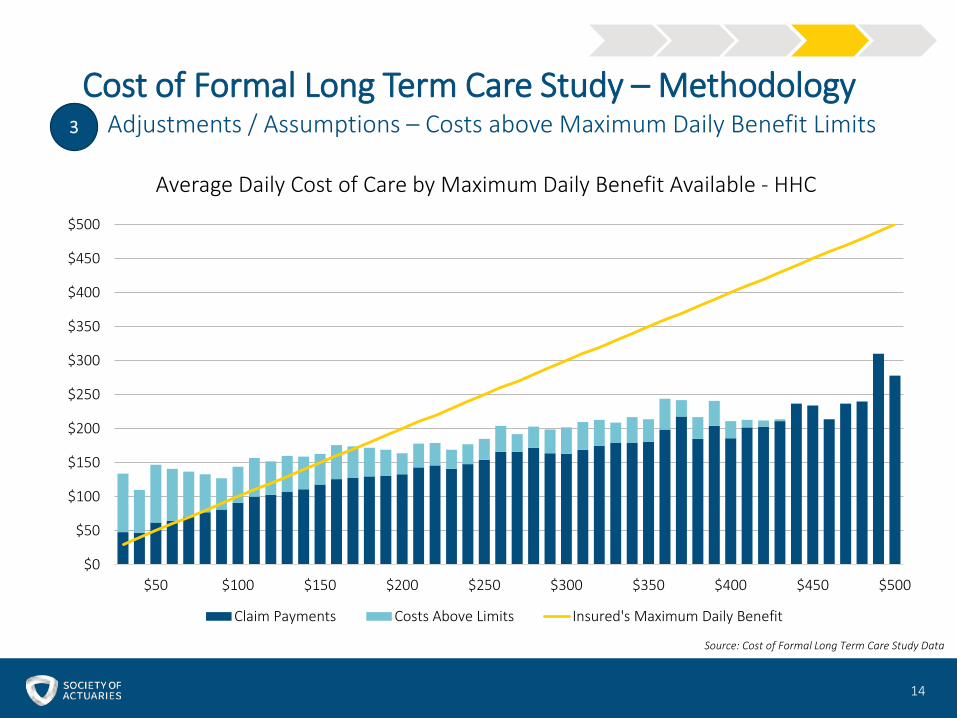
Cost of Formal Long Term Care Study – Methodology3 Adjustments / Assumptions – Costs above Maximum Daily Benefit Limits
$0
$50
$100
$150
$200
$250
$300
$350
$400
$450
$500
$50 $100 $150 $200 $250 $300 $350 $400 $450 $500
Average Daily Cost of Care by Maximum Daily Benefit Available - HHC
Claim Payments Costs Above Limits Insured's Maximum Daily Benefit
Source: Cost of Formal Long Term Care Study Data
15
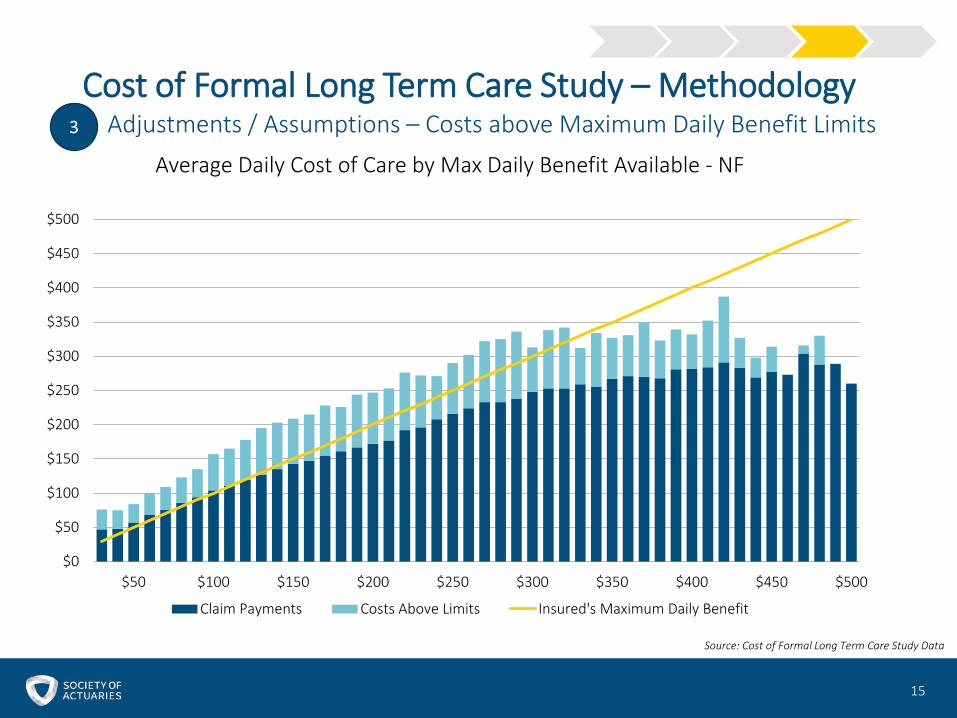
Cost of Formal Long Term Care Study – Methodology3 Adjustments / Assumptions – Costs above Maximum Daily Benefit Limits
$0
$50
$100
$150
$200
$250
$300
$350
$400
$450
$500
$50 $100 $150 $200 $250 $300 $350 $400 $450 $500
Average Daily Cost of Care by Max Daily Benefit Available - NF
Claim Payments Costs Above Limits Insured's Maximum Daily Benefit
Source: Cost of Formal Long Term Care Study Data
16
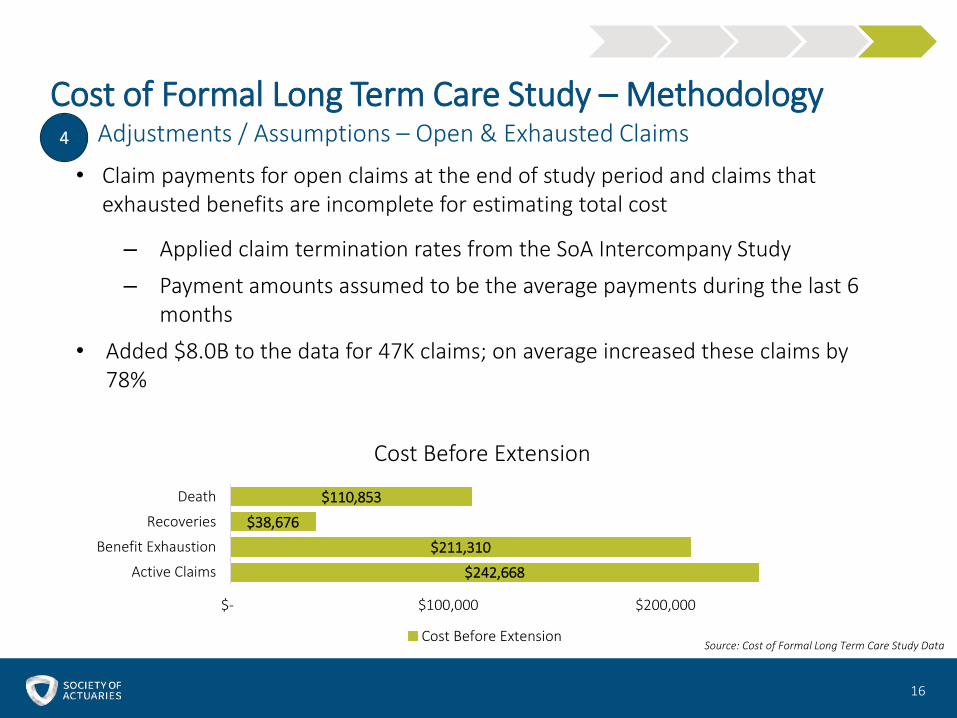
Cost of Formal Long Term Care Study – Methodology4 Adjustments / Assumptions – Open & Exhausted Claims
• Claim payments for open claims at the end of study period and claims that exhausted benefits are incomplete for estimating total cost
– Applied claim termination rates from the SoA Intercompany Study
– Payment amounts assumed to be the average payments during the last 6 months
• Added $8.0B to the data for 47K claims; on average increased these claims by 78%
$242,668
$211,310
$38,676
$110,853
$- $100,000 $200,000
Active Claims
Benefit Exhaustion
Recoveries
Death
Cost Before Extension
Cost Before ExtensionSource: Cost of Formal Long Term Care Study Data
17
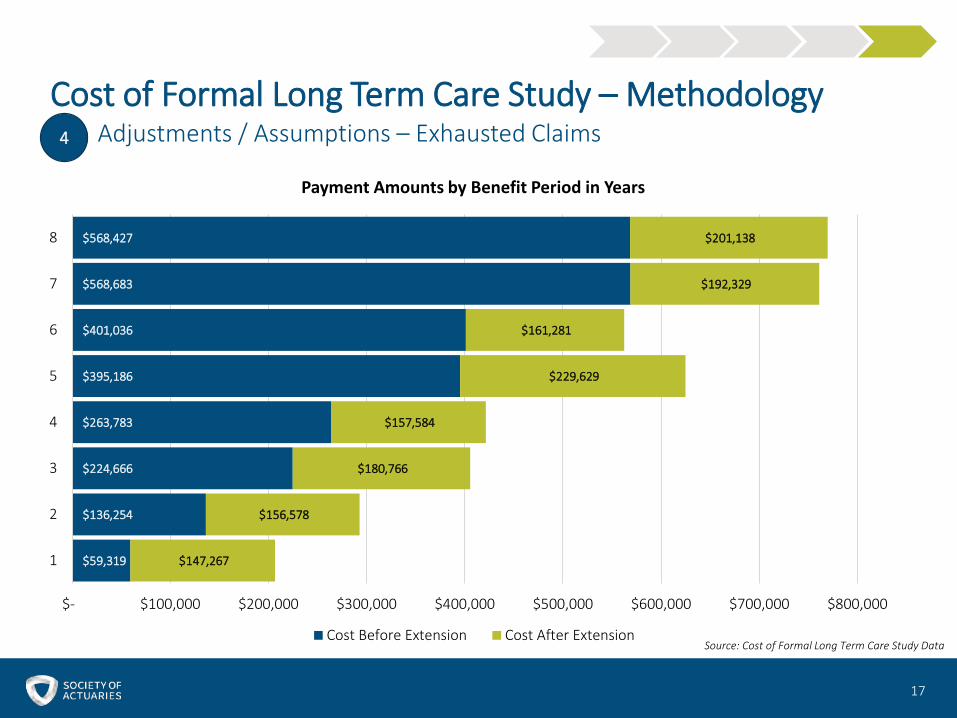
Cost of Formal Long Term Care Study – Methodology4 Adjustments / Assumptions – Exhausted Claims
Source: Cost of Formal Long Term Care Study Data
$59,319
$136,254
$224,666
$263,783
$395,186
$401,036
$568,683
$568,427
$147,267
$156,578
$180,766
$157,584
$229,629
$161,281
$192,329
$201,138
$- $100,000 $200,000 $300,000 $400,000 $500,000 $600,000 $700,000 $800,000
1
2
3
4
5
6
7
8
Payment Amounts by Benefit Period in Years
Cost Before Extension Cost After Extension
18
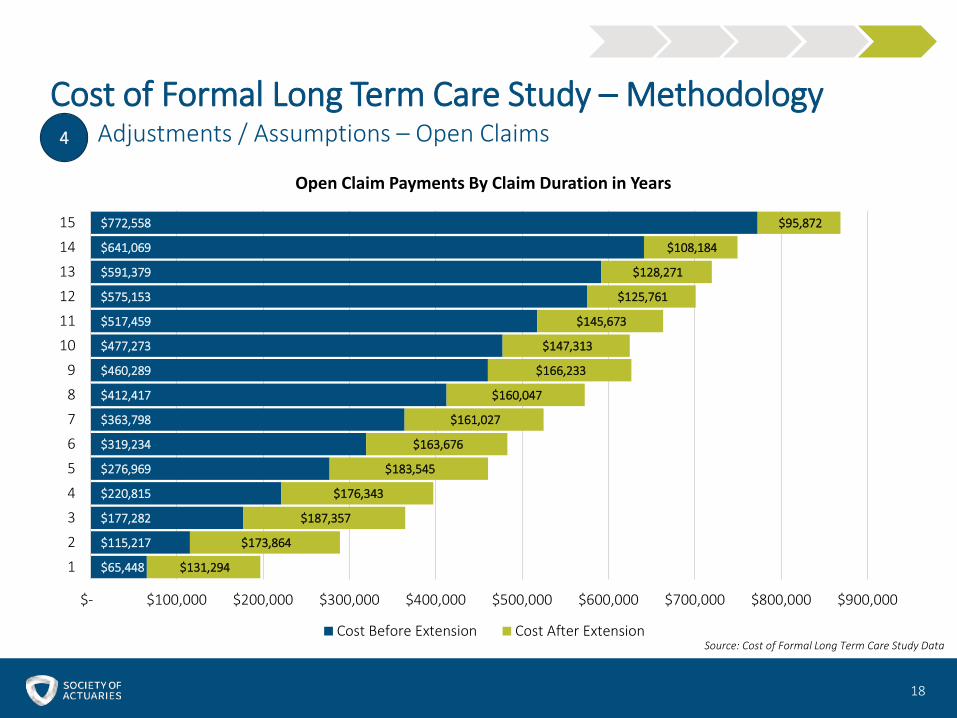
Cost of Formal Long Term Care Study – Methodology4 Adjustments / Assumptions – Open Claims
Source: Cost of Formal Long Term Care Study Data
$65,448
$115,217
$177,282
$220,815
$276,969
$319,234
$363,798
$412,417
$460,289
$477,273
$517,459
$575,153
$591,379
$641,069
$772,558
$131,294
$173,864
$187,357
$176,343
$183,545
$163,676
$161,027
$160,047
$166,233
$147,313
$145,673
$125,761
$128,271
$108,184
$95,872
$- $100,000 $200,000 $300,000 $400,000 $500,000 $600,000 $700,000 $800,000 $900,000
1
2
3
4
5
6
7
8
9
10
11
12
13
14
15
Open Claim Payments By Claim Duration in Years
Cost Before Extension Cost After Extension
19
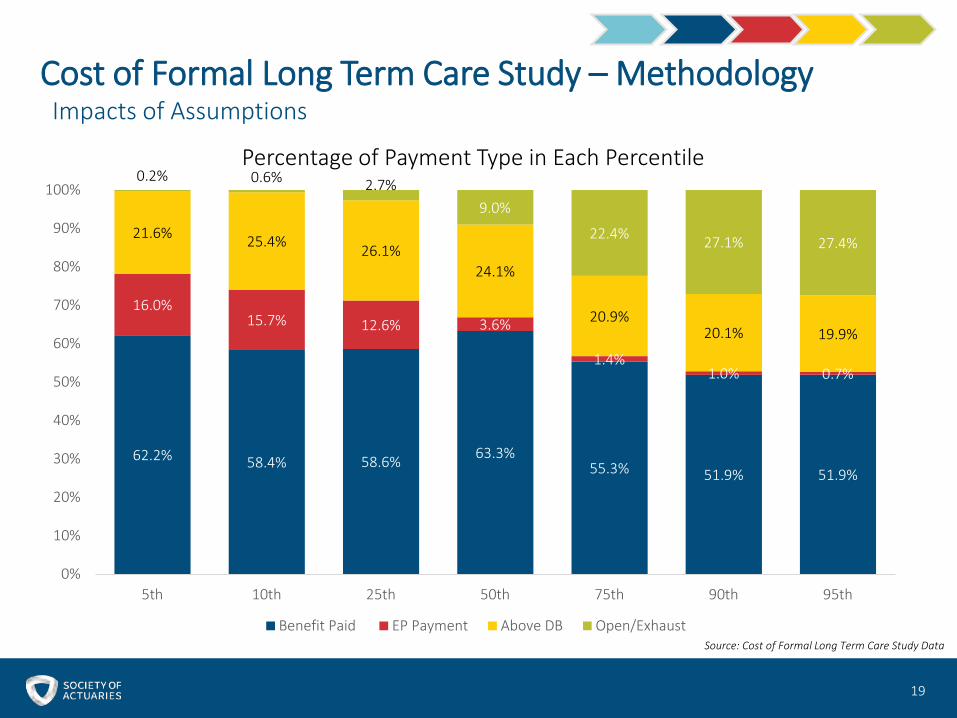
Cost of Formal Long Term Care Study – MethodologyImpacts of Assumptions
62.2% 58.4% 58.6% 63.3%55.3% 51.9% 51.9%
16.0%15.7% 12.6% 3.6%
1.4%1.0% 0.7%
21.6% 25.4% 26.1%24.1%
20.9%20.1% 19.9%
0.2% 0.6% 2.7%9.0%
22.4% 27.1% 27.4%
0%
10%
20%
30%
40%
50%
60%
70%
80%
90%
100%
5th 10th 25th 50th 75th 90th 95th
Percentage of Payment Type in Each Percentile
Benefit Paid EP Payment Above DB Open/ExhaustSource: Cost of Formal Long Term Care Study Data
20
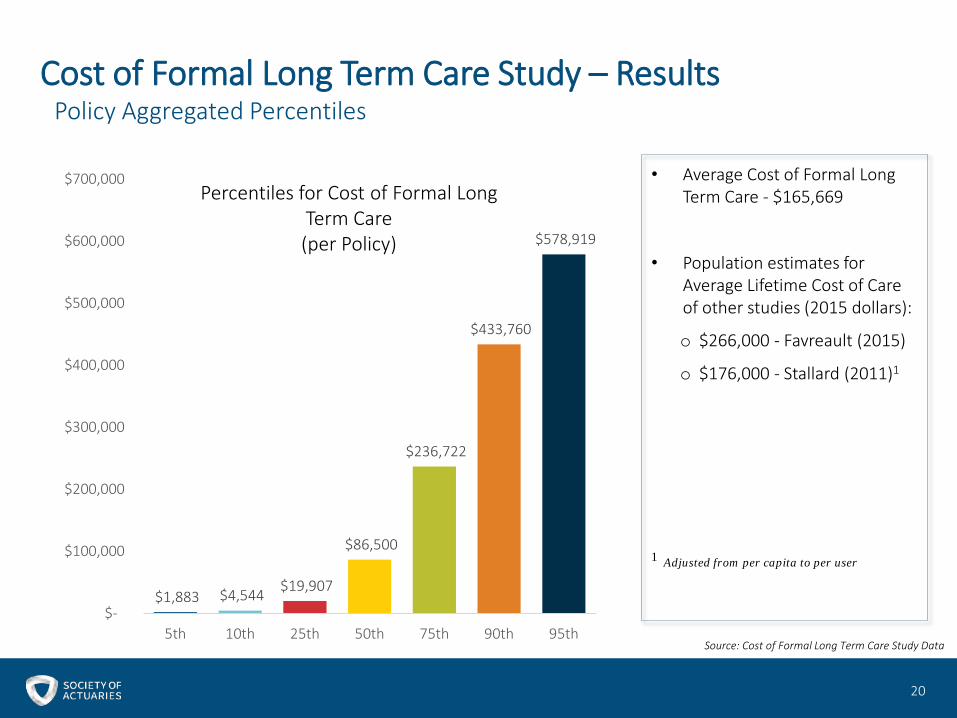
Cost of Formal Long Term Care Study – ResultsPolicy Aggregated Percentiles
$1,883 $4,544 $19,907
$86,500
$236,722
$433,760
$578,919
$-
$100,000
$200,000
$300,000
$400,000
$500,000
$600,000
$700,000
5th 10th 25th 50th 75th 90th 95th
Percentiles for Cost of Formal Long Term Care(per Policy)
• Average Cost of Formal Long Term Care - $165,669
• Population estimates for Average Lifetime Cost of Care of other studies (2015 dollars):
o $266,000 - Favreault (2015)
o $176,000 - Stallard (2011)1
1 Adjusted from per capita to per user
Source: Cost of Formal Long Term Care Study Data
21
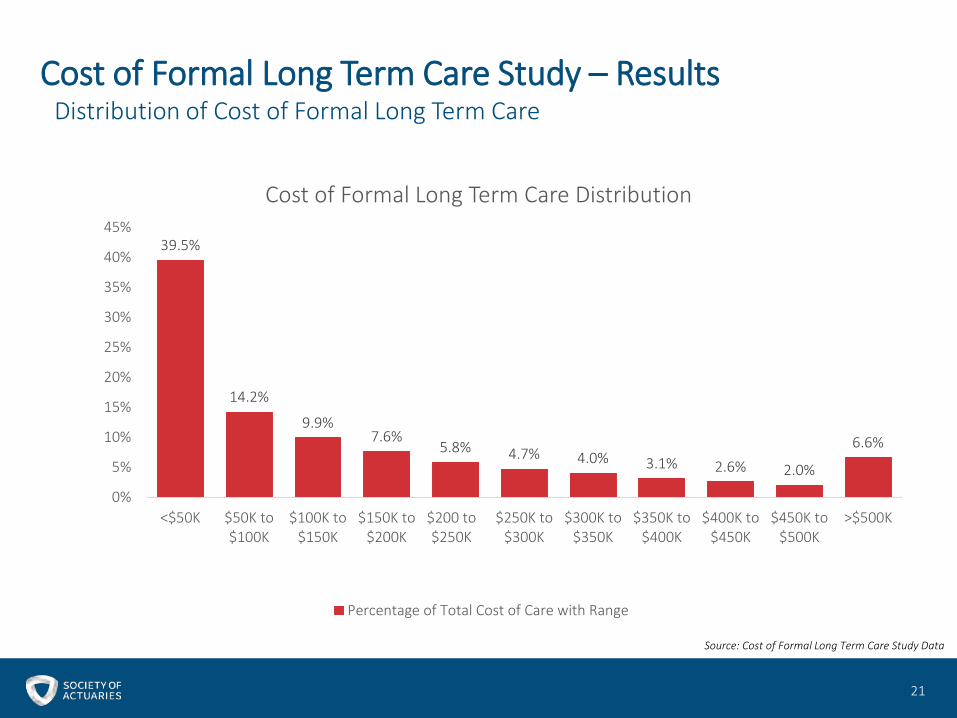
Cost of Formal Long Term Care Study – ResultsDistribution of Cost of Formal Long Term Care
39.5%
14.2%
9.9%7.6%
5.8% 4.7% 4.0% 3.1% 2.6% 2.0%
6.6%
0%
5%
10%
15%
20%
25%
30%
35%
40%
45%
<$50K $50K to$100K
$100K to$150K
$150K to$200K
$200 to$250K
$250K to$300K
$300K to$350K
$350K to$400K
$400K to$450K
$450K to$500K
>$500K
Cost of Formal Long Term Care Distribution
Percentage of Total Cost of Care with Range
Source: Cost of Formal Long Term Care Study Data
22
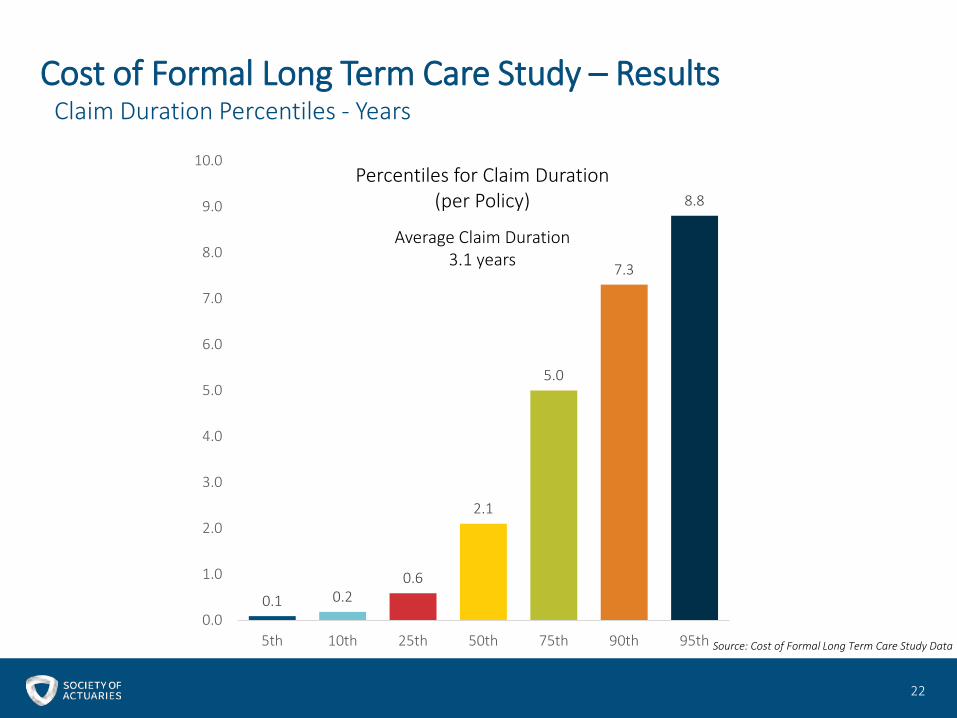
Cost of Formal Long Term Care Study – ResultsClaim Duration Percentiles - Years
0.1 0.20.6
2.1
5.0
7.3
8.8
0.0
1.0
2.0
3.0
4.0
5.0
6.0
7.0
8.0
9.0
10.0
5th 10th 25th 50th 75th 90th 95th
Percentiles for Claim Duration(per Policy)
Average Claim Duration3.1 years
Source: Cost of Formal Long Term Care Study Data
23
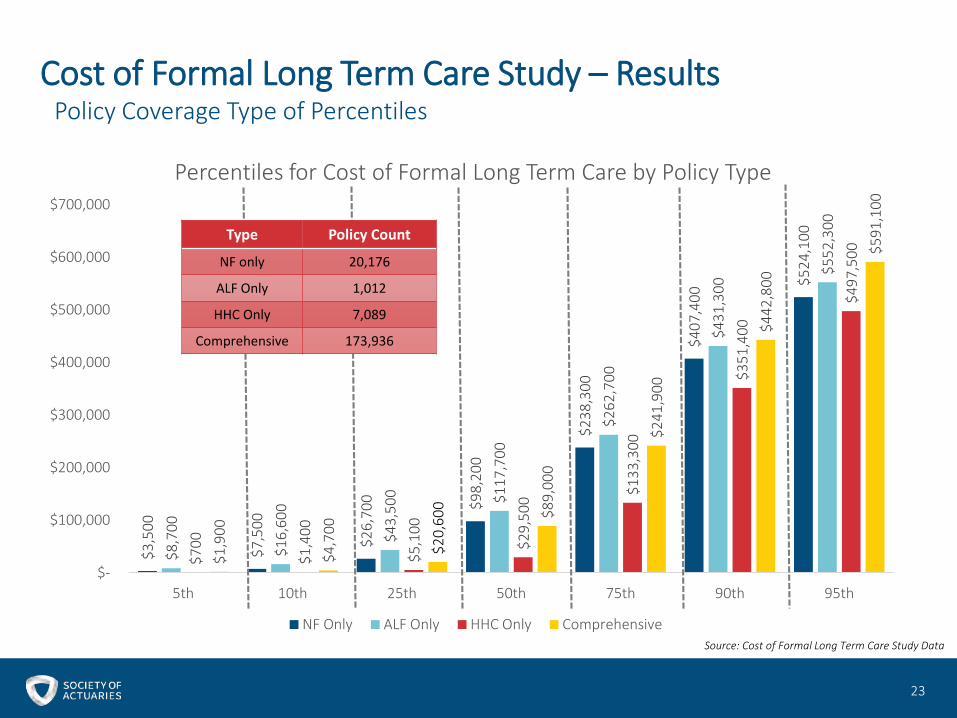
Cost of Formal Long Term Care Study – ResultsPolicy Coverage Type of Percentiles
$3,5
00
$7,5
00
$26,
700 $9
8,20
0
$238
,300
$407
,400
$524
,100
$8,7
00
$16,
600
$43,
500 $1
17,7
00
$262
,700
$431
,300
$552
,300
$700
$1,4
00
$5,1
00
$29,
500
$133
,300
$351
,400
$497
,500
$1,9
00
$4,7
00
$20,
600 $8
9,00
0
$241
,900
$442
,800
$591
,100
$-
$100,000
$200,000
$300,000
$400,000
$500,000
$600,000
$700,000
5th 10th 25th 50th 75th 90th 95th
Percentiles for Cost of Formal Long Term Care by Policy Type
NF Only ALF Only HHC Only Comprehensive
Type Policy Count
NF only 20,176
ALF Only 1,012
HHC Only 7,089
Comprehensive 173,936
Source: Cost of Formal Long Term Care Study Data
24
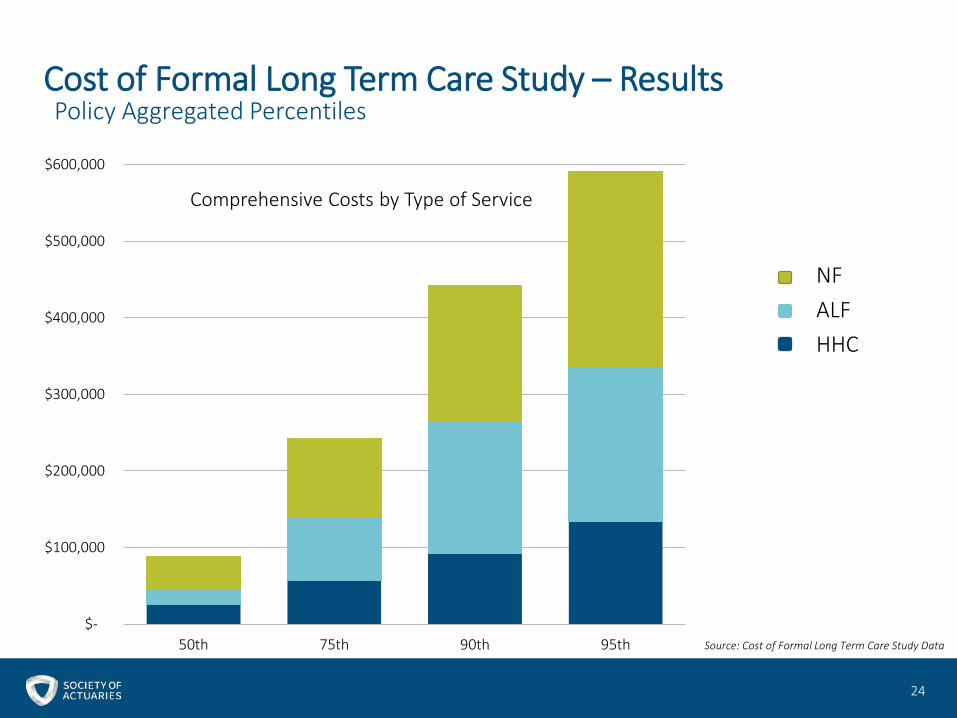
Cost of Formal Long Term Care Study – ResultsPolicy Aggregated Percentiles
$-
$100,000
$200,000
$300,000
$400,000
$500,000
$600,000
50th 75th 90th 95th
Comprehensive Costs by Type of Service
Source: Cost of Formal Long Term Care Study Data
NFALFHHC
25
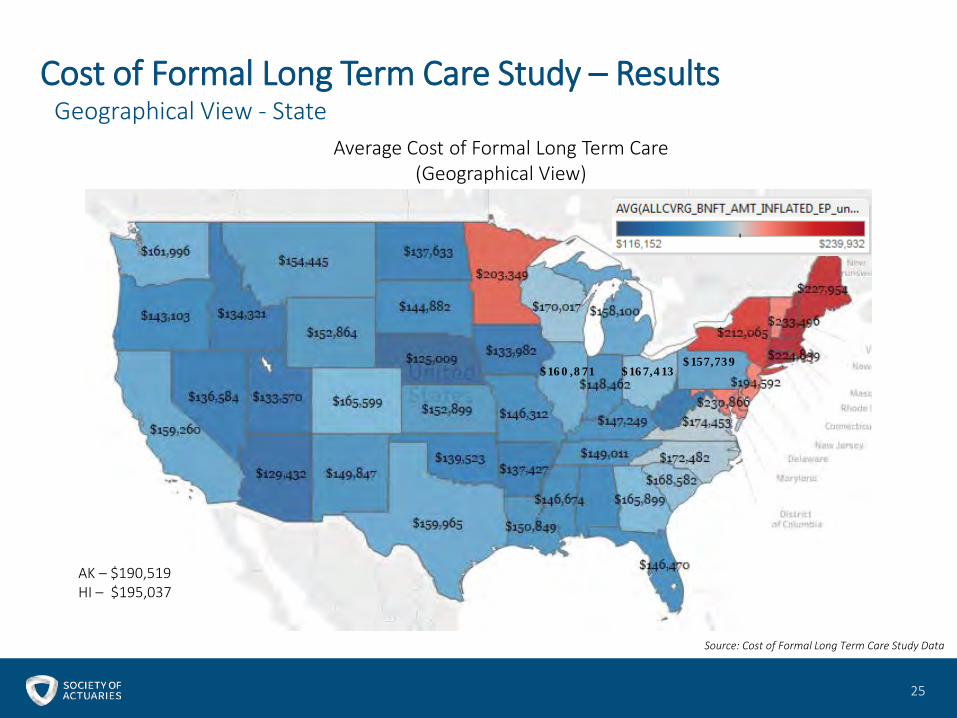
Cost of Formal Long Term Care Study – ResultsGeographical View - State
Average Cost of Formal Long Term Care(Geographical View)
AK – $190,519HI – $195,037
Source: Cost of Formal Long Term Care Study Data
$160,871 $167,413$157,739
Cost of Formal Long Term Care Study- Implications and Uses
26
Debapriya MitraGenworth Financial
Note:
• Genworth Financial, along with other Long Term Care Insurance providers, supplied historical LTCi claims data as part of the Cost of Formal Long Term Care Study conducted by PwC. The study, its methodology, and the conclusions drawn from study are those of PwC and do not reflect Genworth input or opinion.
• The observations in the following pages outline potential uses of the study and are intended to spur discussion of the topic, and are not intended to provide commentary on the study itself. These statements do not necessarily reflect the official policy or position of Genworth Financial, Inc. or any of its affiliated companies.
27
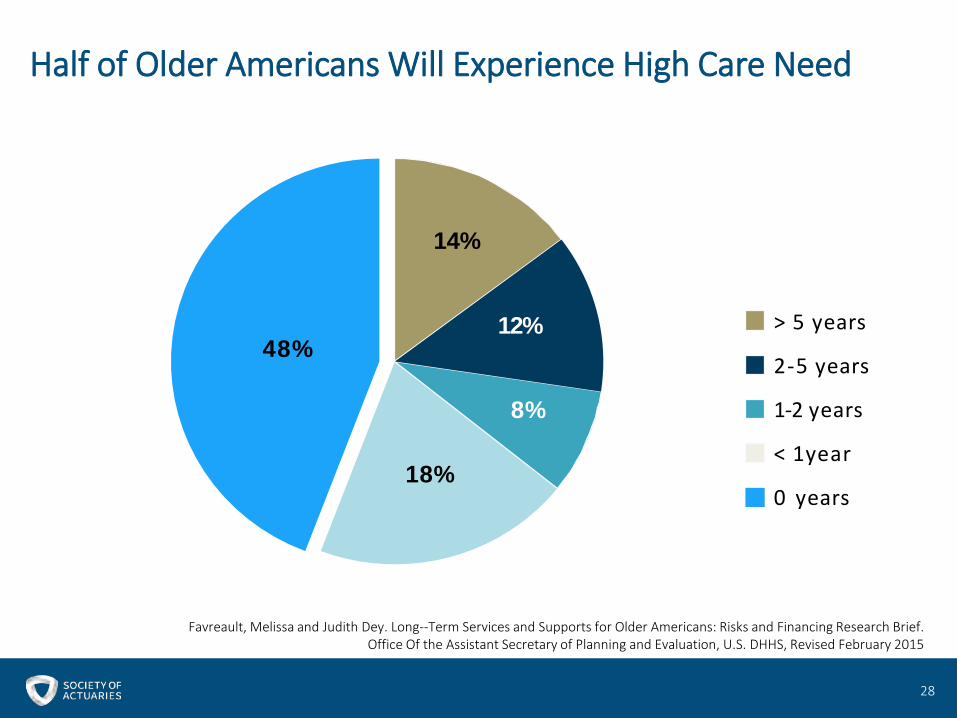
Half of Older Americans Will Experience High Care Need
> 5 years
2-5 years
1-2 years
< 1year
0 years
48%
14%
8%
18%
Favreault, Melissa and Judith Dey. Long--Term Services and Supports for Older Americans: Risks and Financing Research Brief. Office Of the Assistant Secretary of Planning and Evaluation, U.S. DHHS, Revised February 2015
12%
28
29
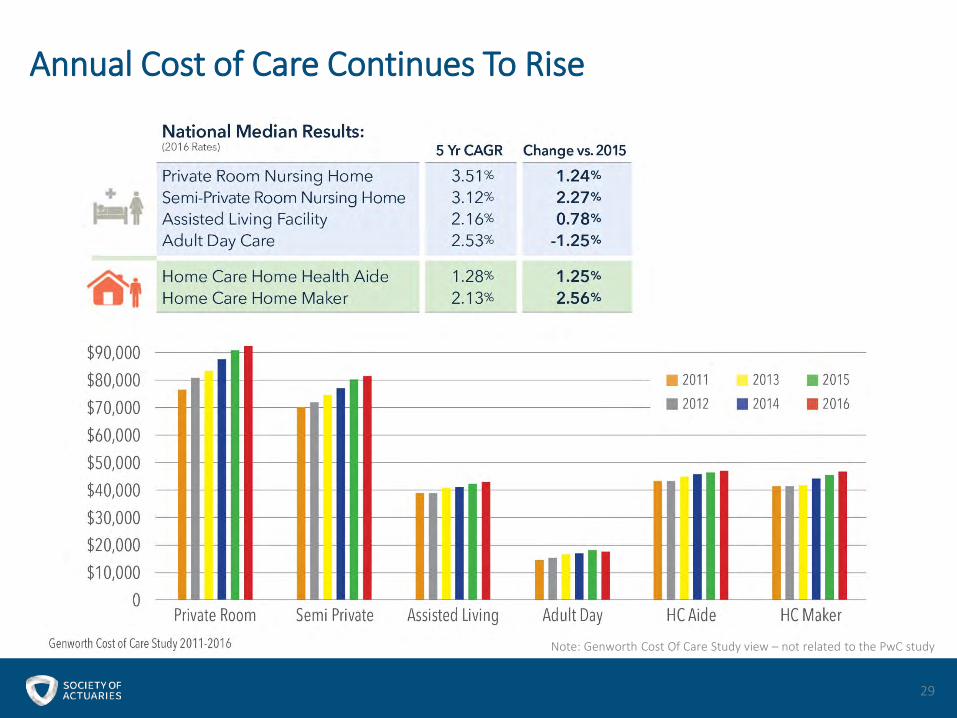
Annual Cost of Care Continues To Rise
Note: Genworth Cost Of Care Study view – not related to the PwC study
30
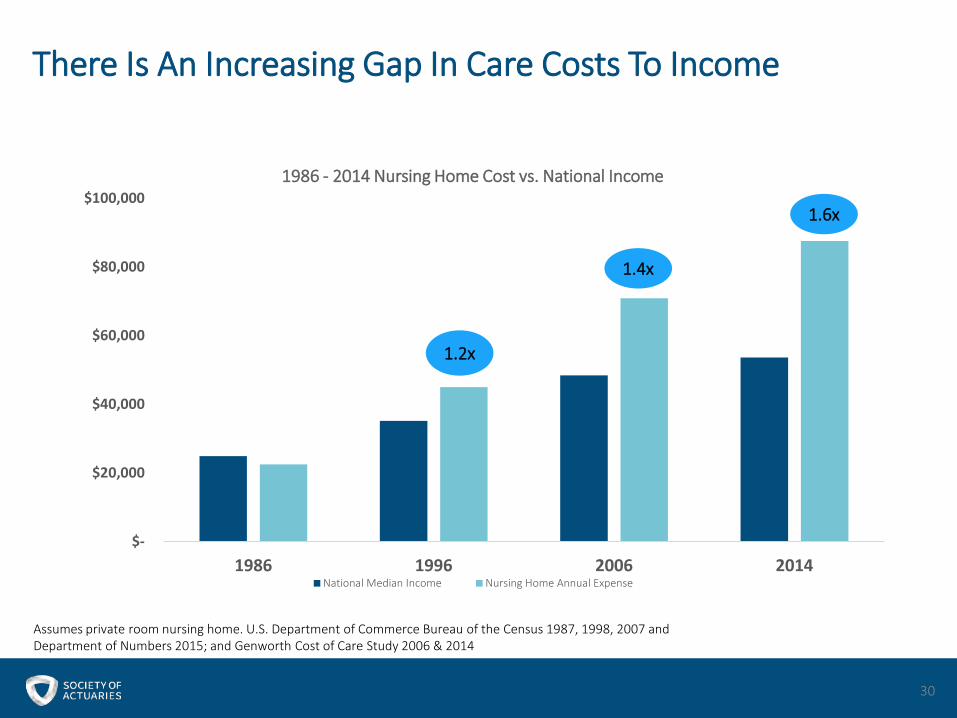
There Is An Increasing Gap In Care Costs To Income
$-
$20,000
$40,000
$60,000
$80,000
$100,000
1986 1996 2006 2014
1986 - 2014 Nursing Home Cost vs. National Income
National Median Income Nursing Home Annual Expense
1.2x
1.4x
1.6x
Assumes private room nursing home. U.S. Department of Commerce Bureau of the Census 1987, 1998, 2007 andDepartment of Numbers 2015; and Genworth Cost of Care Study 2006 & 2014
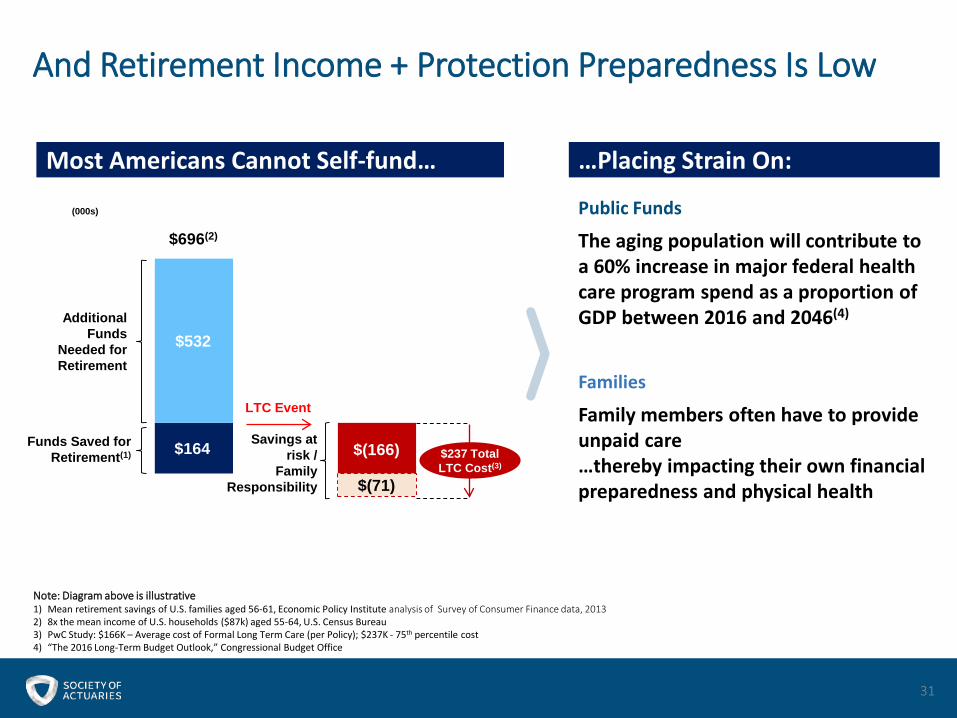
And Retirement Income + Protection Preparedness Is Low
31
Note: Diagram above is illustrative1) Mean retirement savings of U.S. families aged 56-61, Economic Policy Institute analysis of Survey of Consumer Finance data, 20132) 8x the mean income of U.S. households ($87k) aged 55-64, U.S. Census Bureau3) PwC Study: $166K – Average cost of Formal Long Term Care (per Policy); $237K - 75th percentile cost4) “The 2016 Long-Term Budget Outlook,” Congressional Budget Office
$164
$532
$237 Total LTC Cost(3)
Funds Saved for Retirement(1) $(166)
Savings at risk /
Family Responsibility $(71)
LTC Event
(000s)
$696(2)
Additional Funds
Needed for Retirement
Most Americans Cannot Self-fund… …Placing Strain On:
Public Funds
The aging population will contribute to a 60% increase in major federal health care program spend as a proportion of GDP between 2016 and 2046(4)
Families
Family members often have to provide unpaid care…thereby impacting their own financial preparedness and physical health
Application Of The Study
Education and awareness
Product design innovation
Need for measures to “bend the cost curve”
Potential actions to broaden the financing solution set
32
1
2
3
4
Education and Awareness
33
■ Lack of education and awareness remains key challenge for effective Long Term Care planning
■ Study provides additional information to raise awareness of need and cost; it can serve as an effective planning tool
1
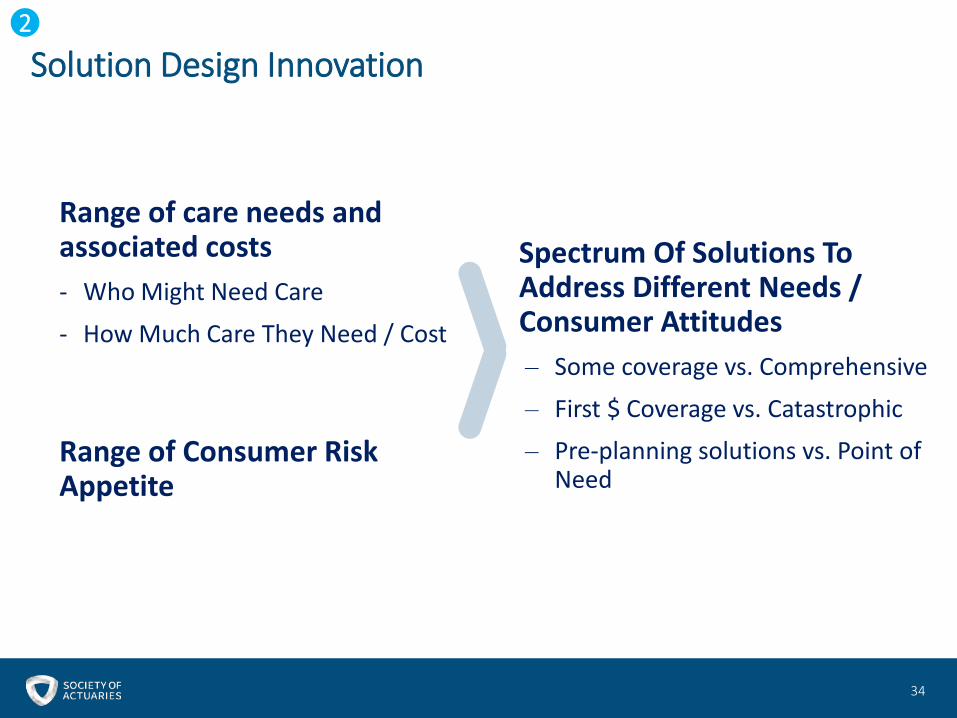
Solution Design Innovation
Range of care needs and associated costs- Who Might Need Care
- How Much Care They Need / Cost
34
Spectrum Of Solutions To Address Different Needs / Consumer Attitudes‒ Some coverage vs. Comprehensive
‒ First $ Coverage vs. Catastrophic‒ Pre-planning solutions vs. Point of
NeedRange of Consumer Risk Appetite
2
35
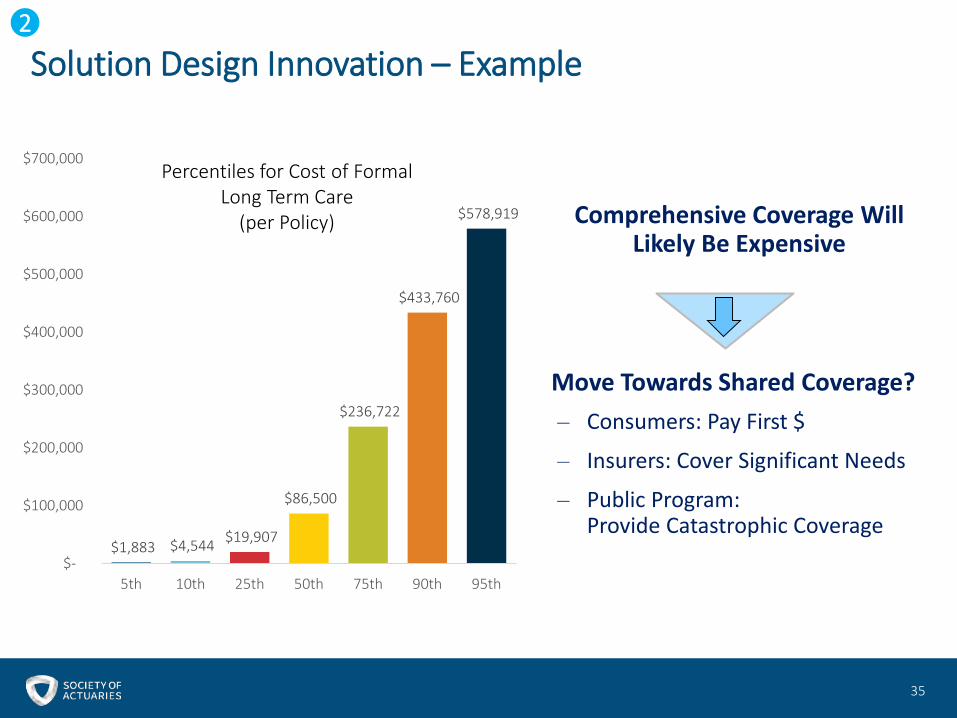
Comprehensive Coverage Will Likely Be Expensive
Move Towards Shared Coverage?‒ Consumers: Pay First $
‒ Insurers: Cover Significant Needs
‒ Public Program: Provide Catastrophic Coverage
Solution Design Innovation – Example 2
$1,883 $4,544 $19,907
$86,500
$236,722
$433,760
$578,919
$-
$100,000
$200,000
$300,000
$400,000
$500,000
$600,000
$700,000
5th 10th 25th 50th 75th 90th 95th
Percentiles for Cost of Formal Long Term Care
(per Policy)
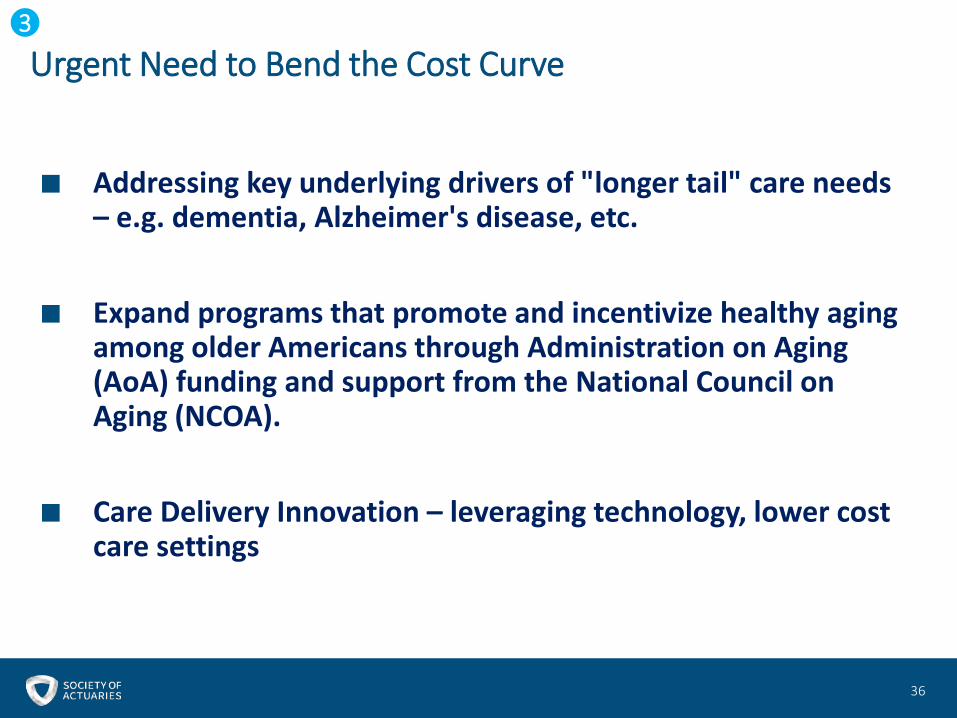
Urgent Need to Bend the Cost Curve
■ Addressing key underlying drivers of "longer tail" care needs – e.g. dementia, Alzheimer's disease, etc.
■ Expand programs that promote and incentivize healthy aging among older Americans through Administration on Aging (AoA) funding and support from the National Council on Aging (NCOA).
■ Care Delivery Innovation – leveraging technology, lower cost care settings
36
3
37
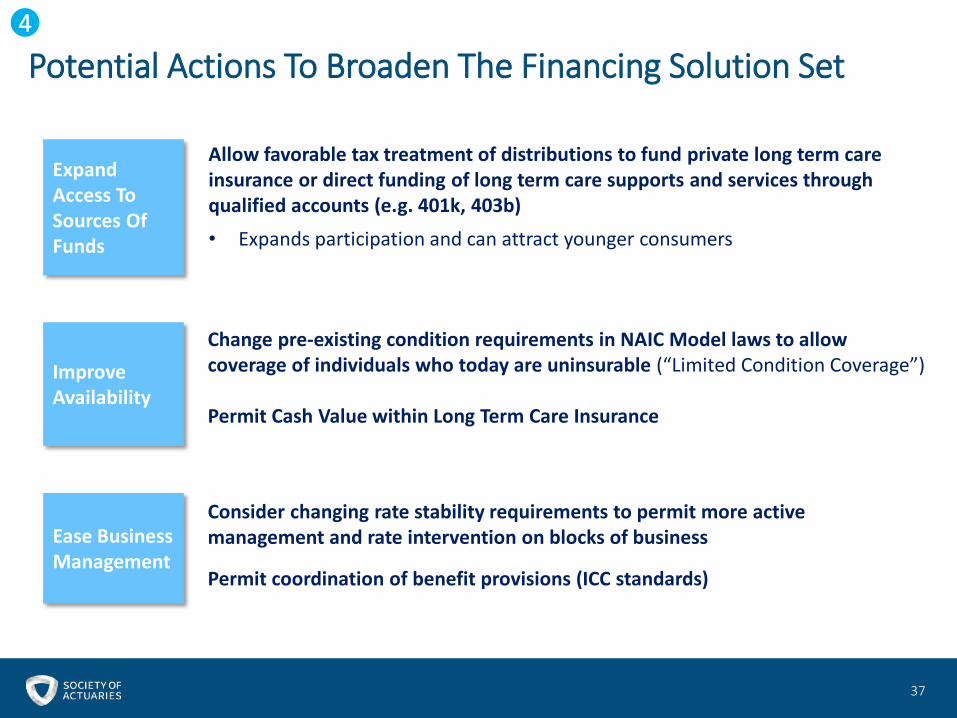
Potential Actions To Broaden The Financing Solution Set
Expand Access To Sources Of Funds
Allow favorable tax treatment of distributions to fund private long term care insurance or direct funding of long term care supports and services through qualified accounts (e.g. 401k, 403b)• Expands participation and can attract younger consumers
Improve Availability
Change pre-existing condition requirements in NAIC Model laws to allow coverage of individuals who today are uninsurable (“Limited Condition Coverage”)
Permit Cash Value within Long Term Care Insurance
Ease Business Management
Consider changing rate stability requirements to permit more active management and rate intervention on blocks of business
Permit coordination of benefit provisions (ICC standards)
4
Questions?
38


![Open Research Onlineoro.open.ac.uk/44816/1/[58] Koner, Rajabi-Siahboomi... · JasdipS. Koner1, Ali Rajabi-Siahboomi2, JamesBowen3, Yvonne Perrie 1, DanielKirby 1 & Afzal R. Mohammed1](https://img.pdfslide.us/doc/110x75/5f692142b273cf59eb024256/open-research-58-koner-rajabi-siahboomi-jasdips-koner1-ali-rajabi-siahboomi2.jpg)