Embed Size (px)
Citation preview

Long-Term Care Benchmarking Resource Guide
2 Long-Term Care Benchmarking Resource Guide | Health Quality Ontario
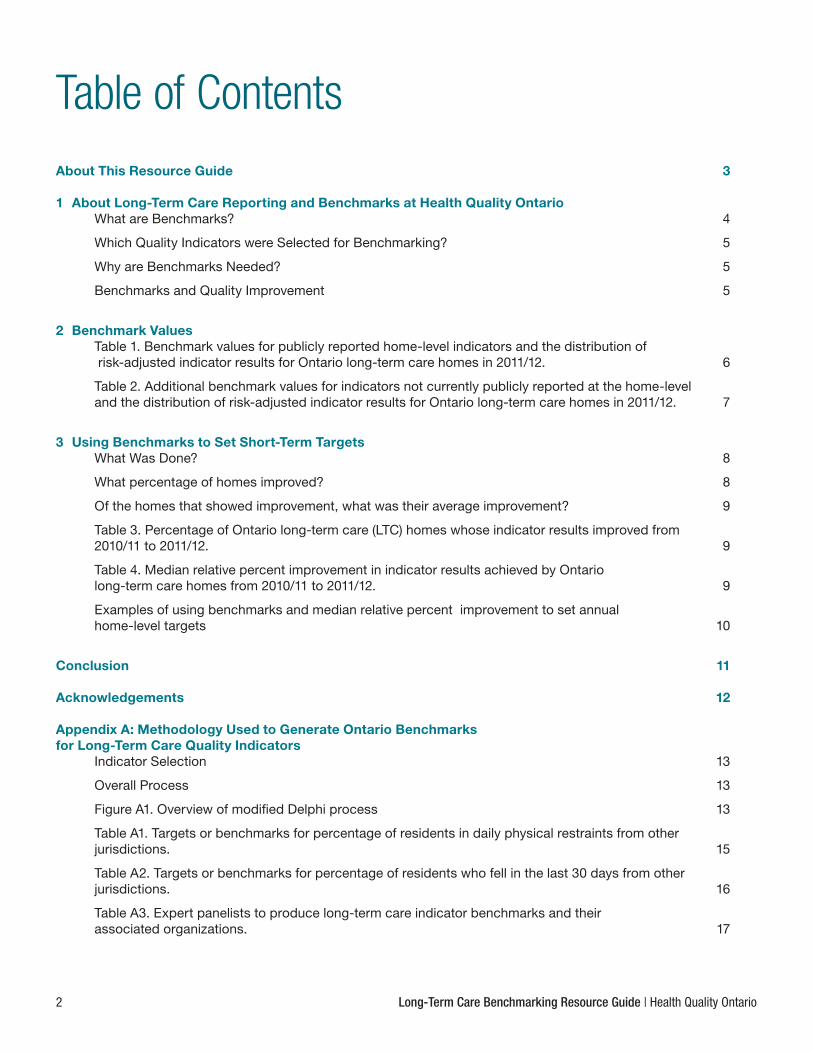
Table of ContentsAbout This Resource Guide 3
1 About Long-Term Care Reporting and Benchmarks at Health Quality Ontario What are Benchmarks? 4
Which Quality Indicators were Selected for Benchmarking? 5
Why are Benchmarks Needed? 5
Benchmarks and Quality Improvement 5
2 Benchmark Values Table 1. Benchmark values for publicly reported home-level indicators and the distribution of
risk-adjusted indicator results for Ontario long-term care homes in 2011/12. 6
Table 2. Additional benchmark values for indicators not currently publicly reported at the home-level and the distribution of risk-adjusted indicator results for Ontario long-term care homes in 2011/12. 7
3 Using Benchmarks to Set Short-Term Targets What Was Done? 8
What percentage of homes improved? 8
Of the homes that showed improvement, what was their average improvement? 9
Table 3. Percentage of Ontario long-term care (LTC) homes whose indicator results improved from 2010/11 to 2011/12. 9
Table 4. Median relative percent improvement in indicator results achieved by Ontario long-term care homes from 2010/11 to 2011/12. 9
Examples of using benchmarks and median relative percent improvement to set annual home-level targets 10
Conclusion 11
Acknowledgements 12
Appendix A: Methodology Used to Generate Ontario Benchmarks for Long-Term Care Quality Indicators Indicator Selection 13
Overall Process 13
Figure A1. Overview of modified Delphi process 13
Table A1. Targets or benchmarks for percentage of residents in daily physical restraints from other jurisdictions. 15
Table A2. Targets or benchmarks for percentage of residents who fell in the last 30 days from other jurisdictions. 16
Table A3. Expert panelists to produce long-term care indicator benchmarks and their associated organizations. 17

Health Quality Ontario | Long-Term Care Benchmarking Resource Guide 3
About This Resource GuideIn 2012, Health Quality Ontario (HQO) convened an expert panel to establish benchmarks for nine long-term care (LTC) quality indicators. The purpose of this resource guide is to introduce benchmark values for these nine indicators, four of which are reported to the public at the home-level by HQO. The remaining five are additional indicators to further your LTC home’s quality improvement efforts.
This document is divided into three sections. The first defines what benchmarks are and why they were produced. It also describes how benchmarks can be used in quality improvement initiatives by a LTC home. The second section provides the actual benchmark values and some of the key themes that were considered when they were produced. The third section examines the average improvements that homes have achieved in one year and how homes can use this information in conjunction with the provided benchmark values to set short-term, home-level targets.

4 Long-Term Care Benchmarking Resource Guide | Health Quality Ontario
1 About Long-Term Care Reporting and Benchmarks at Health Quality Ontario
Health Quality Ontario (HQO) reports to the public about the quality of long-term care (LTC) in Ontario through its public reporting website and Quality Monitor, an annual report on the quality of Ontario’s health system. Both of these products are available at http://www.hqontario.ca/public-reporting/.
While Quality Monitor encompasses all sectors, including LTC, it primarily reports system-level results. HQO’s LTC website is sector-specific, and provides home-level quality indicator results, in addition to system-level results. The quality indicators publicly reported on HQO’s LTC website serve as a resource for current and prospective LTC residents and their families, as well as those who work or volunteer in LTC homes.
Currently, there are four Continuing Care Reporting System (CCRS) indicators reported at the home-level on HQO’s LTC website.
1. Percentage of residents in daily physical restraints2. Percentage of residents who fell in the last 30 days3. Percentage of residents whose bladder continence worsened4. Percentage of residents whose stage 2 to 4 pressure ulcer worsened
As a way to improve public reporting and to better support quality improvement in Ontario’s LTC sector, HQO will be implementing a number of enhancements to the website. These enhancements include the posting of benchmarks for the four home-level indicators and the move from annual to quarterly data updates.
What are Benchmarks?Benchmarks are markers of excellence to which organizations can aspire. HQO used an evidence-informed process and expert panel, composed of Ontario-based LTC home operators, clinicians and researchers, to produce Ontario benchmarks that represent good resident outcomes and high-quality care (see Appendix A for benchmark methodology).
Health Quality Ontario | Long-Term Care Benchmarking Resource Guide 5
Which Quality Indicators were Selected for Benchmarking?HQO generated benchmarks for nine CCRS quality indicators. The nine CCRS indicators were selected based on discussions with HQO’s LTC Advisory Group Subcommittee on Benchmarking. Four were selected because they are publicly reported at the home-level (see above) and the remaining five were selected because they represent important clinical outcomes (worsening Activities of Daily Living, worsening behavioural symptoms, worsening pain, worsening symptoms of depression, and incidence of pressure ulcer). This document will focus on the four indicators that are publicly reported at the home-level.
Why are Benchmarks Needed?Using information currently on the website, homes can compare their quality indicator results with those of other homes and the provincial average. While this comparison can be useful, most homes are only comparing their performance against average quality of care, without learning whether they are providing high-quality care. Benchmarks provide a standard to which homes can compare themselves against, and can be used for quality improvement purposes. Benchmarks also present an opportunity for homes to share their success and what they have learned. Homes that are excelling in specific areas can share their innovative practices and processes with other homes working towards improvement in the same areas.
Benchmarks and Quality ImprovementResidents First, an HQO quality improvement initiative, strives to ensure each LTC resident enjoys safe, effective, and responsive care that helps them achieve the best quality of life. Residents First offers a number of programs (e.g., leadership, Lean process improvement) to build capacity for quality improvement in Ontario’s LTC sector. Quality improvement plans (QIPs), an essential element in driving quality, contain specific quality improvement priorities and change ideas to help homes achieve their aims/targets. Benchmarks can inform QIP development by 1) setting quality improvement priorities and 2) setting aims/targets.
Setting priorities – By comparing their performance against benchmark values, homes can see how their results compare to values that represent high-quality care. Homes can use this information to identify areas of focus for their quality improvement initiatives. For instance, a large gap between current performance and a benchmark value should prompt a home to investigate the reasons behind the gap, which could then lead the home to focus their quality improvement efforts on that specific area. When prioritizing quality improvement initiatives, other information should also be considered— please refer to the Quality Improvement Tool Package for a list of questions that homes should think about when setting priorities (http://www.hqontario.ca/quality-improvement/long-term-care/tools-and-resources).
Setting aims/targets – While there are multiple ways to set aims/targets — based on theoretical bests or performance achieved by peers, for example — evidence suggests that homes with ambitious stretch targets achieve larger improvements compared to those with minimal improvement targets1. In fact, setting stretch aims/targets is a key recommendation from Residents First2. Benchmark values can be used to inform these targets.
While priority and aim/target setting are important aspects of QIPs, they are only building blocks. Many other factors must be in place for a successful quality improvement project. For instance, homes must have the appropriate processes, change ideas and quality improvement teams in place. The Residents First website (http://www.hqontario.ca/quality-improvement/long-term-care) offers homes a variety of quality improvement resources and tools, including: evidence-based change ideas, QIP templates, root cause analysis tools (e.g., fishbone template, Pareto chart) and Lean process improvement tools. For any general inquiries regarding Residents First, please contact [email protected].
1. Baier R, Butterfield K, Patry G, Harris Y, Gravenstein S. Identifying star performers: the relationship between ambitious targets and nursing home
quality improvement. J Am Geriatr Soc 2009 Aug;57(8):1498-503.
2. Quality Improvement Plans in Long-Term Care: Lessons Learned. Toronto (ON): Health Quality Ontario; 2012. 32 p. Available online:
http://www.hqontario.ca/Portals/0/Documents/qi/rf-qip-lessons-learned-en.pdf.

6 Long-Term Care Benchmarking Resource Guide | Health Quality Ontario
2 Benchmark Values
Appendix A contains a detailed description of the modified Delphi process used to identify aspirational benchmarks that represent high-quality care and good resident outcomes for nine LTC indicators. The following tables summarize the benchmark values based on risk-adjusted indicator results. Risk adjustment takes into account the differences in resident characteristics that are outside the control of the home and are known to affect indicator results. For more information on risk adjustment methodology, please refer to the Canadian Institute for Health Information’s (CIHI) documentation, CCRS Quality Indicators Risk Adjustment Methodology3. The tables below also include the 2011/12 Ontario facility-level distribution — described using percentiles — to provide additional context.
Understanding percentilesPercentiles represent the percentage of homes that are at or lower than the stated value. For instance, the 10th percentile for the percentage of residents in daily physical restraints is 2.3%, which means that 10% of homes have an indicator result at or lower than 2.3%.
Table 1 displays benchmarks for the four publicly reported home-level indicators and Table 2 displays the benchmarks of those indicators that are intended to complement your home’s quality improvement efforts.
Table 1. Benchmark values for publicly reported home-level indicators and the distribution of risk-adjusted indicator results for Ontario long-term care homes in 2011/12.
Indicator BenchmarkOntario
Rate
Ontario Facility-Level Distribution (Percentile)
10th 25th Median 75th 90th
1. Percentage of residents in daily physical restraints 3% 13.9% 2.3% 6.1% 12.5% 20.9% 27.1%
2. Percentage of residents who fell in the last 30 days 9% 13.9% 8.5% 10.8% 13.7% 16.5% 18.8%
3. Percentage of residents whose bladder continence worsened
12% 19.4% 9.3% 13.6% 19.6% 26.7% 31.9%
4. Percentage of residents whose stage 2 to 4 pressure ulcer worsened
1% 2.8% 1.2% 1.9% 2.8% 4.0% 5.2%
3. CCRS Quality Indicators Risk Adjustment Methodology. Ottawa (ON): Canadian Institute for Health Information; 2013. 16 p. Available online:
http://www.cihi.ca/CIHI-ext-portal/pdf/internet/CCRS_QI_RISK_ADJ_METH_2013_EN.

Health Quality Ontario | Long-Term Care Benchmarking Resource Guide 7
Table 2. Additional benchmark values for indicators not currently publicly reported at the home-level and the distribution of risk-adjusted indicator results for Ontario long-term care homes in 2011/12.
Indicator BenchmarkOntario
Rate
Ontario Facility-Level Distribution (Percentile)
10th 25th Median 75th 90th
5. Percentage of residents whose ADL self-performance worsened 25% 33.4% 23.4% 29.2% 35.3% 40.0% 43.3%
6. Percentage of residents who had a newly occurring stage 2 to 4 pressure ulcer
1% 2.6% 1.0% 1.7% 2.6% 3.8% 4.9%
7. Percentage of residents whose behavioural symptoms worsened
8% 13.6% 7.5% 10.4% 13.4% 16.7% 19.9%
8. Percentage of residents whose mood symptoms of depression worsened
13% 25.9% 12.6% 19.3% 27.3% 34.0% 39.5%
9. Percentage of residents whose pain worsened
6% 11.1% 6.0% 8.1% 11.6% 14.9% 18.6%
Abbreviations: ADL, Activities of Daily Living
Themes considered while selecting benchmark valuesThe following themes guided the selection of benchmark values:
• The benchmarks were chosen based on risk-adjusted quality indicator results. In order to determine how achievable the current top performers’ rates are for most Ontario homes, the risk adjustment strategy for each indicator was considered in the discussion of the comparability of rates between provinces and between individual LTC homes.
• The panel used the distributions of indicator results in Ontario and other Canadian regions to provide context for selecting values that are both aspirational and achievable. The panel decided that benchmarks set at the 25th percentile were not stretch targets and that benchmarks below the 10th percentile might not be achievable. Therefore, the 10th and 25th percentile were used as boundaries when setting benchmarks.
• There was consensus that 0% should not be selected as a benchmark for any indicators, as there will always be circumstances where outcomes will occur, regardless of best practice. For instance, the panel rejected a 0% benchmark for worsening pressure ulcer because some pressure ulcers will worsen regardless of the quality of care being delivered.
• The availability of evidence-based guidelines, which when practiced, would lead to improved indicator results. If guidelines existed, the panel tended to be more ambitious in choosing aspirational benchmarks.
• The panel took into account how continuous improvement in RAI-MDS 2.0 assessment coding skills might impact indicator results.

8 Long-Term Care Benchmarking Resource Guide | Health Quality Ontario
3 Using Benchmarks to Set Short-Term Targets
In addition to identifying benchmark values, HQO also examined the magnitude of improvement over a one year period for each of the four publicly reported CCRS home-level indicators. Calculating the median relative percent improvement in Ontario LTC homes from 2010/11 (baseline) to 2011/12 (target year) provides an estimate of the annual average improvement. Homes can use the results of this analysis in conjunction with benchmark values to set short-term, home-level targets. This analysis also demonstrated that homes can make improvements regardless of their current performance. While setting targets, homes should always keep in mind that ambitious targets are associated with larger improvements4.
What Was Done?First, HQO examined the percentage of homes that improved between 2010/11 and 2011/12 in each of the four publicly reported home-level indicators. Next, only homes that improved were included in the analysis and the median relative percent improvement was calculated. The median relative percent improvement is the percentage of improvement that half the homes were able to achieve (i.e., half the homes improved by more than the median percentage, while the other half of homes improved by less than the median).
A relative percent improvement is calculated by subtracting the 2011/12 indicator result from the 2010/11 indicator result, and then dividing by the 2010/11 result. For example:
For home X,
2010/11 indicator result: 12%
2011/12 indicator result: 8%
Relative percent improvement = [2010/11 indicator result - 2011/12 indicator result] ÷ 2010/11 indicator result
= [12% - 8%] ÷ 12%
= 33%
The indicator result for home X decreased by 33%. In other words, home X improved its indicator result by 33%.
What percentage of homes improved?Table 3 summarizes the percentage of homes that improved their performance between 2010/11 and 2011/12. Close to or a majority of homes (47% to 68%) improved within one year. Homes below the provincial average in 2010/11 were more likely to improve over one year than homes that initially performed better than the provincial average. A substantial percentage (14% to 47%) of homes that performed better than 90% of all other homes were still able to improve. In other words, no matter how well a home performed, improvements are still possible.
4. Baier R, Butterfield K, Patry G, Harris Y, Gravenstein S. Identifying star performers: the relationship between ambitious targets and nursing home
quality improvement. J Am Geriatr Soc 2009 Aug;57(8):1498-503.

Health Quality Ontario | Long-Term Care Benchmarking Resource Guide 9
Table 3. Percentage of Ontario long-term care (LTC) homes whose indicator results improved from 2010/11 to 2011/12.
Indicator Percentage Ontario LTC homes that improved*
1. Percentage of residents in daily physical restraints 68%
2. Percentage of residents who fell in the last 30 days 47%
3. Percentage of residents with worsening bladder control 57%
4. Percentage of residents whose stage 2 to 4 pressure ulcer worsened
56%
*A home was considered to have improved if their CCRS risk-adjusted quality indicator result was lower in 2011/12 than 2010/11
Of the homes that showed improvement, what was their average improvement? Based only on the homes that actually improved, Table 4 describes the median relative percent improvement between 2010/11 and 2011/12 for each of the four publicly reported home-level indicators. The median relative percent improvement is the level of improvement that half the homes were able to reach. For instance, the median relative percent improvement for worsening pressure ulcer is 31%, which means that of all the homes that improved, half of them improved by at least 31%.
Note that median relative percent improvement values are not substitutes for benchmarks. Benchmarks are markers of high-quality care, while the median relative percent improvement only represents typical gains, which are subject to change from year-to-year. They provide additional context when homes are setting targets, but they are not recommended targets, and should not be used as such. Examples of how median relative percent improvement values might be used can be found below.
Table 4. Median relative percent improvement in indicator results achieved by Ontario long-term care homes from 2010/11 to 2011/12.
Indicator Median relative percent improvement*
1. Percentage of residents in daily physical restraints 30%
2. Percentage of residents who fell in the last 30 days 17%
3. Percentage of residents with worsening bladder control 23%
4. Percentage of residents whose stage 2 to 4 pressure ulcer worsened
31%
*Based on homes that improved between 2010/11 and 2011/12. A home was considered to have improved if their CCRS risk-adjusted quality indicator result was lower in 2011/12 than 2010/11

10 Long-Term Care Benchmarking Resource Guide | Health Quality Ontario
Examples of using benchmarks and median relative percent improvement to set annual home-level targets Example 1. The risk-adjusted indicator results for the percentage of residents in daily physical restraints in home X is 10%. If home X were to bring its restraint rate from 10% to the benchmark value of 3% within a year, this would represent a 70% relative percent improvement. Although this is not impossible, home X may want to set an annual target with a multi-year plan where the benchmark value is the goal. Understanding that many homes were able to improve by 30% — the median relative percent improvement — over one year and that more ambitious targets are associated with larger improvements, home X set a goal to reduce the indicator result from 10% in Year 1 to 5% in Year 2 (i.e., 50% relative improvement in one year). Next year, home X will revise its target to the benchmark value of 3% or lower.
Example 2. Home Y has an indicator result of 1% for worsening pressure ulcer, which is also the benchmark value. Leaders at home Y know that even though they are at the aspirational benchmark, they can still improve. Seeing that many homes were able to improve by a relative percent improvement of 31% for this indicator, home Y set an aim to reduce its result from 1% to 0.7% in one year (i.e., a relative percent improvement of 30%).

Health Quality Ontario | Long-Term Care Benchmarking Resource Guide 11
Conclusion
HQO established an expert panel, composed of Ontario LTC home operators, clinicians, and researchers, to produce benchmarks for nine CCRS LTC indicators, four of which are publicly reported at the home-level. Using an evidence-informed process, the expert panel produced benchmarks that represent good resident outcomes and high-quality care.
Prior to the release of these benchmark values, homes were only able to compare their indicator results to the provincial average or to other homes. LTC homes did not have a simple method for gauging whether or not their indicator results suggested high-quality performance. The newly established benchmarks enable this comparison. Homes can apply these benchmarks in their quality improvement initiatives in two ways:
• To set quality improvement priorities• To set clear home-level targets
Setting priorities and targets are just two of many elements needed for successful quality improvement initiatives. To assist homes in achieving their quality improvement goals, HQO encourages homes to use the resources found on the Residents First website (http://www.hqontario.ca/quality-improvement/long-term-care), where a wealth of information, from root cause analysis tools to models for building a quality improvement team can be found.
In the future, HQO will periodically evaluate the need to update the established benchmark values and assess opportunities to produce benchmarks for other indicators. HQO hopes this work will support LTC homes as they continue to strengthen the quality of care provided to LTC residents in Ontario.
12 Long-Term Care Benchmarking Resource Guide | Health Quality Ontario
Acknowledgements
Health Quality Ontario would like to thank the members of the LTC Advisory Group Subcommittee on Benchmarking for their time, insight, and feedback on the benchmark setting process (members listed below). We would also like to thank CIHI for the data and analysis, and the expert panel for their time and expertise (see Appendix A, Table A3 for list of expert panelists).
• Dan Buchanan, Ontario Association of Non-Profit Homes and Seniors Services
• Tim Burns, Health Quality Ontario
• Natalie Damiano, Canadian Institute for Health Information
• Robert Drage, Ontario Municipal Benchmarking Initiative
• Dr. John Hirdes, University of Waterloo
• Daile Moffat, Specialty Care Inc./Ontario Long-Term Care Association
• Paula Neves, Ontario Long-Term Care Association
• Dr. Jeff Poss, Health Quality Ontario
• Gayle Stuart, Health Quality Ontario
• Karen Yatabe, Belmont House
• Aging and Long-Term Care, Policy Care Standards Branch, Ministry of Health and Long-Term Care
• Performance Improvement and Compliance Branch, Ministry of Health and Long-Term Care

Health Quality Ontario | Long-Term Care Benchmarking Resource Guide 13
Appendix A: Methodology Used to Generate Ontario Benchmarks for
Long-Term Care Quality Indicators
Indicator SelectionThe four LTC quality indicators reported at the home-level on HQO’s LTC website were included in the benchmarking exercise. These indicators were calculated using data from CCRS, which was provided to HQO by CIHI. To ensure fairness and comparability of indicator results between homes, the calculated indicators were risk-adjusted, meaning that differences in case-mix and resident characteristics between homes were accounted for. In addition to the benchmarks established for the four home-level indicators, benchmark values were generated for five other CCRS indicators.
Overall ProcessBenchmarking for the selected indicators was achieved through a data-driven and evidence-informed, modified Delphi process. This process was adapted from previous studies5,6,7 and has been reviewed by the LTC Advisory Group Subcommittee on Benchmarking, which is composed of individuals from HQO, CIHI, the Ministry of Health and Long-Term Care, the Ontario Association of Non-Profit Homes and Services for Seniors (OANHSS), the Ontario Long Term Care Association (OLTCA), the Ontario Municipal Benchmarking Initiative (OMBI), a LTC home and the research community. Figure A1 (below) provides an overview of the modified Delphi process.
Figure A1. Overview of modified Delphi process
Literature review and data analysis – The first step of the modified Delphi process was a literature search of peer-reviewed articles and relevant grey literature for ideal/theoretical best rates, existing benchmarks, and incidence/prevalence rates from other jurisdictions published within the past five years. CCRS indicator results from Ontario and other Canadian regions were calculated by CIHI. All this information was provided to the expert panel for determining benchmark values.
5. Courtney M, O’Reilly MT, Edwards H, Hassall S. Benchmarking clinical indicators of quality for Australian residential aged care facilities. Aust
Health Rev 2010 Mar;34(1):93-100.
6. Rantz MJ, Petroski GF, Madsen RW, Mehr DR, Popejoy L, Hicks LL, et al. Setting thresholds for quality indicators derived from MDS data for
nursing home quality improvement reports: an update. Jt Comm J Qual Improv 2000 Feb;26(2):101-10.
7. Hjaltadottir I, Hallberg IR, Ekwall AK. Thresholds for minimum data set quality indicators developed and applied in icelandic nursing homes. J
Nurs Care Qual 2012 Jul;27(3):266-76.
Literature Review/Data
Analysis
Expert Panel Recruitment
Round 1: Online Survey
Round 2: In-Person Meeting
Benchmark Results

14 Long-Term Care Benchmarking Resource Guide | Health Quality Ontario
The results of the Ontario CCRS indicators were considered the most relevant and important piece of information for determining benchmark values. A summary of the Ontario CCRS indicator results is included in the Benchmark Values section of this document. Existing benchmarks/targets, when available, were also considered to be important. The literature review uncovered existing benchmarks/targets for two indicators: percentage of residents in daily physical restraints and percentage of residents who fell in the last 30 days. This literature is summarized in Tables A1 (restraint use) and A2 (residents who experienced a fall).
Rates for similar indicators from other jurisdictions and CCRS indicator results from other Canadian regions were also considered by the panel. Although useful, this information was less significant in the determination of benchmark values. Additional information considered by the panel for the selection of benchmarks can be obtained by contacting [email protected].
Expert panel recruitment – The next step was the recruitment of the expert panel. For this, the LTC Advisory Group Subcommittee on Benchmarking nominated potential expert panellists based on the following qualifications: a) familiarity with RAI-MDS, b) frontline clinical/research expertise, c) recognized as an opinion leader, and d) committed to quality improvement and a champion for residents.
From the nominated individuals, HQO selected members to ensure appropriate organizational and home-type representation. Organizations represented included long-term care home associations (OLTCA and OANHSS), data partners (CIHI and InterRAI), provider associations (Ontario Long Term Care Physicians) and the Ministry of Health and Long-Term Care. The expert panel also had representation from homes with varying bed size, geographic location, and ownership type. Finally, the expert panel reflected a broad range of expertise: researchers, front-line clinicians, informatics/quality improvement management, home administrators, and a Ministry of Health and Long-Term Care representative. In total, there were 11 panelists and one chair who participated in the benchmarking process. Refer to Table A3 for the full membership of the expert panel.
Online survey – After the expert panel was established, online survey packages were sent out to the 11 panelists. For each indicator being benchmarked, the panelists were asked to provide a value that would be an achievable score indicating good resident outcomes and high-quality care in a general LTC home. To enable the expert panel to suggest benchmarks that were informed by data and current evidence, HQO provided the panelists with the following:• Indicator definitions (denominator, numerator, exclusions, and risk-adjustment variables)• Literature review results:
o International performanceo Existing targets/thresholds in other jurisdictions
• CIHI data (CCRS, Fiscal Year 2011/12, Quarter 4):o Ontario facility-level distribution
§ Distribution graph of Ontario facility-level indicator results§ Summary statistics: minimum, 5th, 10th, 25th, median, 75th, 90th, 95th percentiles, and
maximumo Box plots of regional facility-level distribution of other Canadian jurisdictions
In-person meeting – Ten of 11 panelists were able to attend an in-person meeting that took place after the initial online survey. At this forum, panellists discussed the results of the online survey (i.e., anonymous answers from each respon-dent and the average suggested benchmark result for each quality indicator), shared their expertise, and anonymously provided revised benchmark values based on the discussions that took place for each indicator. At the conclusion of the meeting, the panel reviewed their revised suggested benchmark results. By consensus, the expert panel recom-mended to set the benchmarks to their mean response rounded to the nearest percentage point for each indicator.

Health Quality Ontario | Long-Term Care Benchmarking Resource Guide 15
Table A1. Targets or benchmarks for percentage of residents in daily physical restraints from other jurisdictions. Note: References located after Table A2.
Jurisdiction and Sample Population
Summary StatisticsSuggested threshold
or targetsAssessment
ToolComparison to CCRS Indicator Definition
Ontario Median (2011/12): 12.5%Ontario Benchmark: 3%
Missouri, USA• Statewide
1.5%based on data-driven Delphi process(Rantz et al., 2000)
MDS *Same numerator and denominator*No risk adjustment done, and indicator does not exclude comatose and quadriplegic residents
Mean: 2.9% (Oct-Dec 2009)
0.0%based on data - 20th percentile score for the state of Missouri from MDS statewide data (Oct 2008 - Mar 2009)(QIPMO, 2009)
MDS *Same numerator and denominator *No risk adjustment done, and indicator does not exclude comatose and quadriplegic residents
Queensland, Australia• 9 LTC
facilities• 498
residents
Median: 13.3%25th percentile: 2.4%75th percentile: 36.7%
1.0%based on data-driven Delphi process(O’Reilly et al., 2011)
ResCareQA *Definition includes bed rails if used as a restraint (where bed rails are excluded from CCRS definition)*Exclusion criteria and risk adjustment not described
Iceland• Nationwide• 47 LTC
facilities• 2247
residents
Median: 9.9%25th percentile: 7.7%75th percentile: 15.9%
3.1%based on data-driven Delphi process (Hjaltadottir et al., 2012)
MDS *Definition not provided (but likely uses the MDS definition)*Exclusion criteria and risk adjustment not described
USA• Nationwide
Mean: 2.6%(Jul-Sep, 2010)
National campaign goal: ≤2%National 10th percentile: 0.0%*based on expert opinion & data(Advancing Excellence Campaign, 2012)
MDS *Same numerator and denominator *No risk adjustment done, and indicator does not exclude comatose and quadriplegic residents

16 Long-Term Care Benchmarking Resource Guide | Health Quality Ontario
Table A2. Targets or benchmarks for percentage of residents who fell in the last 30 days from other jurisdictions.
Note: References located after Table A2.
Jurisdiction and Sample Population
Summary StatisticsSuggested threshold
or targetsAssessment
ToolComparison to CCRS Indicator Definition
Ontario Median 2011/12: 10.8%Ontario Benchmark: 9%
Missouri, USA• Statewide
5.8%based on data-driven Delphi process (Rantz et al., 1997 & 2000)
MDS *Same numerator and denominator *Same exclusion criteria*No risk adjustment
Mean: 15.4%(Oct-Dec 2009)
9.8%based on data - 20th percentile score for the state of Missouri from MDS statewide data (Oct 2008 - Mar 2009)(QIPMO, 2009)
MDS *Same numerator and denominator *Same exclusion criteria*No risk adjustment
Queensland, Australia• 9 LTC
facilities• 498
residents
Median: 13.4% 25th percentile: 13.3%75th percentile: 15.6%
4.3%based on data-driven Delphi process (O’Reilly et al., 2011)
ResCareQA *Same numerator and denominator*Exclusion criteria and risk adjustment not described
Iceland• Nationwide• 47 LTC
facilities• 2247
residents
Median: 14.5%25th percentile: 9.1%75th percentile: 19.2%
6.1%based on data-driven Delphi process (Hjaltadottir et al., 2012)
MDS *Same numerator and denominator*Exclusion criteria and risk adjustment not described
References for Tables A1 and A2Advancing Excellence in America’s Nursing Homes Campaign [Internet]. Excellence in Long Term Care Collaborative; 2012 [Accessed June 29,
2012]. Available online: http://www.nhqualitycampaign.org/star_index.aspx?controls=welcome.
Hjaltadottir I, Hallberg IR, Ekwall AK. Thresholds for minimum data set quality indicators developed and applied in icelandic nursing homes. J Nurs
Care Qual 2012 Jul;27(3):266-76.
O’Reilly M, Courtney M, Edwards H, Hassall S. Clinical outcomes in residential care: setting benchmarks for quality. Australas J Ageing 2011
Jun;30(2):63-9.
Rantz MJ, Petroski GF, Madsen RW, Mehr DR, Popejoy L, Hicks LL, et al. Setting thresholds for quality indicators derived from MDS data for nursing
home quality improvement reports: an update. Jt Comm J Qual Improv 2000 Feb;26(2):101-10.
Thresholds for Missouri to be used with CMS Reports for MDS QIs. QIPMO: University of Missouri Sinclair School of Nursing; 2009. 1 p. Available
online: http://www.nursinghomehelp.org/moqithresholds.pdf.

Health Quality Ontario | Long-Term Care Benchmarking Resource Guide 17
Table A3. Expert panelists to produce long-term care indicator benchmarks and their associated organizations.
Primary Area of Expertise Panelist, Location, Association (if applicable)
Data/Research Natalie Damiano, Chair (Ottawa)Manager, Home and Continuing Care Data Management, Canadian Institute for Health Information
Dr. John Hirdes (Waterloo)Professor, School of Public Health and Health Systems, University of Waterloo; Chair, Ontario Home Care Research and Knowledge Exchange; Scientific Director, Homewood Research Institute
Dr. Walter Wodchis (Toronto)Associate Professor, Institute of Health Policy, Management and Evaluation, University of Toronto; Adjunct Scientist, Institute for Clinical Evaluative Sciences; Research Scientist, Toronto Rehabilitation Institute
Dr. Diane Doran (Toronto)Professor, Bloomberg Faculty of Nursing, University of Toronto
Quality/Informatics Shelby Poletti (Thunder Bay, OANHSS)Corporate Manager Quality Improvement and Decision Support, St. Joseph’s Care Group, Bethammi Nursing Home and Hogarth Riverview Manor
Debbie Johnston (Mississauga, OLTCA)Director of Professional Development and Informatics, Chartwell
Administrators Wendy Campbell (Stayner, OLTCA)Assistant Administrator, Stayner Nursing Home
Eric Hanna (Arnprior, OANHSS)Chief Executive Officer, Arnprior Hospital
Front-Line Clinicians Dr. Andrea Moser (Toronto)President, Ontario Long-Term Care Physicians
Dr. Paul Katz (Toronto, OLTCA)Vice-President, Medical Services and Chief of Staff, Baycrest
Angela Archer (Mississauga, OANHSS)Director of Care, Malton Village Long-Term Care
Ministry of Health and Long-Term Care
Kim White (London)Manager, London Service Area Office, Ministry of Health and Long-Term Care

Health Quality Ontario130 Bloor Street West10th FloorToronto, ON M5S 1N5
Telephone: 416-323-6868Toll-free: 1-866-623-6868Email: [email protected]
© Queen’s Printer for Ontario, 2013
www.hqontario.ca