Embed Size (px)
Citation preview
Master of Science Thesis
KTH School of Industrial Engineering and Management
Energy Technology EGI-2013-ECS
Division of Energy and Climate Studies
SE-100 44 STOCKHOLM
Long-term Bioethanol Shift and
Transport Fuel Substitution in Ethiopia
Status, Prospects, and Implications
Yacob Gebreyohannes Hiben
850623-T458
-ii-
Master of Science Thesis EGI 2013:ECS
Long-term Bioethanol Shift and
Transport Fuel Substitution in Ethiopia
Yacob Gebreyohannes Hiben
Approved
31-08-2013
Examiner
Prof. Semida Silveira
Supervisor
Francis X. Johnson
Dilip Khatiwada
Commissioner
Contact person
-iii-
Abstract
In an effort to reduce dependence on imported fossil fuels with a sustainable and environmentally sound improvements, the government of Ethiopia has recognized the need to promote biofuels development so as to support the green economy strategy of the country designed to bring a breakthrough for socio-economic and environmental transformations which are becoming the central excellence for current and future prosperity of the country towards the quality of life and global competitiveness. Under this picture, bioethanol fuel comes into the market as one of the possible options to achieve this ambitious goal.
As part of the bioethanol road map, the government has established a binding 10% share of fuel ethanol in the SI-engine vehicles at the capital, Addis Ababa, where 70% of the imported gasoline is consumed. In addition a target of 15% share is set starting 2015 so as to tackle foreign currency loss, energy insecurity, and climate change. Therefore, this study attempts to investigate the potential shifts in bioethanol production and use to meet Ethiopia’s target through a supply chain dynamics approach that allows identifying any existing link(s) that could be acted on. For this purpose, bioethanol development in the country is modeled using Microsoft Excel with the main objective of understanding the nature of ethanol shift in production and use together with the associated shifts in primary resources, feedstock, and other associated products of the industry. The analysis includes the study of agricultural resources, techno-economic conditions, and socio-economic conditions as well as investigation of economic, environmental, and social implications using the current low blend (LB) and targets of medium blend (MB) and high blend (HB) scenarios.
As a result of the potential studies, the identified potential land for sugarcane plantation is 700, 000 ha and is estimated at an annual ethanol production potential of around one billion litres from molasses. The existing and new sugar factories are expected to reach their full production capacity in 2020 and are estimated at annual ethanol production potential of about 390 million litres which is planned to be used in different market segments in order to minimize the consumption of petroleum products and the associated socio-economic, technical and environmental impacts. Regarding transport energy substitution, without significant production of ethanol from the existing sugar factories3.3% of the SI engine energy demand can be displaced currently at a competitive price. In 2030 the ethanol production is projected to contribute about 14.6 PJ of energy, two fold of the SI engine energy demand at the same year. Thus, ethanol has the potential to displace 100% of the SI engine energy demand by 2030 but it will require a combined development of other infrastructure in the transport sector. For this reason, the socio-economic, technical, and environmental assessment of ethanol in the SI engine transport sub-sector is conducted according to the government targets considering only 10% to 25% share shifts of the volumetric substitution. To this end, the annual ethanol consumption in SI engine transport sub-sector has the potential to save USD 19.2 to USD 63.2 million of the import bill in 2030 along with other socio-economic, technical, and environmental benefits and risks that require the combined development of transport infrastructure, other market segments, and large scale international trade in ethanol fuel. However, further work is needed on food insecurity impacts, local energy balance, local net GHG emissions, and local urban air quality assessments occurring mainly during the life cycle of bioethanol production and use. Keywords: Bioenergy, Ethanol, Transport Fuel Substitution, Shift, Scenario, Ethiopia

-iv-
Acknowledgment
In the first place, I would like to prize almighty GOD for being healthy from the very early stage of this research as well as giving me astonishing experiences throughout the work of my course.
Next, I want to give my sincere gratitude to Francis X. Johnson and Dilip Khatiwada, for their support, supervision, advice, and guidance, which made them a backbone of this research and so to this thesis. Their involvement with their originality has triggered and nourished my intellectual maturity that I will benefit from, for a long time to come. They inspire and enrich my ideas, as a student and a researcher. I am indebted to them more than I can say. Francis and Dilip, I am grateful in every possible way and hope to keep up our collaboration in the future.
I would like also to record my gratitude to SEI for the support and crucial contribution and its staff for their willingness to share their bright thoughts with me that was very fruitful for shaping up my ideas and research. To Johan, thank you for your technical assistance.
I gratefully acknowledge all parties involved in the questioner survey for their patience and time responding my questions. Their kind and strong messages have made me think critically and be able to understand the concept of bioethanol in Ethiopia starting from the beginning through to this stage.
Above all, I convey a special acknowledgement to KIC Innoenergy and RenE program for their generous support in giving me a full grant during my stay.
My parents deserve special mention for their inseparable support and prayers. My father Gebreyohannes and mother Letay, who sincerely raised me with their caring and gently love. Brothers and sisters: Tesfay, Mehari, Yorda, Nazu and Oni thanks for being supportive and caring siblings. My friends: Nebi, kal, and Aze thanks for your priceless support and encouragement.
Finally, I would like to thank everybody who was important to the successful realization of my thesis, as well as expressing my apology that I could not mention personally one by one. However, it is a great pleasure to convey my gratitude to them all in my humble acknowledgment.
-v-
Table of Contents
Abstract ........................................................................................................................................................................... iii
Acknowledgment ............................................................................................................................................................... iv
List of Figures ................................................................................................................................................................. vii
List of Tables ................................................................................................................................................................. viii
Notations ........................................................................................................................................................................ viii
List of Conversion Units ................................................................................................................................................... xi
Definitions of Sugar/Ethanol Terminologies ....................................................................................................................xii
1 Introduction .............................................................................................................................................................. 1
1.1 Profile of the Study Area ........................................................................................................................... 1
1.2 The State of Transport in Ethiopia .......................................................................................................... 2
1.3 The State of Bioethanol in Ethiopia ........................................................................................................ 3
1.4 Ethanol Production and Use: Opportunities and Challenges ............................................................. 3
1.5 Problem Statement and Justification ....................................................................................................... 4
1.6 Research Motivation ................................................................................................................................... 5
1.7 Research Questions .................................................................................................................................... 5
1.8 Significance of the Thesis .......................................................................................................................... 6
2 Biofuel/Bioethanol Production and Use: A Review ................................................................................................... 7
2.1 Global Biofuel/Bioethanol Issues ............................................................................................................ 7
2.1.1 Why Bioethanol Use as Transport Fuel?........................................................................................ 9
2.1.2 Bioethanol and Engine Compatibility ..........................................................................................11
2.1.3 Feedstock and Biothanol Production ...........................................................................................11
2.1.4 Current Status and Future Projections of Bioethanol Production...........................................16
2.1.5 Bioethanol Development Implications: Benefits and Concerns ..............................................16
2.1.6 Main Barriers of Bioethanol Development .................................................................................18
2.1.7 Policies to Promote Bioethanol Development ...........................................................................19
2.2 Bioethanol Production and Use Conditions in Ethiopia .................................................................... 21
2.2.1 Brief History and Current Status ...................................................................................................21
2.2.2 Development Activities and Capacity Building ..........................................................................22
2.2.3 Sugar Factories Production Plan ...................................................................................................22
2.2.4 Main Uses of Bioethanol ................................................................................................................24
2.2.5 Policy and Strategies to Promote Bioethanol Program .............................................................25
2.2.6 Bioethanol Production and Use Stakeholders .............................................................................26
3 Analytical Framework ............................................................................................................................................ 32
3.1 Objectives ................................................................................................................................................... 32
3.2 Methodology .............................................................................................................................................. 32
3.2.1 The Methods of Data Collection and Data Sources ..................................................................32
-vi-
3.2.2 The Method of Analysis..................................................................................................................34
3.2.3 Results and Discussion....................................................................................................................35
3.3 Scope and Limitations .............................................................................................................................. 35
4 Modeling and Analysis of Long-term Shifts ............................................................................................................ 37
4.1 Agricultural Conditions and Potential ................................................................................................... 37
4.1.1 Feedstock ..........................................................................................................................................37
4.1.2 Cultivation Area ...............................................................................................................................38
4.1.3 Water Use ..........................................................................................................................................38
4.1.4 Agrochemical Use ............................................................................................................................39
4.1.5 Human Resource..............................................................................................................................39
4.2 Industrial Conditions and Potential ....................................................................................................... 39
4.2.1 Sugar Production..............................................................................................................................40
4.2.2 Ethanol Production .........................................................................................................................41
4.3 Marketing Conditions and Potential ...................................................................................................... 46
4.3.1 Blending and Distribution ..............................................................................................................46
4.3.2 SI-Engine Fuel Demand .................................................................................................................48
4.4 Scenario Development ............................................................................................................................. 50
4.4.1 Drivers ...............................................................................................................................................50
4.4.2 Input Data .........................................................................................................................................50
4.4.3 Ethanol and Gasoline Properties ..................................................................................................50
4.4.4 Supply Projections ...........................................................................................................................51
4.4.5 Demand Projections ........................................................................................................................53
4.5 Socio-economic and Environmental Analysis ...................................................................................... 54
4.5.1 Benefits and Risks ............................................................................................................................54
4.5.2 Difficulties .........................................................................................................................................70
5 Key Findings, Conclusions, Recommendations, and Future works ............................................................................ 74
5.1 Key Findings .............................................................................................................................................. 74
5.1.1 Current status and Future potential ..............................................................................................74
5.1.2 Benefits and Concerns ....................................................................................................................74
5.2 Conclusions ................................................................................................................................................ 75
5.3 Recommendations .................................................................................................................................... 76
5.4 Future Work............................................................................................................................................... 77
Bibliography ..................................................................................................................................................................... 78
Appendixes...................................................................................................................................................................... 83
-vii-
List of Figures
Figure 1.1: Ethiopia’s Location ......................................................................................................................................... 1 Figure 2.1: Global Ethanol Production by Country/Region and Year................................................................................ 8 Figure 2.2: Energy and GHG emission impacts...............................................................................................................10 Figure 2.3: Bioethanol Production Feedstocks ...................................................................................................................12 Figure 2.4: Typical Ethanol Conversion Routes ...............................................................................................................14 Figure 2.5: First generation feedstocks bioethanol yield per hectare.....................................................................................15 Figure 2.6: First generation feedstocks bioethanol yield per tonne .......................................................................................15 Figure 2.7: First generation feedstocks cost per liter of bioethanol ......................................................................................15 Figure 2.8: World Fuel Ethanol Production Trend ..........................................................................................................16 Figure 2.9: Sugar factories mapping .................................................................................................................................22 Figure 2.10: Percentage Distribution of Major Crops Area in Ethiopia ...........................................................................27 Figure 2.11: Percentage Distribution of Major Crops Production in Ethiopia ...................................................................28 Figure 3.1: Analysis Model .........................................................................................................................................34 Figure 3.2: Thesis Boundary ......................................................................................................................................36 Figure 4.1: Process flow of Sugar Production at Metehara Sugar Factory ..........................................................................40 Figure 4.2: Share of Ethanol Production by two Production Plants in Ethiopia ................................................................42 Figure 4.3: Bioethanol Production Process in Metehara Sugar Factory ..............................................................................43 Figure 4.4: Sugarcane Plantation Land Use by Sugar Factories in Ethiopia (2012-2015) ..............................................45 Figure 4.5: Annual Sugar Production in Ethiopia (2012-2020) .....................................................................................46 Figure 4.6: Annual Ethanol Production in Ethiopia (2012-2020) .................................................................................46 Figure 4.7: Gasoline-Ethanol Blending Share by three Blending Plants in Ethiopia .........................................................47 Figure 4.8: Schematic Diagram of in-line blending in AKAK Terminal...........................................................................47 Figure 4.9: Historical Ethanol and Gasoline Consumption Trend in Ethiopia and Addis Ababa (AA) ........................48 Figure 4.10: Total Ethanol Production in Ethiopia (2006-2030) ...................................................................................51 Figure 4.11: SI-Engine Energy Demand in Ethiopia (2000-2030) ................................................................................52 Figure 4.12: Pre-tax Gasoline Price in Ethiopia (2000-2030) ........................................................................................52 Figure 4.13: Ethanol Blend Scenarios for Ethiopia (2008-2030) ....................................................................................54 Figure 4.14: Total Molasses Production in Ethiopia (2011-2030) ..................................................................................56 Figure 4.15: Ethanol and Gasoline Market Price in Ethiopia (2008-2013) ...................................................................57 Figure 4.16: Ethanol Ex-Factory Price in Ethiopia (2008-2013) ..................................................................................58 Figure 4.17: Foreign Currency Saving Potential under Different Scenarios in Ethiopia (2008-2030) ...............................59 Figure 4.18: High Shift Ethanol Demand Scenario for Cooking in Ethiopia (2013-2030) .............................................60 Figure 4.19: CO2 Emission Reduction Potential of Different Scenarios (2008-2030) ......................................................61 Figure 4.20: Ethanol Production Water Use by Sugar Factories in Ethiopia (2011-2030) .............................................62 Figure 4.21: Ethanol Production Land Use by Sugar Factories in Ethiopia (2011-2030) ..............................................63 Figure 4.22: Main Life Cycle Stages of Bioethanol Production in Ethiopia ......................................................................64 Figure 4.23: Agricultural Land Efficiency of Bioethanol in Replacing Fossil Energy for Transport ..................................65 Figure 4.24: Avoided GHG Emissions for Different Bioethanol Feedstocks and Countries..............................................66 Figure 4.25: Electricity Generation from Sugar Factories Co-generation Plants in Ethiopia (2012-2020) .......................69
-viii-
List of Tables
Table 1.1: Main Country Profile ....................................................................................................................................... 2 Table 2.1: Properties of gasoline fuel blended with various percentages of ethanol (Average Values) ...................................10 Table 2.2: Bioethanol Production Techniques ...................................................................................................................13 Table 2.3: Sugarcane Ethanol Energy Balance in Brazil .................................................................................................17 Table 2.4: Other Feedstock Ethanol Energy Balances ......................................................................................................18 Table 2.5: Polices to Promote Bioethanol Development .....................................................................................................20 Table 2.6: Summary of Sugar Factories Production Plan in Ethiopia .............................................................................24 Table 4.1: Sugar Factories Location and Climate in Ethiopia .........................................................................................37 Table 4.2: Annual Cane Production by Sugar Factories in Ethiopia................................................................................38 Table 4.3: Cane Cultivation Area Use by Sugar Factories in Ethiopia ............................................................................38 Table 4.4: Water Sources of Sugar Factories in Ethiopia .................................................................................................39 Table 4.5: Annual Sugar Production by Sugar Factories in Ethiopia ...............................................................................41 Table 4.6: Annual Ethanol Production by Sugar Factories in Ethiopia ...........................................................................44 Table 4.7: Ethanol Production Conversion Ratios by Sugar Factories in Ethiopia ...........................................................45 Table 4.8: Input Data for Scenario Development and Analysis ........................................................................................50 Table 4.9: Fuel Gasoline and Ethanol Properties.............................................................................................................51 Table 4.10: Ethanol Blends Equivalent Volume and Market Price Saved in Ethiopia ...................................................58 Table 4.11: Possible CO2 Reduction and ERC gain up to 2030 .....................................................................................61 Table 4.12: Bioenergy Yield to Fossil Input Ratios for Different Bioethanol Feedstocks and Countries .............................65 Table 4.13: Emission Factors for Different Blends of Bioethanol Relative to Base Gasoline ..............................................67 Table 5.1: Summary of Fuel Ethanol Benefits and Concerns ............................................................................................75 Table 5.2: Recommended Policies and Regulations ............................................................................................................77 Table A.1: List of Licensed Sugar and Ethanol Investment Projects (1996-2013) ...........................................83
-viii-
Notations
AA
ADLI
AQEG
Addis Ababa
Agricultural Development Led Industrialization
Air Quality Expert Group
BAU
CER
Business as Usual
Certified Emission Reduction
CRGE Climate Resilient Green Economy
CSA Central Statistics Authority
DSD Dutch Sustainable Development Group
EEA
EEPCo
EEPI
EIA
Ethiopian Electricity Agency
Ethiopian Economics Association
Ethiopian Electric and Power Corporation
Ethiopian Economic Policy Research Institute
Ethiopian Investment Agency
Energy Information Administration
Environmental Impact Assessment
EPAE
EPSE
ERA
Environmental Protection Authority of Ethiopia
Ethiopian Petroleum Supply Enterprise
Ethiopian Road Authority
EU European Union
ETB
FDRE
Ethiopian Birr
Federal Democratic Republic of Ethiopia
FFV Flexible Fuel Vehicles
GDP Gross Domestic Product
GHG
GFEI
GTZ
Green House Gas
Global Fuel Economy Initiative
German Agency for Technical Cooperation
ha Hectare
HB High Blend
IAE
ICRISAT
Instituto de Aeronáutica e Espaço
International CropsResearch Institute for the Semi-Arid Tropics
IEA
IIED
IUCN
International Energy Agency
International Institute for Environment and Development
International Union for Conversion of Nature
Lit
LHV
LSU
Liter
Lower Heating Value
Louisiana State University
MB Medium Blend
-9-
MJ Mega Joule
MSW Municipal Solid Waste
MME Ministry of Mines and Energy
MoA
MoFED
MoT
Ministry of Agriculture
Ministry of Finance an Economic Development
Ministry of Trade
MoWE
MW
Ministry of Transport
Ministry of Water and Energy
Mega Watt
NGO
PPM
RFA
Non Governmental Organization
Parts per Million
Renewable Fuel Association
RTA
SEI
SI
Road Transport Authority
Stockholm Environment Institute
Spark Ignition
TCD Tonnes Crushed per Day
UN
UNCTAD
UNEP
UNICAMP
United Nations
United Nations Conference on Trade and Development
United Nations Environmental Program
Universidade Estadual de Campinas
US United States
USD
USDA
WIC
United States Dollar
U.S. Department of Agriculture
Walta Information Center
WWI
VAT
YBP
World Watch Institute
Value Added Tax
Yetebaberut Behrawi Petroleum
-xi-
List of Conversion Units
1 TJ
1 MW
1 GWh
1 GWh
1 GWh
1 PJ
1 US Gallon
1 Barrel
1 tonne
1 Metric ton
1 USD (2012)
1 Euro (2012)
10e12 J
10e-3 GW
3600GJ
3.6 TJ
0.0036 GJ
278 GWh
3.785 liters
31.5 Us Gallons
1000 kg
1000 kg
18.50 ETB
24.50 ETB
-xii-
Definitions of Sugar/Ethanol Terminologies
Bagasse: The residue of cane after crushing in one mill or a train of mills. Its components are fiber, water, soluble and insoluble solids. In general, bagasse designates the residue from the last mill unless otherwise described.
Brix: The percentage by weight of the solids in a pure sucrose solution. The brix is equal to the dry substance for solutions of pure sucrose in water. But in the presence of soluble impurities this may deviate from the actual dry substance by the property of soluble impurities. However, by general acceptance the brix represents the apparent solids in a sugar solution as determined by dissymmetric or refractometeric method.
Bulk density: The mass of material per unit of total volume occupied.
Cane: The raw material as delivered at the factory weighbridge with all field trash.
Cane-Trash: Materials consisting of cane leaves, root, tops, dead sticks of cane and other vegetable matter from the field in which the cane was grown.
Cane to Sugar Ratio: Tons of cane required to produce 1 ton of sugar. It is the reciprocal of sugar yield (Tons of sugar per tons of cane).
Cane Preparation: is the knifing and shredding of cane to rupture the juice storage cells prior to juice extraction.
Extraction: The portion of a component of cane in percent, which is removed by the milling process. The familiar components are Juice, Brix, Pol and sucrose and the term extraction need accompanying specification of the reference.
Filter cake: The residue removed by filtration of the muddy juice in the process of clarification including any added filter aid.
Mash: The sugary liquid (cane juice/molasses raw material) in the suitable condition for the fermentation process.
Massecuite: The mixture of sugar crystals and mother liquor discharged from vacuum pan. They are classified according to their descending purity (A, B, C).
Molasses: The mother liquor separated from a massecuite. It is well-known by the same terms as the massecuite from which it was extracted (A molasses, B molasses, and final molasses).
Molasses-Final: The molasses from low grade boilings from which no more sugar is to be removed.
Pol: The concentration of all optically active substances in a sugar solution expressed as percentage by mass. Since there are a number of optically active substances in sugar solution, pol is only the apparent sucrose content of a sugar product determined by direct or single polarization. If the solution is a pure sucrose solution pol is equal to sucrose.
Sugar: The sucrose crystals, including adhering mother liquor, remain after centrifuging.
Syrup: The concentrated clarified juice from the evaporator before crystallization has removed any sugar.
Yeast: The micro organism that transforms sugar into alcohol by fermentation.
-1-
1 Introduction
With the continuously increasing energy demand of the transport sector in Ethiopia, the track for cleaner, cheaper, and more sustainable energy resources has been a fundamental issue in the past few years. Following that, the nation have managed to plan biofuels development to reduce the dependence on conventional fuels which is found to be unaffordable due to the economic position and nation’s enormous clean energy potentials. Thus, this chapter briefly presents the opportunities and challenges behind the transport sector energy system in Ethiopia and hence the chapter describes the research motivation and questions as well as the significance and expected outcomes of the thesis.
1.1 Profile of the Study Area
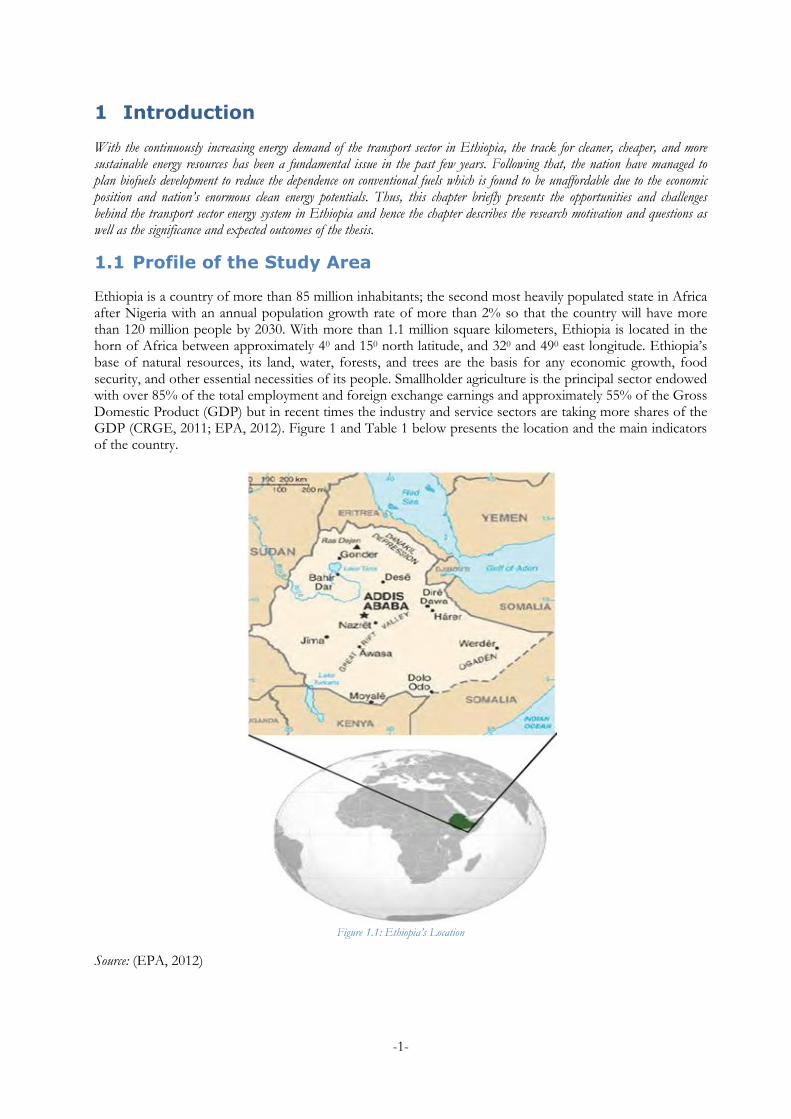
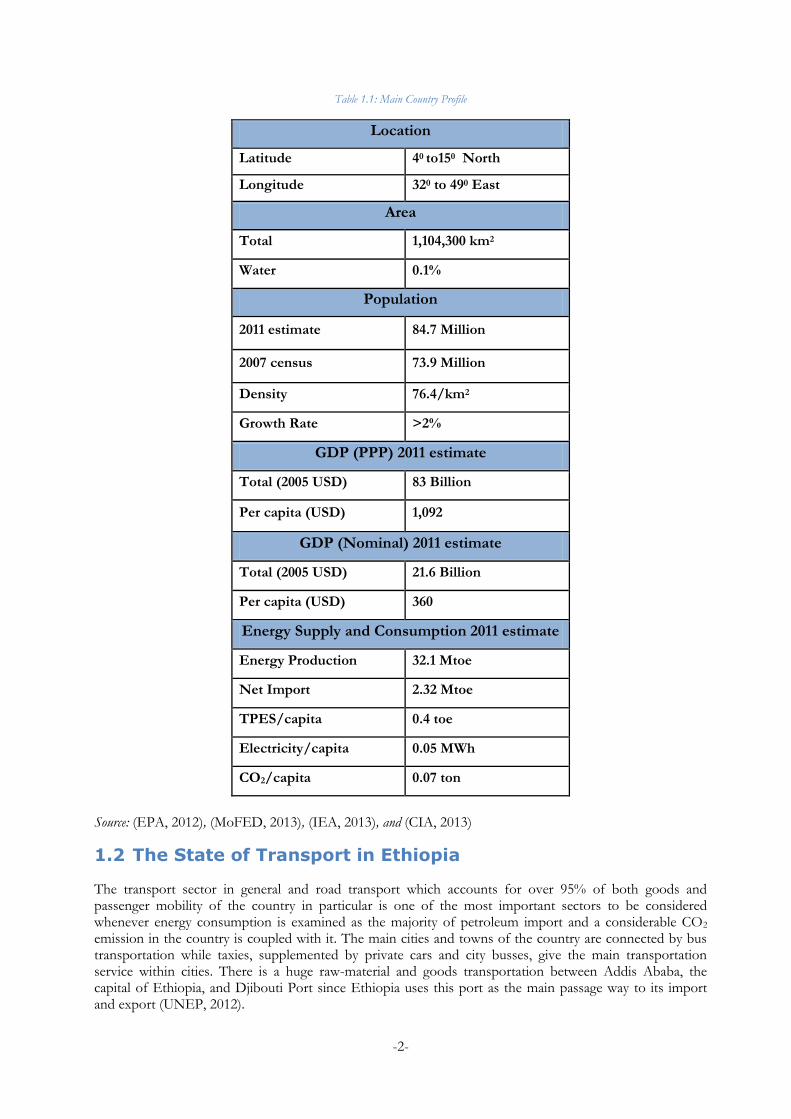
Ethiopia is a country of more than 85 million inhabitants; the second most heavily populated state in Africa after Nigeria with an annual population growth rate of more than 2% so that the country will have more than 120 million people by 2030. With more than 1.1 million square kilometers, Ethiopia is located in the horn of Africa between approximately 40 and 150 north latitude, and 320 and 490 east longitude. Ethiopia’s base of natural resources, its land, water, forests, and trees are the basis for any economic growth, food security, and other essential necessities of its people. Smallholder agriculture is the principal sector endowed with over 85% of the total employment and foreign exchange earnings and approximately 55% of the Gross Domestic Product (GDP) but in recent times the industry and service sectors are taking more shares of the GDP (CRGE, 2011; EPA, 2012). Figure 1 and Table 1 below presents the location and the main indicators of the country.
Figure 1.1: Ethiopia’s Location
Source: (EPA, 2012)
-2-
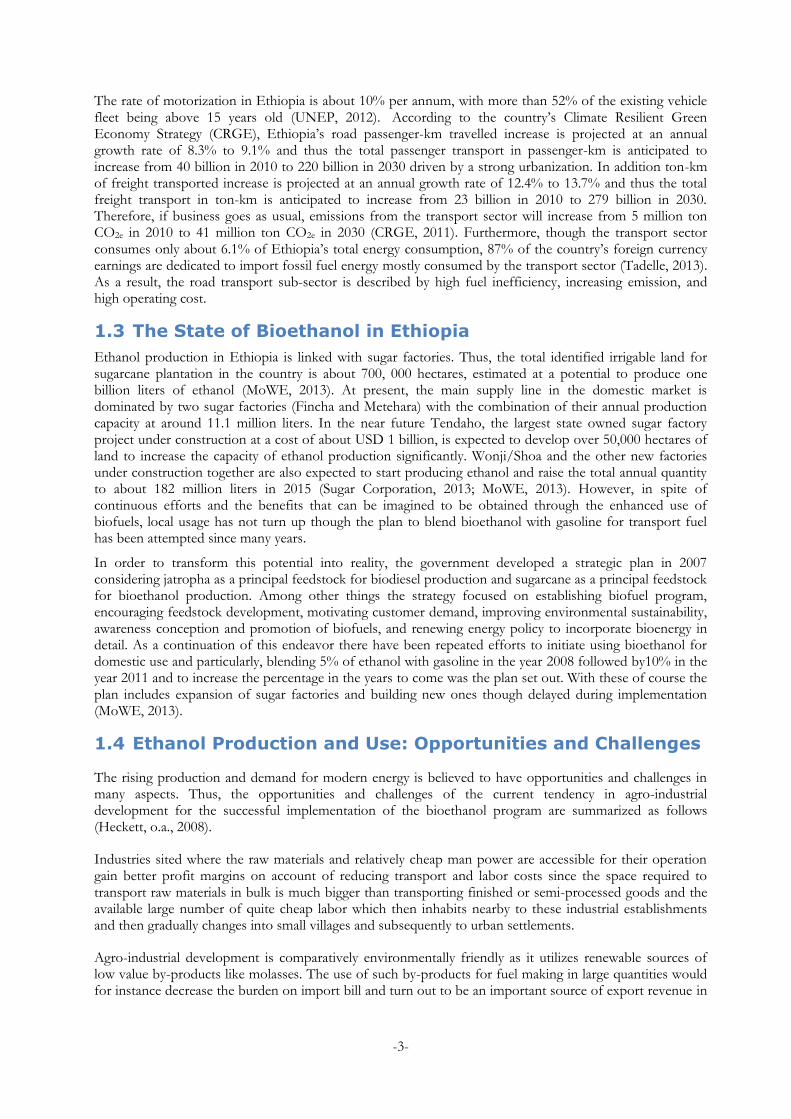
Table 1.1: Main Country Profile
Location
Latitude 40 to150 North
Longitude 320 to 490 East
Area
Total 1,104,300 km2
Water 0.1%
Population
2011 estimate 84.7 Million
2007 census 73.9 Million
Density 76.4/km2
Growth Rate >2%
GDP (PPP) 2011 estimate
Total (2005 USD) 83 Billion
Per capita (USD) 1,092
GDP (Nominal) 2011 estimate
Total (2005 USD) 21.6 Billion
Per capita (USD) 360
Energy Supply and Consumption 2011 estimate
Energy Production 32.1 Mtoe
Net Import 2.32 Mtoe
TPES/capita 0.4 toe
Electricity/capita 0.05 MWh
CO2/capita 0.07 ton
Source: (EPA, 2012), (MoFED, 2013), (IEA, 2013), and (CIA, 2013)
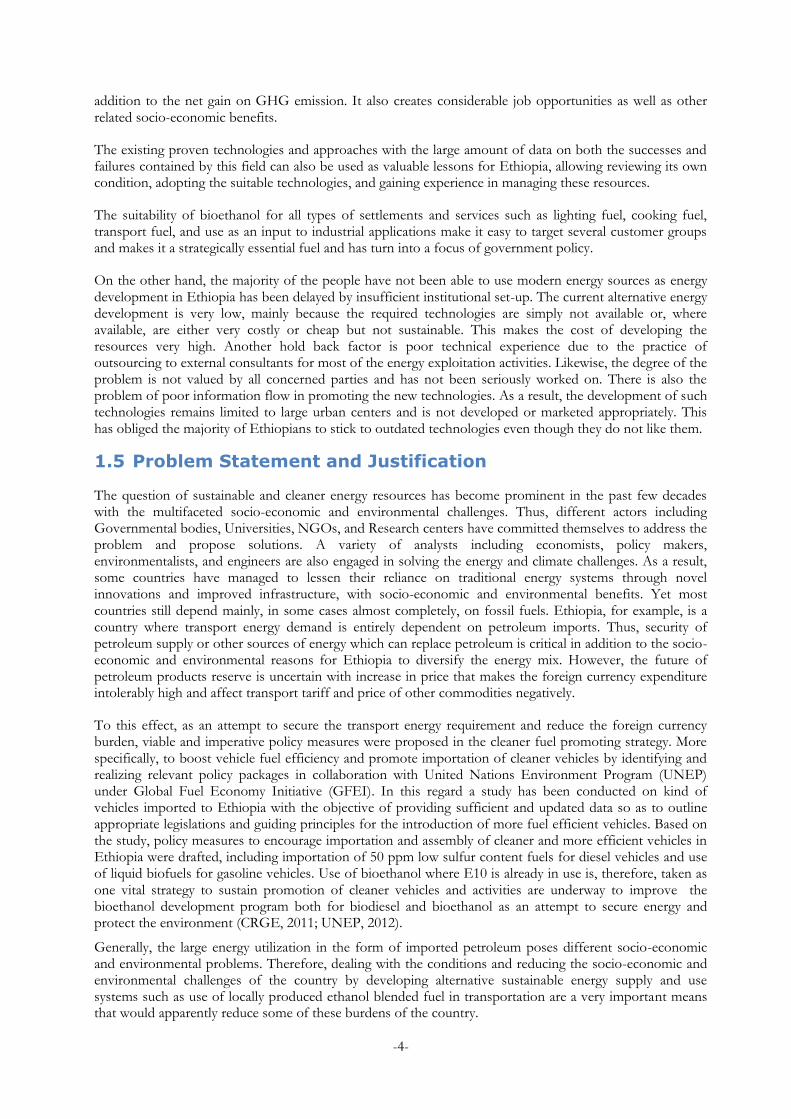
1.2 The State of Transport in Ethiopia
The transport sector in general and road transport which accounts for over 95% of both goods and passenger mobility of the country in particular is one of the most important sectors to be considered whenever energy consumption is examined as the majority of petroleum import and a considerable CO2 emission in the country is coupled with it. The main cities and towns of the country are connected by bus transportation while taxies, supplemented by private cars and city busses, give the main transportation service within cities. There is a huge raw-material and goods transportation between Addis Ababa, the capital of Ethiopia, and Djibouti Port since Ethiopia uses this port as the main passage way to its import and export (UNEP, 2012).
-3-
The rate of motorization in Ethiopia is about 10% per annum, with more than 52% of the existing vehicle fleet being above 15 years old (UNEP, 2012). According to the country’s Climate Resilient Green Economy Strategy (CRGE), Ethiopia’s road passenger-km travelled increase is projected at an annual growth rate of 8.3% to 9.1% and thus the total passenger transport in passenger-km is anticipated to increase from 40 billion in 2010 to 220 billion in 2030 driven by a strong urbanization. In addition ton-km of freight transported increase is projected at an annual growth rate of 12.4% to 13.7% and thus the total freight transport in ton-km is anticipated to increase from 23 billion in 2010 to 279 billion in 2030. Therefore, if business goes as usual, emissions from the transport sector will increase from 5 million ton CO2e in 2010 to 41 million ton CO2e in 2030 (CRGE, 2011). Furthermore, though the transport sector consumes only about 6.1% of Ethiopia’s total energy consumption, 87% of the country’s foreign currency earnings are dedicated to import fossil fuel energy mostly consumed by the transport sector (Tadelle, 2013). As a result, the road transport sub-sector is described by high fuel inefficiency, increasing emission, and high operating cost.
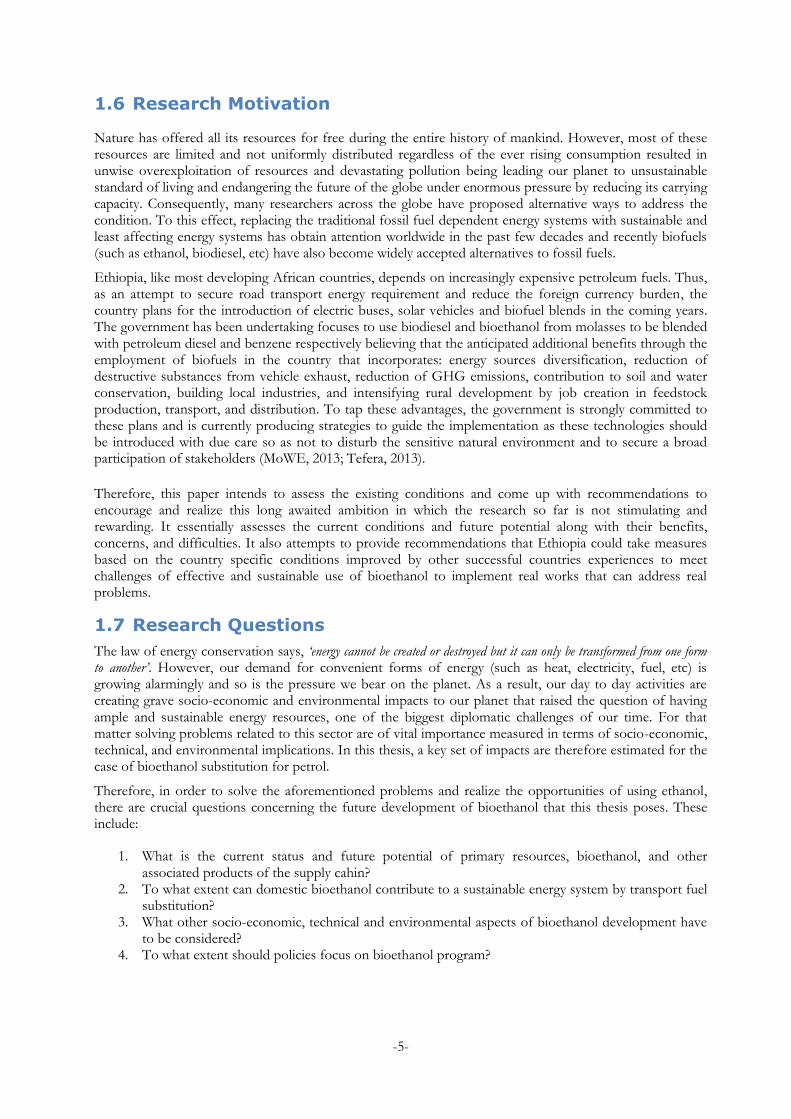
1.3 The State of Bioethanol in Ethiopia
Ethanol production in Ethiopia is linked with sugar factories. Thus, the total identified irrigable land for sugarcane plantation in the country is about 700, 000 hectares, estimated at a potential to produce one billion liters of ethanol (MoWE, 2013). At present, the main supply line in the domestic market is dominated by two sugar factories (Fincha and Metehara) with the combination of their annual production capacity at around 11.1 million liters. In the near future Tendaho, the largest state owned sugar factory project under construction at a cost of about USD 1 billion, is expected to develop over 50,000 hectares of land to increase the capacity of ethanol production significantly. Wonji/Shoa and the other new factories under construction together are also expected to start producing ethanol and raise the total annual quantity to about 182 million liters in 2015 (Sugar Corporation, 2013; MoWE, 2013). However, in spite of continuous efforts and the benefits that can be imagined to be obtained through the enhanced use of biofuels, local usage has not turn up though the plan to blend bioethanol with gasoline for transport fuel has been attempted since many years.
In order to transform this potential into reality, the government developed a strategic plan in 2007 considering jatropha as a principal feedstock for biodiesel production and sugarcane as a principal feedstock for bioethanol production. Among other things the strategy focused on establishing biofuel program, encouraging feedstock development, motivating customer demand, improving environmental sustainability, awareness conception and promotion of biofuels, and renewing energy policy to incorporate bioenergy in detail. As a continuation of this endeavor there have been repeated efforts to initiate using bioethanol for domestic use and particularly, blending 5% of ethanol with gasoline in the year 2008 followed by10% in the year 2011 and to increase the percentage in the years to come was the plan set out. With these of course the plan includes expansion of sugar factories and building new ones though delayed during implementation (MoWE, 2013).
1.4 Ethanol Production and Use: Opportunities and Challenges
The rising production and demand for modern energy is believed to have opportunities and challenges in many aspects. Thus, the opportunities and challenges of the current tendency in agro-industrial development for the successful implementation of the bioethanol program are summarized as follows (Heckett, o.a., 2008).
Industries sited where the raw materials and relatively cheap man power are accessible for their operation gain better profit margins on account of reducing transport and labor costs since the space required to transport raw materials in bulk is much bigger than transporting finished or semi-processed goods and the available large number of quite cheap labor which then inhabits nearby to these industrial establishments and then gradually changes into small villages and subsequently to urban settlements.
Agro-industrial development is comparatively environmentally friendly as it utilizes renewable sources of low value by-products like molasses. The use of such by-products for fuel making in large quantities would for instance decrease the burden on import bill and turn out to be an important source of export revenue in
-4-
addition to the net gain on GHG emission. It also creates considerable job opportunities as well as other related socio-economic benefits.
The existing proven technologies and approaches with the large amount of data on both the successes and failures contained by this field can also be used as valuable lessons for Ethiopia, allowing reviewing its own condition, adopting the suitable technologies, and gaining experience in managing these resources.
The suitability of bioethanol for all types of settlements and services such as lighting fuel, cooking fuel, transport fuel, and use as an input to industrial applications make it easy to target several customer groups and makes it a strategically essential fuel and has turn into a focus of government policy.
On the other hand, the majority of the people have not been able to use modern energy sources as energy development in Ethiopia has been delayed by insufficient institutional set-up. The current alternative energy development is very low, mainly because the required technologies are simply not available or, where available, are either very costly or cheap but not sustainable. This makes the cost of developing the resources very high. Another hold back factor is poor technical experience due to the practice of outsourcing to external consultants for most of the energy exploitation activities. Likewise, the degree of the problem is not valued by all concerned parties and has not been seriously worked on. There is also the problem of poor information flow in promoting the new technologies. As a result, the development of such technologies remains limited to large urban centers and is not developed or marketed appropriately. This has obliged the majority of Ethiopians to stick to outdated technologies even though they do not like them.
1.5 Problem Statement and Justification
The question of sustainable and cleaner energy resources has become prominent in the past few decades with the multifaceted socio-economic and environmental challenges. Thus, different actors including Governmental bodies, Universities, NGOs, and Research centers have committed themselves to address the problem and propose solutions. A variety of analysts including economists, policy makers, environmentalists, and engineers are also engaged in solving the energy and climate challenges. As a result, some countries have managed to lessen their reliance on traditional energy systems through novel innovations and improved infrastructure, with socio-economic and environmental benefits. Yet most countries still depend mainly, in some cases almost completely, on fossil fuels. Ethiopia, for example, is a country where transport energy demand is entirely dependent on petroleum imports. Thus, security of petroleum supply or other sources of energy which can replace petroleum is critical in addition to the socio-economic and environmental reasons for Ethiopia to diversify the energy mix. However, the future of petroleum products reserve is uncertain with increase in price that makes the foreign currency expenditure intolerably high and affect transport tariff and price of other commodities negatively.
To this effect, as an attempt to secure the transport energy requirement and reduce the foreign currency burden, viable and imperative policy measures were proposed in the cleaner fuel promoting strategy. More specifically, to boost vehicle fuel efficiency and promote importation of cleaner vehicles by identifying and realizing relevant policy packages in collaboration with United Nations Environment Program (UNEP) under Global Fuel Economy Initiative (GFEI). In this regard a study has been conducted on kind of vehicles imported to Ethiopia with the objective of providing sufficient and updated data so as to outline appropriate legislations and guiding principles for the introduction of more fuel efficient vehicles. Based on the study, policy measures to encourage importation and assembly of cleaner and more efficient vehicles in Ethiopia were drafted, including importation of 50 ppm low sulfur content fuels for diesel vehicles and use of liquid biofuels for gasoline vehicles. Use of bioethanol where E10 is already in use is, therefore, taken as one vital strategy to sustain promotion of cleaner vehicles and activities are underway to improve the bioethanol development program both for biodiesel and bioethanol as an attempt to secure energy and protect the environment (CRGE, 2011; UNEP, 2012).
Generally, the large energy utilization in the form of imported petroleum poses different socio-economic and environmental problems. Therefore, dealing with the conditions and reducing the socio-economic and environmental challenges of the country by developing alternative sustainable energy supply and use systems such as use of locally produced ethanol blended fuel in transportation are a very important means that would apparently reduce some of these burdens of the country.
-5-
1.6 Research Motivation
Nature has offered all its resources for free during the entire history of mankind. However, most of these resources are limited and not uniformly distributed regardless of the ever rising consumption resulted in unwise overexploitation of resources and devastating pollution being leading our planet to unsustainable standard of living and endangering the future of the globe under enormous pressure by reducing its carrying capacity. Consequently, many researchers across the globe have proposed alternative ways to address the condition. To this effect, replacing the traditional fossil fuel dependent energy systems with sustainable and least affecting energy systems has obtain attention worldwide in the past few decades and recently biofuels (such as ethanol, biodiesel, etc) have also become widely accepted alternatives to fossil fuels.
Ethiopia, like most developing African countries, depends on increasingly expensive petroleum fuels. Thus, as an attempt to secure road transport energy requirement and reduce the foreign currency burden, the country plans for the introduction of electric buses, solar vehicles and biofuel blends in the coming years. The government has been undertaking focuses to use biodiesel and bioethanol from molasses to be blended with petroleum diesel and benzene respectively believing that the anticipated additional benefits through the employment of biofuels in the country that incorporates: energy sources diversification, reduction of destructive substances from vehicle exhaust, reduction of GHG emissions, contribution to soil and water conservation, building local industries, and intensifying rural development by job creation in feedstock production, transport, and distribution. To tap these advantages, the government is strongly committed to these plans and is currently producing strategies to guide the implementation as these technologies should be introduced with due care so as not to disturb the sensitive natural environment and to secure a broad participation of stakeholders (MoWE, 2013; Tefera, 2013).
Therefore, this paper intends to assess the existing conditions and come up with recommendations to encourage and realize this long awaited ambition in which the research so far is not stimulating and rewarding. It essentially assesses the current conditions and future potential along with their benefits, concerns, and difficulties. It also attempts to provide recommendations that Ethiopia could take measures based on the country specific conditions improved by other successful countries experiences to meet challenges of effective and sustainable use of bioethanol to implement real works that can address real problems.
1.7 Research Questions
The law of energy conservation says, ‘energy cannot be created or destroyed but it can only be transformed from one form to another’. However, our demand for convenient forms of energy (such as heat, electricity, fuel, etc) is growing alarmingly and so is the pressure we bear on the planet. As a result, our day to day activities are creating grave socio-economic and environmental impacts to our planet that raised the question of having ample and sustainable energy resources, one of the biggest diplomatic challenges of our time. For that matter solving problems related to this sector are of vital importance measured in terms of socio-economic, technical, and environmental implications. In this thesis, a key set of impacts are therefore estimated for the case of bioethanol substitution for petrol.
Therefore, in order to solve the aforementioned problems and realize the opportunities of using ethanol, there are crucial questions concerning the future development of bioethanol that this thesis poses. These include:
1. What is the current status and future potential of primary resources, bioethanol, and other associated products of the supply cahin?
2. To what extent can domestic bioethanol contribute to a sustainable energy system by transport fuel substitution?
3. What other socio-economic, technical and environmental aspects of bioethanol development have to be considered?
4. To what extent should policies focus on bioethanol program?
-6-
1.8 Significance of the Thesis
This thesis contributes to develop understanding on long-term bioethanol production and transport fuel substitution shifts in Ethiopia and thus providing a significant value to academic researchers, business society, industry actors, policy makers, and all interested groups.
Academic researchers: The thesis can serve as a platform to give basic information on the bioethanol development to create further research on areas of data deficiency. The indication of areas lacking enough data and potential areas for additional study would direct researchers to select priority areas and undertake further study.
Business society: The information included in the thesis offers important understanding about bioethanol in general and the status in Ethiopia in particular. Recognizing the status in Ethiopia could be important to businesses to have a fundamental data and the opportunities thereon. Additionally, the policy options presented in this thesis will provide them with necessary background information to open discussion with the government to commence motivating condition.
Supply chain actors: This thesis also attempts to indicate implications connected with the expanded bioethanol development and use as it is not well understood in the country. Knowing these issues would make possible for supply chain actors to consider them in their deed and when they set up new facilities thereby available data could be acquired, analyzed, and improvement achieved.
Policy makers: The thesis offers a series of available policy alternatives that could be considered to adopt in Ethiopian perspective in order to maintain the bioethanol development. The socio-economic and environmental benefits, risks, and difficulties highlighted in the thesis with the means to conquer them could also play important role for policy makers to make interventions for sustainable domestic bioethanol program.
-7-
2 Biofuel/Bioethanol Production and Use: A Review
Worldwide, the role of renewable and clean energy as a basic element of any socio-economic and environmental development is well established and thus some mention is warranted here of biofuels as an important index of a country’s techno-economic and environmental progress because of the ever increasing energy consumption in the wake of the dwindling fossil fuel reserves, rising costs of this fuel, and the negative impacts it creates on the environment. On the other hand, the socio-economic or environmental benefits of biofuels/bioethanol have been questioned, leading to less interest in these options. Therefore, this chapter consists of two parts will give information about potential benefits and influences of bifuels/bioethanol programs. The first part briefly presents the reviewed literatures on global biofuels/bioethanol issues focusing on the merits, risks, and key difficulties as well as their possible implications on socio-economic and environmental issues. The second part discusses Ethiopia’s recent and fast emerging biofuels/bioethanol development plans in order to develop the long-term ethanol production and fuel substitution shift scenarios of the country.
2.1 Global Biofuel/Bioethanol Issues
Biofuels, mainly produced from biomass, are a broad range of fuels in the form of solid biomass (bio-char), liquid fuels (bioethanol, biodiesel, and vegetable oil), and various biogases (biogas, bio-syngas, and bio-hydrogen) (Demirbas, 2009). Biofuels have paid attention globally due to concerns on climate change, energy security, and dependency on import encumber of petroleum products. They are increasingly premeditated by many countries as much as practicable to substitute the fossil fuel source in the transport sector. At present bioethanol and biodiesel are the main biofuels for transport as both can be used in blended or neat form although neat usage requires engine modification. Bioethanol, derived from starch crops like sugarcane, sugar beets, corn, wheat, and sorghum is utilized blended with petroleum based gasoline, and biodiesel, derived from oil crops like rapeseed, palm oil, jatropha, sunflower, and soy is utilized blended with petroleum based diesel (Dufey, 2006).
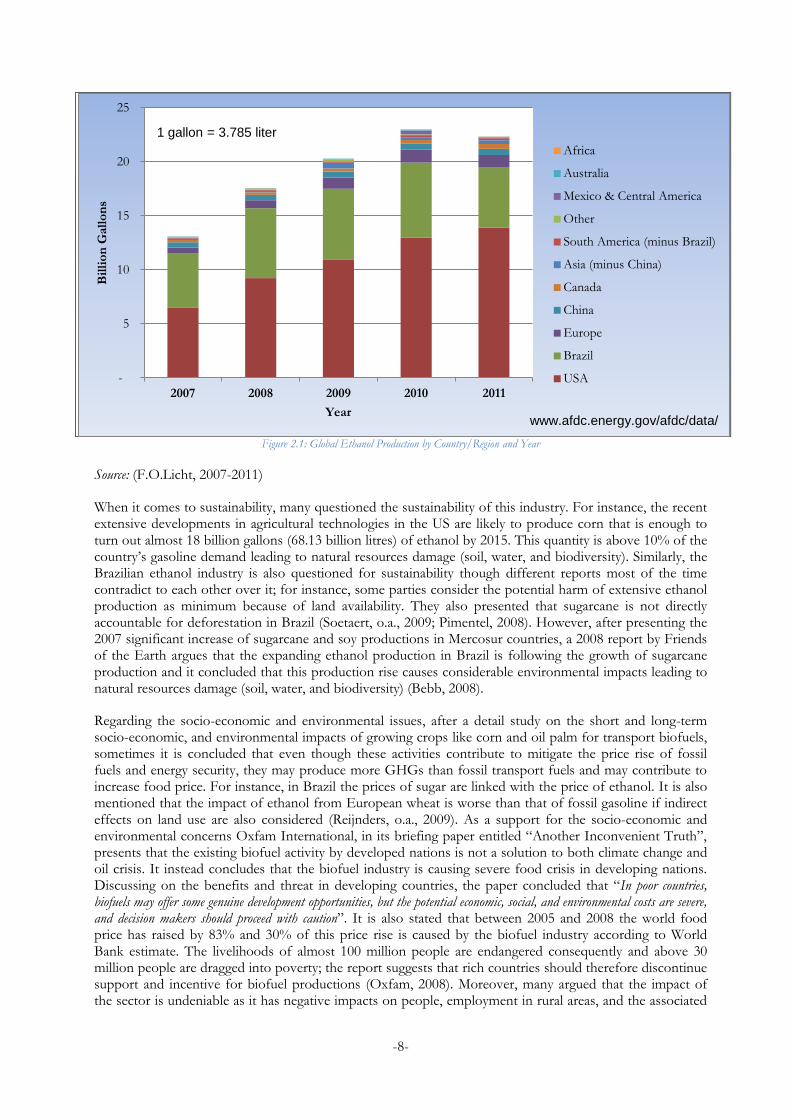
While bioethanol and biodiesel are the most typical biofuel types, the two top producers of ethanol in the world by far are the United States and Brazil, collectively producing almost 87% of the 21.8 billion gallons (82.5 billion litres) world ethanol production in 2011. United States was the major producer among the two representing 13.3 billion gallons (50.3 billion litres) of the world’s ethanol production in 2011 using corn as the main feedstock accounting for the vast majority of the input whereas Brazil the second major producer uses sugarcane for its 5.6 billion gallon (21.2 billion litres) ethanol production in 2011. Though, global ethanol production dropped to some extent in 2011 due to severe drought and economic distress, it has shown a considerable increase steadily through 2010 as shown in Figure 2.1 below (RFA, 2002 to 2012). As a result, it was reported that many sectors have suffered a decline following the expansion of ethanol production. In United States, for instance, soybean and cotton planting has turndown by 15% and 28% respectively. In the same way, it could be noted that this rapid increase in ethanol production from corn is affecting the wellbeing of households by affecting crop, animal, and food productions (Pimentel, 2008). Alternatively, others prise the success and argue in producing fuel and feed simultaneously. In 2011, for instance, 34.4 million metric ton of high quality livestock feed, a by-product of corn-based ethanol, is reported by RFA (RFA, 2002 to 2012). Likewise, Brazil, more than three decades of experience in the area and many appreciated its success has been considered as a role model in the sector since the industry uses sugarcane as an input for ethanol production (Soetaert, o.a., 2009).
-8-
Figure 2.1: Global Ethanol Production by Country/Region and Year
Source: (F.O.Licht, 2007-2011)
When it comes to sustainability, many questioned the sustainability of this industry. For instance, the recent extensive developments in agricultural technologies in the US are likely to produce corn that is enough to turn out almost 18 billion gallons (68.13 billion litres) of ethanol by 2015. This quantity is above 10% of the country’s gasoline demand leading to natural resources damage (soil, water, and biodiversity). Similarly, the Brazilian ethanol industry is also questioned for sustainability though different reports most of the time contradict to each other over it; for instance, some parties consider the potential harm of extensive ethanol production as minimum because of land availability. They also presented that sugarcane is not directly accountable for deforestation in Brazil (Soetaert, o.a., 2009; Pimentel, 2008). However, after presenting the 2007 significant increase of sugarcane and soy productions in Mercosur countries, a 2008 report by Friends of the Earth argues that the expanding ethanol production in Brazil is following the growth of sugarcane production and it concluded that this production rise causes considerable environmental impacts leading to natural resources damage (soil, water, and biodiversity) (Bebb, 2008).
Regarding the socio-economic and environmental issues, after a detail study on the short and long-term socio-economic, and environmental impacts of growing crops like corn and oil palm for transport biofuels, sometimes it is concluded that even though these activities contribute to mitigate the price rise of fossil fuels and energy security, they may produce more GHGs than fossil transport fuels and may contribute to increase food price. For instance, in Brazil the prices of sugar are linked with the price of ethanol. It is also mentioned that the impact of ethanol from European wheat is worse than that of fossil gasoline if indirect effects on land use are also considered (Reijnders, o.a., 2009). As a support for the socio-economic and environmental concerns Oxfam International, in its briefing paper entitled “Another Inconvenient Truth”, presents that the existing biofuel activity by developed nations is not a solution to both climate change and oil crisis. It instead concludes that the biofuel industry is causing severe food crisis in developing nations. Discussing on the benefits and threat in developing countries, the paper concluded that “In poor countries, biofuels may offer some genuine development opportunities, but the potential economic, social, and environmental costs are severe, and decision makers should proceed with caution”. It is also stated that between 2005 and 2008 the world food price has raised by 83% and 30% of this price rise is caused by the biofuel industry according to World Bank estimate. The livelihoods of almost 100 million people are endangered consequently and above 30 million people are dragged into poverty; the report suggests that rich countries should therefore discontinue support and incentive for biofuel productions (Oxfam, 2008). Moreover, many argued that the impact of the sector is undeniable as it has negative impacts on people, employment in rural areas, and the associated
-
5
10
15
20
25
2007 2008 2009 2010 2011
Bil
lio
n G
all
on
s
Year
Africa
Australia
Mexico & Central America
Other
South America (minus Brazil)
Asia (minus China)
Canada
China
Europe
Brazil
USA
www.afdc.energy.gov/afdc/data/
1 gallon = 3.785 liter
-9-
poor labour conditions that include social welfare, health impacts to workers, and the general public need that must be addressed during cultivation in order to fully understand the sustainability of the sector (Bebb, 2008; Ho, 2006). On the other hand, in a publication by the European Association for Bio industries entitled “Biofuels and Developing Countries”; its strong stand on the advantages of biofuel for developing nations is presented. The publication argues that “the development of biofuels will bring direct opportunities to developing countries through the production of local jobs from growing raw materials to their manufacture. Furthermore, the local production of biofuels in developing countries will help to decrease the dependency on costly fossil fuel imports” (EuropaBio, 2008). In addition the report pointed out that as a result of increase in biofuel production, the number of available jobs in rural areas would increase and thus, rural to urban migration would be limited.
With respect to energy balance, an energy analysis for different biofuel crops concluded that with today’s technology, biofuels do not qualify as renewable sources of energy. For instance, it claims that if ethanol is produced from corn and sugarcane only 9% and 30% respectively of the resources used are said to have renewability in conventional systems. Similarly, biofuel production from soybean is said to have only 25% of its resources as renewable. These findings also show small scale biofuel production using agro-ecological concepts give much more renewability of 70% (Ortega, o.a., nd).
At extended look, many claim that the impact of biofuel production goes beyond national borders. For instance, the rapidly expanding ethanol production from corn in the United States is observed affecting different parts of the world as it creates a large increase on food basket prices. This was argued as huge price increases would be noticeable more in Sub-Saharan African and South American countries where corn is mainly used for food consumptions. Thus, a 20% corn price raise in the United States would lead to food basket cost changes of over 10% for many African nations showing 12.3% food price increase in Ethiopia, 14.7% in Malawi, and15.1% in Lesotho among others (Elobeid, o.a., 2007).
Generally, as discussed above the findings and conclusions of the reviewed literatures directly contradict with each other. Some parties underlined the importance of biofuel while others underlined on the negative impact of the industry especially in connection with food security and poverty reduction. However, recent tendency in the energy sector has confirmed a remarkable move towards biofuels though the subject has been quite controversial. Consequently, many countries have managed to decrease their dependency on oil considerably but the questions of whether investing on biofuels or not are a far more multifaceted issue than one anticipates. Their sustainability is not clear as their intermediate and long term development as well as pros and cons are highly depend on various factors such as future transportation trend, automobile industry developments, battery technologies, global food production patterns, etc. Therefore, it is extremely difficult, if not impossible, to identify one strategy that meets both the current and future interests of a nation, let alone having the same strategy for different nations as it is mostly the case today. Thus, since the focus of the thesis is on long-term bioethanol production and transport fuel substitution shift the following sections will present background information exclusively on bioethanol as transport fuel keeping the above mentioned issues in mind.
2.1.1 Why Bioethanol Use as Transport Fuel?
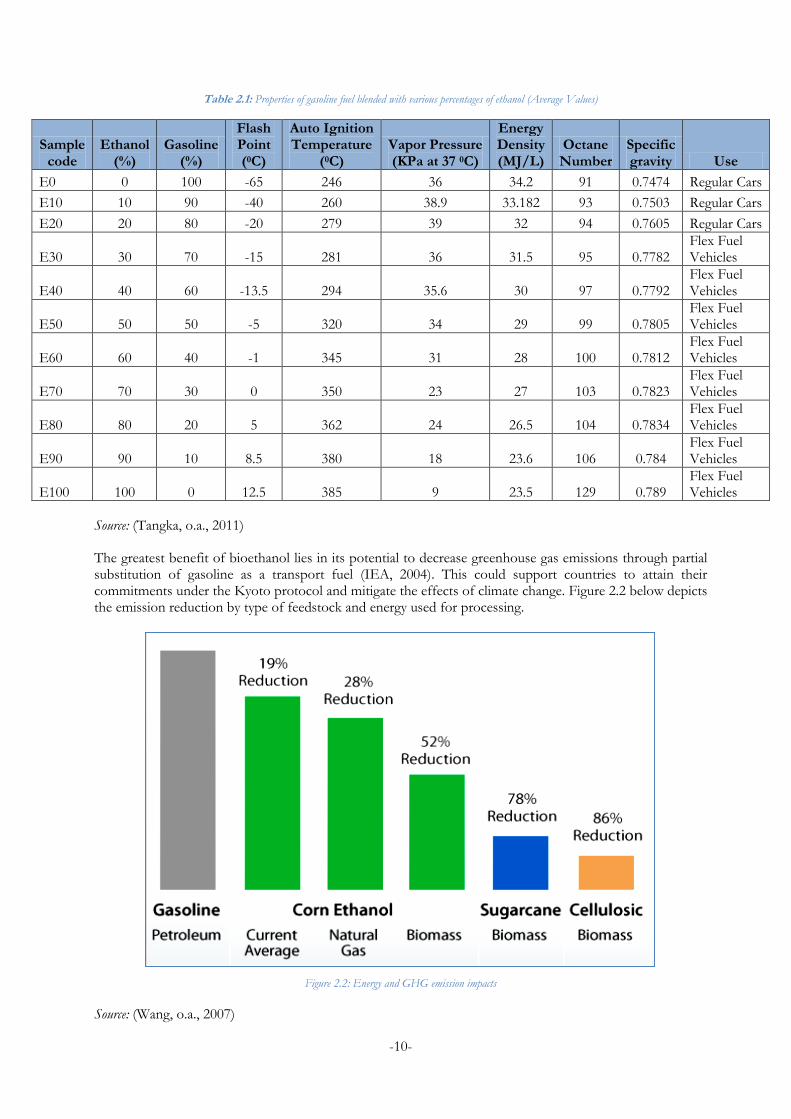
Bioethanol is a liquid produced by distillation of fermented sugar obtained from various locally available resources such as agriculture and forestry residue, dedicated starchy crops, woody and herbaceous crops, and organic portion of municipal solid waste (MSW). It has become favoured due to its potential similarity on the convenient characteristics of petroleum products at competitive price (Wyman, 1996; Rutz, o.a., 2007). It also provides a number of benefits including higher engine efficiency, achieved from the high octane number and high heat of vaporization of ethanol, and lower ozone and smog formation in its use as compared to the conventional gasoline because of its low volatility and photochemical reactivity (Dufey, 2006). Other than using the existing petroleum infrastructure, its blended use with gasoline in any proportion up to 10 percent, in some cases represented as E5 for 5% bioethanol blend (5% bioethanol and 95% gasoline) and E10 for 10% bioethanol blend, reduces fossil fuel consumption and supply oxygen to advance further complete combustion. This reduces exhaust emission of carbon monoxide and unburned hydrocarbon without the need for engine modification (Wyman, 1996; Dufey, 2006). The properties of gasoline blended with various percentages of ethanol are presented in the Table below.
-10-
Table 2.1: Properties of gasoline fuel blended with various percentages of ethanol (Average Values)
Sample code
Ethanol (%)
Gasoline (%)
Flash Point (0C)
Auto Ignition Temperature
(0C) Vapor Pressure (KPa at 37 0C)
Energy Density (MJ/L)
Octane Number
Specific gravity Use
E0 0 100 -65 246 36 34.2 91 0.7474 Regular Cars
E10 10 90 -40 260 38.9 33.182 93 0.7503 Regular Cars
E20 20 80 -20 279 39 32 94 0.7605 Regular Cars
E30 30 70 -15 281 36 31.5 95 0.7782 Flex Fuel Vehicles
E40 40 60 -13.5 294 35.6 30 97 0.7792 Flex Fuel Vehicles
E50 50 50 -5 320 34 29 99 0.7805 Flex Fuel Vehicles
E60 60 40 -1 345 31 28 100 0.7812 Flex Fuel Vehicles
E70 70 30 0 350 23 27 103 0.7823 Flex Fuel Vehicles
E80 80 20 5 362 24 26.5 104 0.7834 Flex Fuel Vehicles
E90 90 10 8.5 380 18 23.6 106 0.784 Flex Fuel Vehicles
E100 100 0 12.5 385 9 23.5 129 0.789 Flex Fuel Vehicles
Source: (Tangka, o.a., 2011)
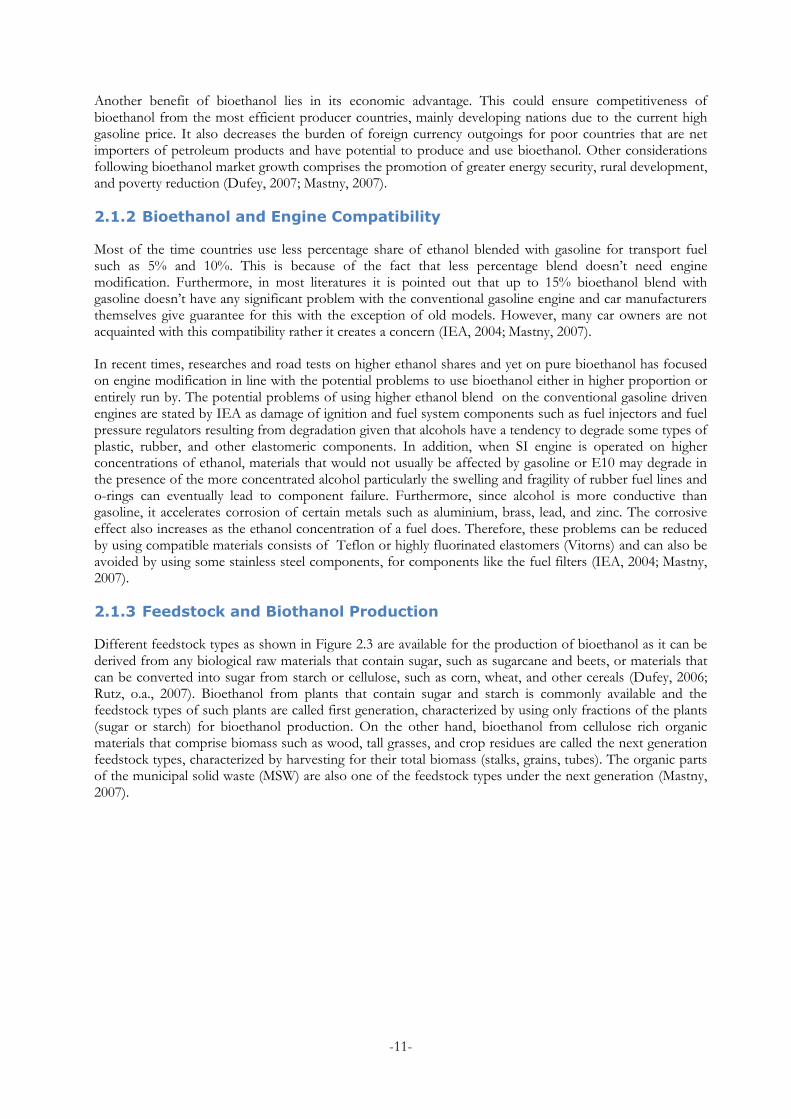
The greatest benefit of bioethanol lies in its potential to decrease greenhouse gas emissions through partial substitution of gasoline as a transport fuel (IEA, 2004). This could support countries to attain their commitments under the Kyoto protocol and mitigate the effects of climate change. Figure 2.2 below depicts the emission reduction by type of feedstock and energy used for processing.
Figure 2.2: Energy and GHG emission impacts
Source: (Wang, o.a., 2007)
-11-
Another benefit of bioethanol lies in its economic advantage. This could ensure competitiveness of bioethanol from the most efficient producer countries, mainly developing nations due to the current high gasoline price. It also decreases the burden of foreign currency outgoings for poor countries that are net importers of petroleum products and have potential to produce and use bioethanol. Other considerations following bioethanol market growth comprises the promotion of greater energy security, rural development, and poverty reduction (Dufey, 2007; Mastny, 2007).
2.1.2 Bioethanol and Engine Compatibility
Most of the time countries use less percentage share of ethanol blended with gasoline for transport fuel such as 5% and 10%. This is because of the fact that less percentage blend doesn’t need engine modification. Furthermore, in most literatures it is pointed out that up to 15% bioethanol blend with gasoline doesn’t have any significant problem with the conventional gasoline engine and car manufacturers themselves give guarantee for this with the exception of old models. However, many car owners are not acquainted with this compatibility rather it creates a concern (IEA, 2004; Mastny, 2007).
In recent times, researches and road tests on higher ethanol shares and yet on pure bioethanol has focused on engine modification in line with the potential problems to use bioethanol either in higher proportion or entirely run by. The potential problems of using higher ethanol blend on the conventional gasoline driven engines are stated by IEA as damage of ignition and fuel system components such as fuel injectors and fuel pressure regulators resulting from degradation given that alcohols have a tendency to degrade some types of plastic, rubber, and other elastomeric components. In addition, when SI engine is operated on higher concentrations of ethanol, materials that would not usually be affected by gasoline or E10 may degrade in the presence of the more concentrated alcohol particularly the swelling and fragility of rubber fuel lines and o-rings can eventually lead to component failure. Furthermore, since alcohol is more conductive than gasoline, it accelerates corrosion of certain metals such as aluminium, brass, lead, and zinc. The corrosive effect also increases as the ethanol concentration of a fuel does. Therefore, these problems can be reduced by using compatible materials consists of Teflon or highly fluorinated elastomers (Vitorns) and can also be avoided by using some stainless steel components, for components like the fuel filters (IEA, 2004; Mastny, 2007).
2.1.3 Feedstock and Biothanol Production
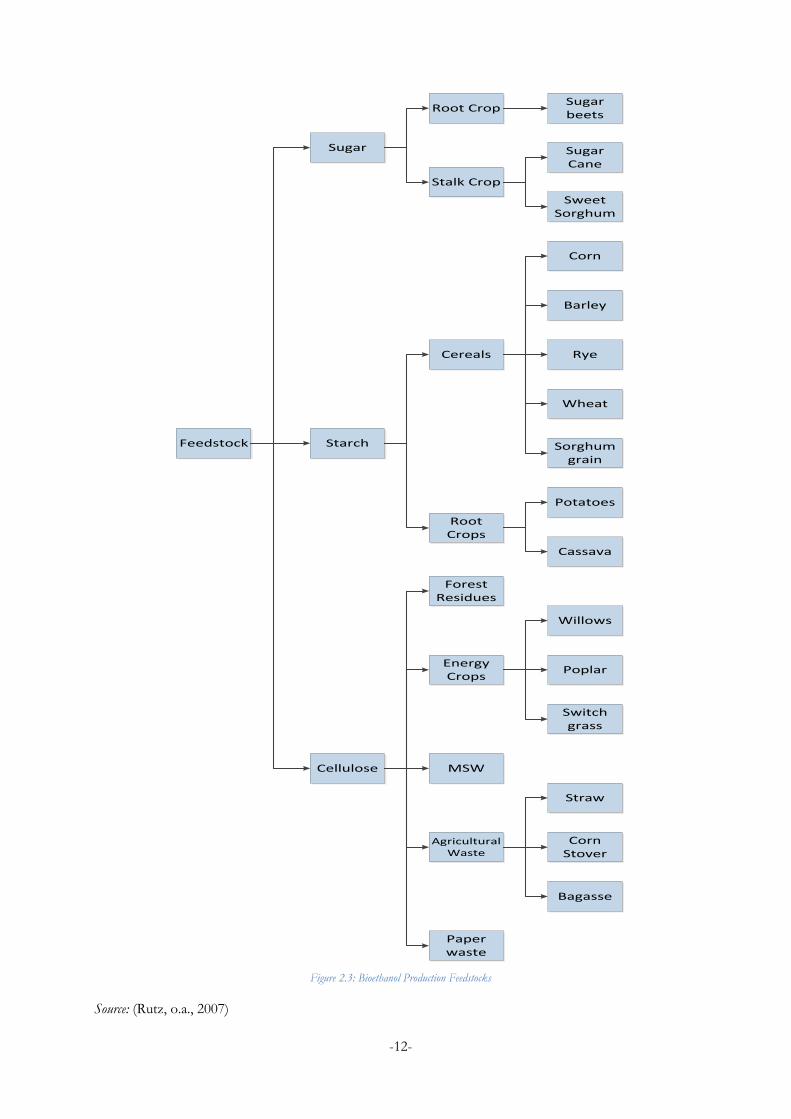
Different feedstock types as shown in Figure 2.3 are available for the production of bioethanol as it can be derived from any biological raw materials that contain sugar, such as sugarcane and beets, or materials that can be converted into sugar from starch or cellulose, such as corn, wheat, and other cereals (Dufey, 2006; Rutz, o.a., 2007). Bioethanol from plants that contain sugar and starch is commonly available and the feedstock types of such plants are called first generation, characterized by using only fractions of the plants (sugar or starch) for bioethanol production. On the other hand, bioethanol from cellulose rich organic materials that comprise biomass such as wood, tall grasses, and crop residues are called the next generation feedstock types, characterized by harvesting for their total biomass (stalks, grains, tubes). The organic parts of the municipal solid waste (MSW) are also one of the feedstock types under the next generation (Mastny, 2007).
-12-
Feedstock
Sugar
Starch
Cellulose
Root Crop
Stalk Crop
Cereals
Root Crops
Forest Residues
Sugar beets
Sugar Cane
Sweet Sorghum
Corn
Rye
Wheat
Sorghum grain
Straw
Cassava
Corn Stover
Barley
MSW
Poplar
Willows
Potatoes
Bagasse
Energy Crops
Switch grass
Agricultural Waste
Paper waste
Figure 2.3: Bioethanol Production Feedstocks
Source: (Rutz, o.a., 2007)
-13-
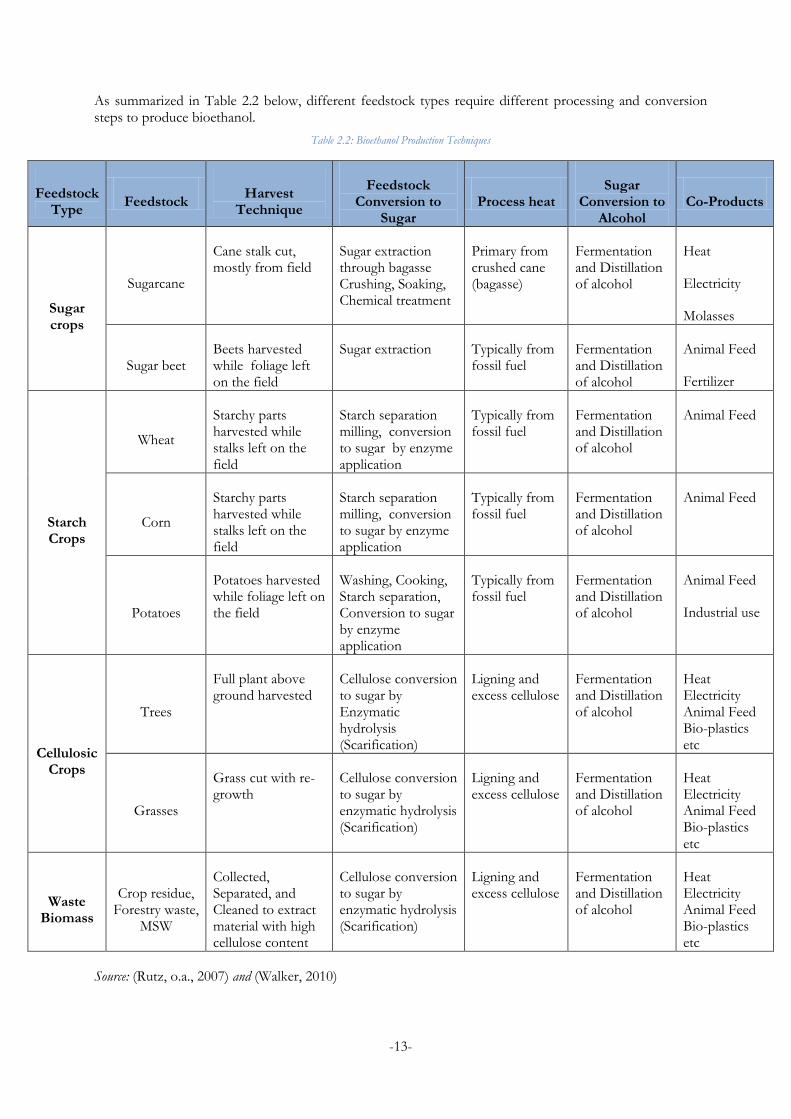
As summarized in Table 2.2 below, different feedstock types require different processing and conversion steps to produce bioethanol.
Table 2.2: Bioethanol Production Techniques
Feedstock Type
Feedstock Harvest
Technique
Feedstock Conversion to
Sugar Process heat
Sugar Conversion to
Alcohol Co-Products
Sugar crops
Sugarcane
Cane stalk cut, mostly from field
Sugar extraction through bagasse Crushing, Soaking, Chemical treatment
Primary from crushed cane (bagasse)
Fermentation and Distillation of alcohol
Heat
Electricity
Molasses
Sugar beet Beets harvested while foliage left on the field
Sugar extraction Typically from fossil fuel
Fermentation and Distillation of alcohol
Animal Feed
Fertilizer
Starch Crops
Wheat
Starchy parts harvested while stalks left on the field
Starch separation milling, conversion to sugar by enzyme application
Typically from fossil fuel
Fermentation and Distillation of alcohol
Animal Feed
Corn
Starchy parts harvested while stalks left on the field
Starch separation milling, conversion to sugar by enzyme application
Typically from fossil fuel
Fermentation and Distillation of alcohol
Animal Feed
Potatoes
Potatoes harvested while foliage left on the field
Washing, Cooking, Starch separation, Conversion to sugar by enzyme application
Typically from fossil fuel
Fermentation and Distillation of alcohol
Animal Feed
Industrial use
Cellulosic Crops
Trees
Full plant above ground harvested
Cellulose conversion to sugar by Enzymatic hydrolysis (Scarification)
Ligning and excess cellulose
Fermentation and Distillation of alcohol
Heat Electricity Animal Feed Bio-plastics etc
Grasses
Grass cut with re-growth
Cellulose conversion to sugar by enzymatic hydrolysis (Scarification)
Ligning and excess cellulose
Fermentation and Distillation of alcohol
Heat Electricity Animal Feed Bio-plastics etc
Waste Biomass
Crop residue, Forestry waste,
MSW
Collected, Separated, and Cleaned to extract material with high cellulose content
Cellulose conversion to sugar by enzymatic hydrolysis (Scarification)
Ligning and excess cellulose
Fermentation and Distillation of alcohol
Heat Electricity Animal Feed Bio-plastics etc
Source: (Rutz, o.a., 2007) and (Walker, 2010)
-14-
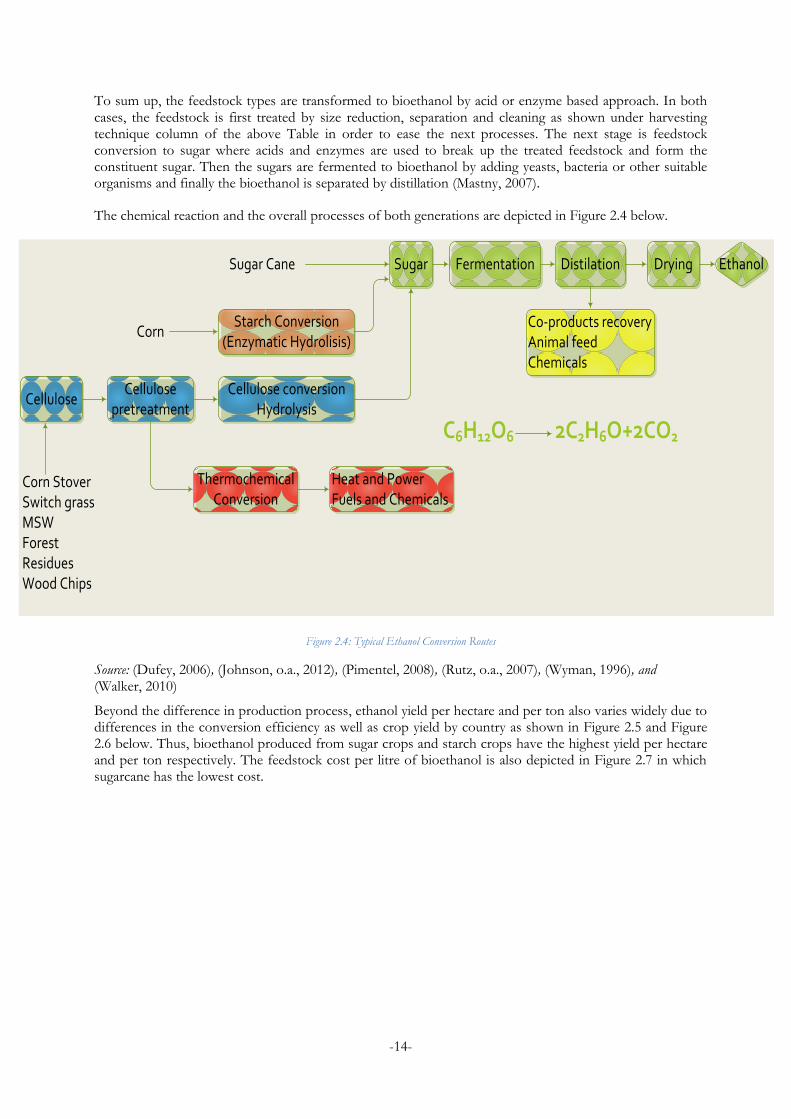
To sum up, the feedstock types are transformed to bioethanol by acid or enzyme based approach. In both cases, the feedstock is first treated by size reduction, separation and cleaning as shown under harvesting technique column of the above Table in order to ease the next processes. The next stage is feedstock conversion to sugar where acids and enzymes are used to break up the treated feedstock and form the constituent sugar. Then the sugars are fermented to bioethanol by adding yeasts, bacteria or other suitable organisms and finally the bioethanol is separated by distillation (Mastny, 2007).
The chemical reaction and the overall processes of both generations are depicted in Figure 2.4 below.
Ethanol
Starch Conversion(Enzymatic Hydrolisis)
Cellulose conversionHydrolysis
Cellulose pretreatment
Cellulose
Thermochemical Conversion
DryingDistilationFermentationSugar
Co-products recoveryAnimal feedChemicals
Heat and PowerFuels and Chemicals
Corn
Sugar Cane
Corn StoverSwitch grassMSWForest ResiduesWood Chips
C6H12O6 2C2H6O+2CO2
Figure 2.4: Typical Ethanol Conversion Routes
Source: (Dufey, 2006), (Johnson, o.a., 2012), (Pimentel, 2008), (Rutz, o.a., 2007), (Wyman, 1996), and (Walker, 2010)
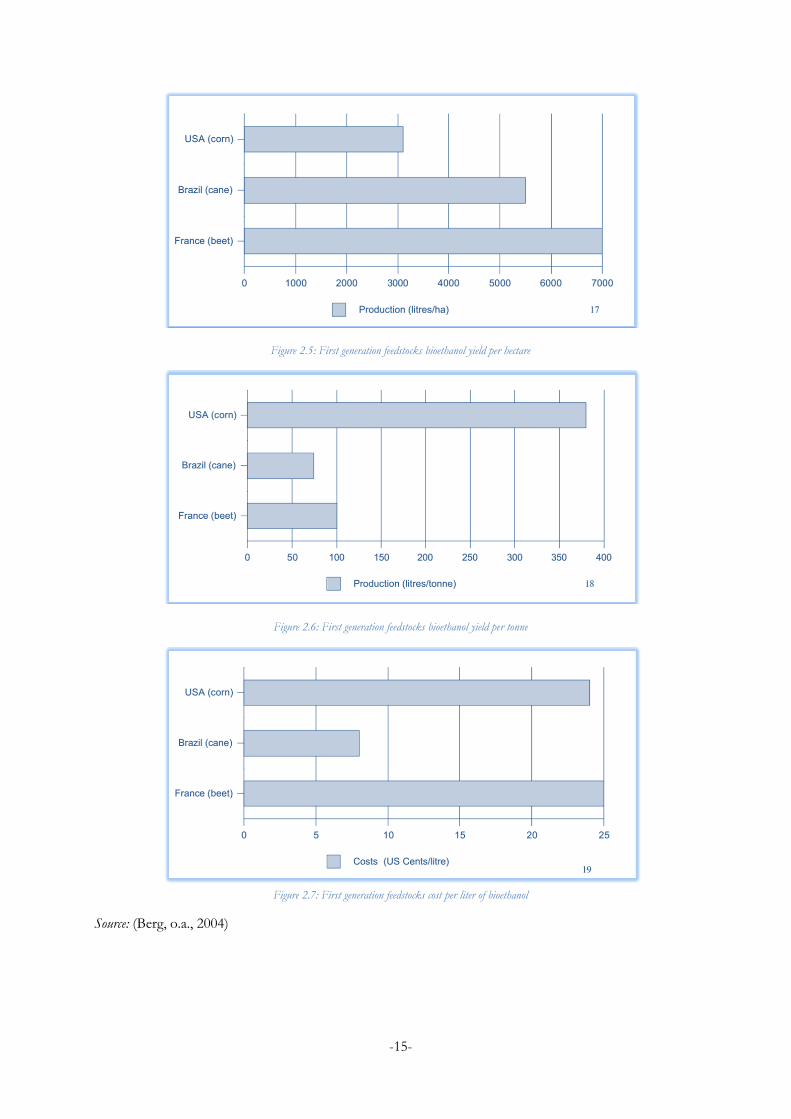
Beyond the difference in production process, ethanol yield per hectare and per ton also varies widely due to differences in the conversion efficiency as well as crop yield by country as shown in Figure 2.5 and Figure 2.6 below. Thus, bioethanol produced from sugar crops and starch crops have the highest yield per hectare and per ton respectively. The feedstock cost per litre of bioethanol is also depicted in Figure 2.7 in which sugarcane has the lowest cost.
-15-
Figure 2.5: First generation feedstocks bioethanol yield per hectare
Figure 2.6: First generation feedstocks bioethanol yield per tonne
Figure 2.7: First generation feedstocks cost per liter of bioethanol
Source: (Berg, o.a., 2004)
-16-
2.1.4 Current Status and Future Projections of Bioethanol Production
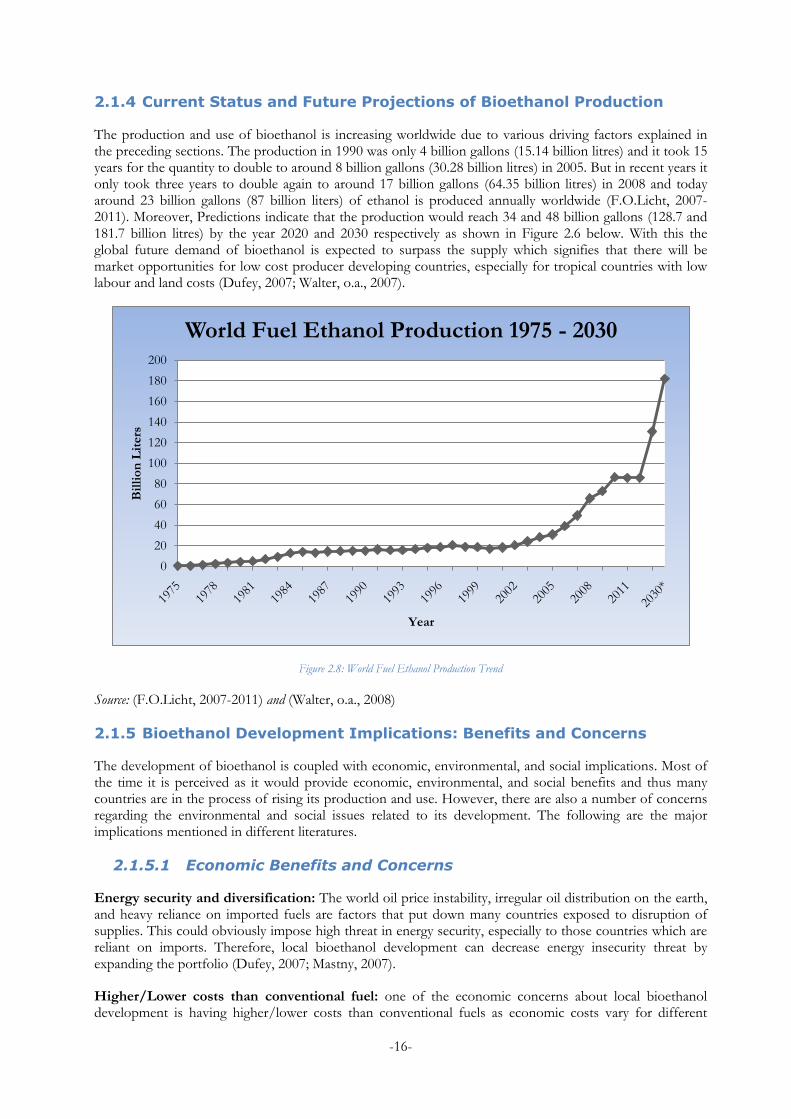
The production and use of bioethanol is increasing worldwide due to various driving factors explained in the preceding sections. The production in 1990 was only 4 billion gallons (15.14 billion litres) and it took 15 years for the quantity to double to around 8 billion gallons (30.28 billion litres) in 2005. But in recent years it only took three years to double again to around 17 billion gallons (64.35 billion litres) in 2008 and today around 23 billion gallons (87 billion liters) of ethanol is produced annually worldwide (F.O.Licht, 2007-2011). Moreover, Predictions indicate that the production would reach 34 and 48 billion gallons (128.7 and 181.7 billion litres) by the year 2020 and 2030 respectively as shown in Figure 2.6 below. With this the global future demand of bioethanol is expected to surpass the supply which signifies that there will be market opportunities for low cost producer developing countries, especially for tropical countries with low labour and land costs (Dufey, 2007; Walter, o.a., 2007).
Figure 2.8: World Fuel Ethanol Production Trend
Source: (F.O.Licht, 2007-2011) and (Walter, o.a., 2008)
2.1.5 Bioethanol Development Implications: Benefits and Concerns
The development of bioethanol is coupled with economic, environmental, and social implications. Most of the time it is perceived as it would provide economic, environmental, and social benefits and thus many countries are in the process of rising its production and use. However, there are also a number of concerns regarding the environmental and social issues related to its development. The following are the major implications mentioned in different literatures.
2.1.5.1 Economic Benefits and Concerns
Energy security and diversification: The world oil price instability, irregular oil distribution on the earth, and heavy reliance on imported fuels are factors that put down many countries exposed to disruption of supplies. This could obviously impose high threat in energy security, especially to those countries which are reliant on imports. Therefore, local bioethanol development can decrease energy insecurity threat by expanding the portfolio (Dufey, 2007; Mastny, 2007).
Higher/Lower costs than conventional fuel: one of the economic concerns about local bioethanol development is having higher/lower costs than conventional fuels as economic costs vary for different
0
20
40
60
80
100
120
140
160
180
200
Bil
lio
n L
iters
Year
World Fuel Ethanol Production 1975 - 2030
-17-
countries depending on the feedstock and technology employed (Dufey, 2007; IEA, 2004; Mastny, 2007). For example, Brazil being the most cost competent producer, its bioethanol product can be competitive with oil as low as USD 50 a barrel when petroleum prices were above USD 90 per barrel during 2012. This economic advantage on bioethanol development is for the reason that higher crop yields and lower costs for land and labour in tropical countries than temperate zone countries. Feedstock diversity for bioethanol production has also an impact on the economic advantage. For instance, US bioethanol from corn was costly as high as USD 70 a barrel during 2012 than from sugarcane since bioethanol yield for each hectare of corn is less than the tropically developed sugarcane. Thus, tropical countries bioethanol from sugarcane was considerably less expensive than gasoline (EIA, 2013; IEA, 2004; Dufey, 2007).
Improved trade balance: dependence on imported oil for developing countries means heavy foreign currency expenditures that could otherwise be used for other critical needs. In this perspective, developing local bioethanol means an opportunity to substitute oil imports and enhance trade balance. In Brazil for example, some USD 43.5 billion was saved by substitution of gasoline using bioethanol between 1976 and 2000 (Dufey, 2006; Mastny, 2007).
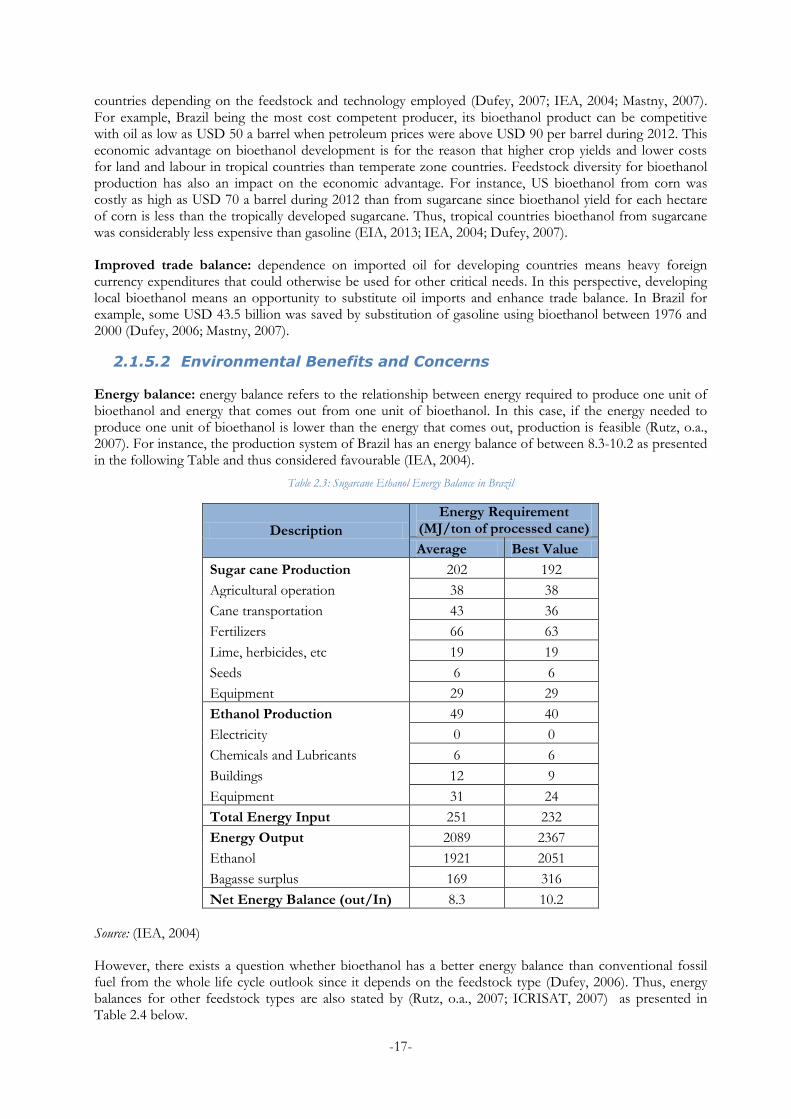
2.1.5.2 Environmental Benefits and Concerns
Energy balance: energy balance refers to the relationship between energy required to produce one unit of bioethanol and energy that comes out from one unit of bioethanol. In this case, if the energy needed to produce one unit of bioethanol is lower than the energy that comes out, production is feasible (Rutz, o.a., 2007). For instance, the production system of Brazil has an energy balance of between 8.3-10.2 as presented in the following Table and thus considered favourable (IEA, 2004).
Table 2.3: Sugarcane Ethanol Energy Balance in Brazil
Description
Energy Requirement (MJ/ton of processed cane)
Average Best Value
Sugar cane Production 202 192
Agricultural operation 38 38
Cane transportation 43 36
Fertilizers 66 63
Lime, herbicides, etc 19 19
Seeds 6 6
Equipment 29 29
Ethanol Production 49 40
Electricity 0 0
Chemicals and Lubricants 6 6
Buildings 12 9
Equipment 31 24
Total Energy Input 251 232
Energy Output 2089 2367
Ethanol 1921 2051
Bagasse surplus 169 316
Net Energy Balance (out/In) 8.3 10.2
Source: (IEA, 2004)
However, there exists a question whether bioethanol has a better energy balance than conventional fossil fuel from the whole life cycle outlook since it depends on the feedstock type (Dufey, 2006). Thus, energy balances for other feedstock types are also stated by (Rutz, o.a., 2007; ICRISAT, 2007) as presented in Table 2.4 below.
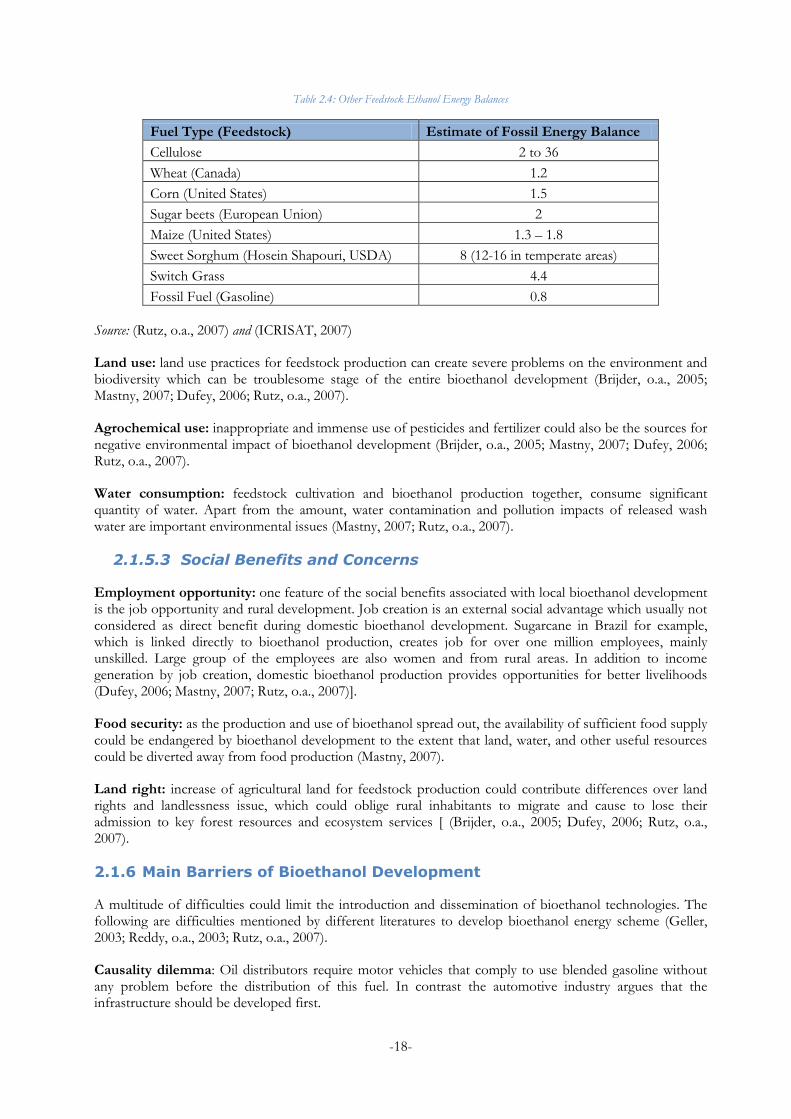
-18-
Table 2.4: Other Feedstock Ethanol Energy Balances
Fuel Type (Feedstock) Estimate of Fossil Energy Balance
Cellulose 2 to 36
Wheat (Canada) 1.2
Corn (United States) 1.5
Sugar beets (European Union) 2
Maize (United States) 1.3 – 1.8
Sweet Sorghum (Hosein Shapouri, USDA) 8 (12-16 in temperate areas)
Switch Grass 4.4
Fossil Fuel (Gasoline) 0.8
Source: (Rutz, o.a., 2007) and (ICRISAT, 2007)
Land use: land use practices for feedstock production can create severe problems on the environment and biodiversity which can be troublesome stage of the entire bioethanol development (Brijder, o.a., 2005; Mastny, 2007; Dufey, 2006; Rutz, o.a., 2007).
Agrochemical use: inappropriate and immense use of pesticides and fertilizer could also be the sources for negative environmental impact of bioethanol development (Brijder, o.a., 2005; Mastny, 2007; Dufey, 2006; Rutz, o.a., 2007).
Water consumption: feedstock cultivation and bioethanol production together, consume significant quantity of water. Apart from the amount, water contamination and pollution impacts of released wash water are important environmental issues (Mastny, 2007; Rutz, o.a., 2007).
2.1.5.3 Social Benefits and Concerns
Employment opportunity: one feature of the social benefits associated with local bioethanol development is the job opportunity and rural development. Job creation is an external social advantage which usually not considered as direct benefit during domestic bioethanol development. Sugarcane in Brazil for example, which is linked directly to bioethanol production, creates job for over one million employees, mainly unskilled. Large group of the employees are also women and from rural areas. In addition to income generation by job creation, domestic bioethanol production provides opportunities for better livelihoods (Dufey, 2006; Mastny, 2007; Rutz, o.a., 2007)].
Food security: as the production and use of bioethanol spread out, the availability of sufficient food supply could be endangered by bioethanol development to the extent that land, water, and other useful resources could be diverted away from food production (Mastny, 2007).
Land right: increase of agricultural land for feedstock production could contribute differences over land rights and landlessness issue, which could oblige rural inhabitants to migrate and cause to lose their admission to key forest resources and ecosystem services [ (Brijder, o.a., 2005; Dufey, 2006; Rutz, o.a., 2007).
2.1.6 Main Barriers of Bioethanol Development
A multitude of difficulties could limit the introduction and dissemination of bioethanol technologies. The following are difficulties mentioned by different literatures to develop bioethanol energy scheme (Geller, 2003; Reddy, o.a., 2003; Rutz, o.a., 2007).
Causality dilemma: Oil distributors require motor vehicles that comply to use blended gasoline without any problem before the distribution of this fuel. In contrast the automotive industry argues that the infrastructure should be developed first.
-19-
Economic difficulties: Most of the time the production of bioethanol is costly depending on the feedstock type, the market maturity, and the accounting of full benefits of externalities. Provided that, traditional lenders are unwilling to provide loans for bioethanol technology scheme to secure long term financing at low interest rates because it may have a comparatively long payback period.
Ethical dilemma: A choice between the feedstock for bioethanol scheme may compete with food supply.
Infrastructure difficulties: Possible requirement of modified infrastructure depending on the percentage share of the blended gasoline and the technology employed.
Knowledge and information difficulties: The general public, decision makers, consumers, and developers may lack credible knowledge and information on the performance, reliability, economic advantage, and precise data to enter into the business of bioethanol development.
Policy and regulation difficulties: Lack of policy and regulation may hinder the creation of market and simultaneously limit the participation of developers because of market uncertainties.
Political difficulties: Politicians may influenced by lobbying groups to create or keep an unaffordable political framework for the bioethanol scheme.
Technical difficulties: Absence of standardization and quality control of the bioethanol scheme may affect the technical performance of each technology and the unreliability regarding its performance.
2.1.7 Policies to Promote Bioethanol Development
Earlier experiences confirm that supportive government policies have been important to implement the strategies of bioethanol development. These policies are normally developed to act in response to domestic goals linked with the bioethanol production and use. For example, Brazil and United States were mainly inspired to develop policies that have sustained the bioethanol program by mandated blends or production levels so as to increase energy security and reduce the import bill, although rural development support appeared as a significant factor in a later stage of these experiences. Furthermore, a supplementary interest exists today focused on the potential to mitigate global warming. All these indicate that the policies should cover a range of sectors, mainly including agriculture, industry, energy, environment, and trade (Mastny, 2007; Dufey, 2006).
Knowing the above mentioned multifaceted difficulties that block the premature development of bioethanol program on the one hand and the advantages one can achieve on the other, the application of some form of public policy is sensible to make bioethanol production rise in the earliest stages of the industry. The familiar policy implements that have been successful in fostering the bioethanol development include: blending mandates, government purchasing policies, tax incentives, and support for bioethanol infrastructure and technologies. Hence, the main experience of Brazil is briefly described below (Mastny, 2007; Dufey, 2006).
The 1975 PROALCOOL program of Brazil was appeared as a reaction to the oil crisis and was designed to substitute gasoline with bioethanol blends produced from sugarcane. In order to realize this a number of policy measures were introduced including: production quotas and a fixed purchasing price for bioethanol, control of domestic bioethanol sales and distribution by a monopolistic agent, subsidies to bioethanol blend gasoline producers, tax incentives to car owners using bioethanol blend gasoline, and soft loans to implement the necessary technical changes for vehicles. Likewise, several other countries, both developed and developing, have either implemented or are implementing policy tools to support bioethanol market development as summarized in Table 2.5 below for some of these experiences (Dufey, 2006).
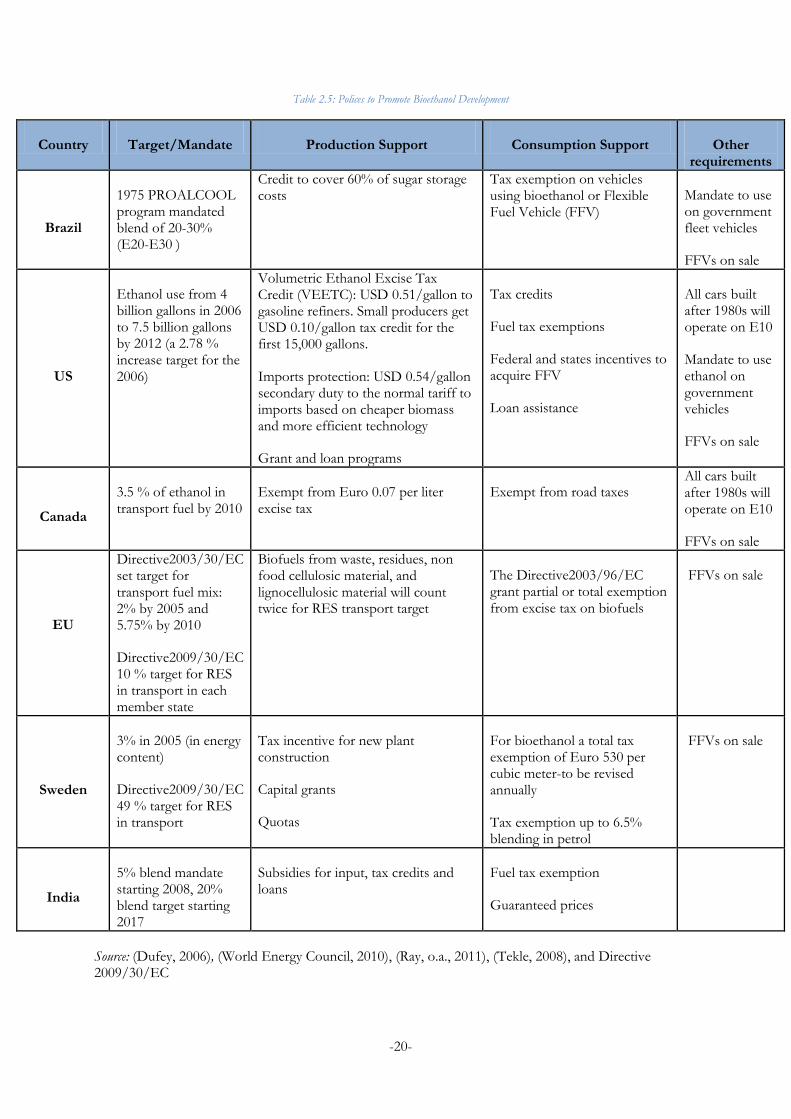
-20-
Table 2.5: Polices to Promote Bioethanol Development
Country Target/Mandate Production Support Consumption Support Other requirements
Brazil
1975 PROALCOOL program mandated blend of 20-30% (E20-E30 )
Credit to cover 60% of sugar storage costs
Tax exemption on vehicles using bioethanol or Flexible Fuel Vehicle (FFV)
Mandate to use on government fleet vehicles
FFVs on sale
US
Ethanol use from 4 billion gallons in 2006 to 7.5 billion gallons by 2012 (a 2.78 % increase target for the 2006)
Volumetric Ethanol Excise Tax Credit (VEETC): USD 0.51/gallon to gasoline refiners. Small producers get USD 0.10/gallon tax credit for the first 15,000 gallons.
Imports protection: USD 0.54/gallon secondary duty to the normal tariff to imports based on cheaper biomass and more efficient technology
Grant and loan programs
Tax credits
Fuel tax exemptions
Federal and states incentives to acquire FFV
Loan assistance
All cars built after 1980s will operate on E10
Mandate to use ethanol on government vehicles
FFVs on sale
Canada
3.5 % of ethanol in transport fuel by 2010
Exempt from Euro 0.07 per liter excise tax
Exempt from road taxes All cars built after 1980s will operate on E10
FFVs on sale
EU
Directive2003/30/EC set target for transport fuel mix: 2% by 2005 and 5.75% by 2010
Directive2009/30/EC 10 % target for RES in transport in each member state
Biofuels from waste, residues, non food cellulosic material, and lignocellulosic material will count twice for RES transport target
The Directive2003/96/EC grant partial or total exemption from excise tax on biofuels
FFVs on sale
Sweden
3% in 2005 (in energy content)
Directive2009/30/EC 49 % target for RES in transport
Tax incentive for new plant construction
Capital grants
Quotas
For bioethanol a total tax exemption of Euro 530 per cubic meter-to be revised annually
Tax exemption up to 6.5% blending in petrol
FFVs on sale
India
5% blend mandate starting 2008, 20% blend target starting 2017
Subsidies for input, tax credits and loans
Fuel tax exemption
Guaranteed prices
Source: (Dufey, 2006), (World Energy Council, 2010), (Ray, o.a., 2011), (Tekle, 2008), and Directive 2009/30/EC
-21-
2.2 Bioethanol Production and Use Conditions in Ethiopia
Ethanol production in Ethiopia is linked with sugar factories and aimed for import substitute of petroleum products, enhance agricultural development and agro processing, job creation, and export earnings. However, only a small fraction of the potentials are utilized yet and an alternate 5% and 10% ethanol blend has accessed in the capital city of the country. Therefore, in this section a brief look into the history, current status, and future targets of bioethanol development program along with the potential, opportunities, and risks of the ongoing and planned development projects in the country are discussed. This indicates that the issues should cover a range of sectors but the main ones, agriculture, energy, and transport sectors are addressed.
2.2.1 Brief History and Current Status
Ethiopia started modern sugar industry in 1951 at Wonji sugar factory as a share company founded by Ethiopian government and foreign investors followed by Shoa and Metehara sugar factories in 1962 and 1969 respectively. Five years later, in 1974, all sugar factories became in charge of the government ownership following the change of government and started operating under the Ethiopian Sugar Corporation which has embarked upon alcohol production program from molasses for use as additive to gasoline in 1979. The promoters of this project were Ministry of Industry and UNIDO which has paid for the feasibility study conducted by the State Alcohol Monopoly of Finland Ltd. Likewise, in 1984, a French company named SOFRECO has also made a feasibility study for the production of baker’s yeast and bioethanol from molasses (Sugar Corporation, 2013; Fessehaie, 2009).
When the sugar corporation was dissolved by law in 1992, all the factories were re-established as public enterprises and thus Ethiopian Sugar Industry Support Center came into existence in 1998 to provide common support to all factories as a share company of Ethiopian Insurance Corporation, the Development Bank of Ethiopia, and the three sugar factories. In 1999, Fincha sugar factory was established as a third sugar development project in the country. The same year, a technical committee was established consisting of the Ethiopian Sugar Industry Support Center, Finchaa sugar factory, Ethiopian Petroleum Enterprise, and Oil distributing companies in Ethiopia to address issues intended for successful commercialization of ethanol fuel. Later in April 2000 directives on production, distribution, and control of ethanol blended gasoline fuel were approved by the council of ministers of the Federal Democratic Republic of Ethiopia and then SOFRECO made another feasibility study in 2004 to expand Finchaa sugar factory, and concluded that the ethanol blended gasoline fuel was economical (Sugar Corporation, 2013; Fessehaie, 2009).
Replacing the support center, in 2006, the house of peoples’ representatives of the Federal Democratic Republic of Ethiopia established the Ethiopian Sugar Development Agency under proclamation No. 504/2006 with the purpose of implementing the government sugar development policies and to assist public sugar enterprises in project development, research, training, and marketing in order to make them modern, efficient, and competitive with the vision of producing considerable amount of good quality sugar and ethanol at the lowest possible cost as compared to the world producers and gain significant market share in the world market. The same year, as a fourth sugar development project in the country, Tendaho sugar development project was also established (Sugar Corporation, 2013; Fessehaie, 2009).
The current Sugar Corporation with a vision of increasing sugar development activities in a massive scale and structure came into existence on October, 2010 by replacing the former Ethiopian Sugar Development Agency under the council of ministers regulation No.192/2010. The purposes of its establishment is growing sugarcane and other sugar yielding crops to process and produce sugar, sugar products, sugar byproducts, and products of sugar byproducts for sell in the domestic and export markets. Therefore, to complete the aforementioned purposes, the corporation is implementing expansion projects on the existing sugar factories while accordingly started constructing ten new sugar factories (Sugar Corporation, 2013; Fessehaie, 2009).
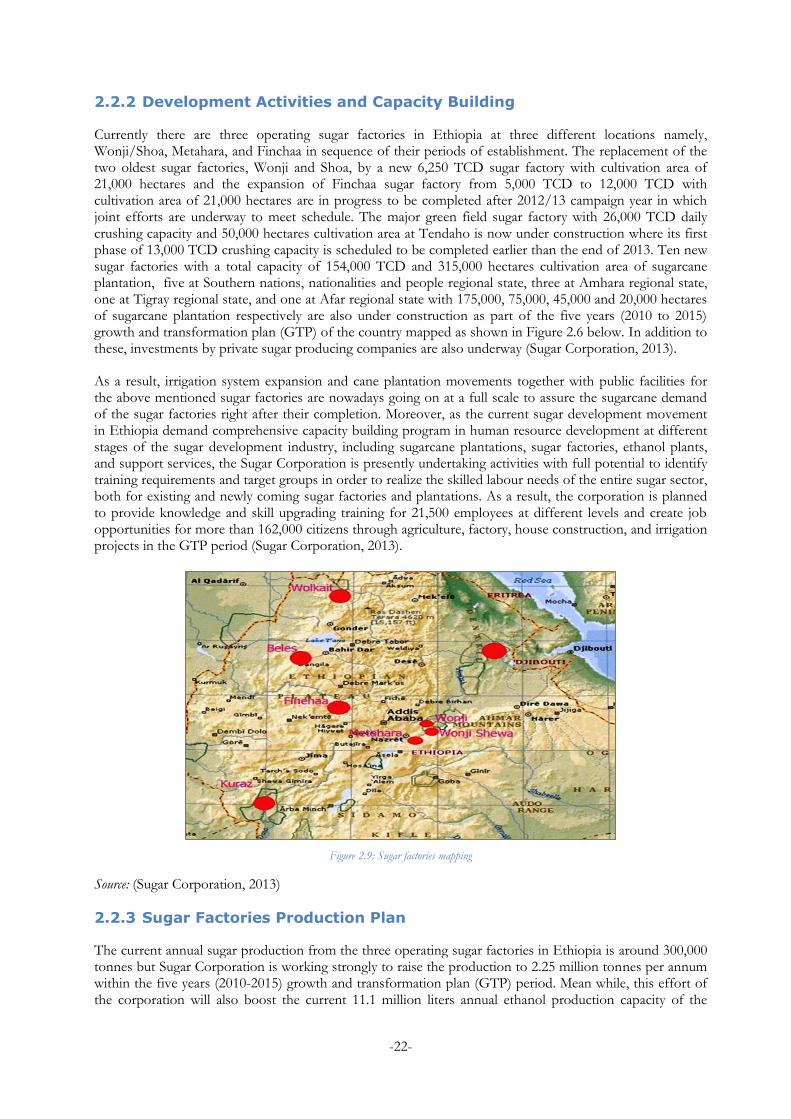
-22-
2.2.2 Development Activities and Capacity Building
Currently there are three operating sugar factories in Ethiopia at three different locations namely, Wonji/Shoa, Metahara, and Finchaa in sequence of their periods of establishment. The replacement of the two oldest sugar factories, Wonji and Shoa, by a new 6,250 TCD sugar factory with cultivation area of 21,000 hectares and the expansion of Finchaa sugar factory from 5,000 TCD to 12,000 TCD with cultivation area of 21,000 hectares are in progress to be completed after 2012/13 campaign year in which joint efforts are underway to meet schedule. The major green field sugar factory with 26,000 TCD daily crushing capacity and 50,000 hectares cultivation area at Tendaho is now under construction where its first phase of 13,000 TCD crushing capacity is scheduled to be completed earlier than the end of 2013. Ten new sugar factories with a total capacity of 154,000 TCD and 315,000 hectares cultivation area of sugarcane plantation, five at Southern nations, nationalities and people regional state, three at Amhara regional state, one at Tigray regional state, and one at Afar regional state with 175,000, 75,000, 45,000 and 20,000 hectares of sugarcane plantation respectively are also under construction as part of the five years (2010 to 2015) growth and transformation plan (GTP) of the country mapped as shown in Figure 2.6 below. In addition to these, investments by private sugar producing companies are also underway (Sugar Corporation, 2013).
As a result, irrigation system expansion and cane plantation movements together with public facilities for the above mentioned sugar factories are nowadays going on at a full scale to assure the sugarcane demand of the sugar factories right after their completion. Moreover, as the current sugar development movement in Ethiopia demand comprehensive capacity building program in human resource development at different stages of the sugar development industry, including sugarcane plantations, sugar factories, ethanol plants, and support services, the Sugar Corporation is presently undertaking activities with full potential to identify training requirements and target groups in order to realize the skilled labour needs of the entire sugar sector, both for existing and newly coming sugar factories and plantations. As a result, the corporation is planned to provide knowledge and skill upgrading training for 21,500 employees at different levels and create job opportunities for more than 162,000 citizens through agriculture, factory, house construction, and irrigation projects in the GTP period (Sugar Corporation, 2013).
Figure 2.9: Sugar factories mapping
Source: (Sugar Corporation, 2013)
2.2.3 Sugar Factories Production Plan
The current annual sugar production from the three operating sugar factories in Ethiopia is around 300,000 tonnes but Sugar Corporation is working strongly to raise the production to 2.25 million tonnes per annum within the five years (2010-2015) growth and transformation plan (GTP) period. Mean while, this effort of the corporation will also boost the current 11.1 million liters annual ethanol production capacity of the
-23-
country to 181.6 million liters and the current 100 MWh annual electrical energy generated through co-generation to 607 GWh. To this effect, the corporation is working to finalize expansion projects of the existing sugar factories as well as construction of the largest factory at Tendaho in addition to the ten new sugar factories. In addition to this, research to develop high yield sugarcane varieties and establishment of well equipped breeding station including construction of four tissue culture laboratories and green house to enhance the productivity of sugarcane that range between105 and 145 to 155 tons per hectare is in progress (Sugar Corporation, 2013).
Therefore, this effort will enable the country to export 623,000 tonnes of raw sugar and 623,000 tonnes of white sugar which in total makes the amount 1,246,000 tonnes as a source of export earnings by the end of the GTP period. It also allow to use fuel ethanol to substitute imported gasoline through blending and to replace imported kerosene from abroad by the extra ethanol produced in order to minimize the foreign currency the country spent on oil import (Sugar Corporation, 2013).
2.2.3.1 Current State owned factories
Fincha Sugar Factory: is a plant with average annual production capacity of 110,000 tonnes of sugar and 8000 m3 of ethanol (34,782 liters per day with annual operation day of 230 days).The average annual production capacity of the factory will reach 270,000 tonnes of sugar and 20, 000 m3 ethanol after the expansion projects carried out both on its sugarcane plantation and sugar mill under the GTP period. Fincha sugar factory had been the only factory in the country that produces ethanol until December, 2011 (Sugar Corporation, 2013; Tibebu, 2013).
Metehara Sugar Factory: is a plant with the highest production capacity as compared to the other existing factories, average annual production capacity of 136,692 tonnes of sugar. Its ethanol plant had begun its operation by December, 2011 with a capacity of 12,500 m3per year (60,000 liters per day with annual operation day of 230 days). Through its expansion project the factory would build an ethanol plant with a capacity of producing 25, 500 m3 of ethanol. Furthermore, the capacity of generating electricity through co-generation will provide 11 MW of electric power to the national grid under the GTP period (Sugar Corporation, 2013; Tibebu, 2013).
Wonji/Shoa Sugar Factory: is the oldest factory in the country with average annual production capacity of 75,000 tonnes of sugar. Through its expansion project, various tasks have been accomplished on its sugarcane plantation as well as to erect an automated and modern new sugar crushing plant with a capacity of producing 174,000 tonnes of sugar and 10, 299 m3ethanol per annum. Moreover, the capacity of generating electricity through co-generation will contribute 17 MW of electric power to the national grid under the GTP period (Sugar Corporation, 2013; Tibebu, 2013).
2.2.3.2 Future State owned factories
Tendaho Sugar Development Project: is the largest factory to be constructed in the country. The plant will have average annual production capacity of 620,000 tonnes of sugar where 50% of which will be supplied to the international market. Equipped with modern technologies, the factory would also have the capacity to produce 55, 400 m3 ethanol annually. Furthermore, it would generate 91 MW of electric power when it becomes fully operational (Sugar Corporation, 2013; Tibebu, 2013).
Kessem Sugar Development Project: is one of the new factories to be constructed in the country. The plant will have average annual production capacity of 153,000 tonnes of sugar and 12‚500 m3 of ethanol when it becomes fully operational (Sugar Corporation, 2013; Tibebu, 2013).
Kuraz Sugar Development Project: is a project with five sugar factories; out of which two are with a double capacity of the other three and all together would have a total average annual production capacity of 1.95 million tonnes of sugar and 183, 000 m3 of ethanol when they become fully operational (Sugar Corporation, 2013; Tibebu, 2013).
Beles Sugar Development Project: is a project with three sugar factories; all together would have a total average annual production capacity of 726, 000 tonnes of sugar and 62, 000 m3 of ethanol when they become fully operational (Sugar Corporation, 2013; Tibebu, 2013).
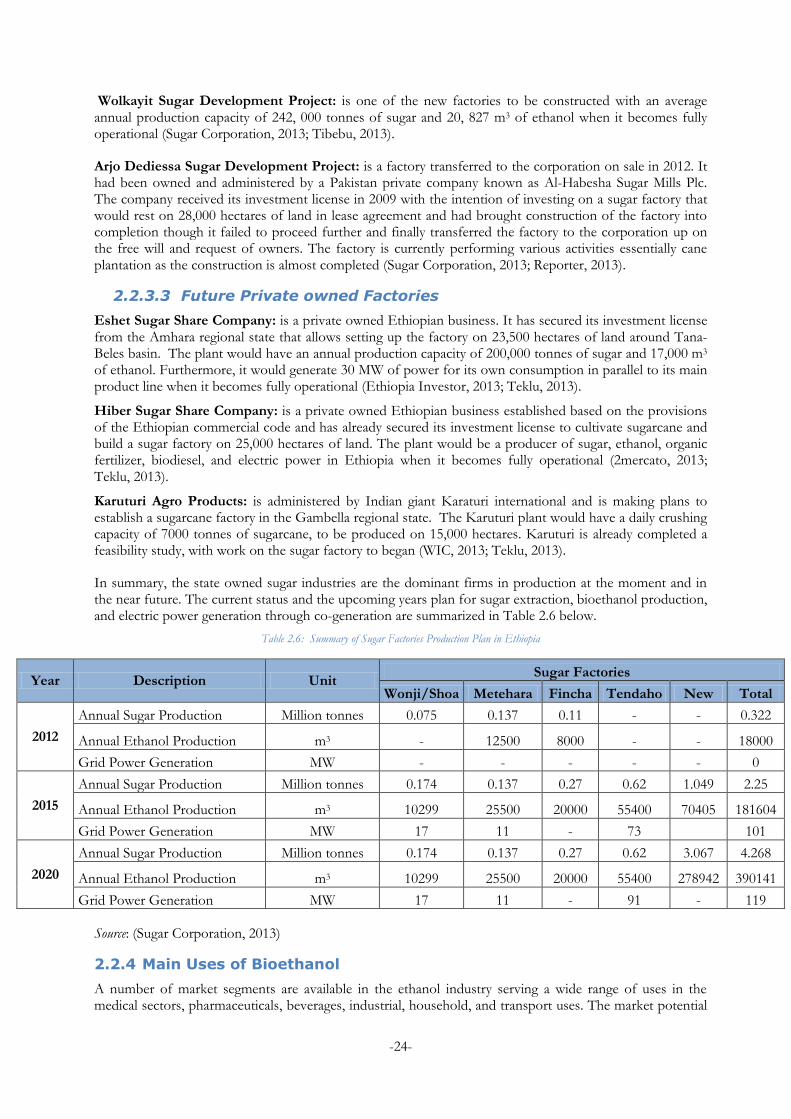
-24-
Wolkayit Sugar Development Project: is one of the new factories to be constructed with an average annual production capacity of 242, 000 tonnes of sugar and 20, 827 m3 of ethanol when it becomes fully operational (Sugar Corporation, 2013; Tibebu, 2013).
Arjo Dediessa Sugar Development Project: is a factory transferred to the corporation on sale in 2012. It had been owned and administered by a Pakistan private company known as Al-Habesha Sugar Mills Plc. The company received its investment license in 2009 with the intention of investing on a sugar factory that would rest on 28,000 hectares of land in lease agreement and had brought construction of the factory into completion though it failed to proceed further and finally transferred the factory to the corporation up on the free will and request of owners. The factory is currently performing various activities essentially cane plantation as the construction is almost completed (Sugar Corporation, 2013; Reporter, 2013).
2.2.3.3 Future Private owned Factories
Eshet Sugar Share Company: is a private owned Ethiopian business. It has secured its investment license from the Amhara regional state that allows setting up the factory on 23,500 hectares of land around Tana-Beles basin. The plant would have an annual production capacity of 200,000 tonnes of sugar and 17,000 m3 of ethanol. Furthermore, it would generate 30 MW of power for its own consumption in parallel to its main product line when it becomes fully operational (Ethiopia Investor, 2013; Teklu, 2013).
Hiber Sugar Share Company: is a private owned Ethiopian business established based on the provisions of the Ethiopian commercial code and has already secured its investment license to cultivate sugarcane and build a sugar factory on 25,000 hectares of land. The plant would be a producer of sugar, ethanol, organic fertilizer, biodiesel, and electric power in Ethiopia when it becomes fully operational (2mercato, 2013; Teklu, 2013).
Karuturi Agro Products: is administered by Indian giant Karaturi international and is making plans to establish a sugarcane factory in the Gambella regional state. The Karuturi plant would have a daily crushing capacity of 7000 tonnes of sugarcane, to be produced on 15,000 hectares. Karuturi is already completed a feasibility study, with work on the sugar factory to began (WIC, 2013; Teklu, 2013).
In summary, the state owned sugar industries are the dominant firms in production at the moment and in the near future. The current status and the upcoming years plan for sugar extraction, bioethanol production, and electric power generation through co-generation are summarized in Table 2.6 below.
Table 2.6: Summary of Sugar Factories Production Plan in Ethiopia
Year Description Unit Sugar Factories
Wonji/Shoa Metehara Fincha Tendaho New Total
2012
Annual Sugar Production Million tonnes 0.075 0.137 0.11 - - 0.322
Annual Ethanol Production m3 - 12500 8000 - - 18000
Grid Power Generation MW - - - - - 0
2015
Annual Sugar Production Million tonnes 0.174 0.137 0.27 0.62 1.049 2.25
Annual Ethanol Production m3 10299 25500 20000 55400 70405 181604
Grid Power Generation MW 17 11 - 73
101
2020
Annual Sugar Production Million tonnes 0.174 0.137 0.27 0.62 3.067 4.268
Annual Ethanol Production m3 10299 25500 20000 55400 278942 390141
Grid Power Generation MW 17 11 - 91 - 119
Source: (Sugar Corporation, 2013)
2.2.4 Main Uses of Bioethanol
A number of market segments are available in the ethanol industry serving a wide range of uses in the medical sectors, pharmaceuticals, beverages, industrial, household, and transport uses. The market potential
-25-
for bioethanol is therefore not just limited to transport fuel or energy production but has potential to supply the existing chemicals industry and house hold uses. However, the most prevalent use of bioethanol in Ethiopia is as a transport fuel in spark ignition (SI) engine vehicles and the current amount of ethanol fuel blended with gasoline is 10% and the government is working to increase the share. The government is also working to start export in two years time and to substitute household cooking fuel in the future (Tadelle, 2013; Tibebu, 2013).
2.2.5 Policy and Strategies to Promote Bioethanol Program
2.2.5.1 Strategies
In 2007, Ministry of Mines and Energy (MME) presented its draft document in titled “The Biofuel Development and Utilization Strategy of Ethiopia” containing the strategies for the biofuel industry. The draft document describes the suitability of the country for implementing biofuel development initiative in line with the major goals of the strategy as producing sufficient biofuel energy from local resources to substitute imported petroleum products and even to supply the extra products for export with the following three key objectives (MME, 2007):
Substitution of mineral fuels by domestically produced biofuels in order to save and earn foreign currency
Contribution to rural development and living standard improvement through job creation for local people in different stages of biofuel development such as feedstock production, biofuel development, transport, and distribution
Reduction of environmental pollution by harmful pollutants (GHG emissions) from petroleum products
In 2010, the five years growth and transformation energy plan of Ethiopia includes the development of biofuels by coordinating the state owned sugar factories and private investors to hold projects that produce 194.9 million litres of bioethanol and 1.6 million litres of biodiesel for road transport sector, household cooking fuel, and export supply so that to generate one billion dollar foreign currency at the end of the planning year (2015). Moreover, projects to install 25000 household biogas digesters and 1000 institutional biogas plants are set to be completed for the same period. Increasing the number of blending facilities of gasoline and ethanol to 8 and that of biodiesel to 72 by oil companies is also one of the strategic targets in the sector (MoFED, 2010).
2.2.5.2 Strategic Directions
Based on the green development strategy of Ethiopia, the country’s emission of CO2 is small relative to the developed countries however access to diverse, reliable, affordable, and clean energy is important for sustainable growth. Thus, one of the potential ways to realize the fuel shift and substitute fuel imports is increased production and use of biofuels. To promote and appreciate this green development strategy, the strategic directions are to keep the ongoing biofuel development movements, support biofuel production human capacity, and increase awareness of consumers. These are planned to be implemented by:
Creating network between the Ministry of Water and Energy, Research Institutes, and Universities to adapt and promote sustainable development of biofuel technology
Collecting and organizing data on biofuel land, technologies and market by coordinating involvement of relevant stakeholders
Supporting and motivating private investors to involve in the biofuel development activities in a short period of time and involve farmers in production and supply of biodiesel by coordinating the involvement of agriculture and rural development extension section
Facilitating experience sharing with advanced countries on biofuel development program
(MoFED, 2010; MoWE, 2013)
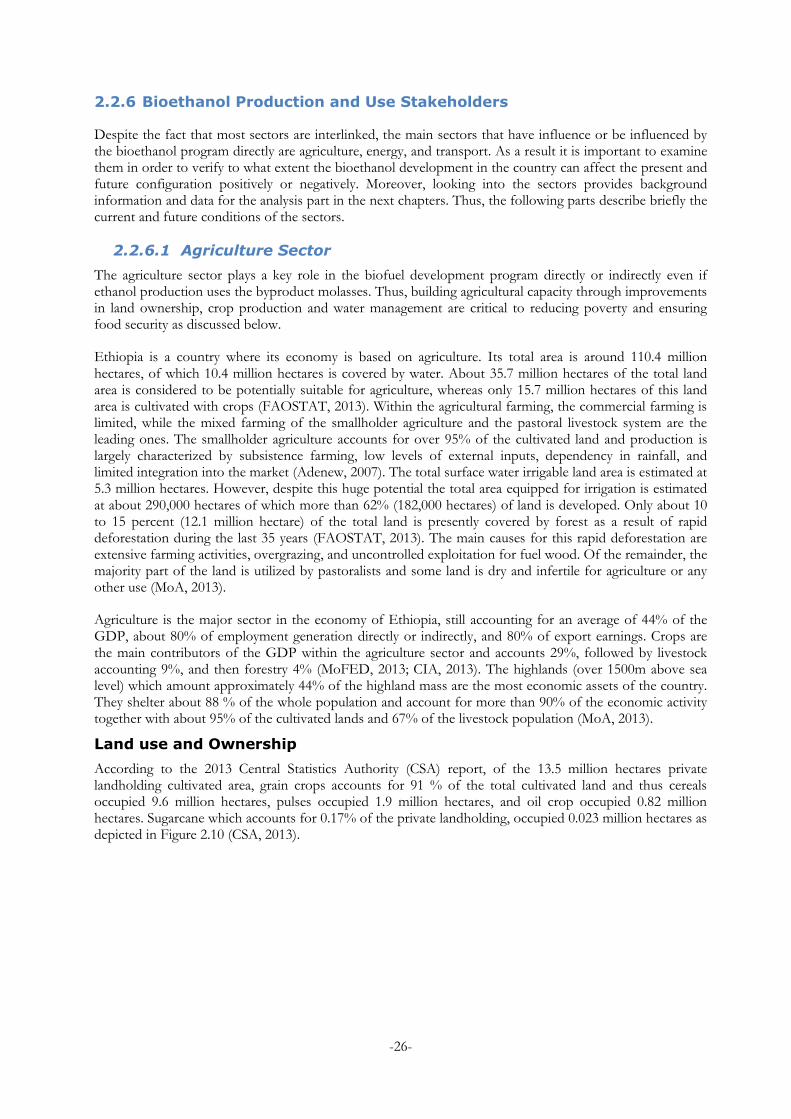
-26-
2.2.6 Bioethanol Production and Use Stakeholders
Despite the fact that most sectors are interlinked, the main sectors that have influence or be influenced by the bioethanol program directly are agriculture, energy, and transport. As a result it is important to examine them in order to verify to what extent the bioethanol development in the country can affect the present and future configuration positively or negatively. Moreover, looking into the sectors provides background information and data for the analysis part in the next chapters. Thus, the following parts describe briefly the current and future conditions of the sectors.
2.2.6.1 Agriculture Sector
The agriculture sector plays a key role in the biofuel development program directly or indirectly even if ethanol production uses the byproduct molasses. Thus, building agricultural capacity through improvements in land ownership, crop production and water management are critical to reducing poverty and ensuring food security as discussed below.
Ethiopia is a country where its economy is based on agriculture. Its total area is around 110.4 million hectares, of which 10.4 million hectares is covered by water. About 35.7 million hectares of the total land area is considered to be potentially suitable for agriculture, whereas only 15.7 million hectares of this land area is cultivated with crops (FAOSTAT, 2013). Within the agricultural farming, the commercial farming is limited, while the mixed farming of the smallholder agriculture and the pastoral livestock system are the leading ones. The smallholder agriculture accounts for over 95% of the cultivated land and production is largely characterized by subsistence farming, low levels of external inputs, dependency in rainfall, and limited integration into the market (Adenew, 2007). The total surface water irrigable land area is estimated at 5.3 million hectares. However, despite this huge potential the total area equipped for irrigation is estimated at about 290,000 hectares of which more than 62% (182,000 hectares) of land is developed. Only about 10 to 15 percent (12.1 million hectare) of the total land is presently covered by forest as a result of rapid deforestation during the last 35 years (FAOSTAT, 2013). The main causes for this rapid deforestation are extensive farming activities, overgrazing, and uncontrolled exploitation for fuel wood. Of the remainder, the majority part of the land is utilized by pastoralists and some land is dry and infertile for agriculture or any other use (MoA, 2013).
Agriculture is the major sector in the economy of Ethiopia, still accounting for an average of 44% of the GDP, about 80% of employment generation directly or indirectly, and 80% of export earnings. Crops are the main contributors of the GDP within the agriculture sector and accounts 29%, followed by livestock accounting 9%, and then forestry 4% (MoFED, 2013; CIA, 2013). The highlands (over 1500m above sea level) which amount approximately 44% of the highland mass are the most economic assets of the country. They shelter about 88 % of the whole population and account for more than 90% of the economic activity together with about 95% of the cultivated lands and 67% of the livestock population (MoA, 2013).
Land use and Ownership
According to the 2013 Central Statistics Authority (CSA) report, of the 13.5 million hectares private landholding cultivated area, grain crops accounts for 91 % of the total cultivated land and thus cereals occupied 9.6 million hectares, pulses occupied 1.9 million hectares, and oil crop occupied 0.82 million hectares. Sugarcane which accounts for 0.17% of the private landholding, occupied 0.023 million hectares as depicted in Figure 2.10 (CSA, 2013).
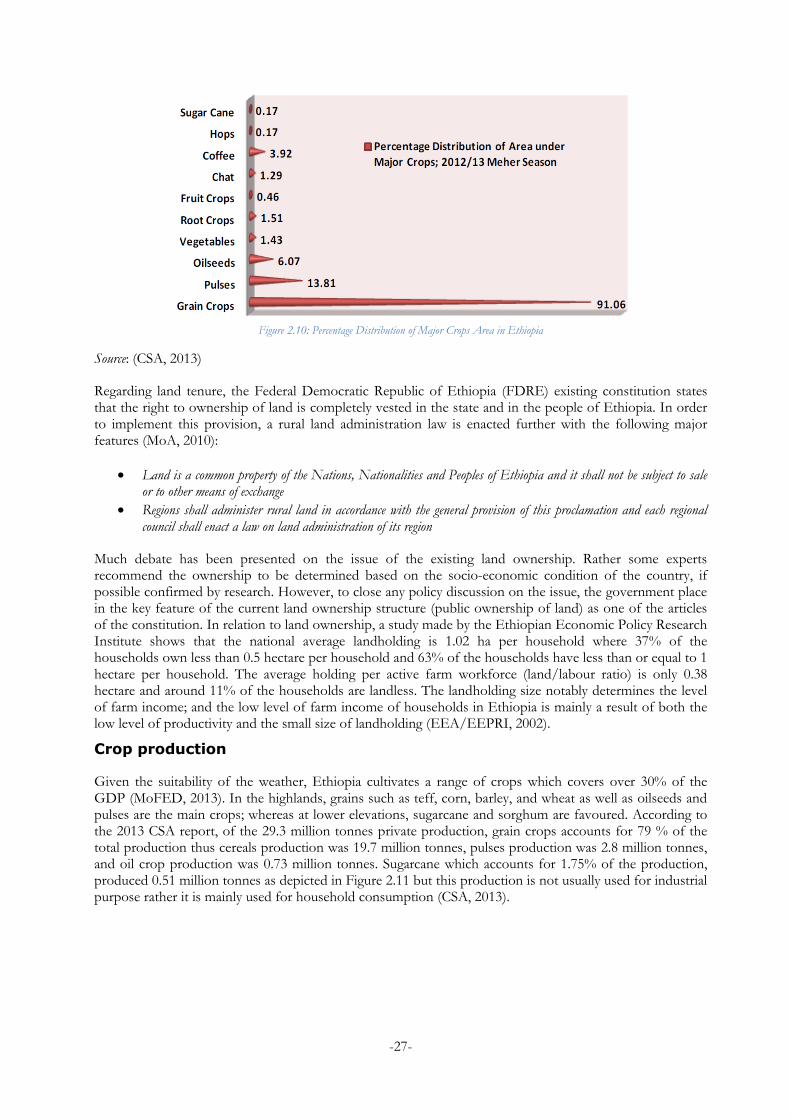
-27-
Figure 2.10: Percentage Distribution of Major Crops Area in Ethiopia
Source: (CSA, 2013)
Regarding land tenure, the Federal Democratic Republic of Ethiopia (FDRE) existing constitution states that the right to ownership of land is completely vested in the state and in the people of Ethiopia. In order to implement this provision, a rural land administration law is enacted further with the following major features (MoA, 2010):
Land is a common property of the Nations, Nationalities and Peoples of Ethiopia and it shall not be subject to sale or to other means of exchange
Regions shall administer rural land in accordance with the general provision of this proclamation and each regional council shall enact a law on land administration of its region
Much debate has been presented on the issue of the existing land ownership. Rather some experts recommend the ownership to be determined based on the socio-economic condition of the country, if possible confirmed by research. However, to close any policy discussion on the issue, the government place in the key feature of the current land ownership structure (public ownership of land) as one of the articles of the constitution. In relation to land ownership, a study made by the Ethiopian Economic Policy Research Institute shows that the national average landholding is 1.02 ha per household where 37% of the households own less than 0.5 hectare per household and 63% of the households have less than or equal to 1 hectare per household. The average holding per active farm workforce (land/labour ratio) is only 0.38 hectare and around 11% of the households are landless. The landholding size notably determines the level of farm income; and the low level of farm income of households in Ethiopia is mainly a result of both the low level of productivity and the small size of landholding (EEA/EEPRI, 2002).
Crop production
Given the suitability of the weather, Ethiopia cultivates a range of crops which covers over 30% of the GDP (MoFED, 2013). In the highlands, grains such as teff, corn, barley, and wheat as well as oilseeds and pulses are the main crops; whereas at lower elevations, sugarcane and sorghum are favoured. According to the 2013 CSA report, of the 29.3 million tonnes private production, grain crops accounts for 79 % of the total production thus cereals production was 19.7 million tonnes, pulses production was 2.8 million tonnes, and oil crop production was 0.73 million tonnes. Sugarcane which accounts for 1.75% of the production, produced 0.51 million tonnes as depicted in Figure 2.11 but this production is not usually used for industrial purpose rather it is mainly used for household consumption (CSA, 2013).
-28-
Figure 2.11: Percentage Distribution of Major Crops Production in Ethiopia
Source: (CSA, 2013)
With this, around 83 % of the Ethiopian population lives in rural areas where they depend highly on agriculture for their survival. Poverty is reinforced due to the low level of agricultural technology. Rainfall has frequently been irregular and as a result most of these rural inhabitants are susceptible to food insecurity and famine. Domestic production can only provide about 70% of the food requirement and every year roughly four to six million people require food assistance while the potential to be self sufficiency and even produce a surplus exists, with the appropriate agricultural investments (MoA, 2010).
Agricultural Policy
In 1993, the government of Ethiopia endorsed the Agricultural Development Led Industrialization (ADLI) strategy to create a link between agriculture and industry. This means that the economic deeds in general and the industrial growth in particular are led by agriculture in order to determine the direction of the economic development. Furthermore, this means that agricultural development plays the principal role by determining the pace and direction of industrial development. To implement this grand strategy, specific policies and strategies are put in place to support ADLI being the broad strategic direction that provides emphasis on agriculture. Among the various policies, the land use as well as forest conservation and utilization proclamations are reviewed in brief at this point as they have essential connection with the bioethanol development in order to explain the status and extent of the policies in protecting the concerns being raised in relation to land competition and deforestation (MoA, 2010; MoA, 2013).
Rural land administration and use proclamation
There is a proclamation on rural land administration and use (proclamation no 456/2005). The key objectives of this proclamation are (MoA, 2010; MoA, 2013):
To establish an information database that enables to identify the size, direction and use rights of the different types of landholdings in the country such as individual, regional states, and federal holdings
To resolve problems that arises in connection with encouraging individual farmers, pastoralists and agricultural investors and establishes a conducive system of rural land administration
To sustainably conserve and develop natural resources and pass over to the coming generation through the development of a sustainable rural land use planning based on the different agro-ecological zones of the country
To realize the objectives, the proclamation states a guiding land use master plan to be developed and employed by an authority in line with the constitution of regions so as to ensure the implementation of the proclamation.
-29-
Forest development, conservation, and utilization proclamation
There is a package of policy, strategy, and proclamation on forest development, conservation, and utilization endorsed in 2007. The policy and strategies are proclaimed legally under the proclamation number 542/2007 in title called a proclamation to provide development, conservation, and utilization of forests. The package addresses detailed issues on forest development, conservation, and utilization for both private and state forests. Since usually public properties are susceptible to distraction, the proclamation point to (MoA, 2010; MoA, 2013):
State forest will be properly developed, conserved, and utilized
State forest will be utilized in accordance with the management plan to be prepared and approved
Protected natural forests and forest lands will be demarcated and conserved for the purpose of environmental protection and conservation of history, culture and biodiversity
Unless in possession of written permit from the Ministry of Agriculture and Rural Development or the appropriate regional body, no person will, with in the state forest, (a) cut trees (b) settle temporarily or permanently (c) graze domestic animals (d) carry out hunting activity (e) carry cutting saws and any other tools used for cutting trees (f) keep beehives or extract honey
Ministry of agriculture and rural development is the responsible body to realize the proclamation by coordinating the appropriate regional and federal bodies and providing technical assist.
2.2.6.2 Energy Sector
The energy sector in Ethiopia has been heavily dependent on biomass despite the country’s enormous potential of various energy production resources. The lion share (88%) of the country's energy demand is covered by traditional energy sources such as charcoal, fuel wood, dung cakes, branches, and agricultural residues. The balance is met by commercial energy sources such as petroleum products and electricity (MoWE, 2013).
With regard to modern energy production, currently the country is able to generate 2,218 MW of electricity mostly from hydro dams (88%) and only about 46% of the population has access to electricity. The current holdings of the power sector is entirely controlled by the state, no private power supplier exists in the country though provisions are given to private investors. The rest comes from imported fossil fuels, where transport sector is entirely dependent on. As Ethiopia doesn’t have at the moment vehicles run by electricity and the rate of biofuel exploitation is low, petroleum import quantity is increasing each year. Similarly, the current holding of petroleum import is entirely controlled by the state (MoWE, 2013; EEPCo, 2013).
On the demand side, the most important issue is the supply of household fuels, the major user of energy sector with about 88% of the overall energy consumption in the country and is associated with massive deforestation as well as the resultant land degradation that increases scarcity of fuel wood compounded with Ethiopia's high population growth rate. The second most important sector in terms of energy consumption is services about 5% followed by industry with 4% share while transport is attributed to the remaining 3%. The consumption of energy in the country is directly related to the availability of energy source, size of the population, and price (MoWE, 2013)
In connection with sustainability, even though per capita energy consumption in Ethiopia is one of the lowest in the world, which was 100 kW in 2011, the gap between sustainable biomass supplies and demand is continuously widening. For instance, the 2008 daily fuel wood deficit was estimated to be around 65 million m3 and the demand of forest products for households goes above the annual incremental yield in many areas. As a result, the fuel wood price has roared high that forced people living in cities to switch to fossil fuel use (EPA, 2012; MoWE, 2013).
In general, the dependency of the hydro power plants on rain, the depletion of forests for biomass source, and the increase in price of petroleum products bear serious burden to fulfil the country’s energy need and thus it is mandatory to expand the energy mix from existing resources, giving priority on the basis of socio-economic and environmental benefits.
-30-
Energy Policy
In 1994, a comprehensive national energy policy which intends to ensure inexpensive development depending on the country's energy resource endowment and socio-economic policies was prepared. According to this policy document, the general energy sector directions of the government are (MME, 1994):
To enhance and expand the development and utilization of hydrological resources for power generation with emphasis on mini-hydropower development
To promote and strengthen the development and exploration for natural gas and oil
To greatly expand and strengthen agro-forestry programs
To provide alternative energy sources for the household, industry, agriculture, transport, and other sectors
To introduce energy conservation and energy saving measures in all sectors
To ensure the compatibility of energy resources development and utilization with ecologically and environmentally sound practices
To promote self reliance in the fields of technological and scientific development of energy resources
To ensure community participation, especially the participation of women, in all aspects of energy resources development and encourage the participation of the private sector in the development of the energy sector
To stage popularization campaign through mass media using various national languages to create awareness among the general public and decision makers regarding energy issues
To create appropriate institutional and legal frameworks to handle all energy issues
Looking upon modern type of energy sources, the policy document focuses on the development of rich energy sources of the country that include hydro, wind, geothermal, natural gas, and coal. Non-fossil fuel sources has also mentioned as alternative sources of transport energy in the proposal to decrease the use of petroleum products. But specific goals on the bioethanol fuel source the country should develop such as to how much and to what degree as well as with what incentive has not been mentioned in actual terms. It is only recently a concentrated effort has been taken on to blend with gasoline for use as a transport fuel.
The government has also taken steps to deal with the power sector issues. One important specific change that has been established is to outline operation and regulatory functions as well as liberalizing the sector to encourage private investment. To this effect, Proclamation No. 86/1997 has been endorsed to regulate the activities of electricity suppliers. It also provides for the establishment of the Ethiopian Electricity Agency (EEA), a regulatory authority, responsible along with other things for recommending tariffs and creates the principle of third party access to the grid to support private investment in the future. Meanwhile, regarding to liberalize the sector in order to motivate private investors, proclamation No. 37/1997 is endorsed. This endorsement allows the involvement of domestic private investors in the generation and supply of electrical power with an installed capacity of up to 25 MW. It also allows the involvement of foreign investors in generation and supply of electrical energy with an installed capacity of above 25 MW. The provision requires the development of small and medium scale capacity plants from diesel, gas, coal, hydro, and other sources. As incentives to private investors, council of ministers regulation No. 7/1996 and as modified in No. 36/1998 extends attractive package in the form of duty and profit tax exemptions (EEPCo, 2013).
2.2.6.3 Transport sector
Transport has both direct and indirect contributions to the development and expansion of any economy. Thus, over the last decade and a half, the share of transport sub-sector of Ethiopia has remained approximately at about 4.2% in the total GDP in addition to its crucial support in agricultural development, facilitation of trade, and domestic competitiveness. However, the share of transport in the total service sector has decreased to some extent from 10.8% in 1996 to about 9.5% in 2010. In the period of 1996 to 2010, real GDP has been increasing annually on average by 7.5%, the service sector by 9.4%, and transport services by 8.5%. This shows that the growth rate of the transport sub-sector has been less than the service sector but more than that of real GDP (EEA, 2012; MoFED, 2013).
-31-
Road transport, single Railway, Airline, and Ships are the conventional transport modes in Ethiopia having different levels of contributions depending on their coverage. In 2010, the percentage share in the total transport sector GDP of road was 50.1%, rail was 0%, water was 5.5%, air was 37.5%, and other subsectors were 7%. This shows the dominance of road transport mode in the country for transporting both passenger and goods. Thus, Ethiopia has been expanding its road transport infrastructure network by implementing a series of development activities in the last decade and a half. According to ERA, during the period 1997-2011, around 2380kms of rehabilitation, 5931kms of upgrading, 3662 kms of new construction, and 8694kms of heavy maintenance of federal roads were completed and in the regions, around 18,155kms of roads were rehabilitated and 18, 273kms were built. The annual average expansion of gravel and rural roads were also 1.4% and 6.5% respectively during the same period. Therefore, the road density per 1000 square kms has improved from 24 kms in 1997 to 49.1 kms in 2011. The density per 1000 people has also improved from 0.49 km in 1997 to 0.66 km in 2011. The amount of land located at a distance above 5 kms from all-weather roads was reduced from 79% in 1997 to 61.2% in 2011. The average distance to all-weather roads also improved from 21 kms in 1997 to 10.2 kms in 2011 (EEA, 2012).
As mentioned, the road transport plays a significant role in the movement of passengers and goods and activities are under way to improve the infrastructure of this sub-sector. As a result, the total number of vehicles that consume either gasoline or diesel is found to increase every year (Tekola, 2013). Thus, the transport sector consumes over 80% of the total petroleum products imported by the country each year. The greater share of the consumed fuel volume has been by road transport vehicles and currently it becomes a challenge because of the increase in quantity and price of the products. Energy supply and consumption trend over the years 1996 to 2010 shows that the share of petroleum fuel increased from 4.8% to 6% and the projected demand for 2030 shows that the share of petroleum will increase to 22.6%. Of the total consumption, the share of gasoline declined from 12% in 2000 to 7% in 2011. This is due to the fact that vehicle importers have been interested more to diesel driven vehicles because of gasoline cost. But in terms of quantity, gasoline showed 24% increase from 2000 to 2011. In terms of price also the total value spent on gasoline during the year 2011 raised by 310% from 2000 this means on average the money being spent for gasoline has been rising by 28% annually. As a result of this increment and huge money spending for petroleum products, the government adjusts the local selling price of the products and the subsidies on a regular basis to transfer some of the increment happening in the world market to consumers. At this time, compared to other petroleum products, gasoline gets no subsidies and its price build up includes all taxes (Excise, VAT, and Municipality) except for the stabilization fund. This was not the case in the past where heavy subsidy was given to maintain the price at minimum. The price build up of gasoline that tries to avoid subsidy and include all taxes as well as the price value itself is therefore favourable for future expansion of bioethanol (Tekola, 2013).
-32-
3 Analytical Framework
This chapter presents the frame work for the analysis by identifying the objectives of the work based on the previous chapters. Methodologies followed to collect, organise, and analyse data from the identified sources of information listed as well as the scope and limitations of the analysis are also defined.
3.1 Objectives
This research work is one part of a project on long-term bioenergy shift in sub-Sahara African countries carried out in collaboration with Stockholm Environment Institute (SEI). Recognizing the need to an extensive bioethanol development and use in Ethiopia to be a feasible and appropriate renewable energy technology, this thesis attempts to model and investigate the possible long-term bioethanol supply chain (raw material to finished product) shifts and the possible transport fuel substitution shift scenarios for the period of 2013 to 2030. In recognition of the potential common impacts, the thesis also attempts to analyse the socio-economic, technical, and environmental implications of the long-term shifts in order to suggest more sustainable and economically viable path. Therefore, the specific objectives of the thesis in relation to the questions raised in section 1.6 are:
To identify and give information on the current and future status of the supply chain
To identify and propose suitable and cost-effective blend that maximize the use
To determine the socio-economic, technical and environmental implications of the supply chain
To outline lessons using the experience in other countries
3.2 Methodology
The central element of the approach is modelling the shifts in bioethanol production supply chain and transport fuel substitution. Thus, to provide the necessary input data, different literatures were studied carefully, different policies were investigated, an assessment of resource potentials and a comprehensive analysis of the currently installed capacities of bioethanol plants were carried out, and a survey was conducted through questionnaire to identify the current ongoing multimillion projects in the country. With this, the projections of the shifts were generated via excel. The projections were based on quantity, social implications, economic implications, and environmental implications on an annual basis. Thus, the stages that may determine the feasibility and achievability of the system are categorized as follows.
3.2.1 The Methods of Data Collection and Data Sources
Primary Data
Primary data, collected for the first time, was collected through formal interviews, observations, and informal discussions with various actors and experts who entail directly or indirectly in bioethanol development and use.
The interviewees were mostly selected by contacting first the biofuels development coordination directorate, Ministry of Water and Energy, and then from other actors. Semi-structured open ended interview was carried out in order to get a chance to supplement and adjust questions if necessary. This allowed having a good interpersonal interaction and clarifying confusing questions in instances where more information is required. The interview with different stakeholders allowed obtaining their point of view on the study area. Prior to each interview, a goal was designed and in most of the interviews the stakeholders were asked to describe their role and their interaction with other actors in the bioethanol development. Sometimes, diverse views were presented on the same issue and thus the same questions were discussed with various stakeholders to reveal facts. The following are the key stakeholders with whom the interviews were conducted.
Ministry of Water and Energy (MoWE)
Sugar Corporation
Metehara Sugar Factory (MSF)
-33-
Ethiopian Petroleum Supply Enterprise (EPSE)
Ministry of Agriculture (MoA)
Ministry of Trade (MoT)
Ministry of Transport (MoT)
Ethiopian Environment Protection Agency (EEPA)
Oil Libya
Nile Petroleum
National Oil Ethiopia (NOC)
Yetebaberut Behrawi Petroleum (YBP)
The names of individuals, organizations they work for, and the date interviewed are listed in the bibliography section.
The direct observation and site visits were held to collect data in order to get the real picture of sugarcane plantation as well as bioethanol production and use. The site visit included two days at Metehara sugar factory, one day at Nile petroleum depot, and one day at Oil Libya blending site. The site visit was important to examine the farm as well as the industrial activities that include: cutting of sugarcane, sugarcane transport to the sugar factory, sugar extraction, bioethanol production, and bioethanol blending and distribution.
Informal discussion was also carried out with different individuals. This was intended to obtain the perspective of individuals as well as to gather more information. Discussion with sugar factories workers was carried out to know more about the technical and social practices. Discussion with individual car owners was carried out in order to evaluate the positions with regard to using blended fuel. Informal discussion was also carried out with departments of different Ministries to clarify the status of policies and their implications to bioethanol production. Therefore, some of the data collected using the aforementioned techniques are:
Bioethanol fuel production and consumption trend
Gasoline fuel import and consumption trend
Pre-tax gasoline price trend
Average conversion ratios of the supply chain
Primary resources potential and conditions
Secondary Data
Secondary data, already been collected and analyzed, was mainly collected through literature review undertaken during the various phases to formulate the thesis that include: the theoretical background information presentation, the case study of other countries bioethanol experience, the study of current and future bioethanol production and use potential in Ethiopia, the study of barriers and implications of bioethanol production and use, etc. Both electronic and printed sources were reviewed including reports, journals, strategic documents, newspaper articles, workshop papers, books, committee proposals, research papers, web pages, policy documents, and proclamations relevant to the study. The literature review was used to build the study on existing experiences since the area of study for Ethiopia is new. Therefore, some of the secondary data that were collected are:
Average fuel ethanol and gasoline properties
Implication for food security
Implication for net energy balance and GHG emission
Implication for urban air quality
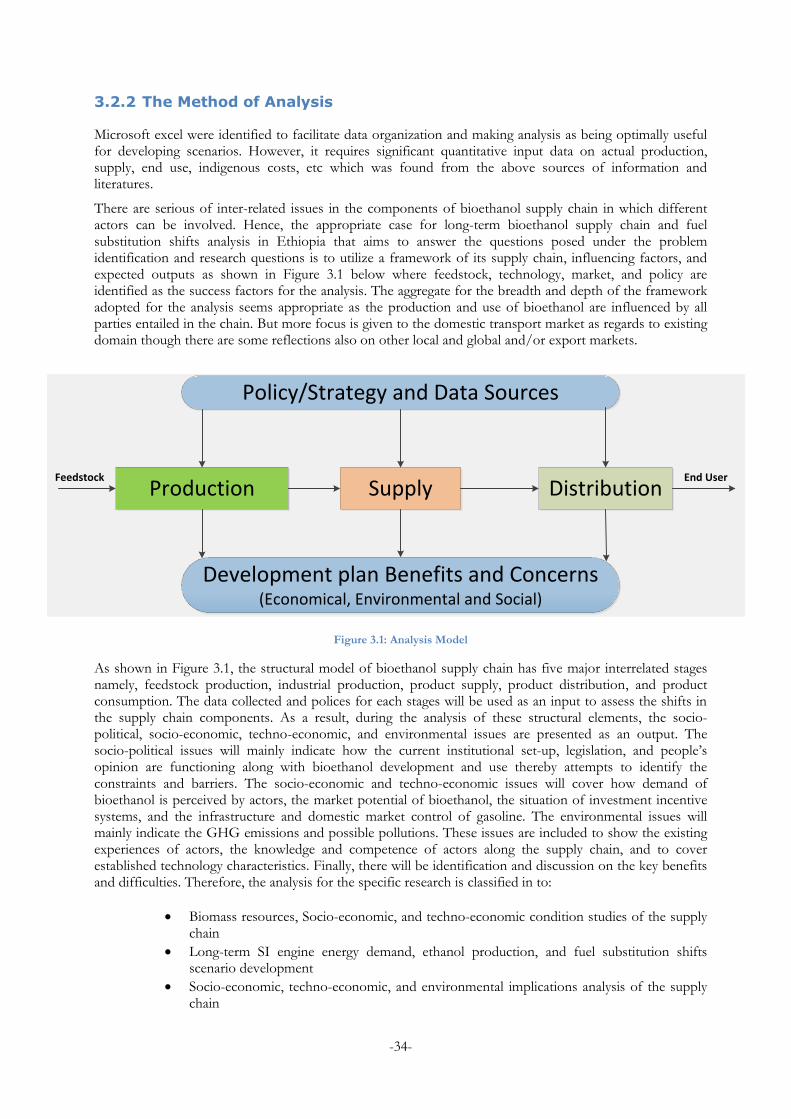
-34-
3.2.2 The Method of Analysis
Microsoft excel were identified to facilitate data organization and making analysis as being optimally useful for developing scenarios. However, it requires significant quantitative input data on actual production, supply, end use, indigenous costs, etc which was found from the above sources of information and literatures.
There are serious of inter-related issues in the components of bioethanol supply chain in which different actors can be involved. Hence, the appropriate case for long-term bioethanol supply chain and fuel substitution shifts analysis in Ethiopia that aims to answer the questions posed under the problem identification and research questions is to utilize a framework of its supply chain, influencing factors, and expected outputs as shown in Figure 3.1 below where feedstock, technology, market, and policy are identified as the success factors for the analysis. The aggregate for the breadth and depth of the framework adopted for the analysis seems appropriate as the production and use of bioethanol are influenced by all parties entailed in the chain. But more focus is given to the domestic transport market as regards to existing domain though there are some reflections also on other local and global and/or export markets.
Production Supply Distribution
Development plan Benefits and Concerns(Economical, Environmental and Social)
Policy/Strategy and Data Sources
Feedstock End User
Figure 3.1: Analysis Model
As shown in Figure 3.1, the structural model of bioethanol supply chain has five major interrelated stages namely, feedstock production, industrial production, product supply, product distribution, and product consumption. The data collected and polices for each stages will be used as an input to assess the shifts in the supply chain components. As a result, during the analysis of these structural elements, the socio-political, socio-economic, techno-economic, and environmental issues are presented as an output. The socio-political issues will mainly indicate how the current institutional set-up, legislation, and people’s opinion are functioning along with bioethanol development and use thereby attempts to identify the constraints and barriers. The socio-economic and techno-economic issues will cover how demand of bioethanol is perceived by actors, the market potential of bioethanol, the situation of investment incentive systems, and the infrastructure and domestic market control of gasoline. The environmental issues will mainly indicate the GHG emissions and possible pollutions. These issues are included to show the existing experiences of actors, the knowledge and competence of actors along the supply chain, and to cover established technology characteristics. Finally, there will be identification and discussion on the key benefits and difficulties. Therefore, the analysis for the specific research is classified in to:
Biomass resources, Socio-economic, and techno-economic condition studies of the supply chain
Long-term SI engine energy demand, ethanol production, and fuel substitution shifts scenario development
Socio-economic, techno-economic, and environmental implications analysis of the supply chain
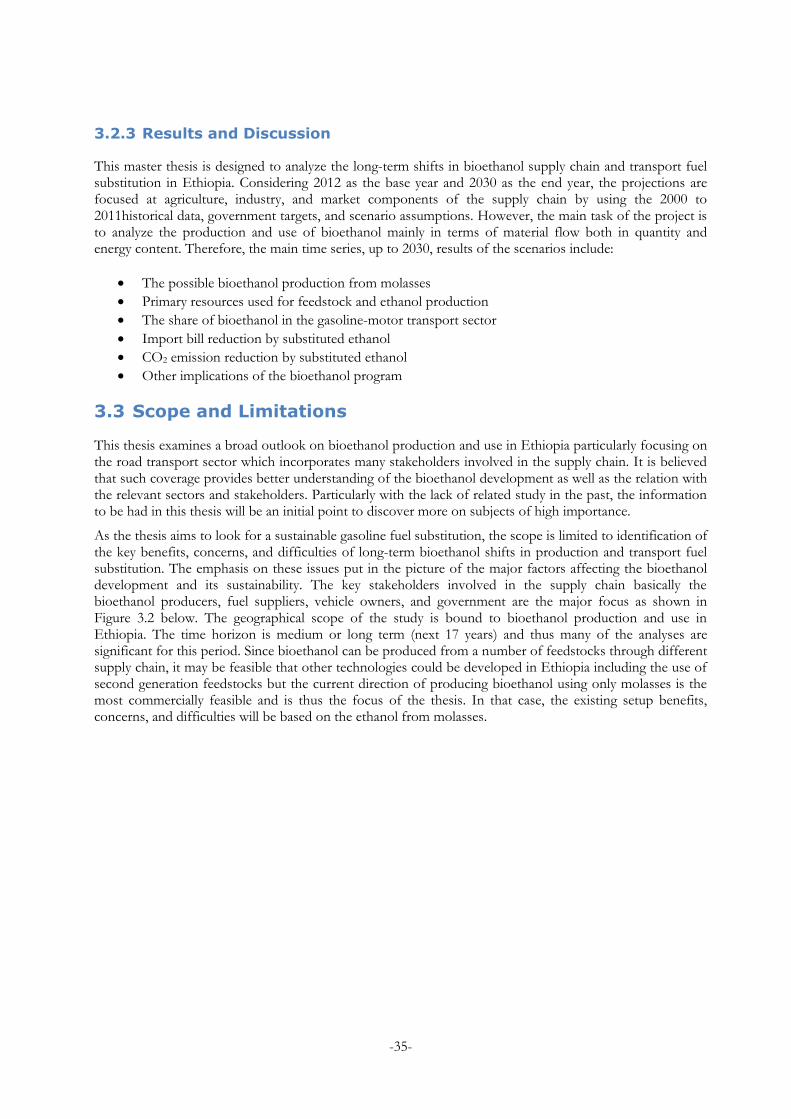
-35-
3.2.3 Results and Discussion
This master thesis is designed to analyze the long-term shifts in bioethanol supply chain and transport fuel substitution in Ethiopia. Considering 2012 as the base year and 2030 as the end year, the projections are focused at agriculture, industry, and market components of the supply chain by using the 2000 to 2011historical data, government targets, and scenario assumptions. However, the main task of the project is to analyze the production and use of bioethanol mainly in terms of material flow both in quantity and energy content. Therefore, the main time series, up to 2030, results of the scenarios include:
The possible bioethanol production from molasses
Primary resources used for feedstock and ethanol production
The share of bioethanol in the gasoline-motor transport sector
Import bill reduction by substituted ethanol
CO2 emission reduction by substituted ethanol
Other implications of the bioethanol program
3.3 Scope and Limitations
This thesis examines a broad outlook on bioethanol production and use in Ethiopia particularly focusing on the road transport sector which incorporates many stakeholders involved in the supply chain. It is believed that such coverage provides better understanding of the bioethanol development as well as the relation with the relevant sectors and stakeholders. Particularly with the lack of related study in the past, the information to be had in this thesis will be an initial point to discover more on subjects of high importance.
As the thesis aims to look for a sustainable gasoline fuel substitution, the scope is limited to identification of the key benefits, concerns, and difficulties of long-term bioethanol shifts in production and transport fuel substitution. The emphasis on these issues put in the picture of the major factors affecting the bioethanol development and its sustainability. The key stakeholders involved in the supply chain basically the bioethanol producers, fuel suppliers, vehicle owners, and government are the major focus as shown in Figure 3.2 below. The geographical scope of the study is bound to bioethanol production and use in Ethiopia. The time horizon is medium or long term (next 17 years) and thus many of the analyses are significant for this period. Since bioethanol can be produced from a number of feedstocks through different supply chain, it may be feasible that other technologies could be developed in Ethiopia including the use of second generation feedstocks but the current direction of producing bioethanol using only molasses is the most commercially feasible and is thus the focus of the thesis. In that case, the existing setup benefits, concerns, and difficulties will be based on the ethanol from molasses.
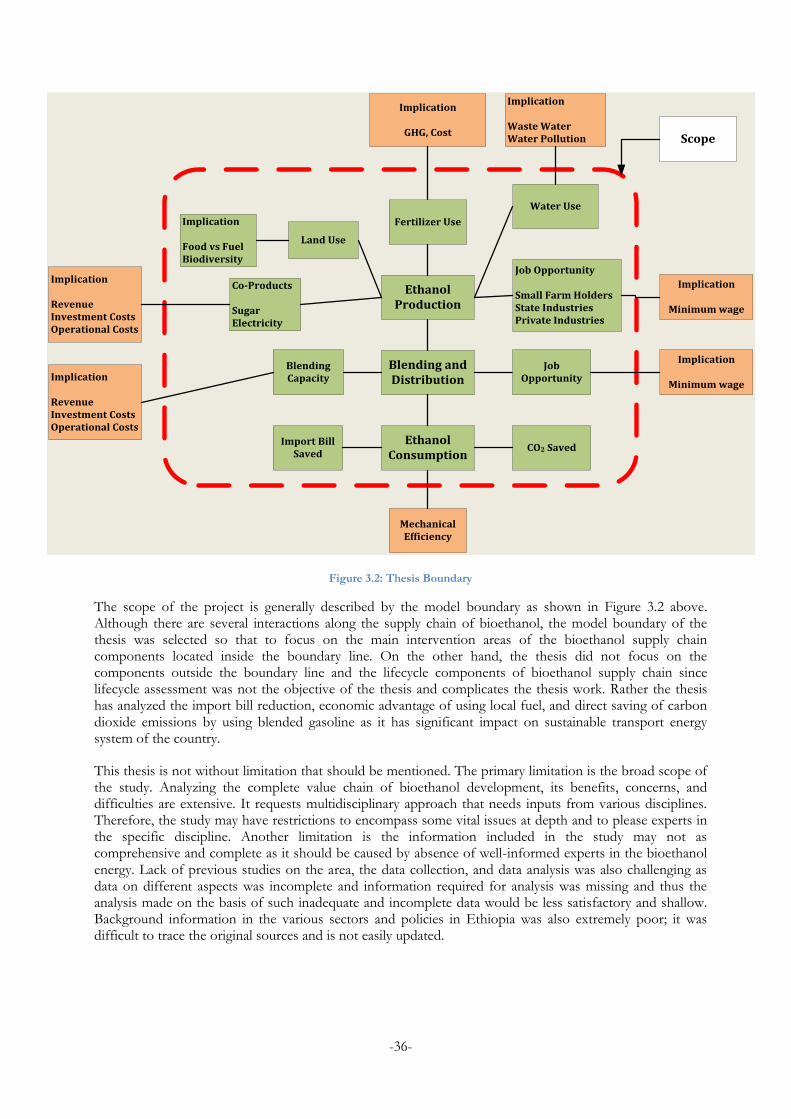
-36-
Ethanol Production
Fertilizer Use
Water Use
Co-Products
SugarElectricity
Land Use
Blending and Distribution
Ethanol Consumption
CO2 Saved
Mechanical Efficiency
Job Opportunity
Small Farm HoldersState IndustriesPrivate Industries
Implication
Minimum wage
Implication
RevenueInvestment CostsOperational Costs
Implication
GHG, Cost
Implication
Waste WaterWater Pollution Scope
Import Bill Saved
Job Opportunity
Blending Capacity
Implication
Food vs FuelBiodiversity
Implication
Minimum wageImplication
RevenueInvestment CostsOperational Costs
Figure 3.2: Thesis Boundary
The scope of the project is generally described by the model boundary as shown in Figure 3.2 above. Although there are several interactions along the supply chain of bioethanol, the model boundary of the thesis was selected so that to focus on the main intervention areas of the bioethanol supply chain components located inside the boundary line. On the other hand, the thesis did not focus on the components outside the boundary line and the lifecycle components of bioethanol supply chain since lifecycle assessment was not the objective of the thesis and complicates the thesis work. Rather the thesis has analyzed the import bill reduction, economic advantage of using local fuel, and direct saving of carbon dioxide emissions by using blended gasoline as it has significant impact on sustainable transport energy system of the country.
This thesis is not without limitation that should be mentioned. The primary limitation is the broad scope of the study. Analyzing the complete value chain of bioethanol development, its benefits, concerns, and difficulties are extensive. It requests multidisciplinary approach that needs inputs from various disciplines. Therefore, the study may have restrictions to encompass some vital issues at depth and to please experts in the specific discipline. Another limitation is the information included in the study may not as comprehensive and complete as it should be caused by absence of well-informed experts in the bioethanol energy. Lack of previous studies on the area, the data collection, and data analysis was also challenging as data on different aspects was incomplete and information required for analysis was missing and thus the analysis made on the basis of such inadequate and incomplete data would be less satisfactory and shallow. Background information in the various sectors and policies in Ethiopia was also extremely poor; it was difficult to trace the original sources and is not easily updated.
-37-
4 Modeling and Analysis of Long-term Shifts
A key aspect of Climate Resilient Green Economy (CRGE) strategy of Ethiopia is to identify energy sources that will not only expand the energy mix across the country, but will do so in a way that integrates environmental protections and associated socio-economic benefits. Thus, this chapter presents the output of the conducted survey, site visit, and secondary data in order to model the possible shifts in bioethanol production and bioethanol blend transition based on the current and future ethanol development plans of the country. The data gathered through a questionnaire and from secondary sources were organized and analyzed using Microsoft Excel, software that can also employ for scenario development. To analyse the benefits and associated concerns, total ethanol production projection and three scenarios of bioethanol blend transition driven by the CRGE strategy, biofuels strategy, and energy policy of the country are developed using the historical and projected trends of SI engine energy demand and Pre-tax gasoline price. Therefore, the tables and graphs developed from the Excel sheet are presented and discussed so that to select favourable blend type on a merit of socio-economic and environmental implications to provide a verification of being on the right track with the CRGE strategy of the country.
4.1 Agricultural Conditions and Potential
The literature review and feedback from stakeholders were considered as the starting points to understand the current conditions and future plans of the bioethanol program. Thus, the potential assessments of primary resources for agriculture have great importance and will be presented in the following sections. All the results from the literatures and conducted survey in this section are inevitably used to indicate the benefits and concerns of sugarcane plantation in Ethiopia in order to achieve the targets.
4.1.1 Feedstock
Currently, there are three sugar factories, which rely for feedstock only on sugarcane, a perennial tropical crop that can be harvested 4 to 5 times before reseeding and which is then processed into raw sugar and molasses. Sugarcane is generally grown between the latitudes of 300 North and South primarily because it requires a warm climate together with enough natural or artificial water. Due to this reason the farm areas of all the sugar factories in Ethiopia are located in areas considered suitable for the cultivation of sugarcane and the factories are also constructed near to these plantations for the ease of transportation. Table 4.1 below presents the general description of the current sugarcane production areas of the existing sugar factories (Sugar Corporation, 2013; Teshome, 2013; Tibebu, 2013).
Table 4.1: Sugar Factories Location and Climate in Ethiopia
Desciption Name of Sugar Factories
Wonji/shoa Metehara Fincha
Distance from the capital (km) 110 210 340
Annual Rainfall (mm) 800 550 1250
Average Min. Temperature (0C) 15.3 17.5 15
Average Max. Temperature (0C) 26.9 32.6 31
Altitude (m a.s.l) 1540 950 1650
Source: (Sugar Corporation, 2013)
Sugarcane cultivation in Ethiopia follows the ratoon system, a method of harvesting a crop which leaves the roots and the lower parts of the plant uncut. Prior to first time plantation, intensive soil preparation and necessary fertilizers application are taken place. During plantation the plants are handled with artificial fertilizers including filter cake from the bioethanol plant. 12 to18 months later, the sugarcane is ready to be cut and it is a usual practice to burn down the sugarcane in order to make manual harvesting simpler and avoid possible attack by insects and animals with in the farm during cutting and harvesting. Next to cutting, the sugarcane is loaded on trailers and transported to the sugar factories. The same plantation keeps on delivering sugarcane for 7 to 8 years and when the yield decreases a new cycle will start. Table 4.2 below summarizes the current status and future (2015) expansion scheme of the plantations that the existing and new sugar factories are able to cultivate and forecast to cultivate respectively (Sugar Corporation, 2013; Teshome, 2013; Tibebu, 2013).
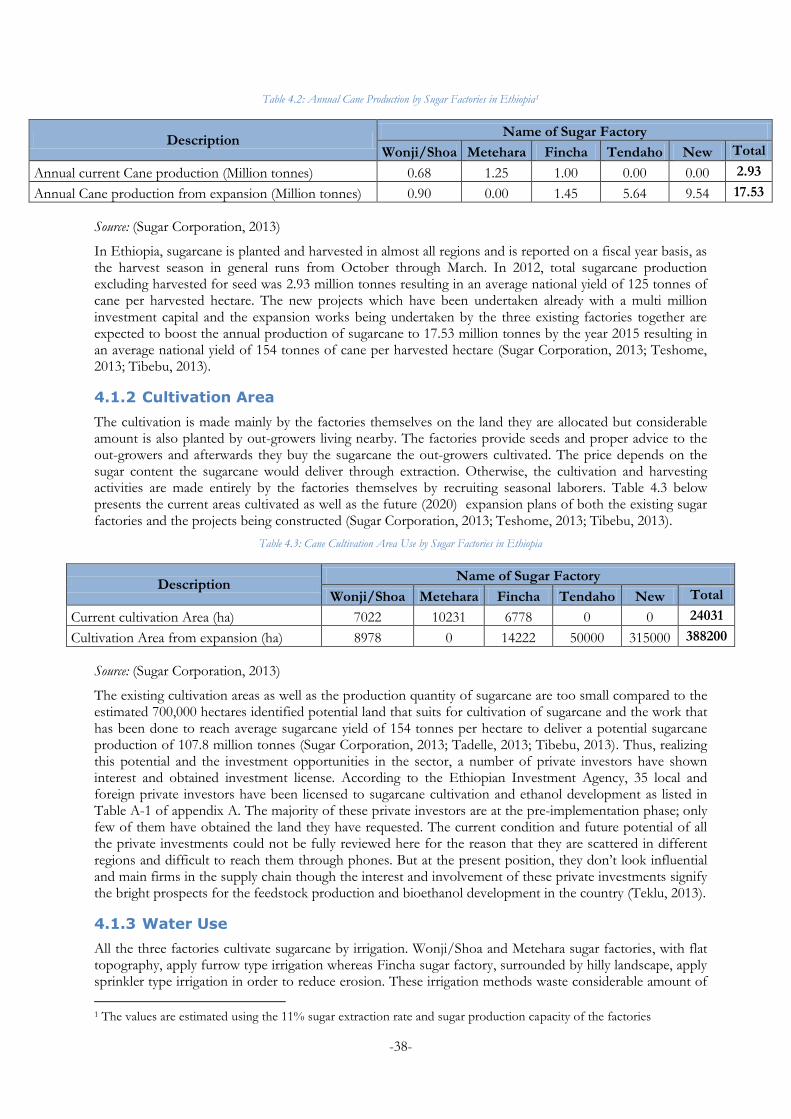
-38-
Table 4.2: Annual Cane Production by Sugar Factories in Ethiopia1
Description Name of Sugar Factory
Wonji/Shoa Metehara Fincha Tendaho New Total
Annual current Cane production (Million tonnes) 0.68 1.25 1.00 0.00 0.00 2.93
Annual Cane production from expansion (Million tonnes) 0.90 0.00 1.45 5.64 9.54 17.53
Source: (Sugar Corporation, 2013)
In Ethiopia, sugarcane is planted and harvested in almost all regions and is reported on a fiscal year basis, as the harvest season in general runs from October through March. In 2012, total sugarcane production excluding harvested for seed was 2.93 million tonnes resulting in an average national yield of 125 tonnes of cane per harvested hectare. The new projects which have been undertaken already with a multi million investment capital and the expansion works being undertaken by the three existing factories together are expected to boost the annual production of sugarcane to 17.53 million tonnes by the year 2015 resulting in an average national yield of 154 tonnes of cane per harvested hectare (Sugar Corporation, 2013; Teshome, 2013; Tibebu, 2013).
4.1.2 Cultivation Area
The cultivation is made mainly by the factories themselves on the land they are allocated but considerable amount is also planted by out-growers living nearby. The factories provide seeds and proper advice to the out-growers and afterwards they buy the sugarcane the out-growers cultivated. The price depends on the sugar content the sugarcane would deliver through extraction. Otherwise, the cultivation and harvesting activities are made entirely by the factories themselves by recruiting seasonal laborers. Table 4.3 below presents the current areas cultivated as well as the future (2020) expansion plans of both the existing sugar factories and the projects being constructed (Sugar Corporation, 2013; Teshome, 2013; Tibebu, 2013).
Table 4.3: Cane Cultivation Area Use by Sugar Factories in Ethiopia
Description Name of Sugar Factory
Wonji/Shoa Metehara Fincha Tendaho New Total
Current cultivation Area (ha) 7022 10231 6778 0 0 24031
Cultivation Area from expansion (ha) 8978 0 14222 50000 315000 388200
Source: (Sugar Corporation, 2013)
The existing cultivation areas as well as the production quantity of sugarcane are too small compared to the estimated 700,000 hectares identified potential land that suits for cultivation of sugarcane and the work that has been done to reach average sugarcane yield of 154 tonnes per hectare to deliver a potential sugarcane production of 107.8 million tonnes (Sugar Corporation, 2013; Tadelle, 2013; Tibebu, 2013). Thus, realizing this potential and the investment opportunities in the sector, a number of private investors have shown interest and obtained investment license. According to the Ethiopian Investment Agency, 35 local and foreign private investors have been licensed to sugarcane cultivation and ethanol development as listed in Table A-1 of appendix A. The majority of these private investors are at the pre-implementation phase; only few of them have obtained the land they have requested. The current condition and future potential of all the private investments could not be fully reviewed here for the reason that they are scattered in different regions and difficult to reach them through phones. But at the present position, they don’t look influential and main firms in the supply chain though the interest and involvement of these private investments signify the bright prospects for the feedstock production and bioethanol development in the country (Teklu, 2013).
4.1.3 Water Use
All the three factories cultivate sugarcane by irrigation. Wonji/Shoa and Metehara sugar factories, with flat topography, apply furrow type irrigation whereas Fincha sugar factory, surrounded by hilly landscape, apply sprinkler type irrigation in order to reduce erosion. These irrigation methods waste considerable amount of
1 The values are estimated using the 11% sugar extraction rate and sugar production capacity of the factories
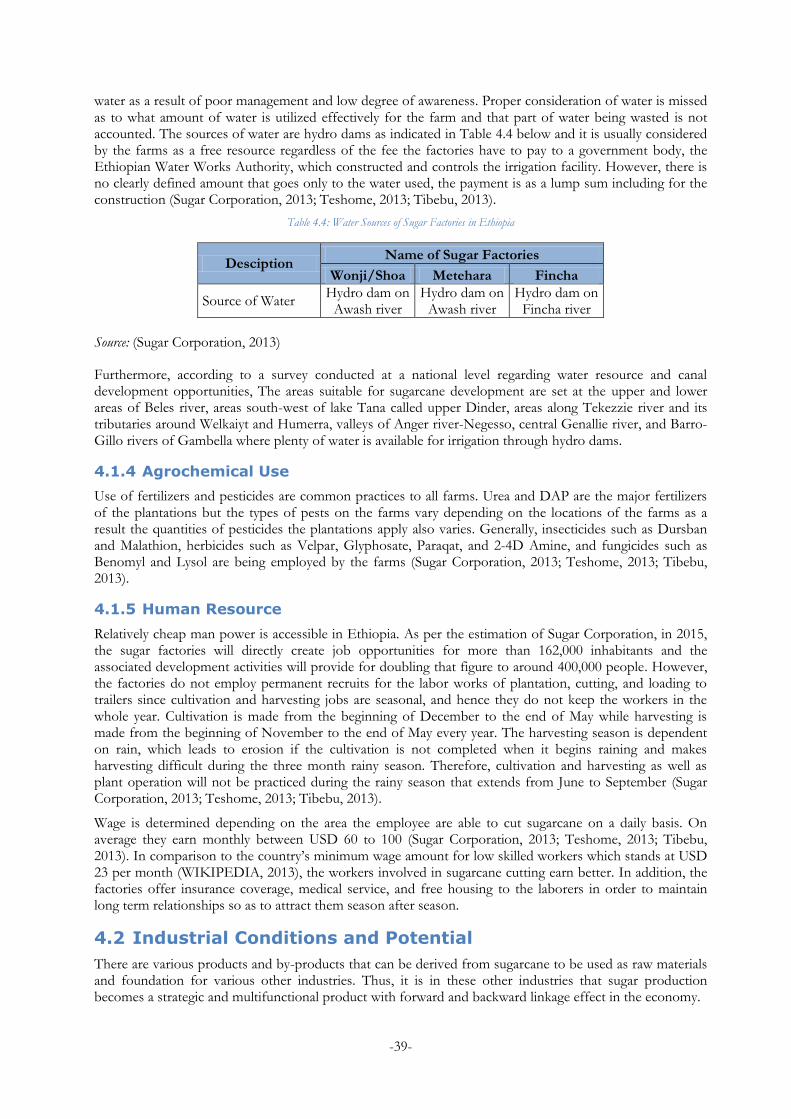
-39-
water as a result of poor management and low degree of awareness. Proper consideration of water is missed as to what amount of water is utilized effectively for the farm and that part of water being wasted is not accounted. The sources of water are hydro dams as indicated in Table 4.4 below and it is usually considered by the farms as a free resource regardless of the fee the factories have to pay to a government body, the Ethiopian Water Works Authority, which constructed and controls the irrigation facility. However, there is no clearly defined amount that goes only to the water used, the payment is as a lump sum including for the construction (Sugar Corporation, 2013; Teshome, 2013; Tibebu, 2013).
Table 4.4: Water Sources of Sugar Factories in Ethiopia
Desciption Name of Sugar Factories
Wonji/Shoa Metehara Fincha
Source of Water Hydro dam on
Awash river Hydro dam on
Awash river Hydro dam on
Fincha river
Source: (Sugar Corporation, 2013)
Furthermore, according to a survey conducted at a national level regarding water resource and canal development opportunities, The areas suitable for sugarcane development are set at the upper and lower areas of Beles river, areas south-west of lake Tana called upper Dinder, areas along Tekezzie river and its tributaries around Welkaiyt and Humerra, valleys of Anger river-Negesso, central Genallie river, and Barro-Gillo rivers of Gambella where plenty of water is available for irrigation through hydro dams.
4.1.4 Agrochemical Use
Use of fertilizers and pesticides are common practices to all farms. Urea and DAP are the major fertilizers of the plantations but the types of pests on the farms vary depending on the locations of the farms as a result the quantities of pesticides the plantations apply also varies. Generally, insecticides such as Dursban and Malathion, herbicides such as Velpar, Glyphosate, Paraqat, and 2-4D Amine, and fungicides such as Benomyl and Lysol are being employed by the farms (Sugar Corporation, 2013; Teshome, 2013; Tibebu, 2013).
4.1.5 Human Resource
Relatively cheap man power is accessible in Ethiopia. As per the estimation of Sugar Corporation, in 2015, the sugar factories will directly create job opportunities for more than 162,000 inhabitants and the associated development activities will provide for doubling that figure to around 400,000 people. However, the factories do not employ permanent recruits for the labor works of plantation, cutting, and loading to trailers since cultivation and harvesting jobs are seasonal, and hence they do not keep the workers in the whole year. Cultivation is made from the beginning of December to the end of May while harvesting is made from the beginning of November to the end of May every year. The harvesting season is dependent on rain, which leads to erosion if the cultivation is not completed when it begins raining and makes harvesting difficult during the three month rainy season. Therefore, cultivation and harvesting as well as plant operation will not be practiced during the rainy season that extends from June to September (Sugar Corporation, 2013; Teshome, 2013; Tibebu, 2013).
Wage is determined depending on the area the employee are able to cut sugarcane on a daily basis. On average they earn monthly between USD 60 to 100 (Sugar Corporation, 2013; Teshome, 2013; Tibebu, 2013). In comparison to the country’s minimum wage amount for low skilled workers which stands at USD 23 per month (WIKIPEDIA, 2013), the workers involved in sugarcane cutting earn better. In addition, the factories offer insurance coverage, medical service, and free housing to the laborers in order to maintain long term relationships so as to attract them season after season.
4.2 Industrial Conditions and Potential
There are various products and by-products that can be derived from sugarcane to be used as raw materials and foundation for various other industries. Thus, it is in these other industries that sugar production becomes a strategic and multifunctional product with forward and backward linkage effect in the economy.
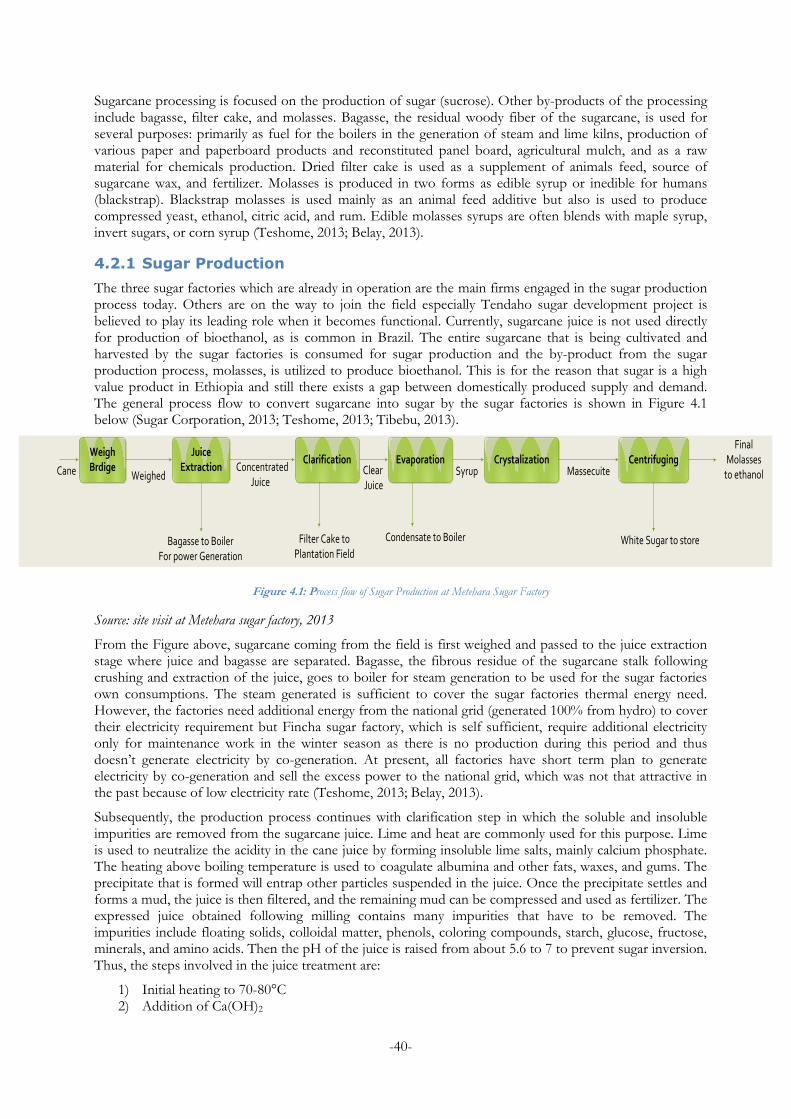
-40-
Sugarcane processing is focused on the production of sugar (sucrose). Other by-products of the processing include bagasse, filter cake, and molasses. Bagasse, the residual woody fiber of the sugarcane, is used for several purposes: primarily as fuel for the boilers in the generation of steam and lime kilns, production of various paper and paperboard products and reconstituted panel board, agricultural mulch, and as a raw material for chemicals production. Dried filter cake is used as a supplement of animals feed, source of sugarcane wax, and fertilizer. Molasses is produced in two forms as edible syrup or inedible for humans (blackstrap). Blackstrap molasses is used mainly as an animal feed additive but also is used to produce compressed yeast, ethanol, citric acid, and rum. Edible molasses syrups are often blends with maple syrup, invert sugars, or corn syrup (Teshome, 2013; Belay, 2013).
4.2.1 Sugar Production
The three sugar factories which are already in operation are the main firms engaged in the sugar production process today. Others are on the way to join the field especially Tendaho sugar development project is believed to play its leading role when it becomes functional. Currently, sugarcane juice is not used directly for production of bioethanol, as is common in Brazil. The entire sugarcane that is being cultivated and harvested by the sugar factories is consumed for sugar production and the by-product from the sugar production process, molasses, is utilized to produce bioethanol. This is for the reason that sugar is a high value product in Ethiopia and still there exists a gap between domestically produced supply and demand. The general process flow to convert sugarcane into sugar by the sugar factories is shown in Figure 4.1 below (Sugar Corporation, 2013; Teshome, 2013; Tibebu, 2013).
Weigh Brdige
Juice Extraction
Clarification Evaporation Crystalization Centrifuging
Weighed Concentrated
Juice Clear Juice
Syrup Massecuite Cane
Bagasse to BoilerFor power Generation
Filter Cake to Plantation Field
Condensate to Boiler White Sugar to store
Final Molasses
to ethanol
Figure 4.1: Process flow of Sugar Production at Metehara Sugar Factory
Source: site visit at Metehara sugar factory, 2013
From the Figure above, sugarcane coming from the field is first weighed and passed to the juice extraction stage where juice and bagasse are separated. Bagasse, the fibrous residue of the sugarcane stalk following crushing and extraction of the juice, goes to boiler for steam generation to be used for the sugar factories own consumptions. The steam generated is sufficient to cover the sugar factories thermal energy need. However, the factories need additional energy from the national grid (generated 100% from hydro) to cover their electricity requirement but Fincha sugar factory, which is self sufficient, require additional electricity only for maintenance work in the winter season as there is no production during this period and thus doesn’t generate electricity by co-generation. At present, all factories have short term plan to generate electricity by co-generation and sell the excess power to the national grid, which was not that attractive in the past because of low electricity rate (Teshome, 2013; Belay, 2013).
Subsequently, the production process continues with clarification step in which the soluble and insoluble impurities are removed from the sugarcane juice. Lime and heat are commonly used for this purpose. Lime is used to neutralize the acidity in the cane juice by forming insoluble lime salts, mainly calcium phosphate. The heating above boiling temperature is used to coagulate albumina and other fats, waxes, and gums. The precipitate that is formed will entrap other particles suspended in the juice. Once the precipitate settles and forms a mud, the juice is then filtered, and the remaining mud can be compressed and used as fertilizer. The expressed juice obtained following milling contains many impurities that have to be removed. The impurities include floating solids, colloidal matter, phenols, coloring compounds, starch, glucose, fructose, minerals, and amino acids. Then the pH of the juice is raised from about 5.6 to 7 to prevent sugar inversion. Thus, the steps involved in the juice treatment are:
1) Initial heating to 70-80°C 2) Addition of Ca(OH)2
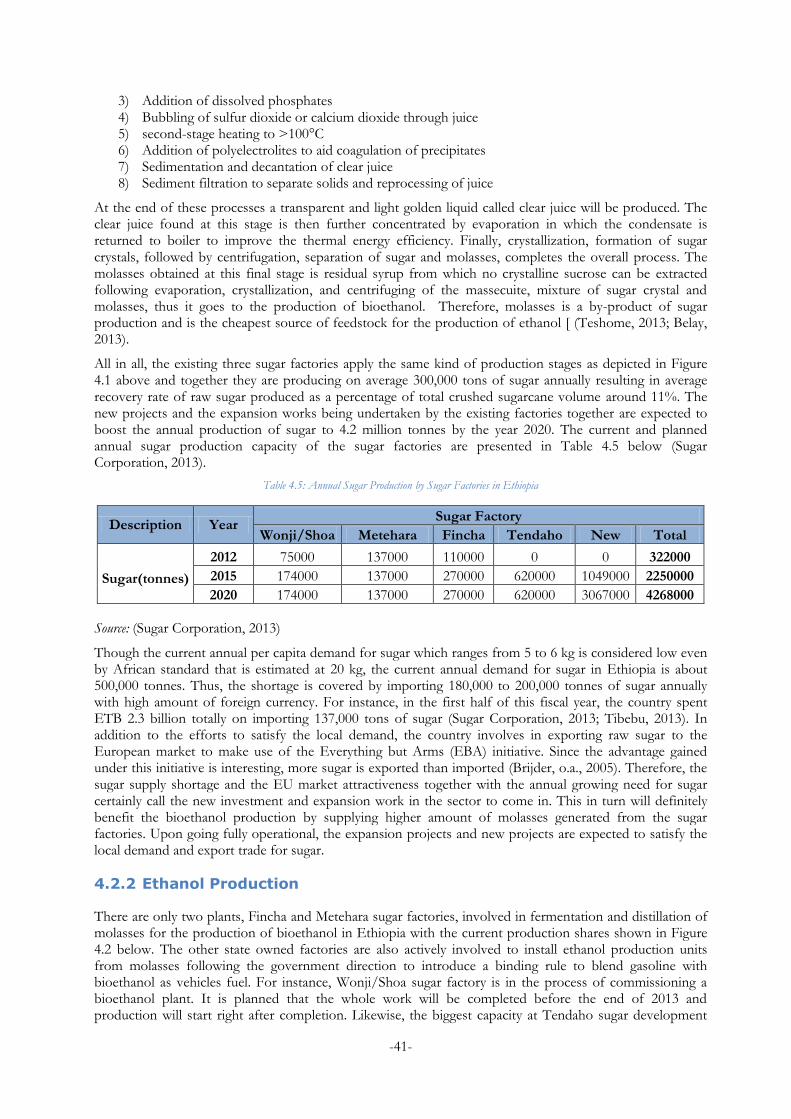
-41-
3) Addition of dissolved phosphates 4) Bubbling of sulfur dioxide or calcium dioxide through juice 5) second-stage heating to >100°C 6) Addition of polyelectrolites to aid coagulation of precipitates 7) Sedimentation and decantation of clear juice 8) Sediment filtration to separate solids and reprocessing of juice
At the end of these processes a transparent and light golden liquid called clear juice will be produced. The clear juice found at this stage is then further concentrated by evaporation in which the condensate is returned to boiler to improve the thermal energy efficiency. Finally, crystallization, formation of sugar crystals, followed by centrifugation, separation of sugar and molasses, completes the overall process. The molasses obtained at this final stage is residual syrup from which no crystalline sucrose can be extracted following evaporation, crystallization, and centrifuging of the massecuite, mixture of sugar crystal and molasses, thus it goes to the production of bioethanol. Therefore, molasses is a by-product of sugar production and is the cheapest source of feedstock for the production of ethanol [ (Teshome, 2013; Belay, 2013).
All in all, the existing three sugar factories apply the same kind of production stages as depicted in Figure 4.1 above and together they are producing on average 300,000 tons of sugar annually resulting in average recovery rate of raw sugar produced as a percentage of total crushed sugarcane volume around 11%. The new projects and the expansion works being undertaken by the existing factories together are expected to boost the annual production of sugar to 4.2 million tonnes by the year 2020. The current and planned annual sugar production capacity of the sugar factories are presented in Table 4.5 below (Sugar Corporation, 2013).
Table 4.5: Annual Sugar Production by Sugar Factories in Ethiopia
Description Year Sugar Factory
Wonji/Shoa Metehara Fincha Tendaho New Total
Sugar(tonnes)
2012 75000 137000 110000 0 0 322000
2015 174000 137000 270000 620000 1049000 2250000
2020 174000 137000 270000 620000 3067000 4268000
Source: (Sugar Corporation, 2013)
Though the current annual per capita demand for sugar which ranges from 5 to 6 kg is considered low even by African standard that is estimated at 20 kg, the current annual demand for sugar in Ethiopia is about 500,000 tonnes. Thus, the shortage is covered by importing 180,000 to 200,000 tonnes of sugar annually with high amount of foreign currency. For instance, in the first half of this fiscal year, the country spent ETB 2.3 billion totally on importing 137,000 tons of sugar (Sugar Corporation, 2013; Tibebu, 2013). In addition to the efforts to satisfy the local demand, the country involves in exporting raw sugar to the European market to make use of the Everything but Arms (EBA) initiative. Since the advantage gained under this initiative is interesting, more sugar is exported than imported (Brijder, o.a., 2005). Therefore, the sugar supply shortage and the EU market attractiveness together with the annual growing need for sugar certainly call the new investment and expansion work in the sector to come in. This in turn will definitely benefit the bioethanol production by supplying higher amount of molasses generated from the sugar factories. Upon going fully operational, the expansion projects and new projects are expected to satisfy the local demand and export trade for sugar.
4.2.2 Ethanol Production
There are only two plants, Fincha and Metehara sugar factories, involved in fermentation and distillation of molasses for the production of bioethanol in Ethiopia with the current production shares shown in Figure 4.2 below. The other state owned factories are also actively involved to install ethanol production units from molasses following the government direction to introduce a binding rule to blend gasoline with bioethanol as vehicles fuel. For instance, Wonji/Shoa sugar factory is in the process of commissioning a bioethanol plant. It is planned that the whole work will be completed before the end of 2013 and production will start right after completion. Likewise, the biggest capacity at Tendaho sugar development
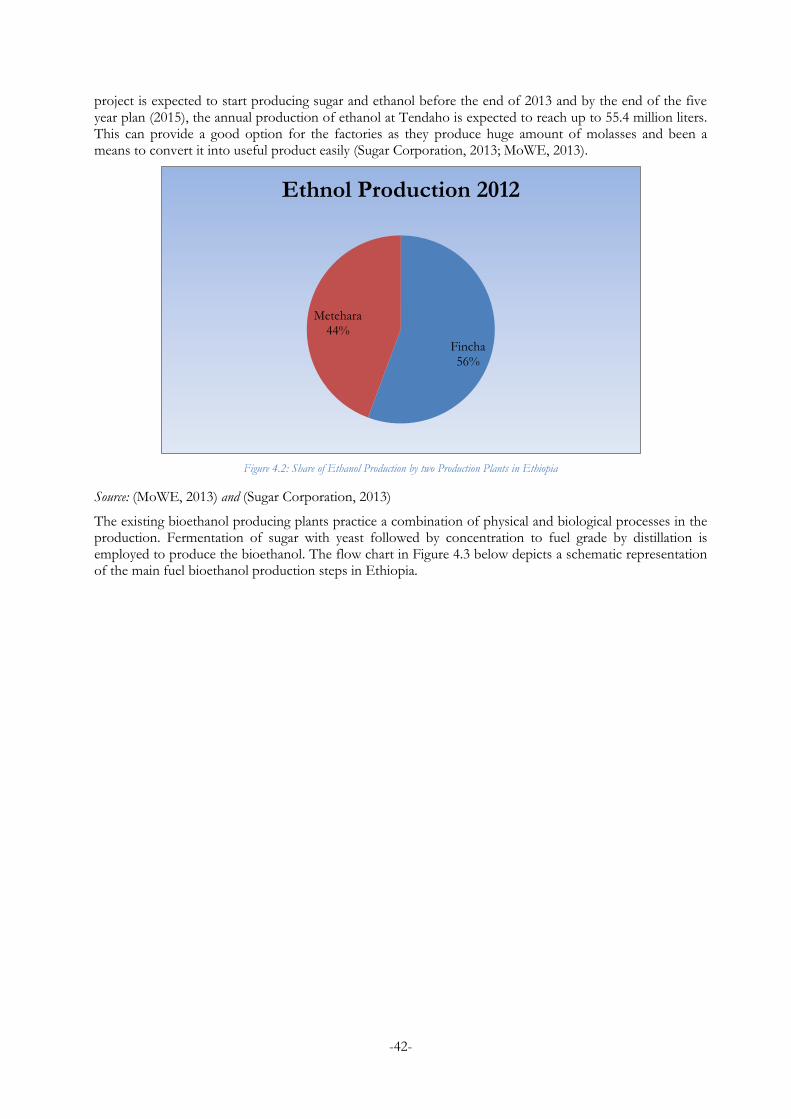
-42-
project is expected to start producing sugar and ethanol before the end of 2013 and by the end of the five year plan (2015), the annual production of ethanol at Tendaho is expected to reach up to 55.4 million liters. This can provide a good option for the factories as they produce huge amount of molasses and been a means to convert it into useful product easily (Sugar Corporation, 2013; MoWE, 2013).
Figure 4.2: Share of Ethanol Production by two Production Plants in Ethiopia
Source: (MoWE, 2013) and (Sugar Corporation, 2013)
The existing bioethanol producing plants practice a combination of physical and biological processes in the production. Fermentation of sugar with yeast followed by concentration to fuel grade by distillation is employed to produce the bioethanol. The flow chart in Figure 4.3 below depicts a schematic representation of the main fuel bioethanol production steps in Ethiopia.
Fincha 56%
Metehara 44%
Ethnol Production 2012
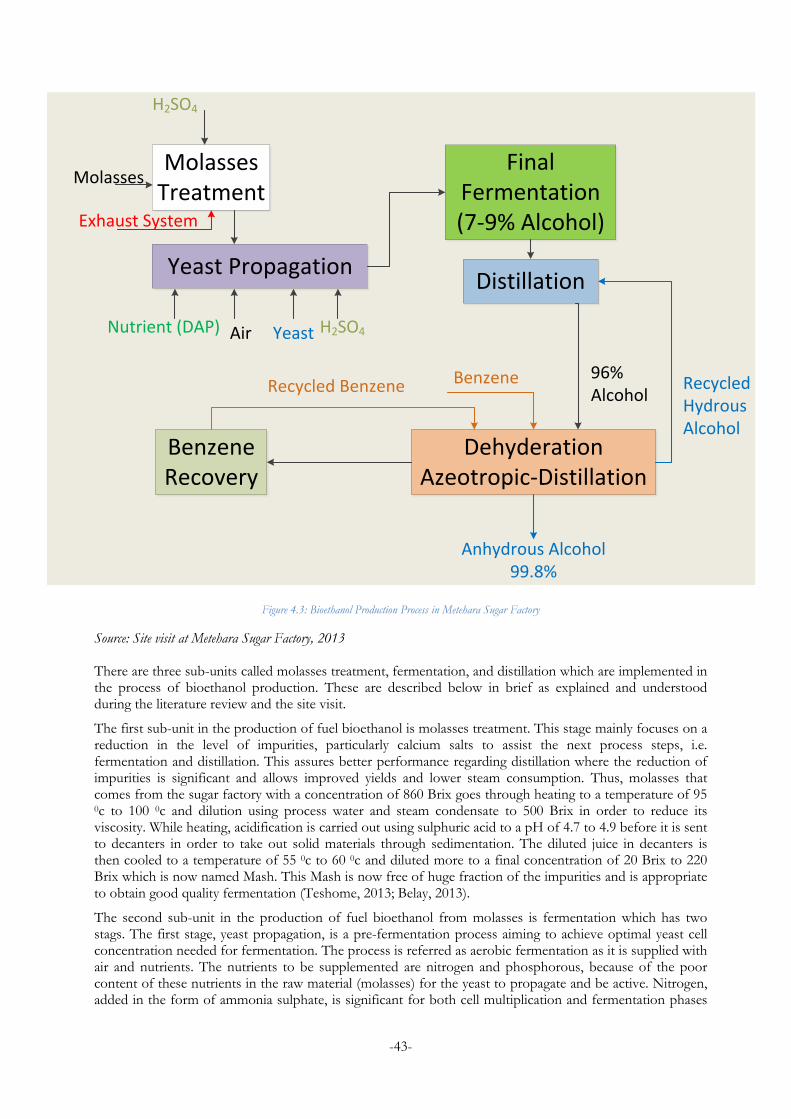
-43-
Molasses Treatment
Yeast Propagation
Final Fermentation(7-9% Alcohol)
Distillation
DehyderationAzeotropic-Distillation
Benzene Recovery
H2SO4
Molasses
Exhaust System
BenzeneRecycled Benzene96% Alcohol
Recycled Hydrous Alcohol
Anhydrous Alcohol99.8%
Nutrient (DAP) Air Yeast H2SO4
Figure 4.3: Bioethanol Production Process in Metehara Sugar Factory
Source: Site visit at Metehara Sugar Factory, 2013 There are three sub-units called molasses treatment, fermentation, and distillation which are implemented in the process of bioethanol production. These are described below in brief as explained and understood during the literature review and the site visit.
The first sub-unit in the production of fuel bioethanol is molasses treatment. This stage mainly focuses on a reduction in the level of impurities, particularly calcium salts to assist the next process steps, i.e. fermentation and distillation. This assures better performance regarding distillation where the reduction of impurities is significant and allows improved yields and lower steam consumption. Thus, molasses that comes from the sugar factory with a concentration of 860 Brix goes through heating to a temperature of 95 0c to 100 0c and dilution using process water and steam condensate to 500 Brix in order to reduce its viscosity. While heating, acidification is carried out using sulphuric acid to a pH of 4.7 to 4.9 before it is sent to decanters in order to take out solid materials through sedimentation. The diluted juice in decanters is then cooled to a temperature of 55 0c to 60 0c and diluted more to a final concentration of 20 Brix to 220 Brix which is now named Mash. This Mash is now free of huge fraction of the impurities and is appropriate to obtain good quality fermentation (Teshome, 2013; Belay, 2013).
The second sub-unit in the production of fuel bioethanol from molasses is fermentation which has two stags. The first stage, yeast propagation, is a pre-fermentation process aiming to achieve optimal yeast cell concentration needed for fermentation. The process is referred as aerobic fermentation as it is supplied with air and nutrients. The nutrients to be supplemented are nitrogen and phosphorous, because of the poor content of these nutrients in the raw material (molasses) for the yeast to propagate and be active. Nitrogen, added in the form of ammonia sulphate, is significant for both cell multiplication and fermentation phases
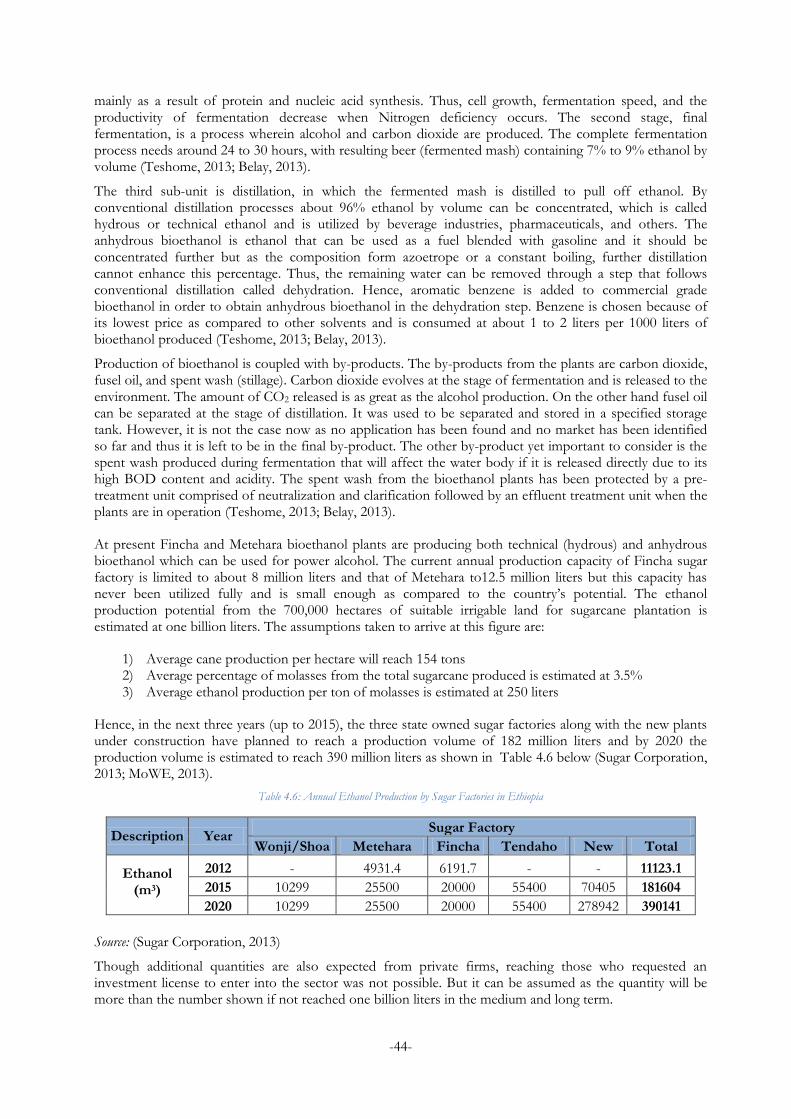
-44-
mainly as a result of protein and nucleic acid synthesis. Thus, cell growth, fermentation speed, and the productivity of fermentation decrease when Nitrogen deficiency occurs. The second stage, final fermentation, is a process wherein alcohol and carbon dioxide are produced. The complete fermentation process needs around 24 to 30 hours, with resulting beer (fermented mash) containing 7% to 9% ethanol by volume (Teshome, 2013; Belay, 2013).
The third sub-unit is distillation, in which the fermented mash is distilled to pull off ethanol. By conventional distillation processes about 96% ethanol by volume can be concentrated, which is called hydrous or technical ethanol and is utilized by beverage industries, pharmaceuticals, and others. The anhydrous bioethanol is ethanol that can be used as a fuel blended with gasoline and it should be concentrated further but as the composition form azoetrope or a constant boiling, further distillation cannot enhance this percentage. Thus, the remaining water can be removed through a step that follows conventional distillation called dehydration. Hence, aromatic benzene is added to commercial grade bioethanol in order to obtain anhydrous bioethanol in the dehydration step. Benzene is chosen because of its lowest price as compared to other solvents and is consumed at about 1 to 2 liters per 1000 liters of bioethanol produced (Teshome, 2013; Belay, 2013).
Production of bioethanol is coupled with by-products. The by-products from the plants are carbon dioxide, fusel oil, and spent wash (stillage). Carbon dioxide evolves at the stage of fermentation and is released to the environment. The amount of CO2 released is as great as the alcohol production. On the other hand fusel oil can be separated at the stage of distillation. It was used to be separated and stored in a specified storage tank. However, it is not the case now as no application has been found and no market has been identified so far and thus it is left to be in the final by-product. The other by-product yet important to consider is the spent wash produced during fermentation that will affect the water body if it is released directly due to its high BOD content and acidity. The spent wash from the bioethanol plants has been protected by a pre-treatment unit comprised of neutralization and clarification followed by an effluent treatment unit when the plants are in operation (Teshome, 2013; Belay, 2013).
At present Fincha and Metehara bioethanol plants are producing both technical (hydrous) and anhydrous bioethanol which can be used for power alcohol. The current annual production capacity of Fincha sugar factory is limited to about 8 million liters and that of Metehara to12.5 million liters but this capacity has never been utilized fully and is small enough as compared to the country’s potential. The ethanol production potential from the 700,000 hectares of suitable irrigable land for sugarcane plantation is estimated at one billion liters. The assumptions taken to arrive at this figure are:
1) Average cane production per hectare will reach 154 tons 2) Average percentage of molasses from the total sugarcane produced is estimated at 3.5% 3) Average ethanol production per ton of molasses is estimated at 250 liters
Hence, in the next three years (up to 2015), the three state owned sugar factories along with the new plants under construction have planned to reach a production volume of 182 million liters and by 2020 the production volume is estimated to reach 390 million liters as shown in Table 4.6 below (Sugar Corporation, 2013; MoWE, 2013).
Table 4.6: Annual Ethanol Production by Sugar Factories in Ethiopia
Description Year Sugar Factory
Wonji/Shoa Metehara Fincha Tendaho New Total
Ethanol (m3)
2012 - 4931.4 6191.7 - - 11123.1
2015 10299 25500 20000 55400 70405 181604
2020 10299 25500 20000 55400 278942 390141
Source: (Sugar Corporation, 2013)
Though additional quantities are also expected from private firms, reaching those who requested an investment license to enter into the sector was not possible. But it can be assumed as the quantity will be more than the number shown if not reached one billion liters in the medium and long term.
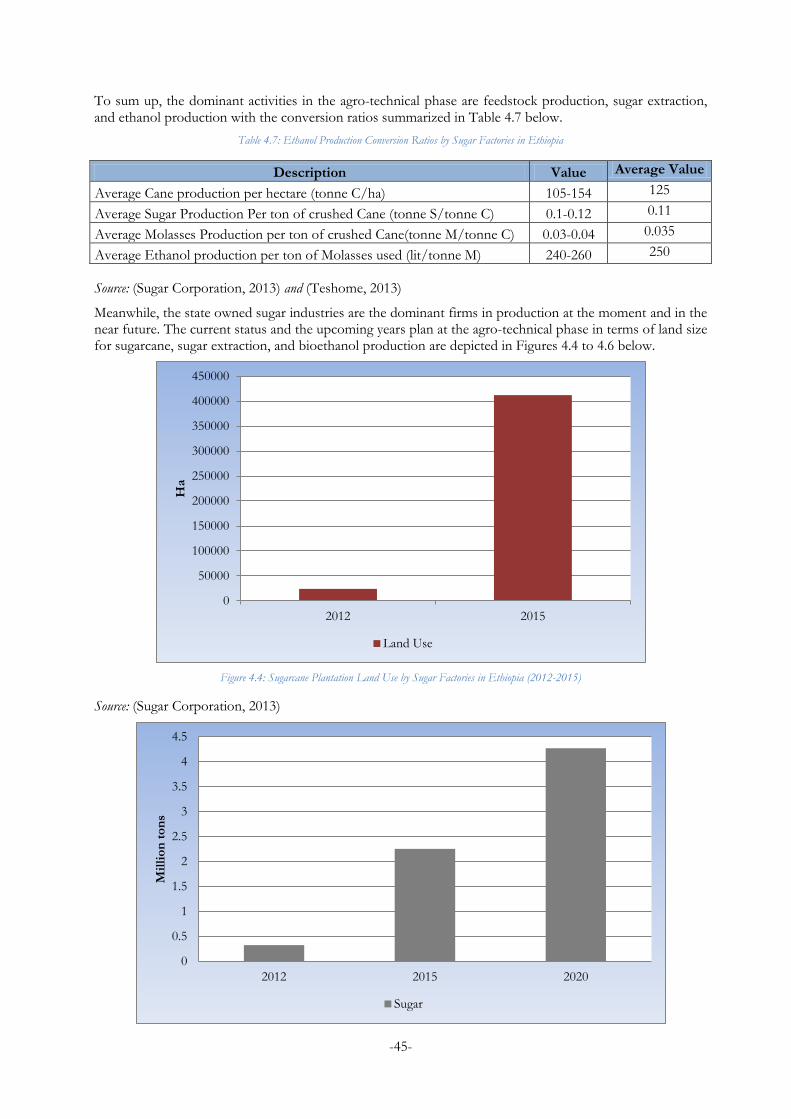
-45-
To sum up, the dominant activities in the agro-technical phase are feedstock production, sugar extraction, and ethanol production with the conversion ratios summarized in Table 4.7 below.
Table 4.7: Ethanol Production Conversion Ratios by Sugar Factories in Ethiopia
Description Value Average Value
Average Cane production per hectare (tonne C/ha) 105-154 125
Average Sugar Production Per ton of crushed Cane (tonne S/tonne C) 0.1-0.12 0.11
Average Molasses Production per ton of crushed Cane(tonne M/tonne C) 0.03-0.04 0.035
Average Ethanol production per ton of Molasses used (lit/tonne M) 240-260 250
Source: (Sugar Corporation, 2013) and (Teshome, 2013)
Meanwhile, the state owned sugar industries are the dominant firms in production at the moment and in the near future. The current status and the upcoming years plan at the agro-technical phase in terms of land size for sugarcane, sugar extraction, and bioethanol production are depicted in Figures 4.4 to 4.6 below.
Figure 4.4: Sugarcane Plantation Land Use by Sugar Factories in Ethiopia (2012-2015)
Source: (Sugar Corporation, 2013)
0
50000
100000
150000
200000
250000
300000
350000
400000
450000
2012 2015
Ha
Land Use
0
0.5
1
1.5
2
2.5
3
3.5
4
4.5
2012 2015 2020
Mil
lio
n t
on
s
Sugar
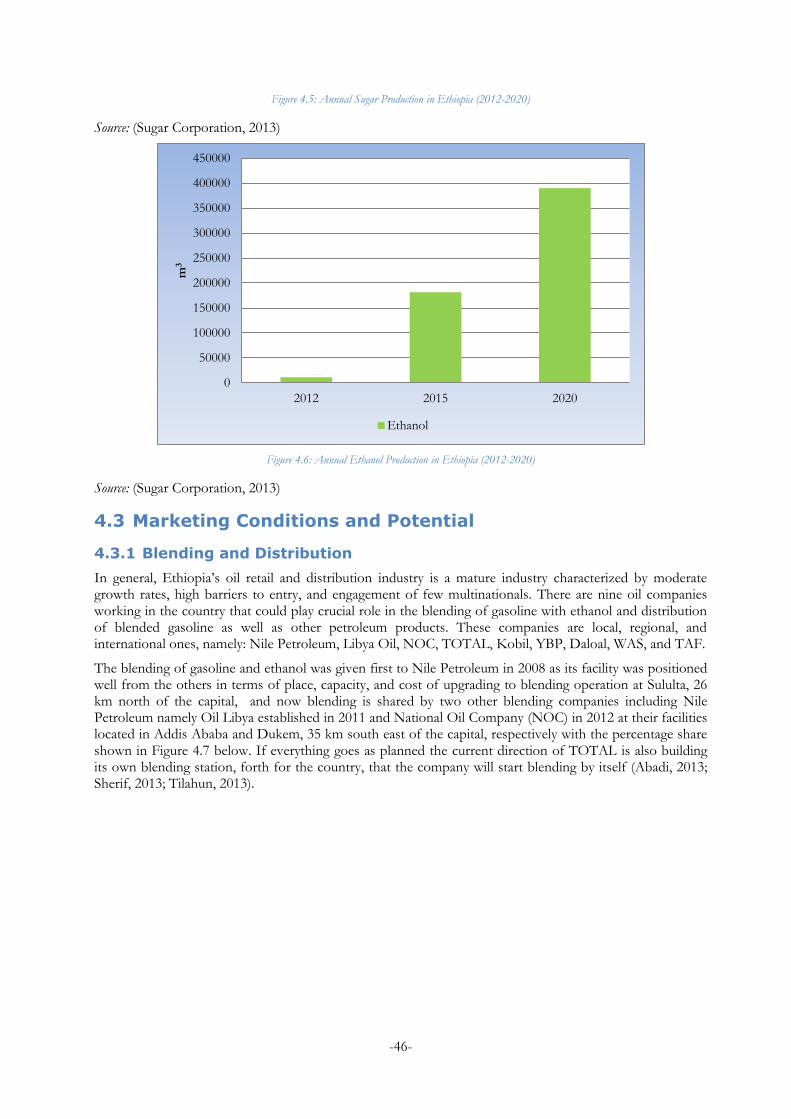
-46-
Figure 4.5: Annual Sugar Production in Ethiopia (2012-2020)
Source: (Sugar Corporation, 2013)
Figure 4.6: Annual Ethanol Production in Ethiopia (2012-2020)
Source: (Sugar Corporation, 2013)
4.3 Marketing Conditions and Potential
4.3.1 Blending and Distribution
In general, Ethiopia’s oil retail and distribution industry is a mature industry characterized by moderate growth rates, high barriers to entry, and engagement of few multinationals. There are nine oil companies working in the country that could play crucial role in the blending of gasoline with ethanol and distribution of blended gasoline as well as other petroleum products. These companies are local, regional, and international ones, namely: Nile Petroleum, Libya Oil, NOC, TOTAL, Kobil, YBP, Daloal, WAS, and TAF.
The blending of gasoline and ethanol was given first to Nile Petroleum in 2008 as its facility was positioned well from the others in terms of place, capacity, and cost of upgrading to blending operation at Sululta, 26 km north of the capital, and now blending is shared by two other blending companies including Nile Petroleum namely Oil Libya established in 2011 and National Oil Company (NOC) in 2012 at their facilities located in Addis Ababa and Dukem, 35 km south east of the capital, respectively with the percentage share shown in Figure 4.7 below. If everything goes as planned the current direction of TOTAL is also building its own blending station, forth for the country, that the company will start blending by itself (Abadi, 2013; Sherif, 2013; Tilahun, 2013).
0
50000
100000
150000
200000
250000
300000
350000
400000
450000
2012 2015 2020
m3
Ethanol
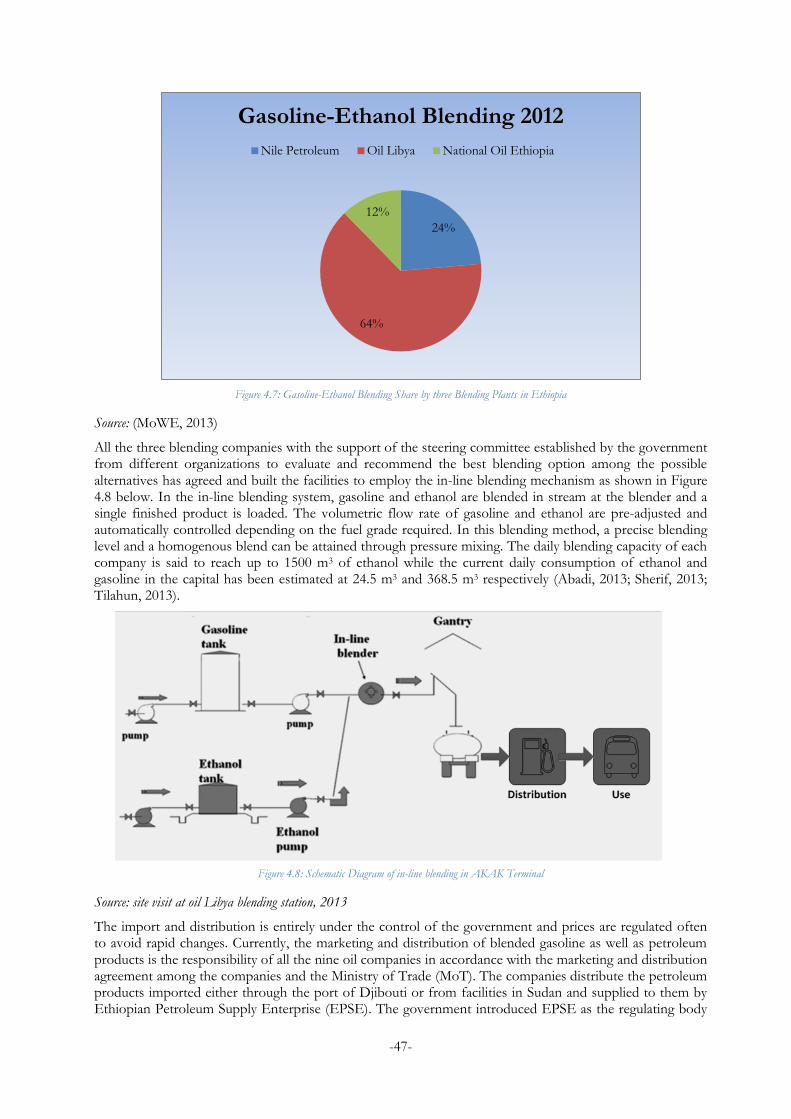
-47-
Figure 4.7: Gasoline-Ethanol Blending Share by three Blending Plants in Ethiopia
Source: (MoWE, 2013)
All the three blending companies with the support of the steering committee established by the government from different organizations to evaluate and recommend the best blending option among the possible alternatives has agreed and built the facilities to employ the in-line blending mechanism as shown in Figure 4.8 below. In the in-line blending system, gasoline and ethanol are blended in stream at the blender and a single finished product is loaded. The volumetric flow rate of gasoline and ethanol are pre-adjusted and automatically controlled depending on the fuel grade required. In this blending method, a precise blending level and a homogenous blend can be attained through pressure mixing. The daily blending capacity of each company is said to reach up to 1500 m3 of ethanol while the current daily consumption of ethanol and gasoline in the capital has been estimated at 24.5 m3 and 368.5 m3 respectively (Abadi, 2013; Sherif, 2013; Tilahun, 2013).
Figure 4.8: Schematic Diagram of in-line blending in AKAK Terminal
Source: site visit at oil Libya blending station, 2013
The import and distribution is entirely under the control of the government and prices are regulated often to avoid rapid changes. Currently, the marketing and distribution of blended gasoline as well as petroleum products is the responsibility of all the nine oil companies in accordance with the marketing and distribution agreement among the companies and the Ministry of Trade (MoT). The companies distribute the petroleum products imported either through the port of Djibouti or from facilities in Sudan and supplied to them by Ethiopian Petroleum Supply Enterprise (EPSE). The government introduced EPSE as the regulating body
24%
64%
12%
Gasoline-Ethanol Blending 2012
Nile Petroleum Oil Libya National Oil Ethiopia
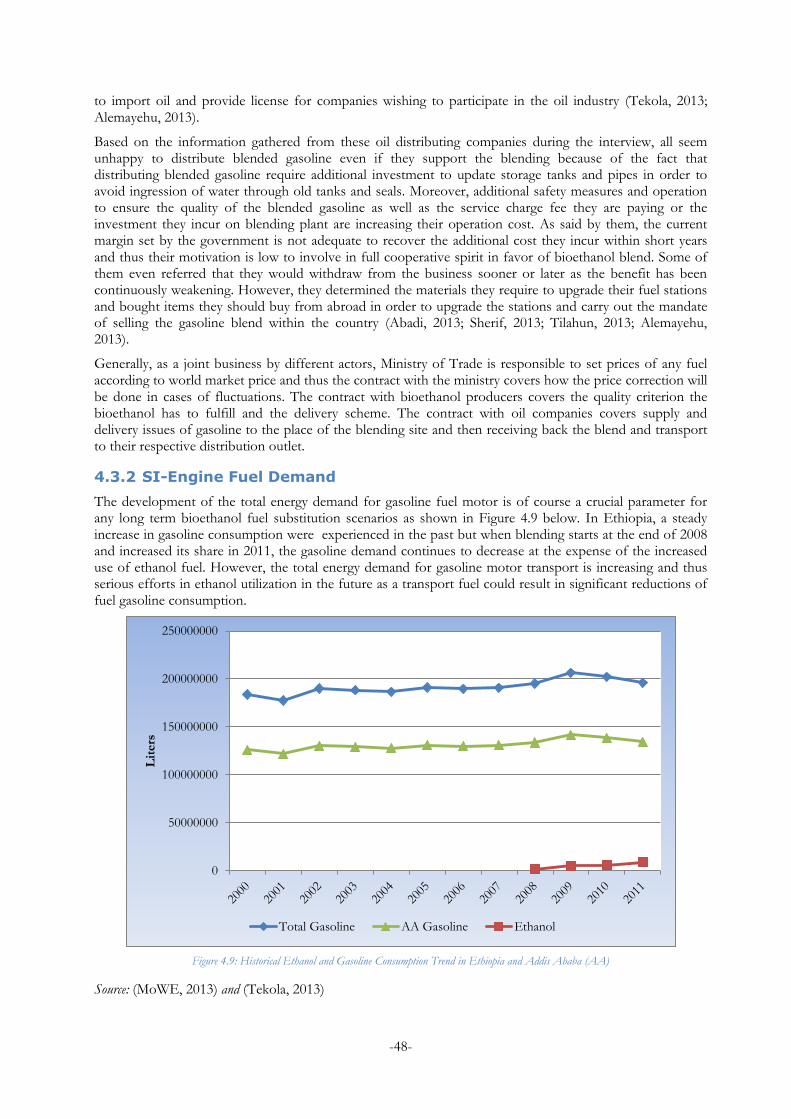
-48-
to import oil and provide license for companies wishing to participate in the oil industry (Tekola, 2013; Alemayehu, 2013).
Based on the information gathered from these oil distributing companies during the interview, all seem unhappy to distribute blended gasoline even if they support the blending because of the fact that distributing blended gasoline require additional investment to update storage tanks and pipes in order to avoid ingression of water through old tanks and seals. Moreover, additional safety measures and operation to ensure the quality of the blended gasoline as well as the service charge fee they are paying or the investment they incur on blending plant are increasing their operation cost. As said by them, the current margin set by the government is not adequate to recover the additional cost they incur within short years and thus their motivation is low to involve in full cooperative spirit in favor of bioethanol blend. Some of them even referred that they would withdraw from the business sooner or later as the benefit has been continuously weakening. However, they determined the materials they require to upgrade their fuel stations and bought items they should buy from abroad in order to upgrade the stations and carry out the mandate of selling the gasoline blend within the country (Abadi, 2013; Sherif, 2013; Tilahun, 2013; Alemayehu, 2013).
Generally, as a joint business by different actors, Ministry of Trade is responsible to set prices of any fuel according to world market price and thus the contract with the ministry covers how the price correction will be done in cases of fluctuations. The contract with bioethanol producers covers the quality criterion the bioethanol has to fulfill and the delivery scheme. The contract with oil companies covers supply and delivery issues of gasoline to the place of the blending site and then receiving back the blend and transport to their respective distribution outlet.
4.3.2 SI-Engine Fuel Demand
The development of the total energy demand for gasoline fuel motor is of course a crucial parameter for any long term bioethanol fuel substitution scenarios as shown in Figure 4.9 below. In Ethiopia, a steady increase in gasoline consumption were experienced in the past but when blending starts at the end of 2008 and increased its share in 2011, the gasoline demand continues to decrease at the expense of the increased use of ethanol fuel. However, the total energy demand for gasoline motor transport is increasing and thus serious efforts in ethanol utilization in the future as a transport fuel could result in significant reductions of fuel gasoline consumption.
Figure 4.9: Historical Ethanol and Gasoline Consumption Trend in Ethiopia and Addis Ababa (AA)
Source: (MoWE, 2013) and (Tekola, 2013)
0
50000000
100000000
150000000
200000000
250000000
Lit
ers
Total Gasoline AA Gasoline Ethanol

-49-
All bodies owning vehicles that are operated by gasoline are buying blended gasoline when they utilize fuel stations located in Addis Ababa region and the plan is to subsequently expand throughout the country. Under the current direction, all gasoline-motor vehicles in Addis Ababa are getting only blended gasoline in all fuel stations when the product is ready. Thus, customers will not have choice over the blend despite their potential role affecting the demand. The government direction that all fuel stations should have to sell only blended gasoline lessens their significance.
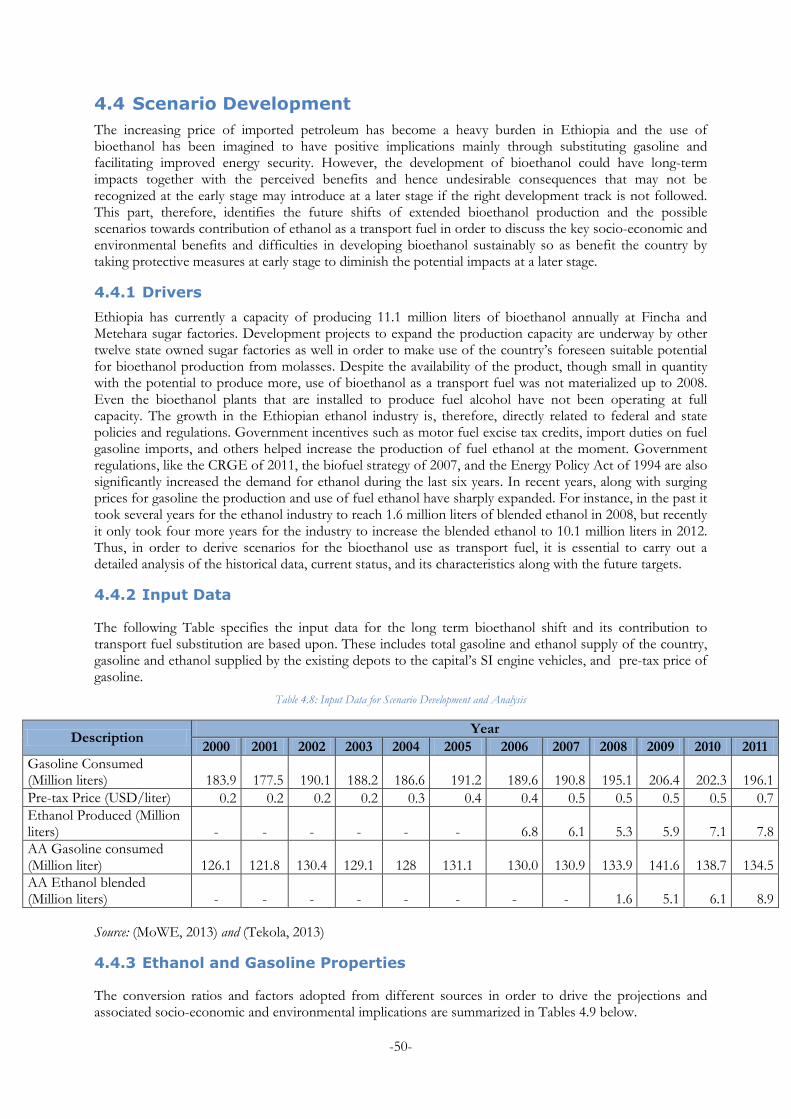
-50-
4.4 Scenario Development
The increasing price of imported petroleum has become a heavy burden in Ethiopia and the use of bioethanol has been imagined to have positive implications mainly through substituting gasoline and facilitating improved energy security. However, the development of bioethanol could have long-term impacts together with the perceived benefits and hence undesirable consequences that may not be recognized at the early stage may introduce at a later stage if the right development track is not followed. This part, therefore, identifies the future shifts of extended bioethanol production and the possible scenarios towards contribution of ethanol as a transport fuel in order to discuss the key socio-economic and environmental benefits and difficulties in developing bioethanol sustainably so as benefit the country by taking protective measures at early stage to diminish the potential impacts at a later stage.
4.4.1 Drivers
Ethiopia has currently a capacity of producing 11.1 million liters of bioethanol annually at Fincha and Metehara sugar factories. Development projects to expand the production capacity are underway by other twelve state owned sugar factories as well in order to make use of the country’s foreseen suitable potential for bioethanol production from molasses. Despite the availability of the product, though small in quantity with the potential to produce more, use of bioethanol as a transport fuel was not materialized up to 2008. Even the bioethanol plants that are installed to produce fuel alcohol have not been operating at full capacity. The growth in the Ethiopian ethanol industry is, therefore, directly related to federal and state policies and regulations. Government incentives such as motor fuel excise tax credits, import duties on fuel gasoline imports, and others helped increase the production of fuel ethanol at the moment. Government regulations, like the CRGE of 2011, the biofuel strategy of 2007, and the Energy Policy Act of 1994 are also significantly increased the demand for ethanol during the last six years. In recent years, along with surging prices for gasoline the production and use of fuel ethanol have sharply expanded. For instance, in the past it took several years for the ethanol industry to reach 1.6 million liters of blended ethanol in 2008, but recently it only took four more years for the industry to increase the blended ethanol to 10.1 million liters in 2012. Thus, in order to derive scenarios for the bioethanol use as transport fuel, it is essential to carry out a detailed analysis of the historical data, current status, and its characteristics along with the future targets.
4.4.2 Input Data
The following Table specifies the input data for the long term bioethanol shift and its contribution to transport fuel substitution are based upon. These includes total gasoline and ethanol supply of the country, gasoline and ethanol supplied by the existing depots to the capital’s SI engine vehicles, and pre-tax price of gasoline.
Table 4.8: Input Data for Scenario Development and Analysis
Description Year
2000 2001 2002 2003 2004 2005 2006 2007 2008 2009 2010 2011
Gasoline Consumed (Million liters) 183.9 177.5 190.1 188.2 186.6 191.2 189.6 190.8 195.1 206.4 202.3 196.1
Pre-tax Price (USD/liter) 0.2 0.2 0.2 0.2 0.3 0.4 0.4 0.5 0.5 0.5 0.5 0.7
Ethanol Produced (Million liters) - - - - - - 6.8 6.1 5.3 5.9 7.1 7.8
AA Gasoline consumed (Million liter) 126.1 121.8 130.4 129.1 128 131.1 130.0 130.9 133.9 141.6 138.7 134.5
AA Ethanol blended (Million liters) - - - - - - - - 1.6 5.1 6.1 8.9
Source: (MoWE, 2013) and (Tekola, 2013)
4.4.3 Ethanol and Gasoline Properties
The conversion ratios and factors adopted from different sources in order to drive the projections and associated socio-economic and environmental implications are summarized in Tables 4.9 below.
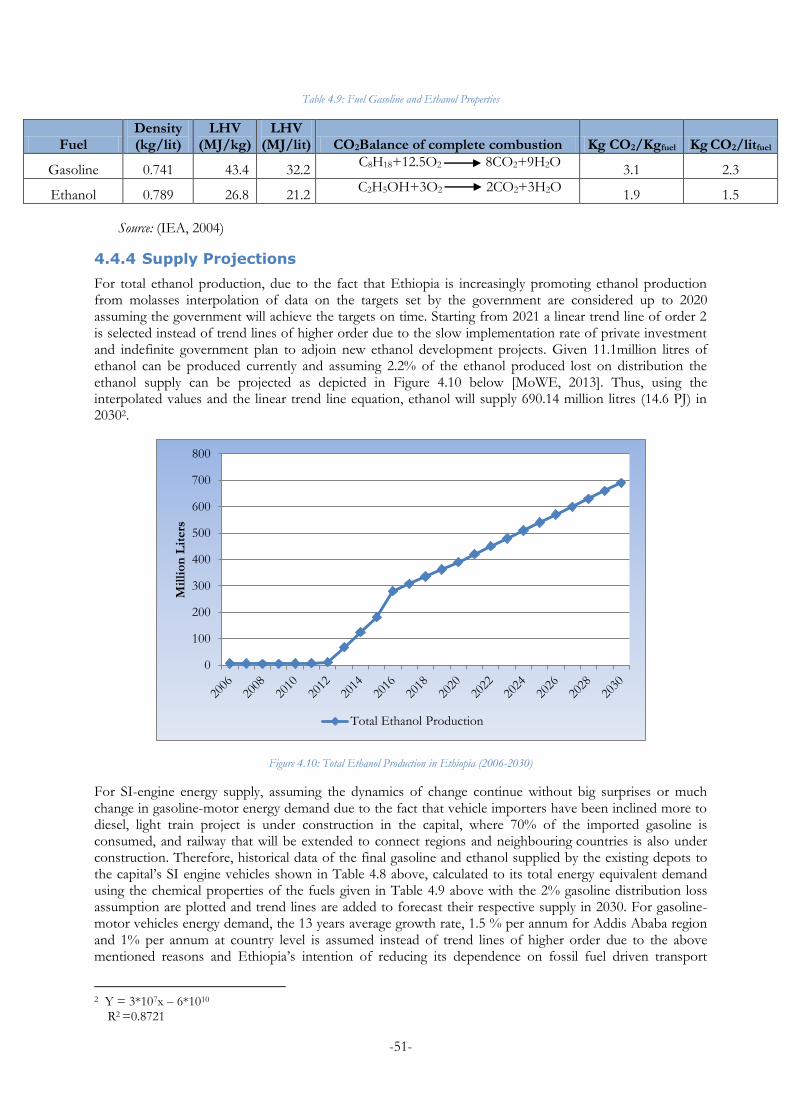
-51-
Table 4.9: Fuel Gasoline and Ethanol Properties
Fuel Density (kg/lit)
LHV (MJ/kg)
LHV (MJ/lit) CO2Balance of complete combustion Kg CO2/Kgfuel Kg CO2/litfuel
Gasoline 0.741 43.4 32.2 C8H18+12.5O2 8CO2+9H2O
3.1 2.3
Ethanol 0.789 26.8 21.2 C2H5OH+3O2 2CO2+3H2O
1.9 1.5
Source: (IEA, 2004)
4.4.4 Supply Projections
For total ethanol production, due to the fact that Ethiopia is increasingly promoting ethanol production from molasses interpolation of data on the targets set by the government are considered up to 2020 assuming the government will achieve the targets on time. Starting from 2021 a linear trend line of order 2 is selected instead of trend lines of higher order due to the slow implementation rate of private investment and indefinite government plan to adjoin new ethanol development projects. Given 11.1million litres of ethanol can be produced currently and assuming 2.2% of the ethanol produced lost on distribution the ethanol supply can be projected as depicted in Figure 4.10 below [MoWE, 2013]. Thus, using the interpolated values and the linear trend line equation, ethanol will supply 690.14 million litres (14.6 PJ) in 20302.
Figure 4.10: Total Ethanol Production in Ethiopia (2006-2030)
For SI-engine energy supply, assuming the dynamics of change continue without big surprises or much change in gasoline-motor energy demand due to the fact that vehicle importers have been inclined more to diesel, light train project is under construction in the capital, where 70% of the imported gasoline is consumed, and railway that will be extended to connect regions and neighbouring countries is also under construction. Therefore, historical data of the final gasoline and ethanol supplied by the existing depots to the capital’s SI engine vehicles shown in Table 4.8 above, calculated to its total energy equivalent demand using the chemical properties of the fuels given in Table 4.9 above with the 2% gasoline distribution loss assumption are plotted and trend lines are added to forecast their respective supply in 2030. For gasoline-motor vehicles energy demand, the 13 years average growth rate, 1.5 % per annum for Addis Ababa region and 1% per annum at country level is assumed instead of trend lines of higher order due to the above mentioned reasons and Ethiopia’s intention of reducing its dependence on fossil fuel driven transport
2 Y = 3*107x – 6*1010
R2 =0.8721
0
100
200
300
400
500
600
700
800
Mil
lio
n L
iters
Total Ethanol Production
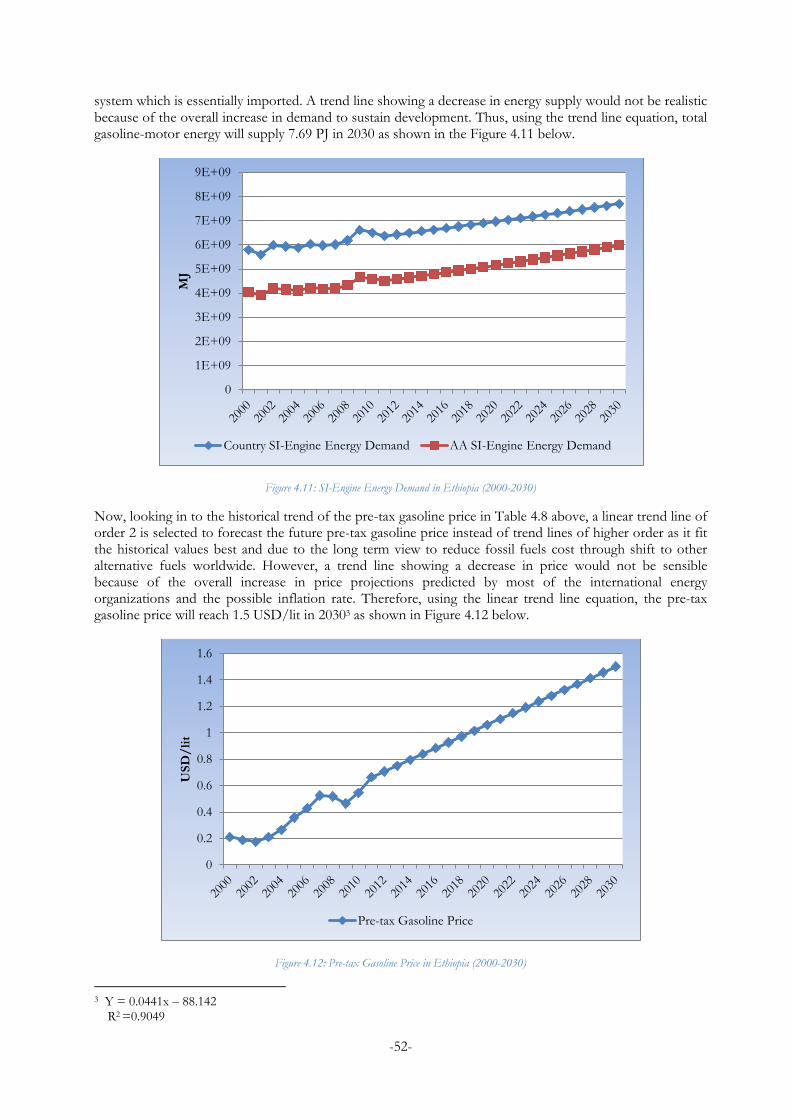
-52-
system which is essentially imported. A trend line showing a decrease in energy supply would not be realistic because of the overall increase in demand to sustain development. Thus, using the trend line equation, total gasoline-motor energy will supply 7.69 PJ in 2030 as shown in the Figure 4.11 below.
Figure 4.11: SI-Engine Energy Demand in Ethiopia (2000-2030)
Now, looking in to the historical trend of the pre-tax gasoline price in Table 4.8 above, a linear trend line of order 2 is selected to forecast the future pre-tax gasoline price instead of trend lines of higher order as it fit the historical values best and due to the long term view to reduce fossil fuels cost through shift to other alternative fuels worldwide. However, a trend line showing a decrease in price would not be sensible because of the overall increase in price projections predicted by most of the international energy organizations and the possible inflation rate. Therefore, using the linear trend line equation, the pre-tax gasoline price will reach 1.5 USD/lit in 20303 as shown in Figure 4.12 below.
Figure 4.12: Pre-tax Gasoline Price in Ethiopia (2000-2030)
3 Y = 0.0441x – 88.142
R2 =0.9049
0
1E+09
2E+09
3E+09
4E+09
5E+09
6E+09
7E+09
8E+09
9E+09 M
J
Country SI-Engine Energy Demand AA SI-Engine Energy Demand
0
0.2
0.4
0.6
0.8
1
1.2
1.4
1.6
US
D/
lit
Pre-tax Gasoline Price
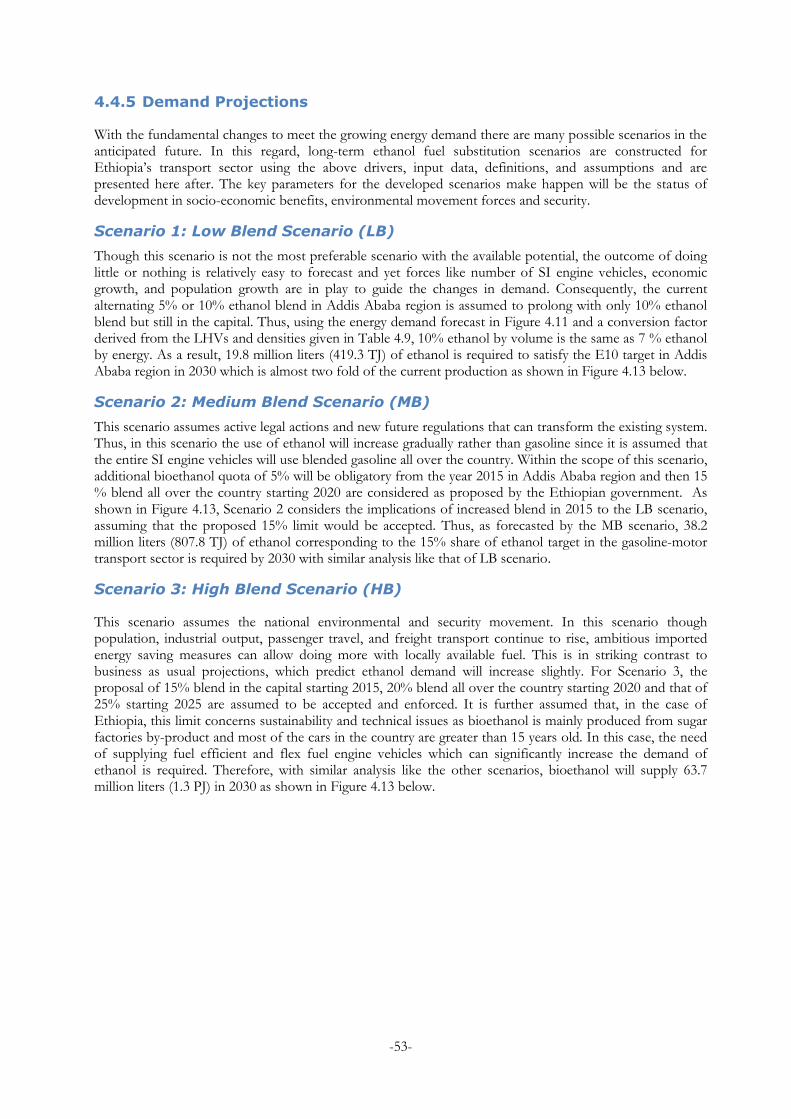
-53-
4.4.5 Demand Projections
With the fundamental changes to meet the growing energy demand there are many possible scenarios in the anticipated future. In this regard, long-term ethanol fuel substitution scenarios are constructed for Ethiopia’s transport sector using the above drivers, input data, definitions, and assumptions and are presented here after. The key parameters for the developed scenarios make happen will be the status of development in socio-economic benefits, environmental movement forces and security.
Scenario 1: Low Blend Scenario (LB)
Though this scenario is not the most preferable scenario with the available potential, the outcome of doing little or nothing is relatively easy to forecast and yet forces like number of SI engine vehicles, economic growth, and population growth are in play to guide the changes in demand. Consequently, the current alternating 5% or 10% ethanol blend in Addis Ababa region is assumed to prolong with only 10% ethanol blend but still in the capital. Thus, using the energy demand forecast in Figure 4.11 and a conversion factor derived from the LHVs and densities given in Table 4.9, 10% ethanol by volume is the same as 7 % ethanol by energy. As a result, 19.8 million liters (419.3 TJ) of ethanol is required to satisfy the E10 target in Addis Ababa region in 2030 which is almost two fold of the current production as shown in Figure 4.13 below.
Scenario 2: Medium Blend Scenario (MB)
This scenario assumes active legal actions and new future regulations that can transform the existing system. Thus, in this scenario the use of ethanol will increase gradually rather than gasoline since it is assumed that the entire SI engine vehicles will use blended gasoline all over the country. Within the scope of this scenario, additional bioethanol quota of 5% will be obligatory from the year 2015 in Addis Ababa region and then 15 % blend all over the country starting 2020 are considered as proposed by the Ethiopian government. As shown in Figure 4.13, Scenario 2 considers the implications of increased blend in 2015 to the LB scenario, assuming that the proposed 15% limit would be accepted. Thus, as forecasted by the MB scenario, 38.2 million liters (807.8 TJ) of ethanol corresponding to the 15% share of ethanol target in the gasoline-motor transport sector is required by 2030 with similar analysis like that of LB scenario.
Scenario 3: High Blend Scenario (HB)
This scenario assumes the national environmental and security movement. In this scenario though population, industrial output, passenger travel, and freight transport continue to rise, ambitious imported energy saving measures can allow doing more with locally available fuel. This is in striking contrast to business as usual projections, which predict ethanol demand will increase slightly. For Scenario 3, the proposal of 15% blend in the capital starting 2015, 20% blend all over the country starting 2020 and that of 25% starting 2025 are assumed to be accepted and enforced. It is further assumed that, in the case of Ethiopia, this limit concerns sustainability and technical issues as bioethanol is mainly produced from sugar factories by-product and most of the cars in the country are greater than 15 years old. In this case, the need of supplying fuel efficient and flex fuel engine vehicles which can significantly increase the demand of ethanol is required. Therefore, with similar analysis like the other scenarios, bioethanol will supply 63.7 million liters (1.3 PJ) in 2030 as shown in Figure 4.13 below.
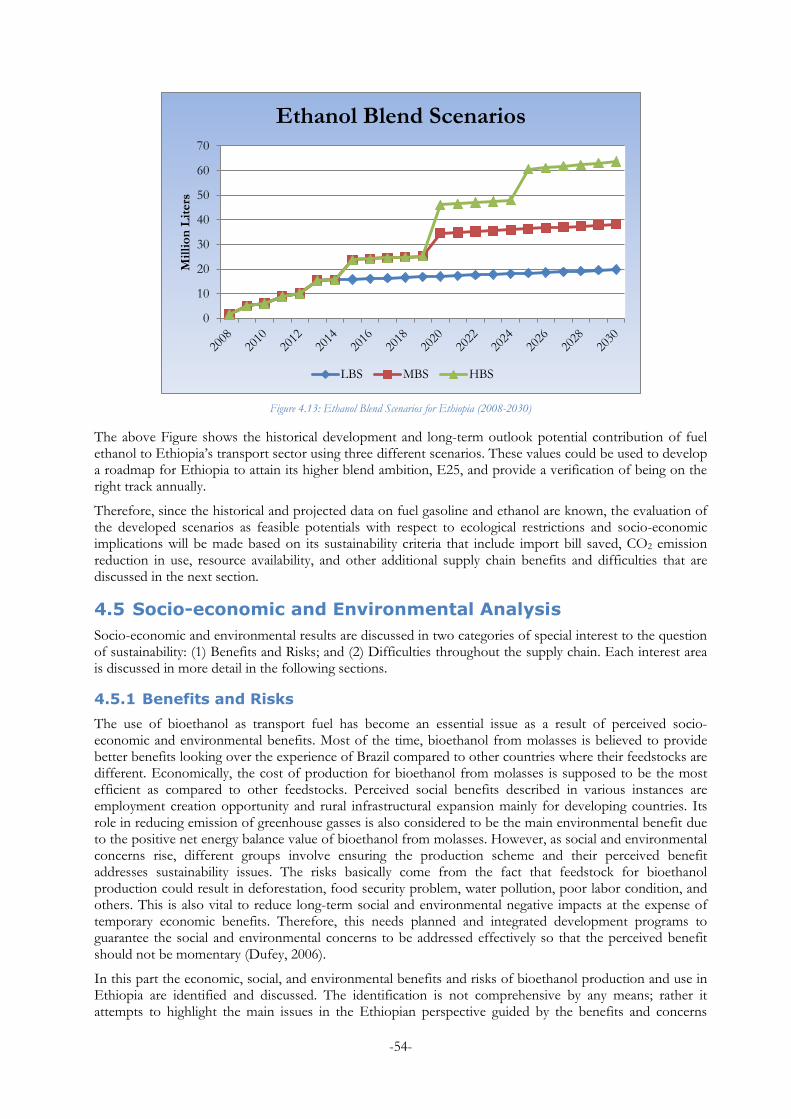
-54-
Figure 4.13: Ethanol Blend Scenarios for Ethiopia (2008-2030)
The above Figure shows the historical development and long-term outlook potential contribution of fuel ethanol to Ethiopia’s transport sector using three different scenarios. These values could be used to develop a roadmap for Ethiopia to attain its higher blend ambition, E25, and provide a verification of being on the right track annually.
Therefore, since the historical and projected data on fuel gasoline and ethanol are known, the evaluation of the developed scenarios as feasible potentials with respect to ecological restrictions and socio-economic implications will be made based on its sustainability criteria that include import bill saved, CO2 emission reduction in use, resource availability, and other additional supply chain benefits and difficulties that are discussed in the next section.
4.5 Socio-economic and Environmental Analysis
Socio-economic and environmental results are discussed in two categories of special interest to the question of sustainability: (1) Benefits and Risks; and (2) Difficulties throughout the supply chain. Each interest area is discussed in more detail in the following sections.
4.5.1 Benefits and Risks
The use of bioethanol as transport fuel has become an essential issue as a result of perceived socio-economic and environmental benefits. Most of the time, bioethanol from molasses is believed to provide better benefits looking over the experience of Brazil compared to other countries where their feedstocks are different. Economically, the cost of production for bioethanol from molasses is supposed to be the most efficient as compared to other feedstocks. Perceived social benefits described in various instances are employment creation opportunity and rural infrastructural expansion mainly for developing countries. Its role in reducing emission of greenhouse gasses is also considered to be the main environmental benefit due to the positive net energy balance value of bioethanol from molasses. However, as social and environmental concerns rise, different groups involve ensuring the production scheme and their perceived benefit addresses sustainability issues. The risks basically come from the fact that feedstock for bioethanol production could result in deforestation, food security problem, water pollution, poor labor condition, and others. This is also vital to reduce long-term social and environmental negative impacts at the expense of temporary economic benefits. Therefore, this needs planned and integrated development programs to guarantee the social and environmental concerns to be addressed effectively so that the perceived benefit should not be momentary (Dufey, 2006).
In this part the economic, social, and environmental benefits and risks of bioethanol production and use in Ethiopia are identified and discussed. The identification is not comprehensive by any means; rather it attempts to highlight the main issues in the Ethiopian perspective guided by the benefits and concerns
0
10
20
30
40
50
60
70
Mil
lio
n L
iters
Ethanol Blend Scenarios
LBS MBS HBS
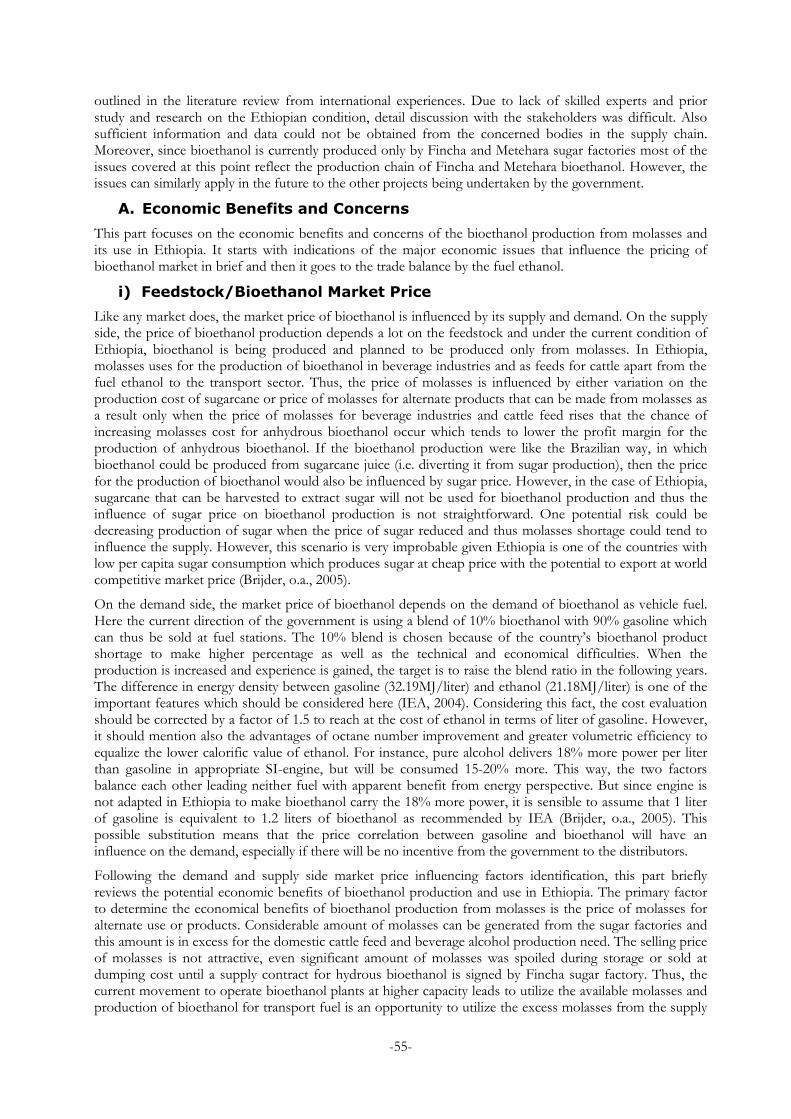
-55-
outlined in the literature review from international experiences. Due to lack of skilled experts and prior study and research on the Ethiopian condition, detail discussion with the stakeholders was difficult. Also sufficient information and data could not be obtained from the concerned bodies in the supply chain. Moreover, since bioethanol is currently produced only by Fincha and Metehara sugar factories most of the issues covered at this point reflect the production chain of Fincha and Metehara bioethanol. However, the issues can similarly apply in the future to the other projects being undertaken by the government.
A. Economic Benefits and Concerns
This part focuses on the economic benefits and concerns of the bioethanol production from molasses and its use in Ethiopia. It starts with indications of the major economic issues that influence the pricing of bioethanol market in brief and then it goes to the trade balance by the fuel ethanol.
i) Feedstock/Bioethanol Market Price
Like any market does, the market price of bioethanol is influenced by its supply and demand. On the supply side, the price of bioethanol production depends a lot on the feedstock and under the current condition of Ethiopia, bioethanol is being produced and planned to be produced only from molasses. In Ethiopia, molasses uses for the production of bioethanol in beverage industries and as feeds for cattle apart from the fuel ethanol to the transport sector. Thus, the price of molasses is influenced by either variation on the production cost of sugarcane or price of molasses for alternate products that can be made from molasses as a result only when the price of molasses for beverage industries and cattle feed rises that the chance of increasing molasses cost for anhydrous bioethanol occur which tends to lower the profit margin for the production of anhydrous bioethanol. If the bioethanol production were like the Brazilian way, in which bioethanol could be produced from sugarcane juice (i.e. diverting it from sugar production), then the price for the production of bioethanol would also be influenced by sugar price. However, in the case of Ethiopia, sugarcane that can be harvested to extract sugar will not be used for bioethanol production and thus the influence of sugar price on bioethanol production is not straightforward. One potential risk could be decreasing production of sugar when the price of sugar reduced and thus molasses shortage could tend to influence the supply. However, this scenario is very improbable given Ethiopia is one of the countries with low per capita sugar consumption which produces sugar at cheap price with the potential to export at world competitive market price (Brijder, o.a., 2005).
On the demand side, the market price of bioethanol depends on the demand of bioethanol as vehicle fuel. Here the current direction of the government is using a blend of 10% bioethanol with 90% gasoline which can thus be sold at fuel stations. The 10% blend is chosen because of the country’s bioethanol product shortage to make higher percentage as well as the technical and economical difficulties. When the production is increased and experience is gained, the target is to raise the blend ratio in the following years. The difference in energy density between gasoline (32.19MJ/liter) and ethanol (21.18MJ/liter) is one of the important features which should be considered here (IEA, 2004). Considering this fact, the cost evaluation should be corrected by a factor of 1.5 to reach at the cost of ethanol in terms of liter of gasoline. However, it should mention also the advantages of octane number improvement and greater volumetric efficiency to equalize the lower calorific value of ethanol. For instance, pure alcohol delivers 18% more power per liter than gasoline in appropriate SI-engine, but will be consumed 15-20% more. This way, the two factors balance each other leading neither fuel with apparent benefit from energy perspective. But since engine is not adapted in Ethiopia to make bioethanol carry the 18% more power, it is sensible to assume that 1 liter of gasoline is equivalent to 1.2 liters of bioethanol as recommended by IEA (Brijder, o.a., 2005). This possible substitution means that the price correlation between gasoline and bioethanol will have an influence on the demand, especially if there will be no incentive from the government to the distributors.
Following the demand and supply side market price influencing factors identification, this part briefly reviews the potential economic benefits of bioethanol production and use in Ethiopia. The primary factor to determine the economical benefits of bioethanol production from molasses is the price of molasses for alternate use or products. Considerable amount of molasses can be generated from the sugar factories and this amount is in excess for the domestic cattle feed and beverage alcohol production need. The selling price of molasses is not attractive, even significant amount of molasses was spoiled during storage or sold at dumping cost until a supply contract for hydrous bioethanol is signed by Fincha sugar factory. Thus, the current movement to operate bioethanol plants at higher capacity leads to utilize the available molasses and production of bioethanol for transport fuel is an opportunity to utilize the excess molasses from the supply
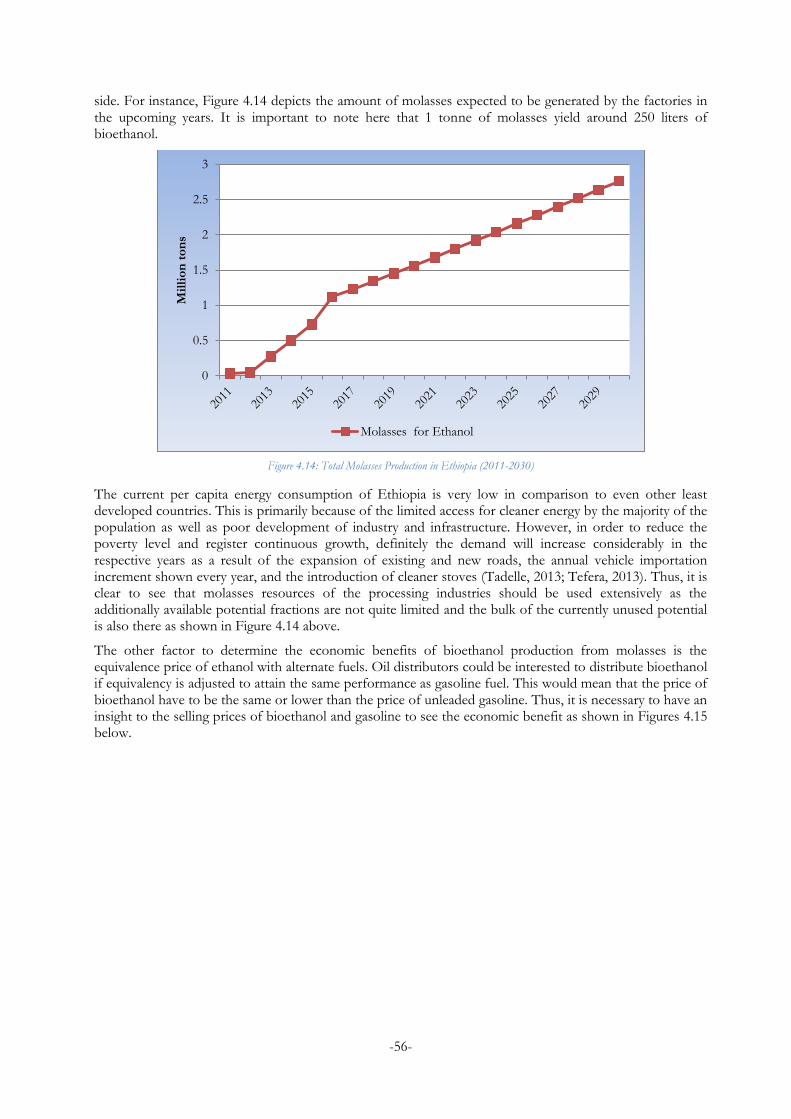
-56-
side. For instance, Figure 4.14 depicts the amount of molasses expected to be generated by the factories in the upcoming years. It is important to note here that 1 tonne of molasses yield around 250 liters of bioethanol.
Figure 4.14: Total Molasses Production in Ethiopia (2011-2030)
The current per capita energy consumption of Ethiopia is very low in comparison to even other least developed countries. This is primarily because of the limited access for cleaner energy by the majority of the population as well as poor development of industry and infrastructure. However, in order to reduce the poverty level and register continuous growth, definitely the demand will increase considerably in the respective years as a result of the expansion of existing and new roads, the annual vehicle importation increment shown every year, and the introduction of cleaner stoves (Tadelle, 2013; Tefera, 2013). Thus, it is clear to see that molasses resources of the processing industries should be used extensively as the additionally available potential fractions are not quite limited and the bulk of the currently unused potential is also there as shown in Figure 4.14 above.
The other factor to determine the economic benefits of bioethanol production from molasses is the equivalence price of ethanol with alternate fuels. Oil distributors could be interested to distribute bioethanol if equivalency is adjusted to attain the same performance as gasoline fuel. This would mean that the price of bioethanol have to be the same or lower than the price of unleaded gasoline. Thus, it is necessary to have an insight to the selling prices of bioethanol and gasoline to see the economic benefit as shown in Figures 4.15 below.
0
0.5
1
1.5
2
2.5
3
Mil
lio
n t
on
s
Molasses for Ethanol
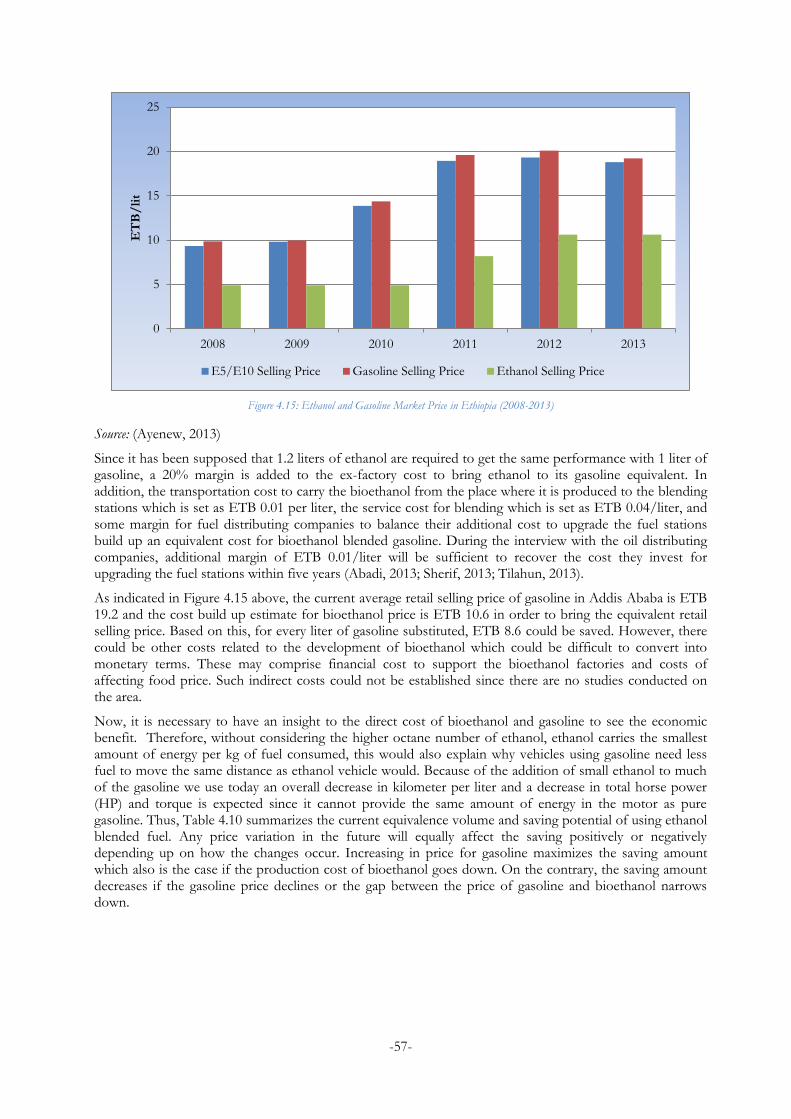
-57-
Figure 4.15: Ethanol and Gasoline Market Price in Ethiopia (2008-2013)
Source: (Ayenew, 2013)
Since it has been supposed that 1.2 liters of ethanol are required to get the same performance with 1 liter of gasoline, a 20% margin is added to the ex-factory cost to bring ethanol to its gasoline equivalent. In addition, the transportation cost to carry the bioethanol from the place where it is produced to the blending stations which is set as ETB 0.01 per liter, the service cost for blending which is set as ETB 0.04/liter, and some margin for fuel distributing companies to balance their additional cost to upgrade the fuel stations build up an equivalent cost for bioethanol blended gasoline. During the interview with the oil distributing companies, additional margin of ETB 0.01/liter will be sufficient to recover the cost they invest for upgrading the fuel stations within five years (Abadi, 2013; Sherif, 2013; Tilahun, 2013).
As indicated in Figure 4.15 above, the current average retail selling price of gasoline in Addis Ababa is ETB 19.2 and the cost build up estimate for bioethanol price is ETB 10.6 in order to bring the equivalent retail selling price. Based on this, for every liter of gasoline substituted, ETB 8.6 could be saved. However, there could be other costs related to the development of bioethanol which could be difficult to convert into monetary terms. These may comprise financial cost to support the bioethanol factories and costs of affecting food price. Such indirect costs could not be established since there are no studies conducted on the area.
Now, it is necessary to have an insight to the direct cost of bioethanol and gasoline to see the economic benefit. Therefore, without considering the higher octane number of ethanol, ethanol carries the smallest amount of energy per kg of fuel consumed, this would also explain why vehicles using gasoline need less fuel to move the same distance as ethanol vehicle would. Because of the addition of small ethanol to much of the gasoline we use today an overall decrease in kilometer per liter and a decrease in total horse power (HP) and torque is expected since it cannot provide the same amount of energy in the motor as pure gasoline. Thus, Table 4.10 summarizes the current equivalence volume and saving potential of using ethanol blended fuel. Any price variation in the future will equally affect the saving positively or negatively depending up on how the changes occur. Increasing in price for gasoline maximizes the saving amount which also is the case if the production cost of bioethanol goes down. On the contrary, the saving amount decreases if the gasoline price declines or the gap between the price of gasoline and bioethanol narrows down.
0
5
10
15
20
25
2008 2009 2010 2011 2012 2013
ET
B/
lit
E5/E10 Selling Price Gasoline Selling Price Ethanol Selling Price
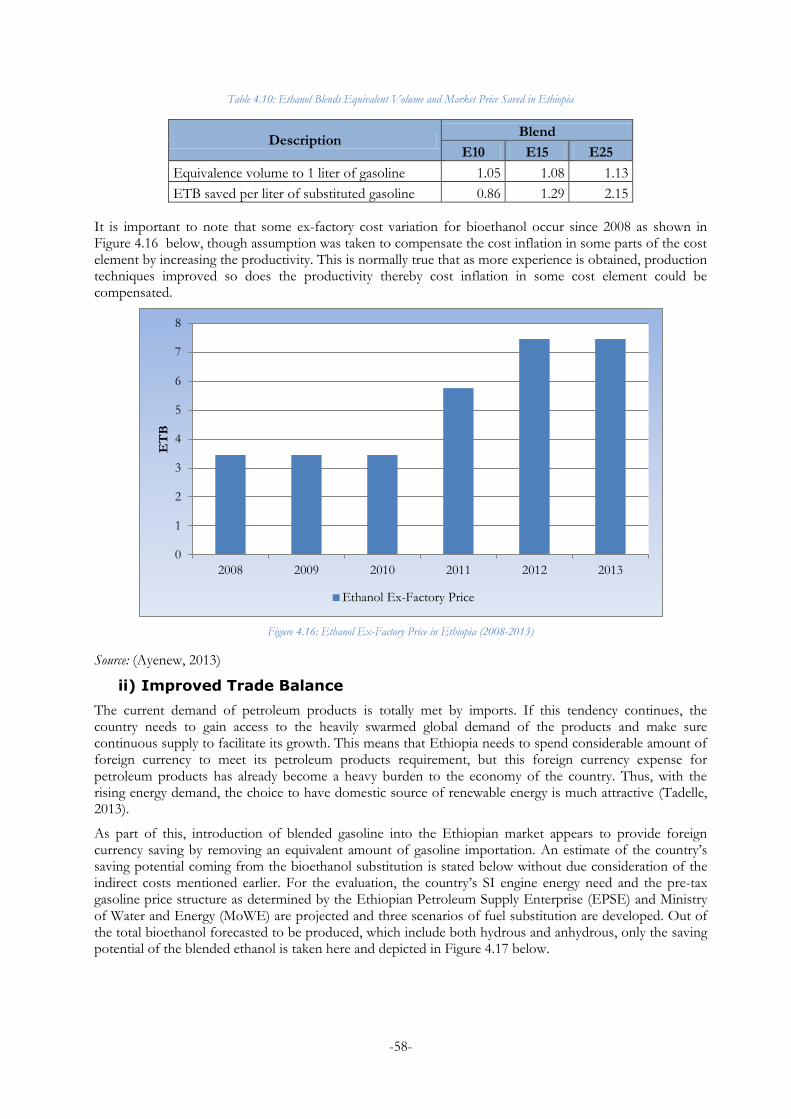
-58-
Table 4.10: Ethanol Blends Equivalent Volume and Market Price Saved in Ethiopia
Description Blend
E10 E15 E25
Equivalence volume to 1 liter of gasoline 1.05 1.08 1.13
ETB saved per liter of substituted gasoline 0.86 1.29 2.15
It is important to note that some ex-factory cost variation for bioethanol occur since 2008 as shown in Figure 4.16 below, though assumption was taken to compensate the cost inflation in some parts of the cost element by increasing the productivity. This is normally true that as more experience is obtained, production techniques improved so does the productivity thereby cost inflation in some cost element could be compensated.
Figure 4.16: Ethanol Ex-Factory Price in Ethiopia (2008-2013)
Source: (Ayenew, 2013)
ii) Improved Trade Balance
The current demand of petroleum products is totally met by imports. If this tendency continues, the country needs to gain access to the heavily swarmed global demand of the products and make sure continuous supply to facilitate its growth. This means that Ethiopia needs to spend considerable amount of foreign currency to meet its petroleum products requirement, but this foreign currency expense for petroleum products has already become a heavy burden to the economy of the country. Thus, with the rising energy demand, the choice to have domestic source of renewable energy is much attractive (Tadelle, 2013).
As part of this, introduction of blended gasoline into the Ethiopian market appears to provide foreign currency saving by removing an equivalent amount of gasoline importation. An estimate of the country’s saving potential coming from the bioethanol substitution is stated below without due consideration of the indirect costs mentioned earlier. For the evaluation, the country’s SI engine energy need and the pre-tax gasoline price structure as determined by the Ethiopian Petroleum Supply Enterprise (EPSE) and Ministry of Water and Energy (MoWE) are projected and three scenarios of fuel substitution are developed. Out of the total bioethanol forecasted to be produced, which include both hydrous and anhydrous, only the saving potential of the blended ethanol is taken here and depicted in Figure 4.17 below.
0
1
2
3
4
5
6
7
8
2008 2009 2010 2011 2012 2013
ET
B
Ethanol Ex-Factory Price
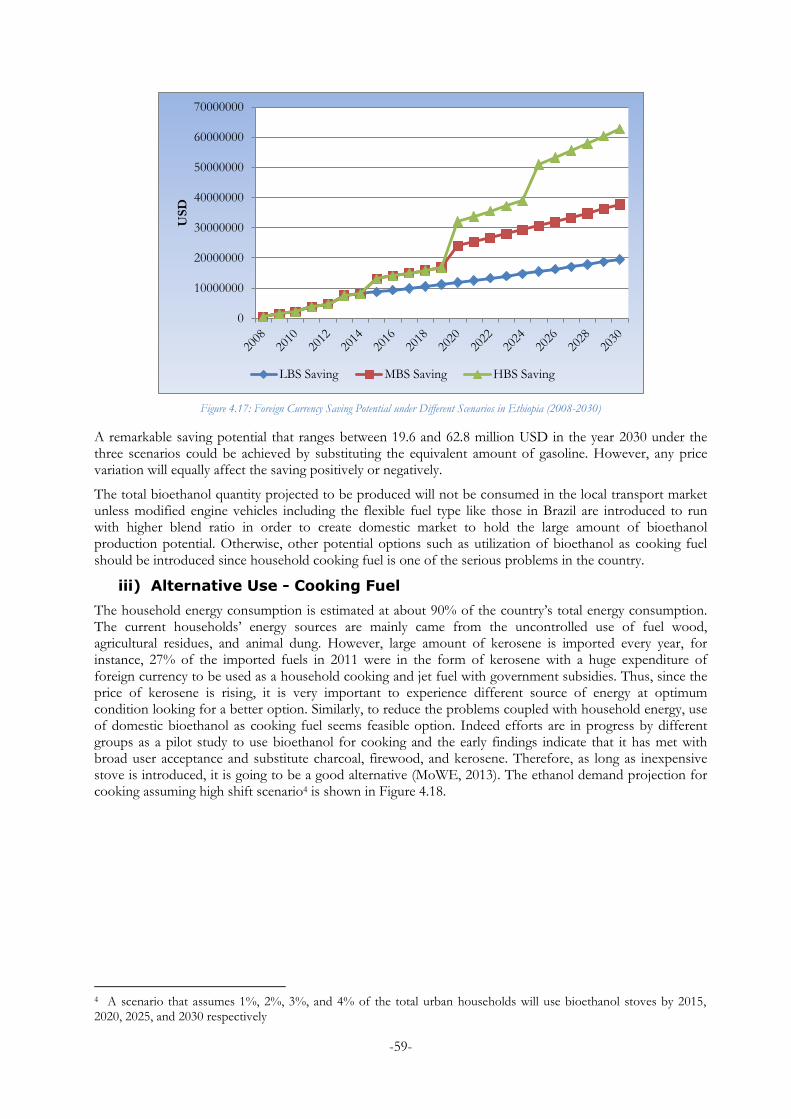
-59-
Figure 4.17: Foreign Currency Saving Potential under Different Scenarios in Ethiopia (2008-2030)
A remarkable saving potential that ranges between 19.6 and 62.8 million USD in the year 2030 under the three scenarios could be achieved by substituting the equivalent amount of gasoline. However, any price variation will equally affect the saving positively or negatively.
The total bioethanol quantity projected to be produced will not be consumed in the local transport market unless modified engine vehicles including the flexible fuel type like those in Brazil are introduced to run with higher blend ratio in order to create domestic market to hold the large amount of bioethanol production potential. Otherwise, other potential options such as utilization of bioethanol as cooking fuel should be introduced since household cooking fuel is one of the serious problems in the country.
iii) Alternative Use - Cooking Fuel
The household energy consumption is estimated at about 90% of the country’s total energy consumption. The current households’ energy sources are mainly came from the uncontrolled use of fuel wood, agricultural residues, and animal dung. However, large amount of kerosene is imported every year, for instance, 27% of the imported fuels in 2011 were in the form of kerosene with a huge expenditure of foreign currency to be used as a household cooking and jet fuel with government subsidies. Thus, since the price of kerosene is rising, it is very important to experience different source of energy at optimum condition looking for a better option. Similarly, to reduce the problems coupled with household energy, use of domestic bioethanol as cooking fuel seems feasible option. Indeed efforts are in progress by different groups as a pilot study to use bioethanol for cooking and the early findings indicate that it has met with broad user acceptance and substitute charcoal, firewood, and kerosene. Therefore, as long as inexpensive stove is introduced, it is going to be a good alternative (MoWE, 2013). The ethanol demand projection for cooking assuming high shift scenario4 is shown in Figure 4.18.
4 A scenario that assumes 1%, 2%, 3%, and 4% of the total urban households will use bioethanol stoves by 2015, 2020, 2025, and 2030 respectively
0
10000000
20000000
30000000
40000000
50000000
60000000
70000000
US
D
LBS Saving MBS Saving HBS Saving
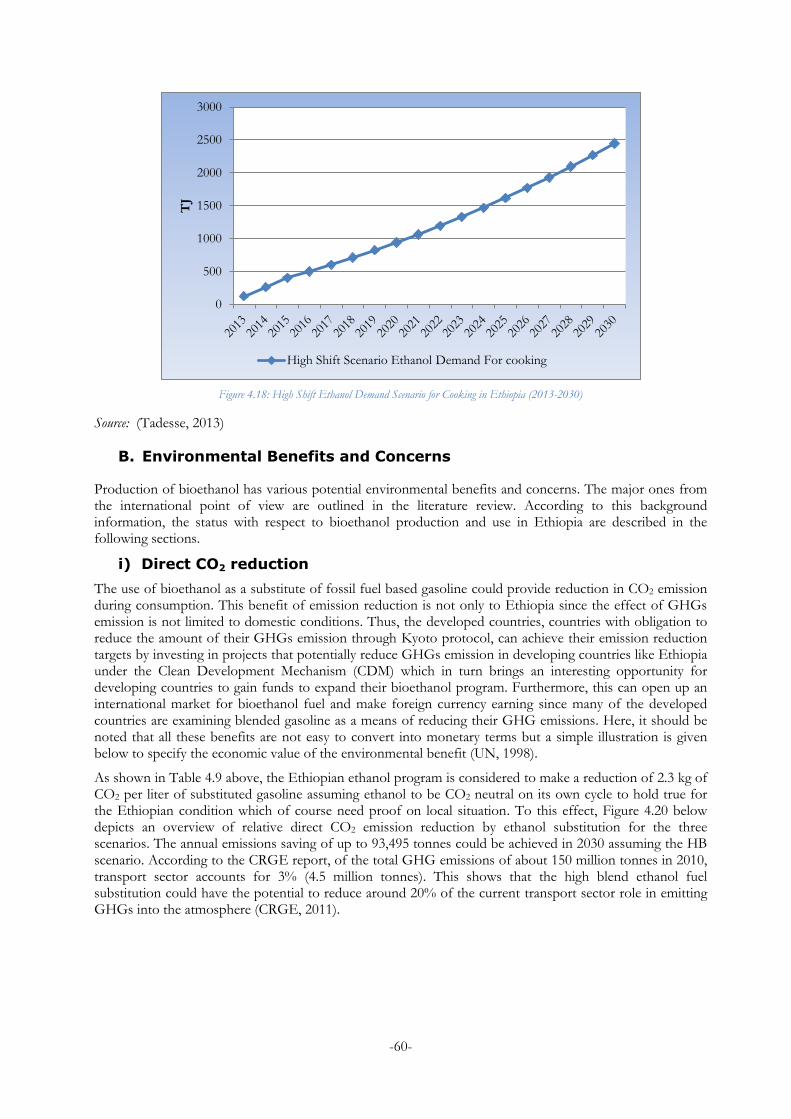
-60-
Figure 4.18: High Shift Ethanol Demand Scenario for Cooking in Ethiopia (2013-2030)
Source: (Tadesse, 2013)
B. Environmental Benefits and Concerns
Production of bioethanol has various potential environmental benefits and concerns. The major ones from the international point of view are outlined in the literature review. According to this background information, the status with respect to bioethanol production and use in Ethiopia are described in the following sections.
i) Direct CO2 reduction
The use of bioethanol as a substitute of fossil fuel based gasoline could provide reduction in CO2 emission during consumption. This benefit of emission reduction is not only to Ethiopia since the effect of GHGs emission is not limited to domestic conditions. Thus, the developed countries, countries with obligation to reduce the amount of their GHGs emission through Kyoto protocol, can achieve their emission reduction targets by investing in projects that potentially reduce GHGs emission in developing countries like Ethiopia under the Clean Development Mechanism (CDM) which in turn brings an interesting opportunity for developing countries to gain funds to expand their bioethanol program. Furthermore, this can open up an international market for bioethanol fuel and make foreign currency earning since many of the developed countries are examining blended gasoline as a means of reducing their GHG emissions. Here, it should be noted that all these benefits are not easy to convert into monetary terms but a simple illustration is given below to specify the economic value of the environmental benefit (UN, 1998).
As shown in Table 4.9 above, the Ethiopian ethanol program is considered to make a reduction of 2.3 kg of CO2 per liter of substituted gasoline assuming ethanol to be CO2 neutral on its own cycle to hold true for the Ethiopian condition which of course need proof on local situation. To this effect, Figure 4.20 below depicts an overview of relative direct CO2 emission reduction by ethanol substitution for the three scenarios. The annual emissions saving of up to 93,495 tonnes could be achieved in 2030 assuming the HB scenario. According to the CRGE report, of the total GHG emissions of about 150 million tonnes in 2010, transport sector accounts for 3% (4.5 million tonnes). This shows that the high blend ethanol fuel substitution could have the potential to reduce around 20% of the current transport sector role in emitting GHGs into the atmosphere (CRGE, 2011).
0
500
1000
1500
2000
2500
3000
TJ
High Shift Scenario Ethanol Demand For cooking
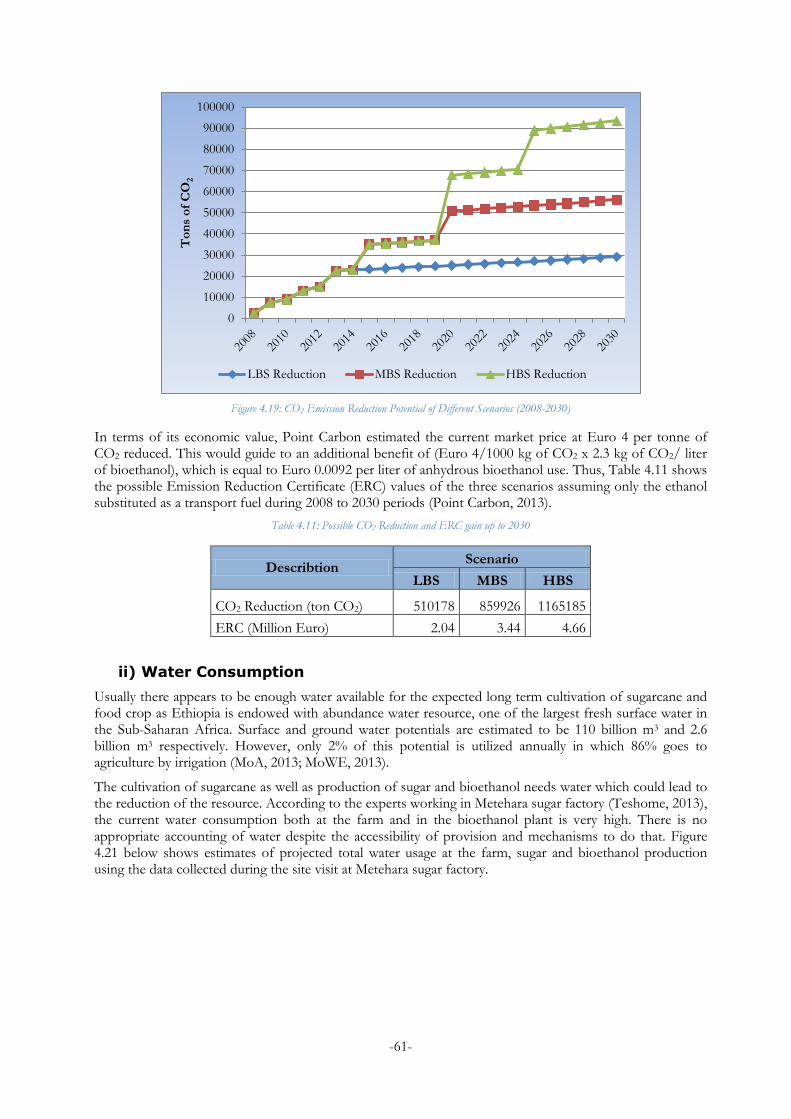
-61-
Figure 4.19: CO2 Emission Reduction Potential of Different Scenarios (2008-2030)
In terms of its economic value, Point Carbon estimated the current market price at Euro 4 per tonne of CO2 reduced. This would guide to an additional benefit of (Euro 4/1000 kg of CO2 x 2.3 kg of CO2/ liter of bioethanol), which is equal to Euro 0.0092 per liter of anhydrous bioethanol use. Thus, Table 4.11 shows the possible Emission Reduction Certificate (ERC) values of the three scenarios assuming only the ethanol substituted as a transport fuel during 2008 to 2030 periods (Point Carbon, 2013).
Table 4.11: Possible CO2 Reduction and ERC gain up to 2030
Describtion Scenario
LBS MBS HBS
CO2 Reduction (ton CO2) 510178 859926 1165185
ERC (Million Euro) 2.04 3.44 4.66
ii) Water Consumption
Usually there appears to be enough water available for the expected long term cultivation of sugarcane and food crop as Ethiopia is endowed with abundance water resource, one of the largest fresh surface water in the Sub-Saharan Africa. Surface and ground water potentials are estimated to be 110 billion m3 and 2.6 billion m3 respectively. However, only 2% of this potential is utilized annually in which 86% goes to agriculture by irrigation (MoA, 2013; MoWE, 2013).
The cultivation of sugarcane as well as production of sugar and bioethanol needs water which could lead to the reduction of the resource. According to the experts working in Metehara sugar factory (Teshome, 2013), the current water consumption both at the farm and in the bioethanol plant is very high. There is no appropriate accounting of water despite the accessibility of provision and mechanisms to do that. Figure 4.21 below shows estimates of projected total water usage at the farm, sugar and bioethanol production using the data collected during the site visit at Metehara sugar factory.
0
10000
20000
30000
40000
50000
60000
70000
80000
90000
100000
To
ns
of
CO
2
LBS Reduction MBS Reduction HBS Reduction
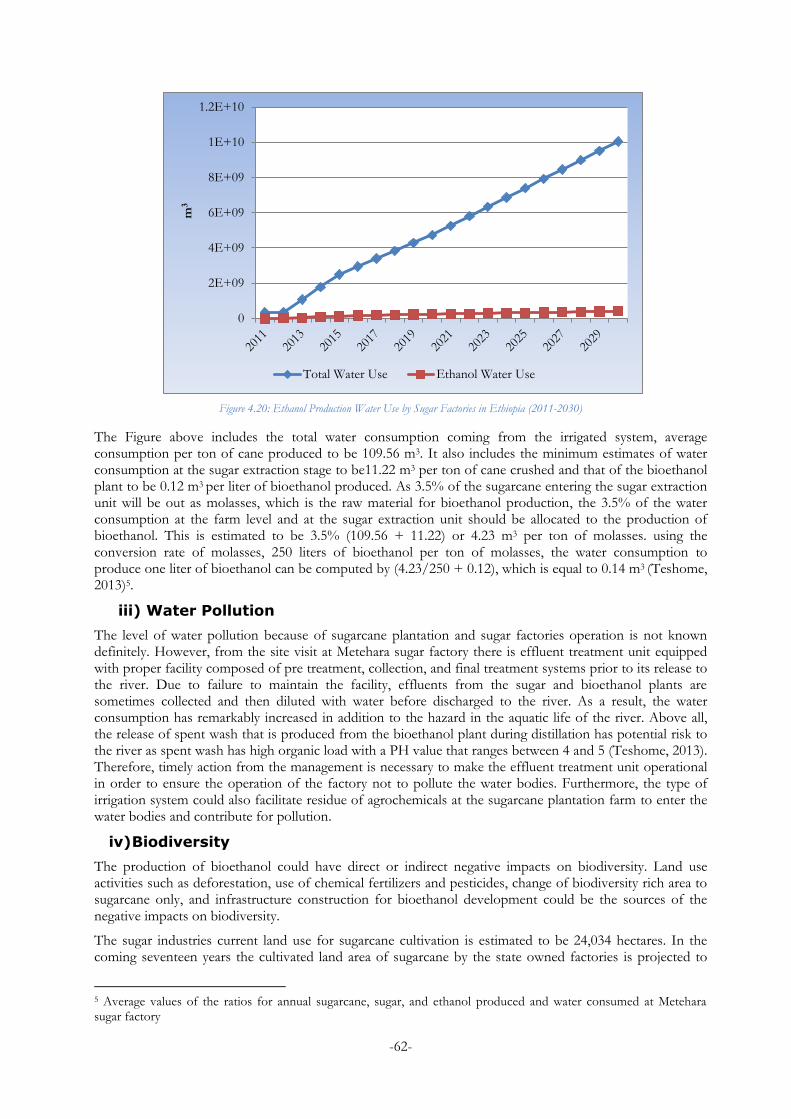
-62-
Figure 4.20: Ethanol Production Water Use by Sugar Factories in Ethiopia (2011-2030)
The Figure above includes the total water consumption coming from the irrigated system, average consumption per ton of cane produced to be 109.56 m3. It also includes the minimum estimates of water consumption at the sugar extraction stage to be11.22 m3 per ton of cane crushed and that of the bioethanol plant to be 0.12 m3 per liter of bioethanol produced. As 3.5% of the sugarcane entering the sugar extraction unit will be out as molasses, which is the raw material for bioethanol production, the 3.5% of the water consumption at the farm level and at the sugar extraction unit should be allocated to the production of bioethanol. This is estimated to be 3.5% (109.56 + 11.22) or 4.23 m3 per ton of molasses. using the conversion rate of molasses, 250 liters of bioethanol per ton of molasses, the water consumption to produce one liter of bioethanol can be computed by (4.23/250 + 0.12), which is equal to 0.14 m3 (Teshome, 2013)5.
iii) Water Pollution
The level of water pollution because of sugarcane plantation and sugar factories operation is not known definitely. However, from the site visit at Metehara sugar factory there is effluent treatment unit equipped with proper facility composed of pre treatment, collection, and final treatment systems prior to its release to the river. Due to failure to maintain the facility, effluents from the sugar and bioethanol plants are sometimes collected and then diluted with water before discharged to the river. As a result, the water consumption has remarkably increased in addition to the hazard in the aquatic life of the river. Above all, the release of spent wash that is produced from the bioethanol plant during distillation has potential risk to the river as spent wash has high organic load with a PH value that ranges between 4 and 5 (Teshome, 2013). Therefore, timely action from the management is necessary to make the effluent treatment unit operational in order to ensure the operation of the factory not to pollute the water bodies. Furthermore, the type of irrigation system could also facilitate residue of agrochemicals at the sugarcane plantation farm to enter the water bodies and contribute for pollution.
iv) Biodiversity
The production of bioethanol could have direct or indirect negative impacts on biodiversity. Land use activities such as deforestation, use of chemical fertilizers and pesticides, change of biodiversity rich area to sugarcane only, and infrastructure construction for bioethanol development could be the sources of the negative impacts on biodiversity.
The sugar industries current land use for sugarcane cultivation is estimated to be 24,034 hectares. In the coming seventeen years the cultivated land area of sugarcane by the state owned factories is projected to
5 Average values of the ratios for annual sugarcane, sugar, and ethanol produced and water consumed at Metehara sugar factory
0
2E+09
4E+09
6E+09
8E+09
1E+10
1.2E+10
m3
Total Water Use Ethanol Water Use
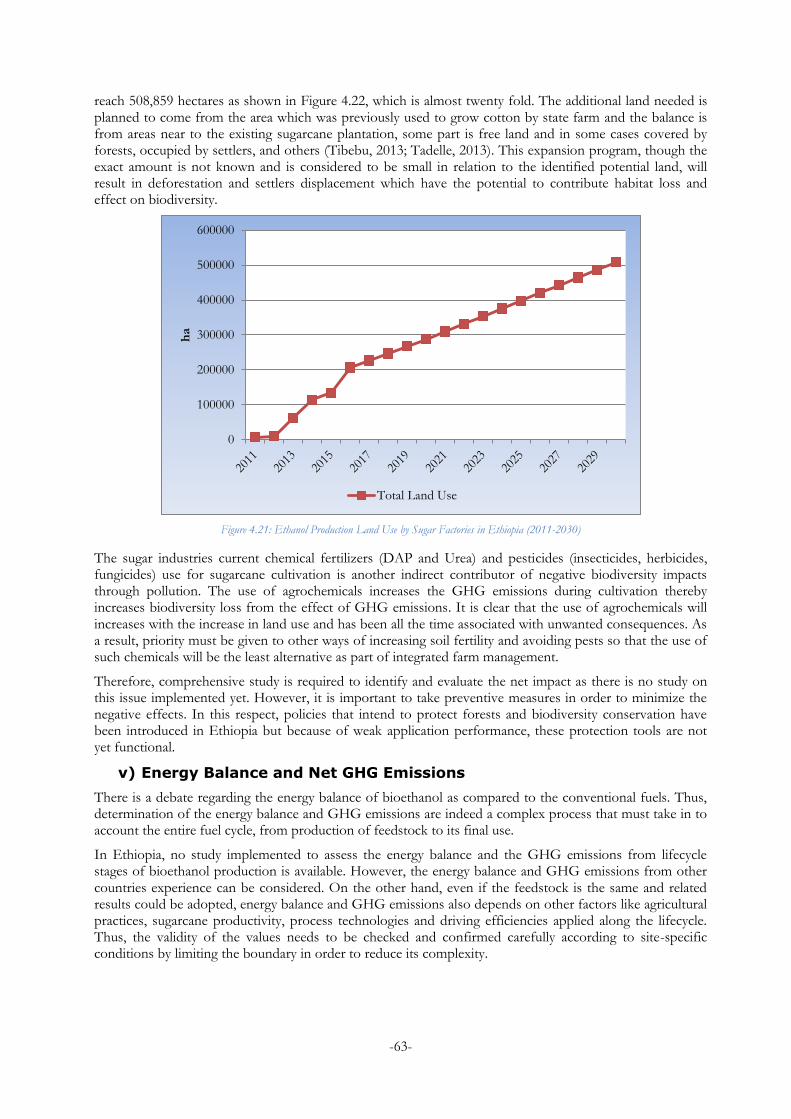
-63-
reach 508,859 hectares as shown in Figure 4.22, which is almost twenty fold. The additional land needed is planned to come from the area which was previously used to grow cotton by state farm and the balance is from areas near to the existing sugarcane plantation, some part is free land and in some cases covered by forests, occupied by settlers, and others (Tibebu, 2013; Tadelle, 2013). This expansion program, though the exact amount is not known and is considered to be small in relation to the identified potential land, will result in deforestation and settlers displacement which have the potential to contribute habitat loss and effect on biodiversity.
Figure 4.21: Ethanol Production Land Use by Sugar Factories in Ethiopia (2011-2030)
The sugar industries current chemical fertilizers (DAP and Urea) and pesticides (insecticides, herbicides, fungicides) use for sugarcane cultivation is another indirect contributor of negative biodiversity impacts through pollution. The use of agrochemicals increases the GHG emissions during cultivation thereby increases biodiversity loss from the effect of GHG emissions. It is clear that the use of agrochemicals will increases with the increase in land use and has been all the time associated with unwanted consequences. As a result, priority must be given to other ways of increasing soil fertility and avoiding pests so that the use of such chemicals will be the least alternative as part of integrated farm management.
Therefore, comprehensive study is required to identify and evaluate the net impact as there is no study on this issue implemented yet. However, it is important to take preventive measures in order to minimize the negative effects. In this respect, policies that intend to protect forests and biodiversity conservation have been introduced in Ethiopia but because of weak application performance, these protection tools are not yet functional.
v) Energy Balance and Net GHG Emissions
There is a debate regarding the energy balance of bioethanol as compared to the conventional fuels. Thus, determination of the energy balance and GHG emissions are indeed a complex process that must take in to account the entire fuel cycle, from production of feedstock to its final use.
In Ethiopia, no study implemented to assess the energy balance and the GHG emissions from lifecycle stages of bioethanol production is available. However, the energy balance and GHG emissions from other countries experience can be considered. On the other hand, even if the feedstock is the same and related results could be adopted, energy balance and GHG emissions also depends on other factors like agricultural practices, sugarcane productivity, process technologies and driving efficiencies applied along the lifecycle. Thus, the validity of the values needs to be checked and confirmed carefully according to site-specific conditions by limiting the boundary in order to reduce its complexity.
0
100000
200000
300000
400000
500000
600000
ha
Total Land Use
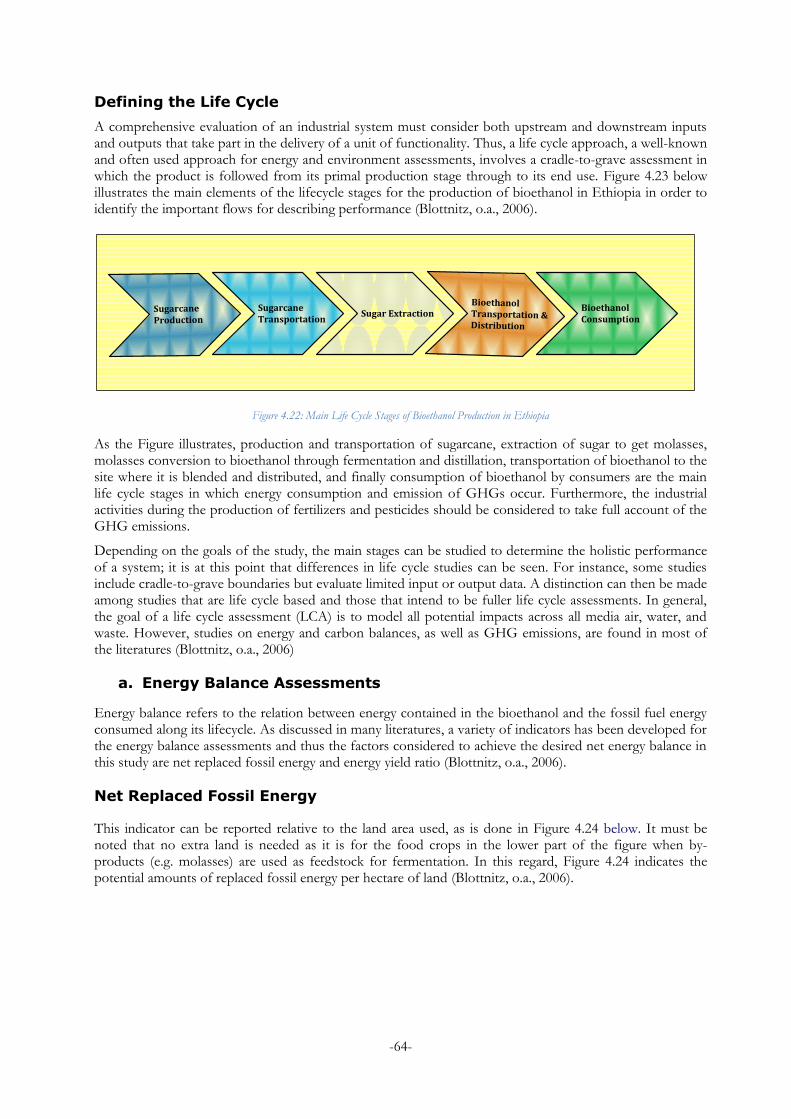
-64-
Defining the Life Cycle
A comprehensive evaluation of an industrial system must consider both upstream and downstream inputs and outputs that take part in the delivery of a unit of functionality. Thus, a life cycle approach, a well-known and often used approach for energy and environment assessments, involves a cradle-to-grave assessment in which the product is followed from its primal production stage through to its end use. Figure 4.23 below illustrates the main elements of the lifecycle stages for the production of bioethanol in Ethiopia in order to identify the important flows for describing performance (Blottnitz, o.a., 2006).
Bioethanol Consumption
Sugarcane Transportation
Sugarcane
Production
Bioethanol Transportation & Distribution
Sugar Extraction
Figure 4.22: Main Life Cycle Stages of Bioethanol Production in Ethiopia
As the Figure illustrates, production and transportation of sugarcane, extraction of sugar to get molasses, molasses conversion to bioethanol through fermentation and distillation, transportation of bioethanol to the site where it is blended and distributed, and finally consumption of bioethanol by consumers are the main life cycle stages in which energy consumption and emission of GHGs occur. Furthermore, the industrial activities during the production of fertilizers and pesticides should be considered to take full account of the GHG emissions.
Depending on the goals of the study, the main stages can be studied to determine the holistic performance of a system; it is at this point that differences in life cycle studies can be seen. For instance, some studies include cradle-to-grave boundaries but evaluate limited input or output data. A distinction can then be made among studies that are life cycle based and those that intend to be fuller life cycle assessments. In general, the goal of a life cycle assessment (LCA) is to model all potential impacts across all media air, water, and waste. However, studies on energy and carbon balances, as well as GHG emissions, are found in most of the literatures (Blottnitz, o.a., 2006)
a. Energy Balance Assessments
Energy balance refers to the relation between energy contained in the bioethanol and the fossil fuel energy consumed along its lifecycle. As discussed in many literatures, a variety of indicators has been developed for the energy balance assessments and thus the factors considered to achieve the desired net energy balance in this study are net replaced fossil energy and energy yield ratio (Blottnitz, o.a., 2006).
Net Replaced Fossil Energy
This indicator can be reported relative to the land area used, as is done in Figure 4.24 below. It must be noted that no extra land is needed as it is for the food crops in the lower part of the figure when by-products (e.g. molasses) are used as feedstock for fermentation. In this regard, Figure 4.24 indicates the potential amounts of replaced fossil energy per hectare of land (Blottnitz, o.a., 2006).
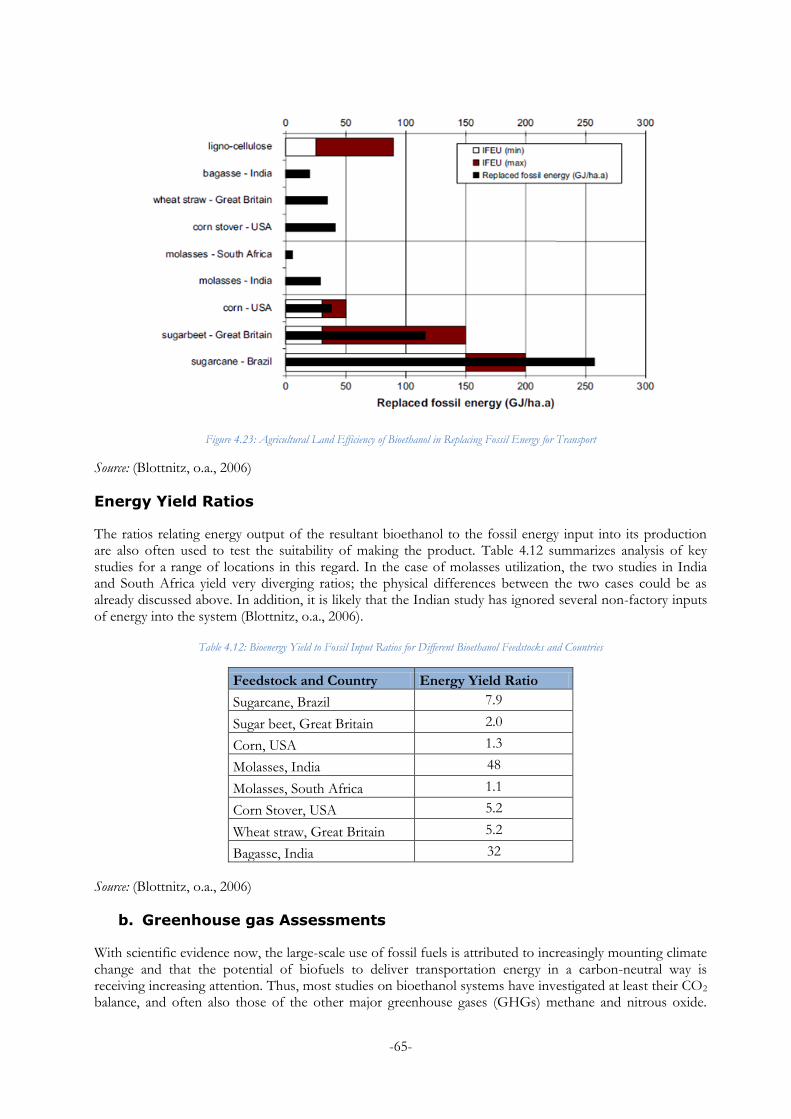
-65-
Figure 4.23: Agricultural Land Efficiency of Bioethanol in Replacing Fossil Energy for Transport
Source: (Blottnitz, o.a., 2006)
Energy Yield Ratios
The ratios relating energy output of the resultant bioethanol to the fossil energy input into its production are also often used to test the suitability of making the product. Table 4.12 summarizes analysis of key studies for a range of locations in this regard. In the case of molasses utilization, the two studies in India and South Africa yield very diverging ratios; the physical differences between the two cases could be as already discussed above. In addition, it is likely that the Indian study has ignored several non-factory inputs of energy into the system (Blottnitz, o.a., 2006).
Table 4.12: Bioenergy Yield to Fossil Input Ratios for Different Bioethanol Feedstocks and Countries
Feedstock and Country Energy Yield Ratio
Sugarcane, Brazil 7.9
Sugar beet, Great Britain 2.0
Corn, USA 1.3
Molasses, India 48
Molasses, South Africa 1.1
Corn Stover, USA 5.2
Wheat straw, Great Britain 5.2
Bagasse, India 32
Source: (Blottnitz, o.a., 2006)
b. Greenhouse gas Assessments
With scientific evidence now, the large-scale use of fossil fuels is attributed to increasingly mounting climate change and that the potential of biofuels to deliver transportation energy in a carbon-neutral way is receiving increasing attention. Thus, most studies on bioethanol systems have investigated at least their CO2 balance, and often also those of the other major greenhouse gases (GHGs) methane and nitrous oxide.
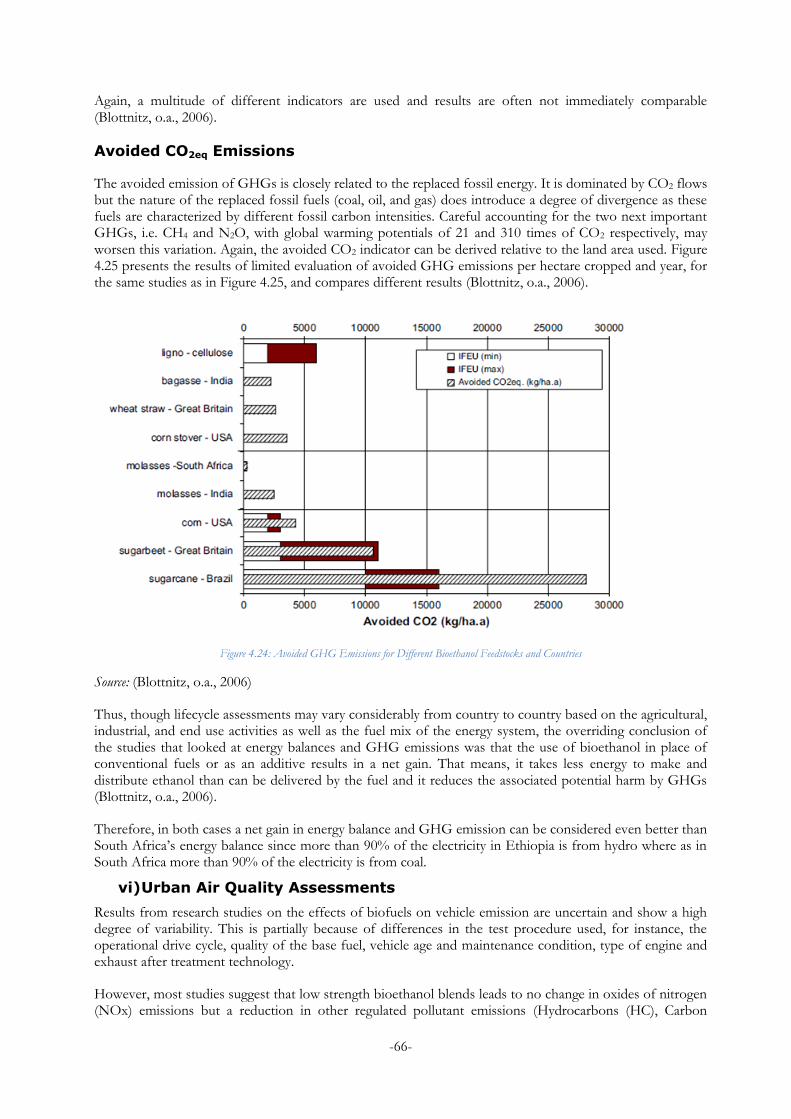
-66-
Again, a multitude of different indicators are used and results are often not immediately comparable (Blottnitz, o.a., 2006).
Avoided CO2eq Emissions
The avoided emission of GHGs is closely related to the replaced fossil energy. It is dominated by CO2 flows but the nature of the replaced fossil fuels (coal, oil, and gas) does introduce a degree of divergence as these fuels are characterized by different fossil carbon intensities. Careful accounting for the two next important GHGs, i.e. CH4 and N2O, with global warming potentials of 21 and 310 times of CO2 respectively, may worsen this variation. Again, the avoided CO2 indicator can be derived relative to the land area used. Figure 4.25 presents the results of limited evaluation of avoided GHG emissions per hectare cropped and year, for the same studies as in Figure 4.25, and compares different results (Blottnitz, o.a., 2006).
Figure 4.24: Avoided GHG Emissions for Different Bioethanol Feedstocks and Countries
Source: (Blottnitz, o.a., 2006)
Thus, though lifecycle assessments may vary considerably from country to country based on the agricultural, industrial, and end use activities as well as the fuel mix of the energy system, the overriding conclusion of the studies that looked at energy balances and GHG emissions was that the use of bioethanol in place of conventional fuels or as an additive results in a net gain. That means, it takes less energy to make and distribute ethanol than can be delivered by the fuel and it reduces the associated potential harm by GHGs (Blottnitz, o.a., 2006).
Therefore, in both cases a net gain in energy balance and GHG emission can be considered even better than South Africa’s energy balance since more than 90% of the electricity in Ethiopia is from hydro where as in South Africa more than 90% of the electricity is from coal.
vi) Urban Air Quality Assessments
Results from research studies on the effects of biofuels on vehicle emission are uncertain and show a high degree of variability. This is partially because of differences in the test procedure used, for instance, the operational drive cycle, quality of the base fuel, vehicle age and maintenance condition, type of engine and exhaust after treatment technology.
However, most studies suggest that low strength bioethanol blends leads to no change in oxides of nitrogen (NOx) emissions but a reduction in other regulated pollutant emissions (Hydrocarbons (HC), Carbon
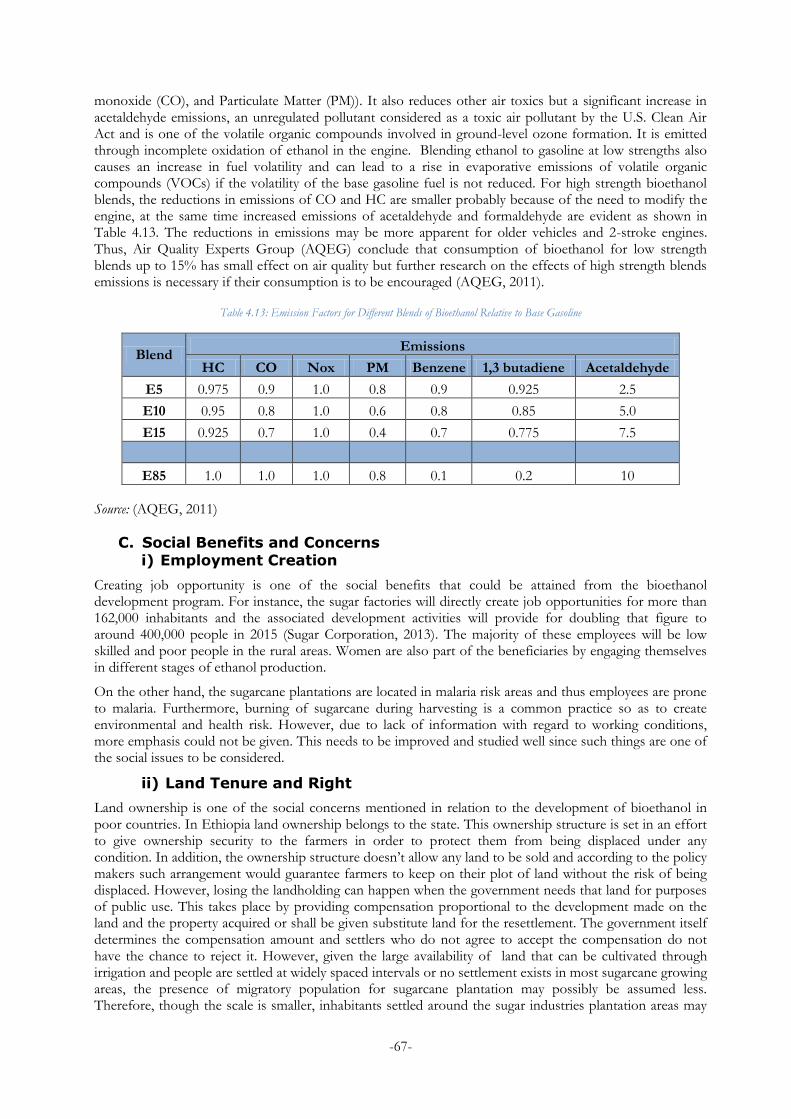
-67-
monoxide (CO), and Particulate Matter (PM)). It also reduces other air toxics but a significant increase in acetaldehyde emissions, an unregulated pollutant considered as a toxic air pollutant by the U.S. Clean Air Act and is one of the volatile organic compounds involved in ground-level ozone formation. It is emitted through incomplete oxidation of ethanol in the engine. Blending ethanol to gasoline at low strengths also causes an increase in fuel volatility and can lead to a rise in evaporative emissions of volatile organic compounds (VOCs) if the volatility of the base gasoline fuel is not reduced. For high strength bioethanol blends, the reductions in emissions of CO and HC are smaller probably because of the need to modify the engine, at the same time increased emissions of acetaldehyde and formaldehyde are evident as shown in Table 4.13. The reductions in emissions may be more apparent for older vehicles and 2-stroke engines. Thus, Air Quality Experts Group (AQEG) conclude that consumption of bioethanol for low strength blends up to 15% has small effect on air quality but further research on the effects of high strength blends emissions is necessary if their consumption is to be encouraged (AQEG, 2011).
Table 4.13: Emission Factors for Different Blends of Bioethanol Relative to Base Gasoline
Blend Emissions
HC CO Nox PM Benzene 1,3 butadiene Acetaldehyde
E5 0.975 0.9 1.0 0.8 0.9 0.925 2.5
E10 0.95 0.8 1.0 0.6 0.8 0.85 5.0
E15 0.925 0.7 1.0 0.4 0.7 0.775 7.5
E85 1.0 1.0 1.0 0.8 0.1 0.2 10
Source: (AQEG, 2011)
C. Social Benefits and Concerns i) Employment Creation
Creating job opportunity is one of the social benefits that could be attained from the bioethanol development program. For instance, the sugar factories will directly create job opportunities for more than 162,000 inhabitants and the associated development activities will provide for doubling that figure to around 400,000 people in 2015 (Sugar Corporation, 2013). The majority of these employees will be low skilled and poor people in the rural areas. Women are also part of the beneficiaries by engaging themselves in different stages of ethanol production.
On the other hand, the sugarcane plantations are located in malaria risk areas and thus employees are prone to malaria. Furthermore, burning of sugarcane during harvesting is a common practice so as to create environmental and health risk. However, due to lack of information with regard to working conditions, more emphasis could not be given. This needs to be improved and studied well since such things are one of the social issues to be considered.
ii) Land Tenure and Right
Land ownership is one of the social concerns mentioned in relation to the development of bioethanol in poor countries. In Ethiopia land ownership belongs to the state. This ownership structure is set in an effort to give ownership security to the farmers in order to protect them from being displaced under any condition. In addition, the ownership structure doesn’t allow any land to be sold and according to the policy makers such arrangement would guarantee farmers to keep on their plot of land without the risk of being displaced. However, losing the landholding can happen when the government needs that land for purposes of public use. This takes place by providing compensation proportional to the development made on the land and the property acquired or shall be given substitute land for the resettlement. The government itself determines the compensation amount and settlers who do not agree to accept the compensation do not have the chance to reject it. However, given the large availability of land that can be cultivated through irrigation and people are settled at widely spaced intervals or no settlement exists in most sugarcane growing areas, the presence of migratory population for sugarcane plantation may possibly be assumed less. Therefore, though the scale is smaller, inhabitants settled around the sugar industries plantation areas may
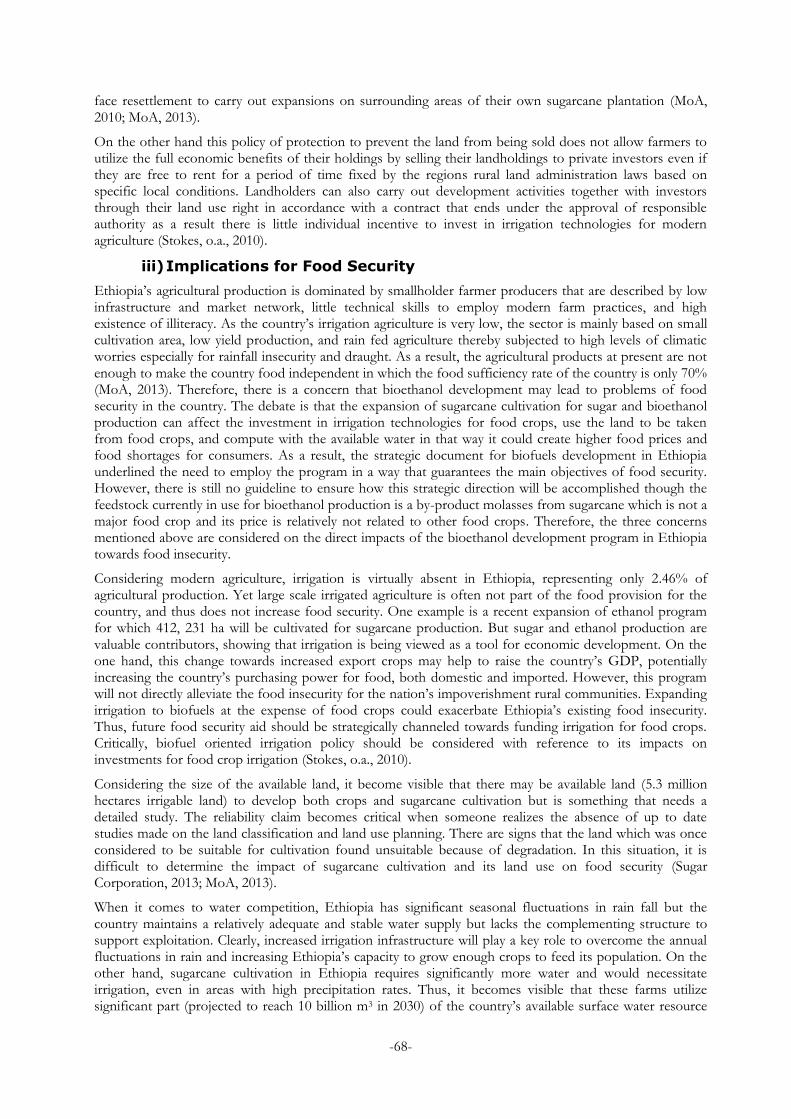
-68-
face resettlement to carry out expansions on surrounding areas of their own sugarcane plantation (MoA, 2010; MoA, 2013).
On the other hand this policy of protection to prevent the land from being sold does not allow farmers to utilize the full economic benefits of their holdings by selling their landholdings to private investors even if they are free to rent for a period of time fixed by the regions rural land administration laws based on specific local conditions. Landholders can also carry out development activities together with investors through their land use right in accordance with a contract that ends under the approval of responsible authority as a result there is little individual incentive to invest in irrigation technologies for modern agriculture (Stokes, o.a., 2010).
iii) Implications for Food Security
Ethiopia’s agricultural production is dominated by smallholder farmer producers that are described by low infrastructure and market network, little technical skills to employ modern farm practices, and high existence of illiteracy. As the country’s irrigation agriculture is very low, the sector is mainly based on small cultivation area, low yield production, and rain fed agriculture thereby subjected to high levels of climatic worries especially for rainfall insecurity and draught. As a result, the agricultural products at present are not enough to make the country food independent in which the food sufficiency rate of the country is only 70% (MoA, 2013). Therefore, there is a concern that bioethanol development may lead to problems of food security in the country. The debate is that the expansion of sugarcane cultivation for sugar and bioethanol production can affect the investment in irrigation technologies for food crops, use the land to be taken from food crops, and compute with the available water in that way it could create higher food prices and food shortages for consumers. As a result, the strategic document for biofuels development in Ethiopia underlined the need to employ the program in a way that guarantees the main objectives of food security. However, there is still no guideline to ensure how this strategic direction will be accomplished though the feedstock currently in use for bioethanol production is a by-product molasses from sugarcane which is not a major food crop and its price is relatively not related to other food crops. Therefore, the three concerns mentioned above are considered on the direct impacts of the bioethanol development program in Ethiopia towards food insecurity.
Considering modern agriculture, irrigation is virtually absent in Ethiopia, representing only 2.46% of agricultural production. Yet large scale irrigated agriculture is often not part of the food provision for the country, and thus does not increase food security. One example is a recent expansion of ethanol program for which 412, 231 ha will be cultivated for sugarcane production. But sugar and ethanol production are valuable contributors, showing that irrigation is being viewed as a tool for economic development. On the one hand, this change towards increased export crops may help to raise the country’s GDP, potentially increasing the country’s purchasing power for food, both domestic and imported. However, this program will not directly alleviate the food insecurity for the nation’s impoverishment rural communities. Expanding irrigation to biofuels at the expense of food crops could exacerbate Ethiopia’s existing food insecurity. Thus, future food security aid should be strategically channeled towards funding irrigation for food crops. Critically, biofuel oriented irrigation policy should be considered with reference to its impacts on investments for food crop irrigation (Stokes, o.a., 2010).
Considering the size of the available land, it become visible that there may be available land (5.3 million hectares irrigable land) to develop both crops and sugarcane cultivation but is something that needs a detailed study. The reliability claim becomes critical when someone realizes the absence of up to date studies made on the land classification and land use planning. There are signs that the land which was once considered to be suitable for cultivation found unsuitable because of degradation. In this situation, it is difficult to determine the impact of sugarcane cultivation and its land use on food security (Sugar Corporation, 2013; MoA, 2013).
When it comes to water competition, Ethiopia has significant seasonal fluctuations in rain fall but the country maintains a relatively adequate and stable water supply but lacks the complementing structure to support exploitation. Clearly, increased irrigation infrastructure will play a key role to overcome the annual fluctuations in rain and increasing Ethiopia’s capacity to grow enough crops to feed its population. On the other hand, sugarcane cultivation in Ethiopia requires significantly more water and would necessitate irrigation, even in areas with high precipitation rates. Thus, it becomes visible that these farms utilize significant part (projected to reach 10 billion m3 in 2030) of the country’s available surface water resource
-69-
(110 billion m3). This should also be verified by revised study as the water resources may be accumulated in a specific area where they cannot be utilized as estimated (Stokes, o.a., 2010).
In general, with the high price of gasoline, bioethanol can be increasingly attractive for fuel substitution and create more demand. As a result, growing feedstock that needs large investment on irrigation technologies, area of land, and amount of water may affect the food security which is in fact uncertain with the absence of recent and adequate study. Therefore, with the absence of clear guideline for the implementation of the biofuels development strategy to prevent food crop production and the weak level of policy implementation practice, there exist a potential risk on sugarcane cultivation to compete with technology, land, and water in so doing influence the effort to food security, eventually increasing migration and possibly conflict. Clearly, capacity building is crucial to navigate these additive and synergistic problems.
Domestic production of bioethanol provides a range of other linked benefits in addition to the benefits mentioned previously. Such benefits include: electrical power production by co-generation and energy security.
D. Energy Diversification
Sugar and bioethanol Production has a potential to generate electrical power by co-generation to be connected to the national grid in order to enhance the country’s electrical power generating capacity. Particularly this is essential to decrease the dependency on rain water hydropower system of the country. For instance, due to water shortage caused by absence of rain, electrical power supply has been in portion for several times. Thus, in the upcoming years, by installing appropriate co-generation equipments and improving the operational efficiencies, the sector plans to generate electrical power for the national grid that sum up as shown in Figure 4.19 below. This additional electricity generation clearly improves the overall energy system efficiency. Furthermore, the factories will able to sell a total of 607 GWh of energy annually to the national utility starting 2015 (MoWE, 2013).
Figure 4.25: Electricity Generation from Sugar Factories Co-generation Plants in Ethiopia (2012-2020)
E. Energy Security
The introduction of bioethanol as a transport fuel allows not importing the same quantity of gasoline in that way it reduces the need for foreign currency to be spent. This permits to allocate the saved money to be used on the same or other energy saving projects in addition to the direct benefit on the balance of payments. Furthermore, having own energy supply reduces the reliance on international energy supply in order to facilitate and secure the growing transport energy demand of the country. It will also have significant advantages to reduce the transport tariff and price of other commodities due to the availability at affordable price (MoWE, 2013). Thus, ensuring ethanol supply by enhancing production could:
Strengthen the stability and reliability of existing transport energy supply
0
20
40
60
80
100
120
140
2012 2015 2020
MW
Electricity
-70-
Maximize utilization of indigenous energy resources
Improve energy supply and utilization systems by introducing efficient technologies
Facilitate and encourage appropriate mix of diversified energy supply
Maintain appropriate reserve capacity for petroleum products
Improve the effectiveness and efficiency of the transport energy
4.5.2 Difficulties
Following the endorsement of a strategic document for the development of biofuels by the council of Ministries in 2007, there was uncoordinated effort to commence bioethanol blend with gasoline mainly by Fincha sugar factory. In recent times, enhanced work coordinated by the Ministry of Water and Energy involving different bodies has been built up mainly looking into ways to promote the implementation of the strategy. In these efforts, deadlines had been let pass that were set to be the dates to start use of 5% and10% bioethanol blends and its continuous use has been altered. This suggests that implementation is lagging behind the expressed need for using bioethanol; though improvement has been seen in terms of drafting guidelines to use bioethanol, there are uncertainties as to when exactly the blend targets should start. Thus, there are host of difficulties responsible for the delay and variance of the plan and its actual implementation. These certain difficulties contributing to the delay of bioethanol use as a transport fuel and local market development remains within economic, technical, knowledge and information, and public and institutional policies. The list of difficulties outlined in the literature review chapter indicates this identification. Hence, all interviewees were conducted according to the framework of the literature review information in order to identify and explain the existing blocking modes of the bioethanol use program in Ethiopia and strongly supported responses are taken here for discussion. Sometimes site visit observation was also used in the process of identification and discussion. Thus, the next parts describe the major difficulties blocking the progress to expand bioethanol production and use in Ethiopia.
A. Economic Difficulties
The persistence and extension of bioethanol use in Ethiopia requires at least the collaboration of the producers, blenders, and distributors. Thus, the bioethanol development confronts a problem if one of these stages is unable to stand on its feet.
The Production of bioethanol at the present setup appears monopolized by the state owned Ethiopian Sugar Corporation in which all the state sugar factories are managed. Since the price of gasoline is much higher than the production cost of bioethanol, there will definitely be an economic incentive to the sugar industries in order to promote the use of bioethanol as a transport fuel. With the current supply structure, it is well known that the use of bioethanol would benefit the sugar factories and thus they are pushing hard and work as major promoters. However, due to the need of huge investment that requires big capital and no economic incentive established at the moment for investors, the involvement of private investors on bioethanol development has been limited. Focus is given only to the state owned sugar industries despite the priority given to the sector. Thus, as has been mentioned, the use of bioethanol is expected to save considerable amount of money per year through reduced imported fuel but big capital expenditure are needed first to install capacity on a massive scale (Tibebu, 2013).
The blending service is provided by Nile Petroleum, Libya oil, and National Oil Ethiopia. According to the contract agreement with the Ethiopian government, Ministry of Trade, these companies receive on average ETB 0.04 for every liter of blended gasoline. This fee entails insufficient margin and leads to long payback period as the capital expense to build the blending stations was huge, for instance, NOC ETB 45 million and that of Libya Oil ETB 10 million. However, this fee may give them modest incentive in addition to the company’s commitment to move forward and continue blending (Abadi, 2013; Sherif, 2013; Tilahun, 2013; Alemayehu, 2013).
The distribution service is provided by the nine oil companies in the country and due to the unsatisfactory economic incentives, many companies have withdrawn from the business. As there is no oil refinery in Ethiopia, the companies work as distributors selling the different fuels through their own networks all over the country. Their income is determined by a distributor margin that covers the costs of collecting, transporting, selling, and a definite rather small profit per liter sold of the fuel. With this structure, the industry is not competitive rather it is described as cooperative with the companies blending the fuel. The distributing companies in service are agreed theoretically to distribute the blended gasoline in the capital as
-71-
the direction of the government is to implement a mandatory blended fuel distribution system. However, they are extremely unwilling towards the movement to introduce higher blends all over the country as there is no specific incentive means induced to them. They are simply trying to work towards the development of bioethanol just to avoid the blame from the government side and systematically delay the progress. This is because of the need to get additional margin, more than what they are getting now, due to the extra investment and operational cost they are going to spend when they deal with the higher blend targets. Moreover, due to absence of low interest loan, the oil distributing companies claim that the investment cost required for upgrading their system should be covered by the government (Abadi, 2013; Sherif, 2013; Tilahun, 2013; Alemayehu, 2013). Thus, without solving the issue of the additional expense coverage and shifting the position of the oil distributing companies, the growth and expansion of blended gasoline use will be very slow and this unsatisfactory economic incentive is a noticeable economic difficulty.
B. Technical Difficulties
Investments in bioethanol development can be risky because it involves many technical uncertainties. In the case of oil distributing companies, there is need to improve technical and financial capabilities beyond their capacity for distributing the conventional petroleum products. Thus, two important difficulties that possibly hold back the promotion of bioethanol are discussed here: local quality problem and local product performance (World Energy Council, 2010).
i) Local Quality Problem
Practically almost no water can dissolve in gasoline but blended gasoline containing a definite amount of water is able to bring a separation into two phases, which may cause vehicles to stall. As a result, gasoline requires anhydrous ethanol that should be kept free of moisture during transport, storage, and distribution thereby to guarantee the blend quality from water contamination through the following activities (Abadi, 2013; Sherif, 2013; Tilahun, 2013; Alemayehu, 2013).
Production of anhydrous bioethanol with pure ethanol content
Storage of bioethanol on moisture preventing tanks in the distillery
Transport of bioethanol from the distillery to the blending station using moisture preventing tankers
Storage of bioetanol and gasoline on moisture preventing tanks in the blending station
Transport of the blend from the blending station to the fuel station using moisture preventing tankers
Storage of bioethanol on moisture preventing tanks in the distribution stations
Because of the need to keep the quality at all levels on one side and the lack of quality control system at present on the other, the issue of quality has been one of the difficulties in promoting bioethanol. Currently, Fincha and Metehara sugar factories are trying to fulfill all the requirements of delivering anhydrous bioethanol, with a concentration of 99.8%, to the blending stations (Teshome, 2013). This means that there is no water contamination problem from the existing factories and the same standard is also expected to be followed by others. The blending stations are also included all the essential safety measures in order to implement the blending in accordance to the quality standards fulfilling the points mentioned above. However, the oil distributing companies are strongly resisting joining the force that promote bioethanol as they have responsibilities that need to be fulfilled by old fuel stations that do not comply with the required standard to store blended gasoline. As a result, they are working to upgrade their stations for which they have to spend additional cost and thus need additional margin to cover this expense. In addition to the extra cost for renewal of the fuel stations, they also claim on the additional operating cost to transport gasoline from border to the blending station and then to their distribution stations as they used to transport from the border directly to their distribution stations.
Generally, the quality control system is still an issue along the supply chain that has not definitely decided with regard to where to base and who to control. It is important to remember here that the Quality and Standard Authority of Ethiopia (QSAE) has previously developed a standard for the blended gasoline and
-72-
the main components which are being revised by the request of EPSE. Therefore, the uncertain quality control problem including for adulteration and its associated cost are still obstructing the progress.
ii) Local Product Performance
Most of the actors in the supply chain recognize that blend of bioethanol, at least up to 10%, has been in use in different countries without the need to modify the conventional engine. However, some of them especially oil distributing companies are still not convinced on the direct application of the product according to other countries experience without specific product performance test demonstration. The issues raised by distributors to limit their involvement are the difference in altitude, the incompatibility fear of blended fuel to old vehicles since the majority of the vehicles in Ethiopia are old, and mileage coverage per liter. Thus, there exists uncertainty about the performance of bioethanol which is given as a reason not to accelerate its production and use (Abadi, 2013; Sherif, 2013; Tilahun, 2013; Alemayehu, 2013).
To sum up, these concerns are actually related more to research and practical test demonstration as well as promotion to create awareness. Thus, local test may result to give confidence and outweigh the benefit of using blended gasoline so that actors on the supply chain with such dilemma could easily be aliened towards the need. But on the other hand lack of tests in the local condition should not limit the involvement and block the promotion as the concerns are scientifically unconfirmed. Recognizing these points as difficulties to promote bioethanol, most literatures reviewed on these points found no ground to delay the use of blended gasoline pending local test demonstrates.
C. Policy and Regulation Difficulties
Energy policy in Ethiopia indicates only the need to reduce the use of petroleum products in the transport sector by replacing the new non-petroleum fuels whenever possible. It also addresses the issue of how to develop supplies and how to utilize energy more efficiently. However, the issue of bioethanol is not treated well and thus it can be assumed that there is no policy in support of bioethanol that can encourage demand and form favorable condition for its growth.
The lack of such policy is obviously a factor blocking bioethanol development as investment decisions are very improbable if government policy that guarantees investment on the industry is not available. The present production of bioethanol by monopoly structure may not last evermore. Private producers are by now showing interest in getting into the industry that can bring efficiency improvement through competition. Such private investment to bioethanol development requires an incentive or secured market in some form. Thus, private sector will try to enter the industry only when government policy is enacted but some of the preliminary works could be done prior to the formulation of the policy like being practiced now though the actual production may take some years even after the policy formulation.
The absence of such policy have blocked not only potential private investors to develop bioethanol, even the state owned factories that have the potential to produce bioethanol have not considered the option in the past because of failure to create domestic market (Tadelle, 2013). This shows the companies that want to invest in bioethanol production and use, should make a decision based on an assessment of the costs of production and the estimated revenue over the life of a plant. Hence, investment in domestic production needs market certainty. The lower production cost of bioethanol in Ethiopia compared to the price of gasoline may be an indication of providing security in revenues. However, there could be other uncertainties, such as future costs and benefits resulting from changes in the sector that increases the risks. Therefore, government regulation requiring the use of bioethanol supply would provide the market safety when it comes to creating demand for bioethanol. Government policy in this case could provide assurance for developers getting into the sector by giving guarantee that there would be demand for bioethanol in the future.
D. Knowledge and Information Difficulties
Absence of educational system on modern bioenergy and little focus on the area in the past are the main factors contributing for the lack of knowledge and skill. Thus, many of the current experts are in the process of learning mainly from information on the web and other sources and hence the program does not deliver to the expectations of the government.
-73-
For instance, the development of biofuels in general and bioethanol to replace conventional fuels in particular is coordinated by Ministry of Water and Energy at the national level. Since bioethanol is one type of renewable energy and the ministry is in charge of energy related issues, assigning the ministry as the owner of the bioethanol development program is appropriate. However, the absence of personnel with expertise in biofuels energy system to control and manage the program is a concern. This is one of the major difficulties even the ministry itself admits for the slow progress towards bioethanol utilization (Tadelle, 2013). Therefore, the ministry sometimes abstains to ask actors on the supply chain, sometimes delays to answer enquiries from stakeholders, and sometimes there will be a point of confusion especially when some concerns about sustainability and environment rose.
On the other hand, one can observe even with the existence of research centers in the various sectors that might support bioethanol production and use, most of them do not participate in the current bioethanol development program as bioenergy has not been their main focus. This lack of research and development linkage creates failure to answer query rose in relation to bioethanol development program. Many of the statements that reflect doubts to utilize bioethanol could easily have been validated and the resistance that blocks progress would have been minimized if some research and investigative work could have been performed. Furthermore, even information required as a basis for policy making are absent due to the lack of previous studies thereby creates delays in the preparation of Polices and incentive mechanisms to promote the implementation of the strategic document.
-74-
5 Key Findings, Conclusions, Recommendations, and
Future works
Although Ethiopia has the potential to strengthen its economy by improving infrastructure and drafting policies to promote the energy sector, the level of modern energy utilization in the country remains low. However, the recent promising projects like the biofuels development program are coming to rescue its poor economy. As part of this thesis, the key findings of long-term shifts in bioethanol production and use are summarized in this chapter based on three guiding principles: the potential, the implications (social, environmental, economic), and the difficulties of the ongoing and future projects using the qualitative and quantitative modelling and analysis of the specific research in the previous chapter. Finally, this chapter will also draw conclusions and recommendations based on the findings of the work to indicate the socially suitable, environmentally acceptable and economically feasible plans.
5.1 Key Findings
5.1.1 Current status and Future potential
While different stakeholders are engaged in the current bioethanol development effort in Ethiopia, the production activity is completely made by sugar industries. Currently, three sugar factories namely Metehara, Fincha and Wonji/Shoa are involved in the production of sugar but only Metehara and Fincha are producing bioethanol. In addition expansion of the existing factories as well as construction of Tendaho sugar factory, which will be the biggest in its production capacity, and other ten new factories is in progress. All the factories cultivate sugarcane entirely for the production of sugar and they only produce or intend to produce bioethanol from molasses, the by-product of sugar extraction. Approximately 5.3 million hectares of irrigable land is available for multipurpose use. Of this, the suitable area identified for sugarcane plantation is 700,000 ha and is estimated to yield around one billion liters of bioethanol annually. The current annual ethanol production capacity of the country stands at about 11.1 million liters. In the next seventeen years (up to 2030), the projection estimates to reach a production volume of 690 million liters per year together with the ethanol production from other factories which are in the process of installing ethanol plants.
Ethanol blending was started in 2008 by Nile petroleum to deliver E5 to the capital’s SI engine vehicles, where 70% of gasoline consumption goes. Starting 2011, though it is not sustainable due to the lower production ability at full capacity of the factories, ethanol blending rose to E10 and is delivered by the three existing blending companies in the country. As the production increases, the target is to raise the ethanol share and expanded to other regions in order to reach E25 in 2025 by the expected 8 blending companies.
Oil distributing companies are involved in distributing petroleum products by receiving license from the government enterprise EPSE, which is now the only legally responsible state authority to purchase and import petroleum products in the country. There are nine oil distributing companies, even if unhappy primarily for economic reasons, will be those which are expected to distribute blended gasoline.
5.1.2 Benefits and Concerns
The use of bioethanol fuel as a substitute for petroleum products is expected to have significant economic, social, and environmental benefits and concerns. These include saving of scarce foreign currency through substitution of imports, earning of foreign currency from exports and sale of emission reduction certificate (ERC), employment creation, health and environmental advantages and risks.
i. Economic Implications
The present value of the gross foreign exchange saved from blending ethanol is around USD 30.2 million since the policy began in 2008. In addition, assuming the HBS the program has the potential to earn approximately 4.7 million Euros in foreign exchange through sales of ERSs up to 2030.
ii. Social Implications
The bioethanol development program will offer employment opportunities directly to more than 162,000 people that result in reducing urban unemployment. In addition, large scale production of bioethanol in Ethiopia will offer new employment opportunities for more than 400,000 people at the various
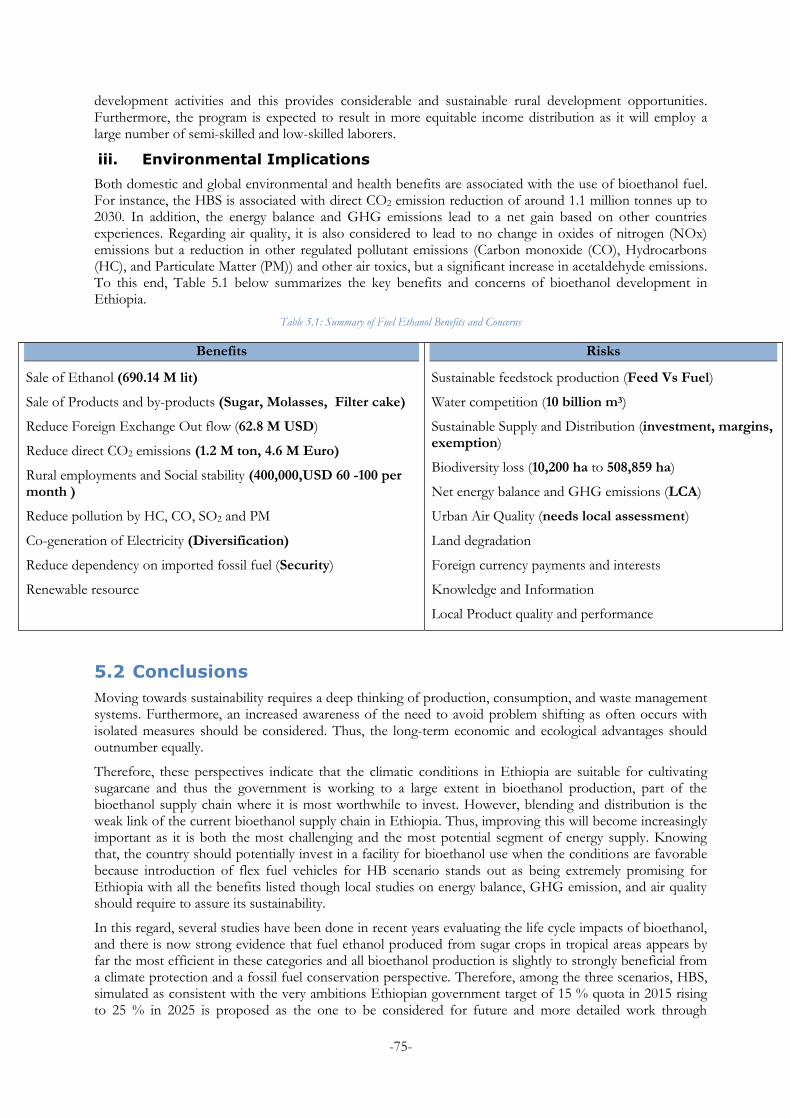
-75-
development activities and this provides considerable and sustainable rural development opportunities. Furthermore, the program is expected to result in more equitable income distribution as it will employ a large number of semi-skilled and low-skilled laborers.
iii. Environmental Implications
Both domestic and global environmental and health benefits are associated with the use of bioethanol fuel. For instance, the HBS is associated with direct CO2 emission reduction of around 1.1 million tonnes up to 2030. In addition, the energy balance and GHG emissions lead to a net gain based on other countries experiences. Regarding air quality, it is also considered to lead to no change in oxides of nitrogen (NOx) emissions but a reduction in other regulated pollutant emissions (Carbon monoxide (CO), Hydrocarbons (HC), and Particulate Matter (PM)) and other air toxics, but a significant increase in acetaldehyde emissions. To this end, Table 5.1 below summarizes the key benefits and concerns of bioethanol development in Ethiopia.
Table 5.1: Summary of Fuel Ethanol Benefits and Concerns
Benefits
Sale of Ethanol (690.14 M lit)
Sale of Products and by-products (Sugar, Molasses, Filter cake)
Reduce Foreign Exchange Out flow (62.8 M USD)
Reduce direct CO2 emissions (1.2 M ton, 4.6 M Euro)
Rural employments and Social stability (400,000,USD 60 -100 per month )
Reduce pollution by HC, CO, SO2 and PM
Co-generation of Electricity (Diversification)
Reduce dependency on imported fossil fuel (Security)
Renewable resource
Risks
Sustainable feedstock production (Feed Vs Fuel)
Water competition (10 billion m3)
Sustainable Supply and Distribution (investment, margins, exemption)
Biodiversity loss (10,200 ha to 508,859 ha)
Net energy balance and GHG emissions (LCA)
Urban Air Quality (needs local assessment)
Land degradation
Foreign currency payments and interests
Knowledge and Information
Local Product quality and performance
5.2 Conclusions
Moving towards sustainability requires a deep thinking of production, consumption, and waste management systems. Furthermore, an increased awareness of the need to avoid problem shifting as often occurs with isolated measures should be considered. Thus, the long-term economic and ecological advantages should outnumber equally.
Therefore, these perspectives indicate that the climatic conditions in Ethiopia are suitable for cultivating sugarcane and thus the government is working to a large extent in bioethanol production, part of the bioethanol supply chain where it is most worthwhile to invest. However, blending and distribution is the weak link of the current bioethanol supply chain in Ethiopia. Thus, improving this will become increasingly important as it is both the most challenging and the most potential segment of energy supply. Knowing that, the country should potentially invest in a facility for bioethanol use when the conditions are favorable because introduction of flex fuel vehicles for HB scenario stands out as being extremely promising for Ethiopia with all the benefits listed though local studies on energy balance, GHG emission, and air quality should require to assure its sustainability.
In this regard, several studies have been done in recent years evaluating the life cycle impacts of bioethanol, and there is now strong evidence that fuel ethanol produced from sugar crops in tropical areas appears by far the most efficient in these categories and all bioethanol production is slightly to strongly beneficial from a climate protection and a fossil fuel conservation perspective. Therefore, among the three scenarios, HBS, simulated as consistent with the very ambitions Ethiopian government target of 15 % quota in 2015 rising to 25 % in 2025 is proposed as the one to be considered for future and more detailed work through
-76-
modeling, provided the required input data could be gathered. The reasons supporting this choice are it is strongly believed that the increase share of ethanol would be enforced as it is an important way to promote biofuels and it would easily be altered to very high blend scenarios in case of a major break-through in upgrading the current facilities and quality control measures. The other reason is that the bioethanol production shift in the country is very high as shown in Figure 4.10 so use of this huge potential for local and competent sector will be an advantage. However, the HB target should not be obligatory as the case today and from the current point of view is quite unlikely to be achieved if lots of work with due care is not employed.
Generally, this study does not, of course, cover the full range of possible implications and their results in the standard impact categories. Further assessments should thus pay more attention to the local energy balance and safeguard subjects of human and ecological health. Cautions against fuel production policy on environmental sustainability extending from the crop to the wheel are likely to result in detrimental shifting of burdens.
5.3 Recommendations
Effort was made in chapters 4 in order to answer the research questions of this paper. This being the major task, it would also be important to include some relevant issues to the case under study at each stage of the supply chain.
First, developers and distributors need to create awareness. Ethanol producers should appreciate a large scale domestic use of their product that could potentially secure their market and benefits as it reduces transport and handling costs and makes their output more competitive. The two existing ethanol producers, Finchaa and Metehara, understood this and are actively pushing for the implementation of fuel ethanol use for high gasoline blend and then as a household fuel. This active involvement must continue with Finchaa, Metehara, and the other producers of ethanol in the future. The benefits of bioethanol will also be significant for all those in the supply chain with the estimated rise in the annual production volume of over 182 million liters within three years. For instance, moderate investment in distribution infrastructure may be required by oil companies and other retailers in the first few years but will have a profitable financial share in the future distribution of ethanol.
Second, ethanol is a domestic fuel introduced recently and therefore it requires active promotion. Though fuel ethanol has excellent qualities, it can be improved more in order to meet customer expectations. Thus, the NGOs and government bodies involved in energy technology development and deployment must work together to enhance service quality continuously. This may include customer surveys to obtain feedback on access and quality of the fuel and convey this on to other stakeholders including fuel producers, blenders, distributors, and government agencies for a measure.
Third, governmental bodies should enforce and implement policies and regulations. The development of fuel ethanol addresses most of the energy policy objectives and it is also unique in its range of benefits. One of the ways to transform these objectives into reality is the best use of the ethanol volume that is estimated to rise to more than tenfold of the current production in the next three years. Therefore, careful evaluation of the costs of benefits of the potential uses of ethanol (household fuel, gasoline blend, non-energy use, and exports) is required for the optimum benefits from this resource. It is the finding of this evaluation that determines the best option when it comes to maximizing the public and consumer benefits. To this effect, it is recommended to use fuel ethanol primarily as a substitute for petroleum products due to the reduction of import bill, reduction of government subsidies, lower lifecycle costs to users, and use of safe and clean fuel. However, the realization of these benefits needs policy and regulatory support inputs from the Ministry of Water and Energy (MoWE), Ministry of Trade (MoT), Environment Protection Authority (EPA), and Quality and Standards Authority of Ethiopia (QSAE) as summarized in Table 5.2 below.
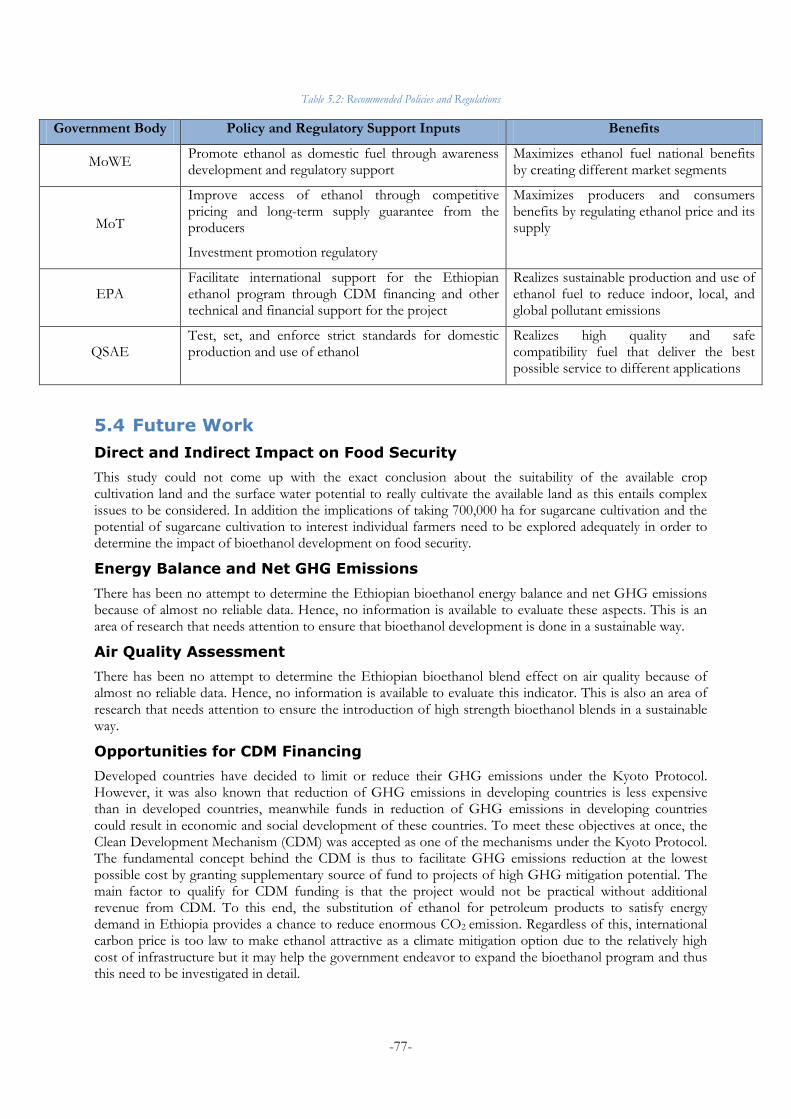
-77-
Table 5.2: Recommended Policies and Regulations
Government Body Policy and Regulatory Support Inputs Benefits
MoWE Promote ethanol as domestic fuel through awareness development and regulatory support
Maximizes ethanol fuel national benefits by creating different market segments
MoT
Improve access of ethanol through competitive pricing and long-term supply guarantee from the producers
Investment promotion regulatory
Maximizes producers and consumers benefits by regulating ethanol price and its supply
EPA Facilitate international support for the Ethiopian ethanol program through CDM financing and other technical and financial support for the project
Realizes sustainable production and use of ethanol fuel to reduce indoor, local, and global pollutant emissions
QSAE Test, set, and enforce strict standards for domestic production and use of ethanol
Realizes high quality and safe compatibility fuel that deliver the best possible service to different applications
5.4 Future Work
Direct and Indirect Impact on Food Security
This study could not come up with the exact conclusion about the suitability of the available crop cultivation land and the surface water potential to really cultivate the available land as this entails complex issues to be considered. In addition the implications of taking 700,000 ha for sugarcane cultivation and the potential of sugarcane cultivation to interest individual farmers need to be explored adequately in order to determine the impact of bioethanol development on food security.
Energy Balance and Net GHG Emissions
There has been no attempt to determine the Ethiopian bioethanol energy balance and net GHG emissions because of almost no reliable data. Hence, no information is available to evaluate these aspects. This is an area of research that needs attention to ensure that bioethanol development is done in a sustainable way.
Air Quality Assessment
There has been no attempt to determine the Ethiopian bioethanol blend effect on air quality because of almost no reliable data. Hence, no information is available to evaluate this indicator. This is also an area of research that needs attention to ensure the introduction of high strength bioethanol blends in a sustainable way.
Opportunities for CDM Financing
Developed countries have decided to limit or reduce their GHG emissions under the Kyoto Protocol. However, it was also known that reduction of GHG emissions in developing countries is less expensive than in developed countries, meanwhile funds in reduction of GHG emissions in developing countries could result in economic and social development of these countries. To meet these objectives at once, the Clean Development Mechanism (CDM) was accepted as one of the mechanisms under the Kyoto Protocol. The fundamental concept behind the CDM is thus to facilitate GHG emissions reduction at the lowest possible cost by granting supplementary source of fund to projects of high GHG mitigation potential. The main factor to qualify for CDM funding is that the project would not be practical without additional revenue from CDM. To this end, the substitution of ethanol for petroleum products to satisfy energy demand in Ethiopia provides a chance to reduce enormous CO2 emission. Regardless of this, international carbon price is too law to make ethanol attractive as a climate mitigation option due to the relatively high cost of infrastructure but it may help the government endeavor to expand the bioethanol program and thus this need to be investigated in detail.
-78-
Bibliography
2mercato. 2013.
http://www.2merkato.com/component/option,com_mtree/Itemid,31/link_id,14552/task,viewlink/.
www.2mercato.com. [Online] 2mercato Business Portal, 2013.
http://www.2merkato.com/component/option,com_mtree/Itemid,31/link_id,14552/task,viewlink/.
Abadi, Khidir. 2013. Supply Planing Manager. Nile Petroleum Co. Ltd. Office , Addis Ababa : Personal
Communication, April 30, 2013.
Adenew, Berhanu. 2007. Effective aid for Small Farmers in Sub-Sharan Africa: Southern Civil Society Perspective -
Ethiopia Case Study. Addis Ababa : Canadian Food Security Policy Group , 2007.
Alemayehu, Tesfaye. 2013. Marketing Manager. YBP. Office, Addis Ababa : Personal Communication,
May 13, 2013.
AQEG. 2011. Road Transport Biofuels: Impact on UK Air Quality. London : Crown, 2011.
Ayenew, Almaz. 2013. Director Inspection and Regulatory Directorate. MoT. Office, Addis Ababa :
Personal Communication, April 29, 2013.
Bebb, Adrian. 2008. Sustainability as a Somokescreen: The Inadequacy of Certifying Fuels and Feeds. Belgium :
BeelzePub, 2008.
Belay, Daniel. 2013. Design Engineer. Metehara Sugar Factory. Site, Metehara : Personal Communication,
May 20, 2013.
Berg, Christoph and F.O.Licht. 2004. World Fuel Ethanol Analysis and Outlook. Kent : s.n., 2004.
Blottnitz, Harro von and Curran, Mary ann. 2006. A Review of Assessments conducted on Bioethanol
as a Transportation Fuel rom a Net Energy, Greenhouse Gas, and Environmental Life Cycle Perspective.
Amsterdam : Elsevier, 2006.
Brijder, S., et al. 2005. Feasibility Study on an Effective and Sustainable Bioethanol Production Program by Least
Developed Countries as Alternative to Cane Sugar Export. Amsterdam : DSD, 2005.
CIA. 2013. https://www.cia.gov/library/publications/the-world-factbook/geos/et.html. www.cia.gov.
[Online] CIA, August 2013, 2013. [Cited: August 15, 2013.] https://www.cia.gov/library/publications/the-
world-factbook/geos/et.html.
CRGE. 2011. Ethiopia's Climate Resilient Green Economy: Green Economy Strategy. Addis Ababa :
FDRE, 2011.
CSA. 2013. Area and Production of Major Crops. Addis Ababa : FDRE, 2013.
Dejene, Alemneh. 2003. Integrated Natural Resources Management to Enhance Food Security: The Case for
Community-Based Approaches in Ethiopia. Rome : FAO, 2003.
Demirbas, Ayhan. 2009. Political, Economic and Environmental Impacts of Biofuels: A Review. Applied
Energy. amsterdam : Elsevier, 2009.
Dufey, Annie. 2006. Biofuels Production, Trade and sustainable Development: Emerging Issues. London :
IIED, 2006.
—. 2007. Key Issues for Global Sustainable Production and Trade: Seminar on Biofuels Business
Opportunities in Argentina. London : IIED, 2007.
EEA. 2012. Developments in the Transport Sector of Ethiopia . Addis Ababa : EEA, 2012.
EEA/EEPRI. 2002. Land Tenure and Agricultural Development In Ethiopia. Addis Ababa : EEA, 2002.
EEPCo. 2013. www.epco.gov.et. [Online] 2013.
-79-
EIA. 2013. http://www.eia.gov/. [Online] 2013.
Elobeid, Amani and Hart, Chad. 2007. Ethanol Expansion in the Food versus Fuel Debate: How Will
Developing Countries Fare? Explorations in Biofuels Economics, Policy, and History. California : The Berkeley
Electronic Press, 2007. Vol. 5.
EPA. 2012. United Nations Conference on Sustainable Development (Rio+20): National Report of Ethiopia. Addis
Ababa : FDRE, 2012.
Ethiopia Investor. 2013.
http://www.ethiopiainvestor.com/index.php?option=com_content&id=532&Itemid=88.
www.ethiopiainvestor. [Online] 2013.
EuropaBio. 2008. Biofuels and Developing Countries. Belgium : The Europian Association for Bio-
industries, 2008.
F.O.Licht. 2007-2011. World ethanol and Biofuels Reports Archive. 2007-2011.
FAOSTAT. 2013. http://faostat.fao.org/site/291/default.aspx. www.faostat.fao.org. [Online] 2013.
Fessehaie, Rezene. 2009. The Status of Biofuels in Ethiopia: Opportunities and Challenges. Nairobi :
IUCN, 2009.
Gebrehiwot, Kiflom. 2013. Biofuel Development Technology Information Junior Expert. MoWE. Office,
Addis Ababa : Personal Communication, April 23, 2013.
Geller, Howard. 2003. Energy Revolution: Policies for a Sustainable Future. Washington DC : Island Press, 2003.
1-55963-964-4.
Girma, Tagay. 2013. Biofuel Development Monitoring and Support Junior Expert. MoWE. Office, Addis
Ababa : Personal Communication, April 25, 2013.
Heckett, Tibebwa and Aklilu, Negusu. 2008. Agro Fuel Development in Ethiopia: Rehetoric, Reality and
Recommendations. Addis Ababa : Forum for environment, HOAREC/N, and HBS, 2008.
Ho, Mae-Wan. 2006. Biofuels Republic Brazil. Hong Kong : Institute of Science in Society, 2006.
ICRISAT. 2007. Pro-Poor Biofuels Outlook for Asia and. Andhra Pradesh : ICRISAT, 2007.
IEA. 2004. Biofuels for Transport: an international perspective. Paris : IEA, 2004.
—. 2013.
http://www.iea.org/statistics/statisticssearch/report/?&country=ETHIOPIA&year=2011&product=Indic
ators. http://www.iea.org/. [Online] 2013.
—. 2011. Technology Roadmap: Biofuels for Transport. Paris : IEA, 2011.
Johnson, Francis X. and Seebaluck, Vikram. 2012. Bioenergy: The role of sugarcane in Africa,. Abringdon :
Routledge, 2012.
Kassa, Mekonnen. 2007. Business Plan for Ethanol Cooking Fuel and Dometic CleanCook Stove Market
Development in Addis Ababa, Ethiopia. Addis Ababa : Partners Consultancy and Information Services, 2007.
M.Girma, Michael and Awulachew, SeleshiB. 2007. Irrigation Practices in Ethiopia: Characterstics of
Selected Irrigation Schemes. Colombo : IWMI, 2007. 978-92-9090-683-4.
Mastny, Lisa. 2007. Biofuels for Transportation: Global Potential and Implications for Sustainable Agriculture and
Energy in the 21 Century. Washington DC : WWI, 2007.
Mazengia, Dawit Hailu. 2010. Ethiopian Energy Systems: Potentials, Opportunities and Sustainable
Utilization. Uppsala : Institution För Geovetenskaper, 2010.
-80-
Merete, Weldemedhin. 2013. Biofuel Development Monitoring and Support Junior Expert. MoWE.
Office , Addis Ababa : Personnal Communication, April 25, 2013.
MME. 1994. National Energy Policy. Addis Ababa : FDRE, 1994.
—. 2007. The Biofuel Development and Utilization Strategy of Ethiopia. Addis Ababa : MME, 2007.
MoA. 2010. Ethiopia's Agricultural Sector Policy and Investment Framework (PIF) 2010-2020, Addis Ababa. Addis
Ababa : FDRE, 2010.
—. 2013. Natural Resources Sector. Head Office, Addis Ababa : Personal Communication, May 17, 2013.
MoFED. 2010. Growth and Transformation Plant (GTP). Addis Ababa : FDRE, 2010.
—. 2013. http://www.mofed.gov.et/English/Information/Pages/EthiopianEconomy.aspx. www.mofed.gov.et.
[Online] MoFED, 2013. [Cited: Agust 17, 2013.]
http://www.mofed.gov.et/English/Information/Pages/EthiopianEconomy.aspx.
MoWE. 2013. Biofuels Development Coordination Directorate. Head Office, Addis Ababa : Personal
Communication, April 23, 2013.
Ortega, Enrique, et al. nd. ARE BIOFUELS RENEWABLE ENERGY SOURCES? . São Paulo :
UNICAMP, nd.
Oxfam. 2008. Another Inconvenient Truth: How Biofuel Policies are Depening Poverty and Accelerating Climate Change.
London : Oxfam International, 2008.
Pimentel, David. 2008. Biofuels, solar and Wind as Renewable Energy Systems: Benefits and Risks. New York :
Springer, 2008. 978-1-4020-8653-3.
Point Carbon. 2013. http://www.pointcarbon.com/. [Online] August 2013.
http://www.pointcarbon.com/productsandservices/carbon/.
Ray, Saon, Miglani, Smita and Goldar, Amrita. 2011. Ethanol Blending Policy in India: Demand and
Supply Issues. India : ICRIER, 2011. Vol. 9.
Reddy, Sudhakar and Painuly, J.P. 2003. Diffusion of Renewable Energy Technologies: Barriers and
Stakeholders' Perspective. Amsterdam : Elsevier, 2003.
Reijnders, Lucas and Huijbregts, Mark A. J. 2009. Biofuels for Road Transport: A seed to Wheel Perspective.
London : Springer-Verlag, 2009. 978-1-84882-137-8.
Reporter. 2013. http://www.ethiopianreporter.com/pre-
en/index.php?option=com_content&view=article&id=1632:pakistani-sugar-company-to-commence-
operation-in-wollega&Itemid=511. ww.ethiopianreporter.com. [Online] 2013.
RFA. 2002 to 2012. Annual Industry Outlook Reports. Washington DC : RFA, 2002 to 2012.
Rutz, Dominik and Janssen, Rainer. 2007. Biofuel Technology Handbook. Munich : WIP Renewable
Energies, 2007.
Shapouri, Hossein, Salassi, Michael and Fairbanks, J. Nelson. 2006. The Economic Feasibility of Ethanol
Production from Sugar in the United States. Washington DC : USDA and LSU, 2006.
Sherif, Ahmed. 2013. Commertial Manager. National Oil Company (NOC). Office, Addis Ababa : Personal
Communication, April 26, 2013.
Silveira, Semida and Khatiwada, Dilip. 2010. Ethanol Production and Fuel Substitution in Nepal:
Opportunity to Promote Sustainable and Climate Change Mitigation. Amsterdam : Elsevier, 2010.
Silveira, Semida. 2005. Bioenergy: Realizing the Potential. Amsterdam : Elsevier, 2005. 0080446612.
-81-
Soetaert, Wim and J.Vandamme, Eric. 2009. Biofuels. Belgium : John Wiley and Sons Ltd, 2009.
047002674X.
Stokes, Leah, Scozzaro, A. Tianna and Haller, Jennifer. 2010. The Food Crisis in Ethiopia and Egypt:
Contrasting Hydrological and Economic Barriers to Development. New York : Columbia University, 2010.
Vol. 3, 1.
Sugar Corporation. 2013. www.etsugar.gov.et. www.etsugar.gov.et. [Online] Sugar Corporation, August 2013.
[Cited: August 18, 2013.]
Tadelle, Nadew. 2013. Biofuel Development Coordination Directorate Director. MoWE. Office, Addis
Ababa : Personal Communication, April 22, 2013.
Tadesse, Azemeraw. 2013. Modeling and Analysis of long-term Shifts in Bioenergy Use: Case Ethiopia.
KTH, Stockholm : Personal Communication, June 20, 2013.
Tangka, J.K., et al. 2011. Physico-chemical properties of bio-ethanol/gasoline blends and the qualitative
effect of different blends on gasoline quality and engine performance. Nairobi : Academic Journals, 2011.
Vol. 2(3).
Tefera, Tadesse. 2013. Policy Formulation and Monitoring Directorate Director. MoT. Office, Addis
Ababa : Personal Communication, May 2, 2013.
Tekle, Getish. 2008. Local Production and Use of Bioethanol for Transport in Ethiopia: Status, Challenges and Lessons.
Lund : Lund University, 2008.
Teklu, Kiros. 2013. Information Expert. EIA. Office, Addis Ababa : Personal Communication, May 15,
2013.
Tekola, Kumar. 2013. Head Planing and Supply . EPSE. Office, Addis Ababa : Personal Communication,
April 23, 2013.
Teshome, Wendmagegn. 2013. Process Engineer. Metehara Sugar Factory. Site, Metehara : Personal
Communication, May 25, 2013.
Tibebu, Yilma. 2013. Communications Directorate Director. Sugar Corporation. Office, Addis Ababa :
Personal Communication, April 24, 2013.
Tilahun, Fekade. 2013. AKAK Terminal Manager. Oil Libya Ethiopia. Office, Addis Ababa : Personal
Communication, May 23, 2013.
UN. 1998. Kyoto Protocol to the United Nations Framework Cnvention on Climate Change. Kyoto : UN,
1998.
UNEP. 2012. http://www.unep.org/ccac/Partners/CountryPartners/Ethiopia.aspx. [Online] CCAC,
2012.
Walker, Graeme M. 2010. Bioethanol Science and Technology of Fuel Alcohol. London : Graeme M. Walker and
Ventus Publishing ApS, 2010. 978-87-7681-0.
Walter, Arnaldo, et al. 2008. Perspectives on Fuel ethanol Consumption and Trade. Biomasss and Bioenergy.
Amsterdam : Elsevier, 2008. Vol. 32, 8.
Walter, Arnaldo, et al. 2007. Task 40 Sustainable Bio-energy Trade;securing Supply and Demand. São
Paulo : IEA Bioenergy, 2007. Market Evaluation: Fuel Ethanol.
Wang, Michael, Wu, May and Huo, Hong. 2007. Life-cycle Energy and Greenhouse Gas Emission
Impacts of Different Corn Ethanol Plant Types. Philadelphia : IOP, 2007.
WIC. 2013. http://www.waltainfo.com/index.php/explore/8809-ethiopia-blends-79-mln-liters-of-ethanol-
with-benzene-in-11-months. www.waltainfo.com. [Online] Walta Information Center, June 26, 2013.
-82-
WIKIPEDIA. 2013. http://en.wikipedia.org/wiki/List_of_minimum_wages_by_country. www.wikipedia.org.
[Online] 2013.
World Energy Council. 2010. Biofuels: Policies, Standards and Technologies. London : World Energy Council,
2010. 9780946121038.
Wyman, Charles E. 1996. Handbook on Bioethanol: Production and Utilization. Washington DC : Taylor and
Francis Ltd, 1996. 1-56032-553-4.
Zarrilli, Simonetta. 2006. The Emerging Biofuels Market: Regulatory Trade and Development Implementations. New
York and Geneva : UNCTAD, 2006.
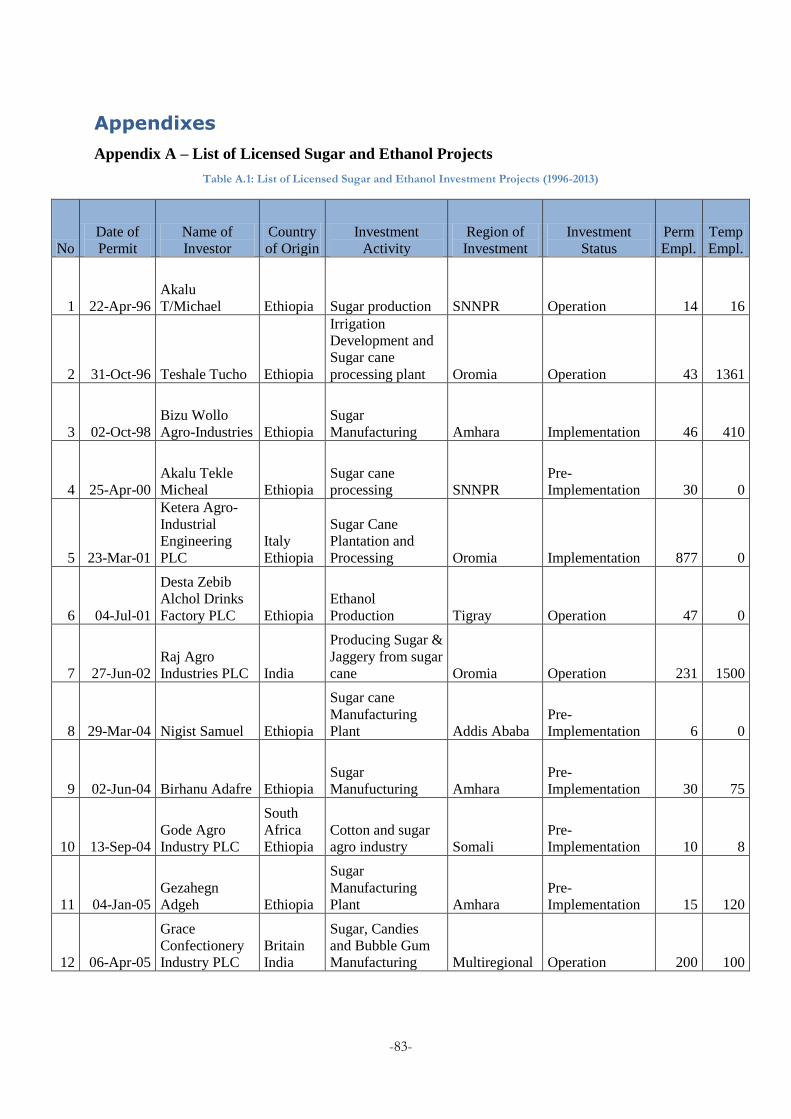
-83-
Appendixes
Appendix A – List of Licensed Sugar and Ethanol Projects
Table A.1: List of Licensed Sugar and Ethanol Investment Projects (1996-2013)
No
Date of
Permit
Name of
Investor
Country
of Origin
Investment
Activity
Region of
Investment
Investment
Status
Perm
Empl.
Temp
Empl.
1 22-Apr-96
Akalu
T/Michael Ethiopia Sugar production SNNPR Operation 14 16
2 31-Oct-96 Teshale Tucho Ethiopia
Irrigation
Development and
Sugar cane
processing plant Oromia Operation 43 1361
3 02-Oct-98
Bizu Wollo
Agro-Industries Ethiopia
Sugar
Manufacturing Amhara Implementation 46 410
4 25-Apr-00
Akalu Tekle
Micheal Ethiopia
Sugar cane
processing SNNPR
Pre-
Implementation 30 0
5 23-Mar-01
Ketera Agro-
Industrial
Engineering
PLC
Italy
Ethiopia
Sugar Cane
Plantation and
Processing Oromia Implementation 877 0
6 04-Jul-01
Desta Zebib
Alchol Drinks
Factory PLC Ethiopia
Ethanol
Production Tigray Operation 47 0
7 27-Jun-02
Raj Agro
Industries PLC India
Producing Sugar &
Jaggery from sugar
cane Oromia Operation 231 1500
8 29-Mar-04 Nigist Samuel Ethiopia
Sugar cane
Manufacturing
Plant Addis Ababa
Pre-
Implementation 6 0
9 02-Jun-04 Birhanu Adafre Ethiopia
Sugar
Manufucturing Amhara
Pre-
Implementation 30 75
10 13-Sep-04
Gode Agro
Industry PLC
South
Africa
Ethiopia
Cotton and sugar
agro industry Somali
Pre-
Implementation 10 8
11 04-Jan-05
Gezahegn
Adgeh Ethiopia
Sugar
Manufacturing
Plant Amhara
Pre-
Implementation 15 120
12 06-Apr-05
Grace
Confectionery
Industry PLC
Britain
India
Sugar, Candies
and Bubble Gum
Manufacturing Multiregional Operation 200 100
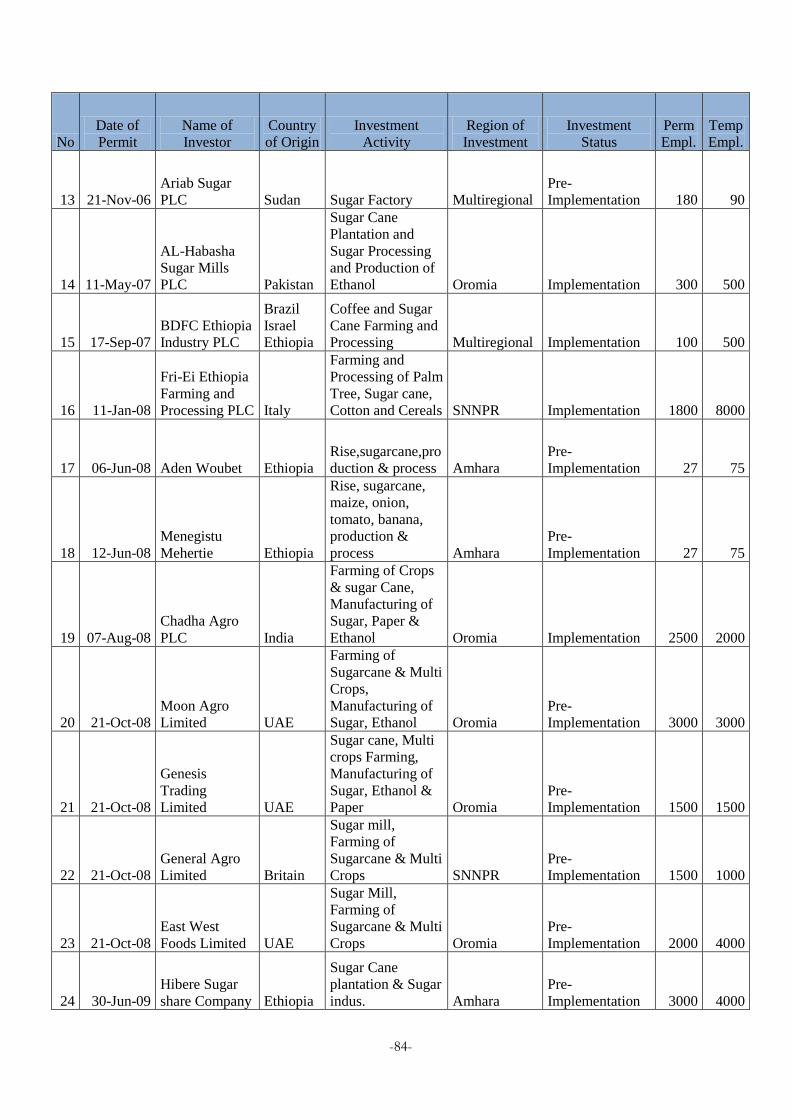
-84-
No
Date of
Permit
Name of
Investor
Country
of Origin
Investment
Activity
Region of
Investment
Investment
Status
Perm
Empl.
Temp
Empl.
13 21-Nov-06
Ariab Sugar
PLC Sudan Sugar Factory Multiregional
Pre-
Implementation 180 90
14 11-May-07
AL-Habasha
Sugar Mills
PLC Pakistan
Sugar Cane
Plantation and
Sugar Processing
and Production of
Ethanol Oromia Implementation 300 500
15 17-Sep-07
BDFC Ethiopia
Industry PLC
Brazil
Israel
Ethiopia
Coffee and Sugar
Cane Farming and
Processing Multiregional Implementation 100 500
16 11-Jan-08
Fri-Ei Ethiopia
Farming and
Processing PLC Italy
Farming and
Processing of Palm
Tree, Sugar cane,
Cotton and Cereals SNNPR Implementation 1800 8000
17 06-Jun-08 Aden Woubet Ethiopia
Rise,sugarcane,pro
duction & process Amhara
Pre-
Implementation 27 75
18 12-Jun-08
Menegistu
Mehertie Ethiopia
Rise, sugarcane,
maize, onion,
tomato, banana,
production &
process Amhara
Pre-
Implementation 27 75
19 07-Aug-08
Chadha Agro
PLC India
Farming of Crops
& sugar Cane,
Manufacturing of
Sugar, Paper &
Ethanol Oromia Implementation 2500 2000
20 21-Oct-08
Moon Agro
Limited UAE
Farming of
Sugarcane & Multi
Crops,
Manufacturing of
Sugar, Ethanol Oromia
Pre-
Implementation 3000 3000
21 21-Oct-08
Genesis
Trading
Limited UAE
Sugar cane, Multi
crops Farming,
Manufacturing of
Sugar, Ethanol &
Paper Oromia
Pre-
Implementation 1500 1500
22 21-Oct-08
General Agro
Limited Britain
Sugar mill,
Farming of
Sugarcane & Multi
Crops SNNPR
Pre-
Implementation 1500 1000
23 21-Oct-08
East West
Foods Limited UAE
Sugar Mill,
Farming of
Sugarcane & Multi
Crops Oromia
Pre-
Implementation 2000 4000
24 30-Jun-09
Hibere Sugar
share Company Ethiopia
Sugar Cane
plantation & Sugar
indus. Amhara
Pre-
Implementation 3000 4000
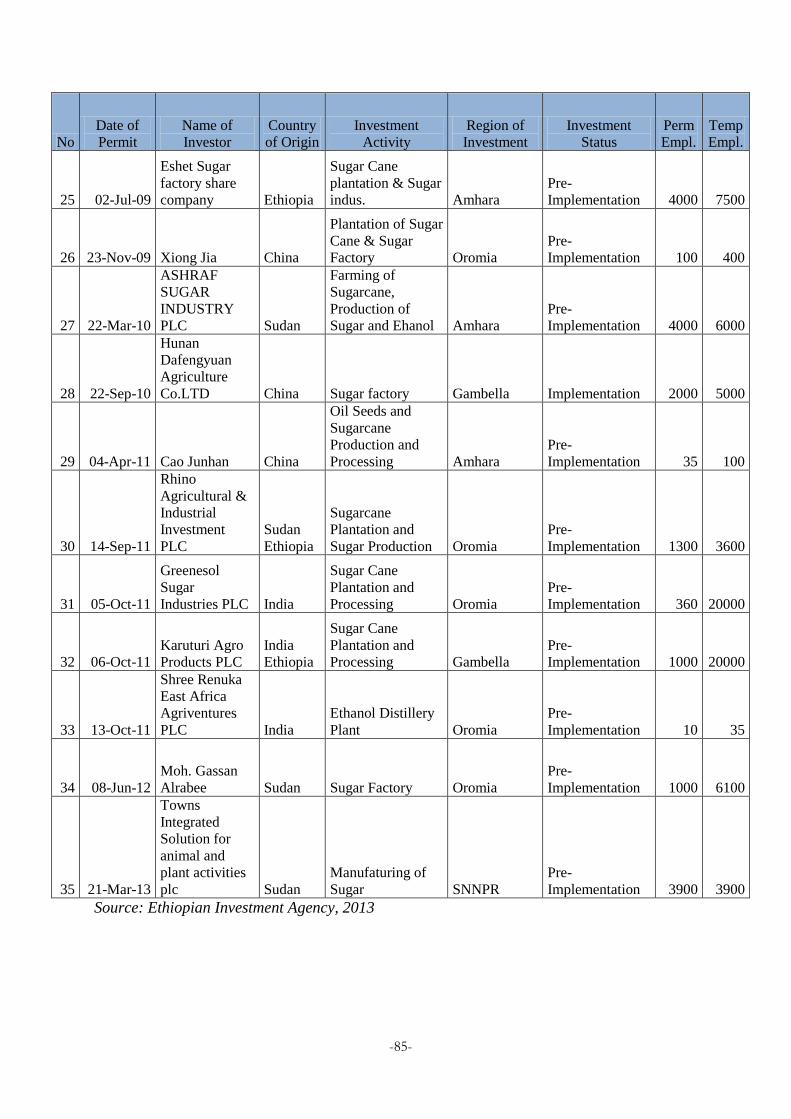
-85-
No
Date of
Permit
Name of
Investor
Country
of Origin
Investment
Activity
Region of
Investment
Investment
Status
Perm
Empl.
Temp
Empl.
25 02-Jul-09
Eshet Sugar
factory share
company Ethiopia
Sugar Cane
plantation & Sugar
indus. Amhara
Pre-
Implementation 4000 7500
26 23-Nov-09 Xiong Jia China
Plantation of Sugar
Cane & Sugar
Factory Oromia
Pre-
Implementation 100 400
27 22-Mar-10
ASHRAF
SUGAR
INDUSTRY
PLC Sudan
Farming of
Sugarcane,
Production of
Sugar and Ehanol Amhara
Pre-
Implementation 4000 6000
28 22-Sep-10
Hunan
Dafengyuan
Agriculture
Co.LTD China Sugar factory Gambella Implementation 2000 5000
29 04-Apr-11 Cao Junhan China
Oil Seeds and
Sugarcane
Production and
Processing Amhara
Pre-
Implementation 35 100
30 14-Sep-11
Rhino
Agricultural &
Industrial
Investment
PLC
Sudan
Ethiopia
Sugarcane
Plantation and
Sugar Production Oromia
Pre-
Implementation 1300 3600
31 05-Oct-11
Greenesol
Sugar
Industries PLC India
Sugar Cane
Plantation and
Processing Oromia
Pre-
Implementation 360 20000
32 06-Oct-11
Karuturi Agro
Products PLC
India
Ethiopia
Sugar Cane
Plantation and
Processing Gambella
Pre-
Implementation 1000 20000
33 13-Oct-11
Shree Renuka
East Africa
Agriventures
PLC India
Ethanol Distillery
Plant Oromia
Pre-
Implementation 10 35
34 08-Jun-12
Moh. Gassan
Alrabee Sudan Sugar Factory Oromia
Pre-
Implementation 1000 6100
35 21-Mar-13
Towns
Integrated
Solution for
animal and
plant activities
plc Sudan
Manufaturing of
Sugar SNNPR
Pre-
Implementation 3900 3900
Source: Ethiopian Investment Agency, 2013
-86-
Appendix B – Questioners
Questioner B - 1
Project Work Title: “Long-term Bioethanol shift”
Case: Ethiopian Transport
Questionnaire
By: Yacob Gebreyohannes Email: [email protected]
Purpose of the Questionnaire:
The purpose of the questionnaire is to collect both qualitative and quantitative data required for the master thesis
work on: Long-term Bioethanol Shift
Acknowledgement to the Respondent:
I hereby would like to express my gratitude for your dedicated cooperation. Without your genuine cooperation of
filling this questionnaire, it would be difficult to conduct this project.
I assure you that the information obtained from this questionnaire will be kept confidential and will not be
transferred to other parties for any other purpose. For other questions pertaining to this questionnaire, please
contact the project responsible and supervisor.
Responsible:
Francis X. Johnson
Stockholm Environment Institute, SEI
Email: [email protected]
Supervisor:
Dilip Khatiwada
Royal Institute of Technology, KTH
Email: [email protected]

-87-
Respondent Information
1-Name: ____________________________________________
2- Position: ____________________________________________
Company Information
1-Company name: ____________________________________________
2-Year of establishment: ____________________________________________
3-Sector of the company belongs: ____________________________________________
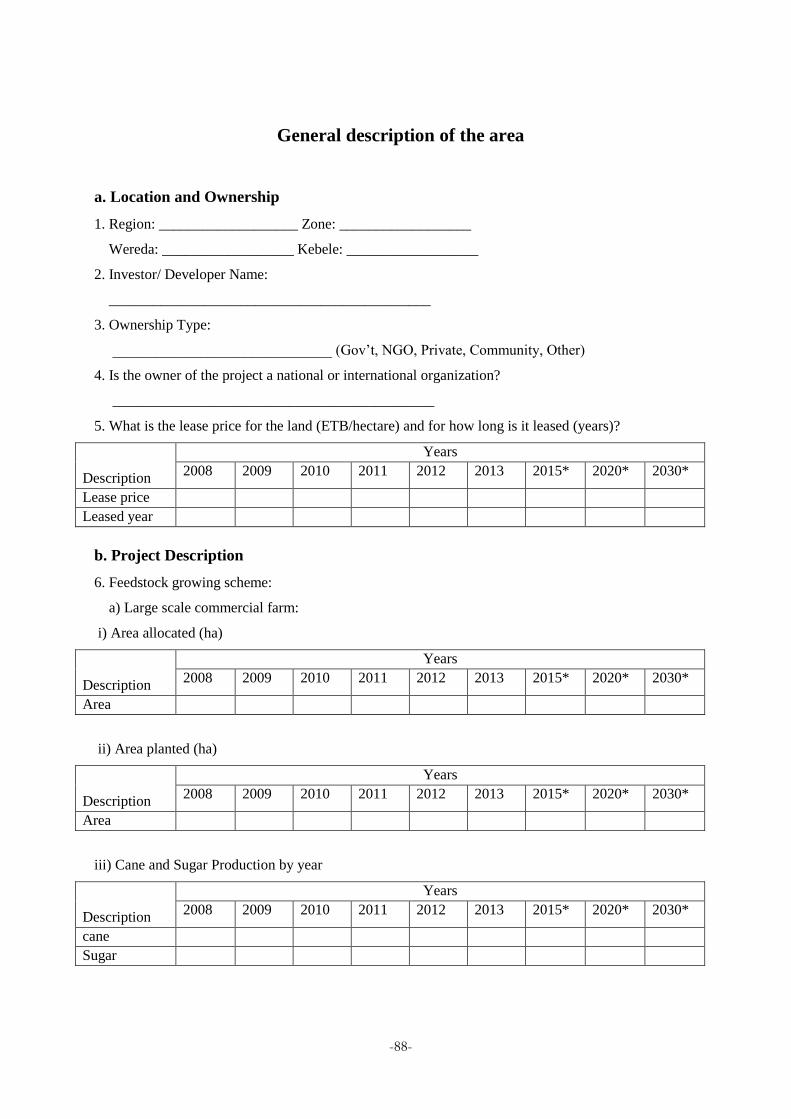
-88-
General description of the area
a. Location and Ownership
1. Region: ___________________ Zone: __________________
Wereda: __________________ Kebele: __________________
2. Investor/ Developer Name:
____________________________________________
3. Ownership Type:
______________________________ (Gov’t, NGO, Private, Community, Other)
4. Is the owner of the project a national or international organization?
____________________________________________
5. What is the lease price for the land (ETB/hectare) and for how long is it leased (years)?
Description
Years
2008 2009 2010 2011 2012 2013 2015* 2020* 2030*
Lease price
Leased year
b. Project Description
6. Feedstock growing scheme:
a) Large scale commercial farm:
i) Area allocated (ha)
Description
Years
2008 2009 2010 2011 2012 2013 2015* 2020* 2030*
Area
ii) Area planted (ha)
Description
Years
2008 2009 2010 2011 2012 2013 2015* 2020* 2030*
Area
iii) Cane and Sugar Production by year
Description
Years
2008 2009 2010 2011 2012 2013 2015* 2020* 2030*
cane
Sugar
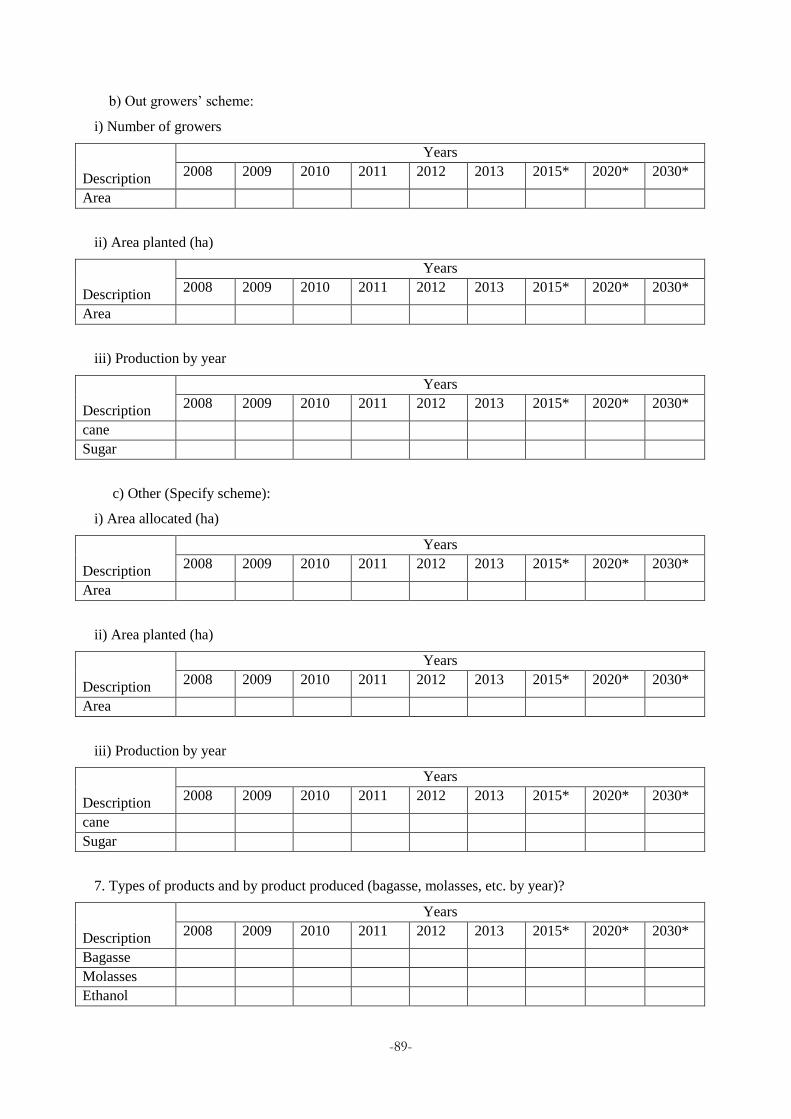
-89-
b) Out growers’ scheme:
i) Number of growers
Description
Years
2008 2009 2010 2011 2012 2013 2015* 2020* 2030*
Area
ii) Area planted (ha)
Description
Years
2008 2009 2010 2011 2012 2013 2015* 2020* 2030*
Area
iii) Production by year
Description
Years
2008 2009 2010 2011 2012 2013 2015* 2020* 2030*
cane
Sugar
c) Other (Specify scheme):
i) Area allocated (ha)
Description
Years
2008 2009 2010 2011 2012 2013 2015* 2020* 2030*
Area
ii) Area planted (ha)
Description
Years
2008 2009 2010 2011 2012 2013 2015* 2020* 2030*
Area
iii) Production by year
Description
Years
2008 2009 2010 2011 2012 2013 2015* 2020* 2030*
cane
Sugar
7. Types of products and by product produced (bagasse, molasses, etc. by year)?
Description
Years
2008 2009 2010 2011 2012 2013 2015* 2020* 2030*
Bagasse
Molasses
Ethanol
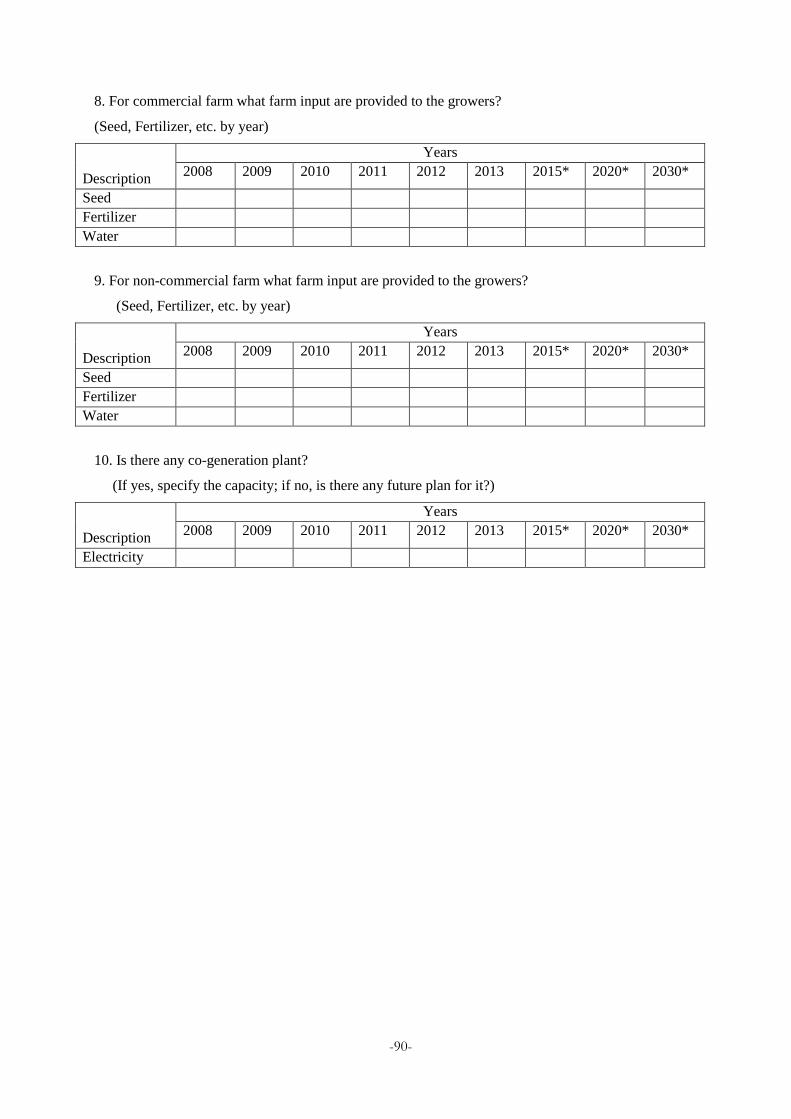
-90-
8. For commercial farm what farm input are provided to the growers?
(Seed, Fertilizer, etc. by year)
Description
Years
2008 2009 2010 2011 2012 2013 2015* 2020* 2030*
Seed
Fertilizer
Water
9. For non-commercial farm what farm input are provided to the growers?
(Seed, Fertilizer, etc. by year)
Description
Years
2008 2009 2010 2011 2012 2013 2015* 2020* 2030*
Seed
Fertilizer
Water
10. Is there any co-generation plant?
(If yes, specify the capacity; if no, is there any future plan for it?)
Description
Years
2008 2009 2010 2011 2012 2013 2015* 2020* 2030*
Electricity
-91-
Questioner B -2
Project Title: “Long-term Bioethanol shift”
Case: Ethiopian Transport
Questionnaire
By: Yacob Gebreyohannes Email: [email protected]
Purpose of the Questionnaire:
The purpose of the questionnaire is to collect both qualitative and quantitative data required for the master thesis
work on: Long-term Bioethanol Shift
Acknowledgement to the Respondent:
I hereby would like to express my gratitude for your dedicated cooperation. Without your genuine cooperation of
filling this questionnaire, it would be difficult to conduct this project.
I assure you that the information obtained from this questionnaire will be kept confidential and will not be
transferred to other parties for any other purpose. For other questions pertaining to this questionnaire, please
contact the project responsible and supervisor.
Responsible:
Francis X. Johnson
Stockholm Environment Institute, SEI
Email: [email protected]
Supervisor:
Dilip Khatiwada
Royal Institute of Technology, KTH
Email: [email protected]

-92-
Respondent Information
1-Name: ____________________________________________
2- Position: ____________________________________________
Company Information
1-Company name: ____________________________________________
2-Year of establishment: ____________________________________________
3-Sector of the company belongs: ____________________________________________
-93-
Bioethanol Development General Information/ Check List
General Description of the Area
A) Location and Ownership
1. Region: ___________________ Zone: __________________
2. Wereda: __________________ Kebele: __________________
3. Any other relevant Information: ________________________________________
4. Investor/ Developer Name: ____________________________________________
5. Ownership Type: ____________________________________________
(Gov’t, NGO, Private, Community, other)
6. Is the owner of the project a national or international organization?
_________ ___________________________________
7. What is the amount of the project budget?
______ ______________________________________
8. What is the lease price for the land (ETB/hectare) and for how long is it leased (years)?
____ ________________________________________
B) Project Description
1. Feedstock growing scheme:
a) Large scale commercial farm:
i) Area allocated (ha); ii) Area planted (ha); iii) Production by year
b) Out growers’ scheme:
i) Number of growers; ii) Area planted (ha); iii) Production by year
c) Other (Specify scheme):
i) Area allocated (ha); ii) Area planted (ha); iii) Production by year
2. Types of feedstock grown (Sugarcane, Sugar beet, etc. by year)?
3. Types of by product produced (bagasse, molasses, etc. by year)?
4. For non-commercial farm what farm input are provided to the growers?
(Seeds, Fertilizer, etc. by year)
5. For ethanol production what amount of the byproduct is provided (molasses by year)?
6. Is there any co-generation plant?
(If yes, specify the capacity; if no, is there any future plan for it?)
7. Is the ethanol produced for local use or export (Annual use)?
8. Is there any plan for production of bioethanol from other feedstocks (second generation)?
-94-
Land use, Socio-economic, Wildlife, and Watershed Aspects
A) Land use
1. Specific location of land allocated for bioethanol production:
Latitude: _________ Longitude: _________
2. Land use prior to the development of the site for Bioehanol production [i.e.
Agriculture, grazing land, forest (natural,bush land, commercial plantation, etc.),
barren or degraded land, etc.]. If information is available, please write previous
vegetation composition of the area with type of plant and wild life species.
3. Impacts on plant species due to the change in land use (list vegetation species
affected).
4. Short and long term consequence of the project on:
i) Land use and Land cover change
ii) Local environmental change or natural resource (on soil and hydrological cycle
of the watershed)
iii) Other consequences (Please specify)
B) Socio-economic Aspects
1. How did communities in the area previously benefit from the land [i.e. source of
energy, food (hunting, honey, fruits, cultivation), grazing for cattle, etc]?
2. How does the project affect the livelihoods of communities living in and around the
area? Specify immediate and long term losses and consequences?
3. How does the project benefit the local communities? Specify immediate and long term
benefits and consequences of the project?
4. Are there any incidents of land use conflicts among neighboring communities related
to the project intervention?
C) Watershed
1. The part of watershed affected (Downstream, Upstream).
2. Will there be any short and/or long term effect on erosion and soil resource
degradation?
3. What may be the consequence of the immediate effects of land use change on flora
and fauna of the area in relation to the following?
i. Severity of soil erosion by wind before and after the investment
ii. Severity of soil erosion by water before and after the investment
iii. Severity of runoff loss of rain water from farmlands which otherwise could
have been retained in the soil and used by crops/plants before and after the
investment
iv. Severity of sedimentation and reduction of runoff water reservoirs such as
ponds and lakes before and after the investment
-95-
Other Issues
1. Does the project have an Environmental Impact Assessment (EIA) document?
If the answer for question no. 1 is yes, please answer the following questions.
i. Is the EIA prepared before the beginning of the project or after the project started?
ii. To which government organization was the EIA submitted (Federal and/or Regional)?
iii. Did the EIA included community participation?
iv. What are the major environmental problems stated in the EIA and the proposed
mitigation measures (List)?
v. Are the mitigation measures proposed in the EIA being implemented?
2. Is there any follow up by any regulatory body?
3. Is there any environmental auditing schedule?
4. Are there any sacred sites (ritual or worship place) in the area developed for plantation?
5. Did the project made any compensation to the community for any lose benefits, displacement
or change of life style due to the project intervention in the area?
6. What is the strategy planned to be followed to cope with the impact/damage caused by the
activity on natural resources (forest trees and seedlings; bushes and shrubs; grasses, fodder and
wild animals; etc. and the possible effects on soil erosion and runoff water loss) at:
a. Household level, b. Community level, c. Peasant association level, d. District and zonal
bureau of agriculture and/or natural resource levels, e. Local NGO(s) if any
7. What do farmers or peasant associations expect from the developers and from concerned
regional bureaus, NGOs, the Regional Governments at large or other stakeholders in the
process of addressing the impact/problem?
List of Required Documents
1. Energy policy, EPA policy, Agricultural policy, Transport policy
2. Forest and Wildlife conservation proclamation and rural land administration proclamation
3. Biofuels strategy
4. Road transport strategy
5. Gasoline consumption trend, Ethanol consumption trend, Pre-tax gasoline and ethanol prices
6. Other relevant documents