Embed Size (px)
Citation preview

LONG-TERM ABSENTEEISM DUE TO
SICKNESS: THE SWEDISH EXPERIENCE,
1986-1991*
Daniela Andrén Göteborg University, Department of Economics
Box 640, SE 405 30 Göteborg, Sweden Tel: +46 31 773 2674, Fax: +46 31 773 1326 E-mail: [email protected]
Abstract Long-term absenteeism due to sickness has been increasing in the past two decades. This has raised many questions about causes, financing, and policy measures to prevent further increases. Answering these questions is even more important in a society with an aging population, which is expected to record even more cases. With data from the Swedish National Insurance Board, proportional hazards models for multiple spells are used in this study to account for shared unobserved group-level characteristics (or frailty) associated with long-term sickness. When the spells were grouped by individual, diagnosis or region, there were significant positive random effects. There was �more� heterogeneity among diagnosis-groups and individual-groups than among regions as groups. Both individual and labor market characteristics had significant effects on the length of absence, which suggests policies aimed to prevent and slow down the increasing trend of long-term sickness of those in older age-groups, but also special policies orientated to prevent deterioration of health status of younger employees. Key words: long-term sickness, absenteeism, multiple spells, unobserved heterogeneity. JEL classification: J2; J3; J7.
* I would like to thank Edward Palmer, Lennart Flood, Henry Ohlsson and participants at both the Econometrics Days in Göteborg, May 1996, and the Fifth Meeting of Young Economists in Oxford, March 2000, for useful comments on earlier versions of this paper. The usual disclaimer applies.

2
1 Introduction
The increasing number of cases of long-term sickness registered in Sweden during the
1980s and 1990s has attracted a lot of attention. There have been several changes taken
or proposed concerning social insurance in order to combat long-term sickness,
specifically with regard to the source of financing the first weeks of each sickness spell,
and to a better specification of the skills required for evaluating the working capacity of
employees reporting sick.1 Since 1992 the employer has had the responsibility for
providing sick pay during the first weeks of sickness. Before this, from December 1987
social insurance covered the entire absence. Prior to that, the compulsory sickness
insurance (implemented in 1955) stipulated a waiting period of three days and a limit of
two years replacement in long-term sickness. In 1967 the waiting period was reduced to
the day of calling in sick. In 1985 some administrative changes (for state employees)
implied that also the day for calling in sick and weekends were in the records, counted
as sickness absence days.
The basic evaluation procedure remains a (simple) medical evaluation and
doctor�s certification of illness after the first week, and then review at periodic intervals.
Improved collaboration between the physician, employer, and social insurance officers
has been suggested, with more attention to rehabilitation and consideration of
alternative employment.
Even for those who are not working, Sweden�s social welfare system provides
adequate funds for food, housing and healthcare.2 Other factors than material deficiency
are thus expected to explain the increasing number of long-term absences due to
sickness. Many seem to result not from obvious physical causes, but rather from
changing social and economic conditions, stress related illnesses, such as back pain, and
1 In Sweden the term sickness cash benefit is used to make it clear that the �sick pay� is usually paid by the social insurance system, rather that the employer. The employer provided sick pay the first 14 days in 1992-1996, and since 1st April 1998, and the first 28 days during the time period January 1, 1997 � March 31, 1998. 2 Healthcare is actually provided directly �in kind� through a heavily subsidized, mostly publicly owned and managed system; only minimal cash payments are required of patients, including for prescription drugs.

3
(consequent) psychological problems, such as depression.
It is the goal of this paper to analyze underlying causes for long-term absences
due to sickness using frailty models using longitudinal data on sickness. The data are
provided by the Swedish National Social Insurance Board. Section 2 summarizes the
relevant characteristics of the social insurance system in Sweden, describing the rules
today and the main changes made in recent years, and briefly reviewing some statistics
on long-term absence due to sickness.3 Section 3 reviews previous studies relevant for
the analysis. Section 4 sets up the theoretical framework and Section 5 presents the data.
Sections 6 and 7 present the econometric specification and the results, while Section 8
summarizes and draws conclusions.
2 Social insurance rules and sickness facts in Sweden
2.1 Sickness insurance rules during 1986-1991 and beyond
Everyone in the labor force is covered by sickness insurance (i.e., they are eligible for
sick pay or/and sickness cash benefit when absent due to sickness). The aim of sickness
insurance is to replace the earnings loss due to sickness. Since July 1990, a sickness
benefit is available when working capacity is reduced by at least 25%; depending on the
extent of working capacity reduction and consequent reduction in working hours, the
benefit can be paid at a full, three-quarters, half, or one-quarter rate. Prior to July 1990
there were only two rates, full and 50 percent of full rate. A medical certificate is
required after seven days, and a more detailed certificate is required from the 29th
day of
absence. A sickness benefit can be paid out for an unlimited period, is considered
taxable income, and counts towards ones pension base.4 However, for those over 70 or
3 Other reasons why employees might be absent from their jobs for extended periods (with right of return) include military service, parental leave, education, and trial period of alternative employment. Unless stated otherwise, �absence� herein will refer to absence due to sickness. 4 The compulsory sickness cash benefit system insurance, implemented in 1955, stipulated a limit of two years replacement for long-term sickness. Except for old-age pensioners, this limit was abolished in 1963.

4
persons receiving a full old age pension, the period is limited to 180 days. Persons
receiving full disability pensions are not entitled to a sickness benefit.
Replacement rates and related rules have changed many times. Under the period
studied, there was a uniform replacement rate of 90% of lost income up to March 1991,
and after that, until January 1992, only 65% was paid for the first three days, then 80%
from the 4th up to the 90th
day, and starting with the 91st day of the sickness spell, the
previous rate of 90%. However, most workers also received another 10% from
negotiated benefit on the top of the 80%.
2.2 Trends in long-term sickness spells5
Figures 1 and 2 show the number of ongoing compensated spells of sickness at the end
of each year, by duration, for men and women, during the period 1974-1999. The
changes in the magnitude of sickness benefit absence during the last two decades can be
explained by expansive or restrictive reforms regarding rules within the sickness
insurance system and by the business cycles. For example, the long-term sick listed
have decreased sharply during in the beginning of the 1990s together with a more
restrictive sickness insurance system and perhaps owing to the deep recession, while
since 1997 the long-term sickness absence has started to increase (dramatically), with
economic expension.
The reported statistics refer to sickness spells regardless if they were full or
partial cases. The very similar shapes of the plots for men and women are partly
explained by the rule-changes over time, since everyone is affected by same rules. It is
more difficult to explain differences in levels. The increasing number of women who
worked during the last two decades can explain some of the increasing differences in
levels between women and men. The regional unemployment might explain another part
of the difference: Women, who to a great extent work in the public sector, were more
exposed to unemployment than men, with a resulting tendency towards sickness, and,
5 Unless otherwise noted, all data are from the National Social Insurance Board.

5
hence a sickness benefit instead of an unemployment benefit.
0
10
20
30
40
50
1974 1978 1982 1986 1990 1994 1998
30-59 60-89 90-179 180-364 365+
Figure 1 Number of ongoing compensated sickness spells at the end of December, by duration, men, 1974-1999
0
10
20
30
40
50
1974 1978 1982 1986 1990 1994 1998
30-59 60-89 90-179 180-364 365+
Figure 2 Number of ongoing compensated sickness spells at the end of December, by duration, women, 1974-1999
6
Another factor tending to increase the number of spells for both men and women
is the aging process: More employees are older, and thus can be expected to have more
health problems.
An explanation for the increase in long-term sickness absence in the end of the
1990s can be the very low levels of sickness absence during the recession period (1993-
1997), which might �postponed� the absence due to sickness. If this is the case, this is a
very good example that the prevention and good care of health is more efficient and less
costly than no care or superficial care of any health problem.
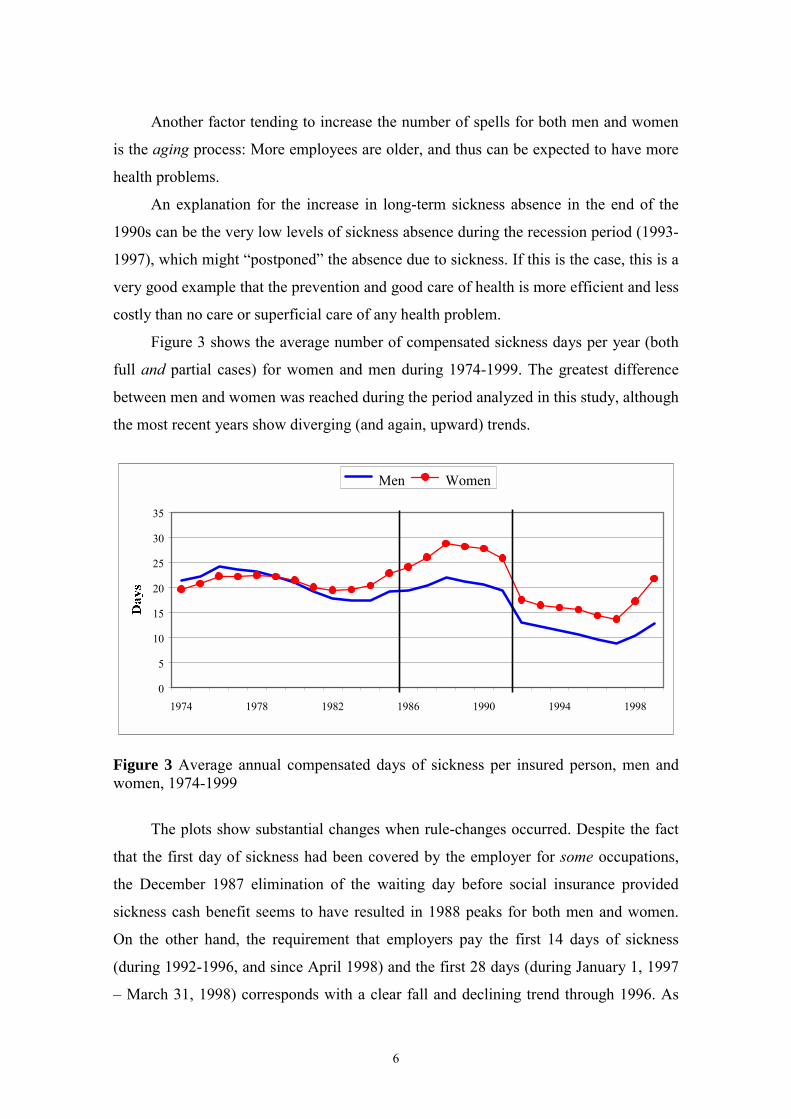
Figure 3 shows the average number of compensated sickness days per year (both
full and partial cases) for women and men during 1974-1999. The greatest difference
between men and women was reached during the period analyzed in this study, although
the most recent years show diverging (and again, upward) trends.
0
5
10
15
20
25
30
35
1974 1978 1982 1986 1990 1994 1998
Men Women
Figure 3 Average annual compensated days of sickness per insured person, men and women, 1974-1999
The plots show substantial changes when rule-changes occurred. Despite the fact
that the first day of sickness had been covered by the employer for some occupations,
the December 1987 elimination of the waiting day before social insurance provided
sickness cash benefit seems to have resulted in 1988 peaks for both men and women.
On the other hand, the requirement that employers pay the first 14 days of sickness
(during 1992-1996, and since April 1998) and the first 28 days (during January 1, 1997
� March 31, 1998) corresponds with a clear fall and declining trend through 1996. As

7
already mentioned, the increase since 1997 can be related to the lower absence rates
during 1992-1996. Another characteristic for the end of the 1990s is the increasing
number of people in occupations outside industry that formed a new group of long-term
sick.6
2.3 Behind the reported numbers
Figures 1-3 can be misleading since they report on compensated days of sickness
without regard to whether absences were full or partial. There are no statistics showing
how many people are absent part-time, but it is well known that in Sweden there are
more women than men working part-time7. It is also possible to receive a partial benefit
even though one is employed full time, for example in conjunction with rehabilitation
for persons returning to work after a long-term sickness.
Total compensation figures are equally ambiguous. For example, of about SEK
13.9 billion paid in sickness benefits in 1997, about 50% was paid to women and 50%
to men, but more women than men were long-term sick; in other words women�s
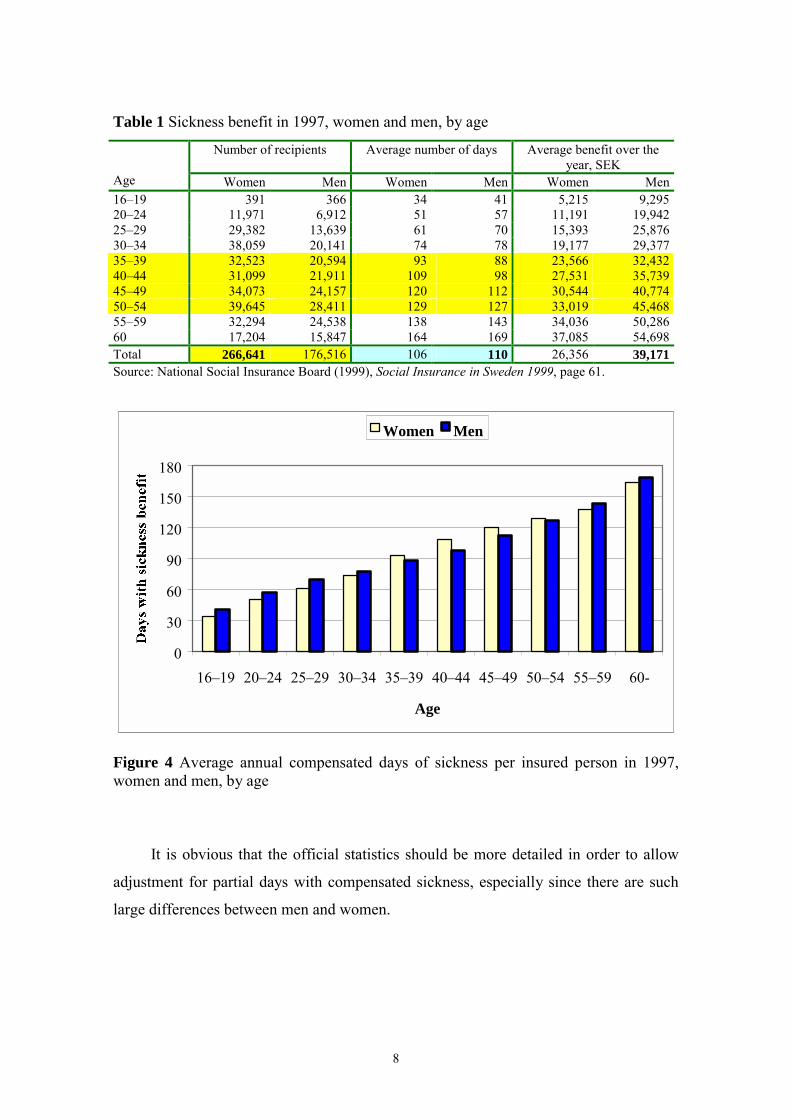
average compensation was lower than men�s (Table 1). Although in total men had a
higher average number of compensated days of sickness, the number of days was higher
for women than men for the age-groups 35-39, 40-44, 45-49, and 50-54 (see also Figure
4), while the average benefit for all these age-groups was always much higher for men
(Table 1). But again, these figures have not been adjusted for partial days. Thus the
results are not necessarily a result of wage discrimination, but may be mostly explained
by hours of work, as well as by differential years of work experience for men and
women.
6 According to the National Social Insurance Board (National Social Insurance Board, Social Insurance- Annual Review of Budget Year 1999), the number of teachers, nurses, hospital auxiliaries, and social insurance officers on the sick list rose in 1999. 7 For example, in 1997 there were about 783,600 women and 159,200 men employed part-time (Table A1 in the Appendix).
8
Table 1 Sickness benefit in 1997, women and men, by age
Number of recipients Average number of days Average benefit over the year, SEK
Age Women Men Women Men Women Men 16�19 391 366 34 41 5,215 9,295 20�24 11,971 6,912 51 57 11,191 19,942 25�29 29,382 13,639 61 70 15,393 25,876 30�34 38,059 20,141 74 78 19,177 29,377 35�39 32,523 20,594 93 88 23,566 32,432 40�44 31,099 21,911 109 98 27,531 35,739 45�49 34,073 24,157 120 112 30,544 40,774 50�54 39,645 28,411 129 127 33,019 45,468 55�59 32,294 24,538 138 143 34,036 50,286 60 17,204 15,847 164 169 37,085 54,698 Total 266,641 176,516 106 110 26,356 39,171 Source: National Social Insurance Board (1999), Social Insurance in Sweden 1999, page 61.
0
30
60
90
120
150
180
16�19 20�24 25�29 30�34 35�39 40�44 45�49 50�54 55�59 60-
Age
Women Men
Figure 4 Average annual compensated days of sickness per insured person in 1997, women and men, by age
It is obvious that the official statistics should be more detailed in order to allow
adjustment for partial days with compensated sickness, especially since there are such
large differences between men and women.

9
3 Literature review
The problem of employee absenteeism has long been an important subject of
psychological and economic research and modelling. In both, individuals are often
assumed to decide daily on the work or non-work alternative, depending on which gives
the highest utility.8 The conventional labor supply model of absence focuses on the role
of contractual arrangement, assuming that the wage rate plays a central role in the
decision to work or not work. There are other economic factors that might influence this
decision, however, such as the replacement rate, the tax rate, and employee sharing
plans (e.g., profit-sharing and/or employee share-ownership). Previous studies have
found that economic incentives have a significant impact on absences from work.9
There are also some (long-term) longitudinal studies that measure the effects of
various past and current factors on the actual absence.10 Some other studies have
analyzed the duration of sickness and estimated the hazard of returning to work and the
expected duration of work absence.11 The results showed that as the relative generosity
of sick pay (the replacement rate) increased, there was a clear �disincentive� effect, as
the duration of illness lengthened. Other significant factors were wages, the type and
severity of injury, the physical demand of the job, and the willingness of employers to
help the worker return to work.
Using a dynamic stochastic model, Gilleskie (1998) analyzed the medical care
consumption and absenteeism decision of employed individuals with acute illness.
Policy simulations based on her theoretical model showed substantial responses to
8 Chelius (1981); Winkler (1980); and Youngblood (1984). 9 Dunn and Youngblood (1986); Chaudhury and Ng (1992, 1994); Dalton and Mesch (1992), Drago and Wooden (1992); Barmby et al. (1991, 1995); Johansson and Palme (1996); Johansson and Brännäs (1998); Gilleskie (1998); Arthur and Jelf (1999); and Brown (1999). 10 Baum and Youngblood (1975); Scott and Markham (1982); Scott et al. (1985); Barmby et al. (1995); David (1996); and Barmby (1998). 11 Fenn (1981); Butler and Worrall (1985); and Johnson and Ondrich (1990).

10
economic incentives. Generally, medical treatment and work absenteeism appeared to
be substitutes during an illness episode, while for acute infections and parasitic diseases,
and acute respiratory conditions, absences were 50% more common than doctor visits.
With policy that restricts access to physicians during the first three days of illness, the
average number of both doctor visits and absences fell, while the duration of absences
lengthened, suggesting that medical treatment and work absenteeism in this case may be
complements.
Other studies analyzed long-term sickness and the unemployment,12 some of them
concluding that official unemployment figures do not accurately reflect the true extent
of joblessness. Armstrong (1999) found that many men in Northern Ireland registered as
long term sick but who, under plausible assumptions, would be available for work.
There are several Swedish studies that analyzed the relationship between
unemployment and (long-term) absenteeism due to sickness, and found that people who
were or are unemployed face a higher risk of being sick than people without
unemployment history.13 Lidwall (1997) found that older employees, those with lower
education and those who worked in a bad physical or social environment had a higher
risk of being long-term sick. His results show that not only unemployment itself
increased the duration of the absence due to sickness, but also the complex interaction
between being unemployed, socialy isolated, and depressed.
Knutsson and Goine (1998) analyzed long-term absence due to sickness among
twelve typically male and female occupations in two Swedish counties, and found a
strong positive correlation between age and absenteeism. When controlling for age and
occupation, they found no relationship between unemployment rates and sickness
absences among women. Among men, however, an inverse relationship between
unemployment rates and long-term sickness absence was found.
Lidwall and Skogman Thoursie (2000) analyze the development of absences due
12 Disney and Webb (1991), Forsythe (1995), Beatty and Fothergill (1996), Gustafsson and Klevmarken (1993), and Bäckman (1998). 13 Marklund (1995), Hammarström (1996), Marnetoft et al. (1996), Selander et al. (1996a, 1996b), and Marklund and Lidwall (1997).

11
to sickness and newly granted disability pensions, using official statistics produced by
the National Social Insurance Board since 1955. They show that, in the beginning of the
1990s, long-term sickness absence decreased for all age groups, but most of all for age
groups with weak positions on the labor market such as the youngest, for whom it was
harder to get established on the regular labor market and consequently, qualify for a
sickness benefit. On the other hand, they explained the increase in long-term sickness
since 1997 by the decrease in unemployment rate, but also by the fact that the labor
force has gotten older.
4 Theoretical framework
Employees with bad health status are defined in this study as persons experiencing a
sickness spell of 60 days or more. What is characteristic for them is that they may
undergo various transitions, as for example, transitions between the labor market states
of employment, unemployment, and nonparticipation. This reflects the dynamic aspects
of economic behavior. Data on �waiting times� until the transition takes place describe
the duration until an event occurs as the outcome of a decision on the optimal moment
for doing the transition to another state. With such a design, the question is what
economic model is suitable to explain individuals� experiences in various (labor market)
states. The theoretical models most frequently used for reduced-form econometric
duration analyses are search models.14
As suggested by Fenn (1981), conventional search models used in analyzing the
behavior of unemployed people could be relevant for analyzing the behavior of sick
people if their employment contract were terminated, either at their own initiative, or at
that of their employer. In Sweden employees are protected against contract termination
in the case of sickness. Nevertheless, the conventional search model can be used for
analyzing the behavior of sick people, given the fact that they would like to have a job
and working conditions that fit better their health status.
14 Job search models have been very popular as explanatory theoretical frameworks for reduced-form econometric duration analysis (see Devine and Kiefer, 1991).

12
People can often return to work after their sickness spells, although it is not given
that it is appropriate for them to return to their current job tasks or place of employment.
If no other alternative is offered, it is expected that the duration of the sickness spell
would be even longer. Sick employees have the alternative to enter a rehabilitation
program, at their own initiative, or at that of the social insurance office together with the
company physician. The rehabilitation program can be vocational (directed mainly in
getting skills for a new job), medical (directed to medical treatment and/or physical
exercises that are expected to recuperate from the loss on working capacity), and social
(alcohol programs belong to this group in Sweden). If medical evaluations show that
employees have some limitation in doing their previous job, a change of job may be the
optimal alternative, even if it requires the acquisition of new skills through a vocational
rehabilitation program. If the medical evaluation shows that they have not yet
recuperated at least partially, but it is expected that they will in the future, then, if it is
not possible to participate in a rehabilitation program, they can �choose� to remain on
sickness benefits.15
Medical evaluation can also conclude with a recommendation for participating in
a rehabilitation program, or with a recommendation for temporary or permanent exit
from the labor market with a disability pension, either of which can be either partial or
full. If no hope for total or partial or recovery exists, full permanent disability exit will
be recommended.
In many cases, people may be able to return to their previous job, doing the same
task as before, but some changes in the working conditions may be required (e.g., an
ergonomic desk, a better chair, etc). These possibilities are quite realistic, especially in
Sweden, where much funding is allocated for improvement of the working conditions
and the working environment, for vocational rehabilitation programs, special programs
aimed at the employment of the disabled, etc.
15 �Being sick� is viewed in a very general way here as not being a choice, but at the margin, choice may still be possible. We will assume that medical evaluations are very well done, showing the true health status of employees. We will also assume that, given a reasonable wage, employees prefer to work, and would choose any work reasonable alternative their health status allows.

13
If people return to work with a residual disability, it may also be realistic to
assume that their wage offer (w) is higher than the disability benefit (b), so that b < w. It
may also be realistic to assume that their wage offer (w) can be lower than what they
had before sickness (w0), but still higher than their initial reservation wage (wr), so that
wr < b < w < w0. It implies that the financial alternative of disability benefit can have
impact in the decision of return to work. Therefore, a generous social insurance benefit
level can decrease the propensity to return to work, which does not necessarily imply
that people who leave the labor market with a disability benefit would be better off in
the long-run. Additionally, their health and/or financial dependency would require even
more support later on than if they would chose to work at least some hours. If working
some hours is one avenue for better life, then the problem is to find such jobs.
Unlike the job search process for �healthy� people that can require considerable
time and resources, and where the returns of these investments are uncertain, job search
for employees with long-term sickness spell can require less effort if the opportunity at
his/her current place of employment are sufficiently varied. In addition, there may be
less uncertainty because of programs designed to help the employee back to the same
place of employment. For example, there is continuous collaboration between social
insurance offices, employers and medical personnel. Thus, in this study we will assume
that those with �poor health� aim to maximize the expected present value of their
income over their lifetime with a subjective rate of discount, anticipating (or not) that
the job offer and its distribution, and compensation for earnings loss due to sickness or
disability, may change over time. More precisely, one can return to work with the same
wage as before, but there is an alternative to change jobs to a lower (and even higher)
wage than before; and to work fewer hours than before. Additionally, the financial
alternative (disability benefit) can vary over time, which can also affect the expected
value or present value of the income of sick employees.

14
5 The data
This paper analyses the LSIP sample from the Long-term Sickness (LS) database, from
the National Social Insurance Board of Sweden. This sample of 2789 persons represents
all residents in Sweden registered with the social insurance office, born during 1926-
1966, and who had at least one sickness spell of at least 60 days during the period 1986-
1989. The sample is longitudinal and contains all compensated sickness spells during
the period January 1, 1983 through December 31, 1991, including exact beginning and
ending dates. However, there is no data on possible long-term sickness spells before
1983, and there is no information on diagnosis for spells that started before January 1,
1986 (except for ongoing spells at this date). All people who died or left the country
during the observation period were excluded in this study, resulting in final a sample of
2666 persons, who had 4430 spells of long-term (LT) sickness.
Table 2 presents the descriptive statistics, at the beginning of analyzed spells of
long-term sickness, by spell. The share of women increases by spell of LT sickness
which is consistent with the national statistics, which show that women are generally
sick more often and longer the men. The percentage of young women (35 and under) is
considerably higher than that of young men, possibly explained by complications
related to childbirth, but perhaps also due to less emphasis on the environment in
typically female occupations (health care, education, etc.). The opposite is true for the
oldest age group (56-65 years). The fact that the first two spells of LT sickness, the
percentage of older men is higher than that of older women in this group, may be
explained by the fact that, in the 1980s, women who were born in the 1920s and 1930s
had, on average, fewer years in the work force and thus perhaps a lower risk of
disability.
The proportion of Swedish born people decreased by spell, while the proportions
of naturalized Swedes and (other) foreign born persons increased by spell. This may
suggest lower human and/or health capital, as well as possible cultural factors.

15
Table 2 Descriptive statistics, at the beginning of analyzed LT sickness spell, by gender and spell, 1986-1991
First spell of long-term sickness Second spell of long-term sickness Third spell of long-term sickness All Men Women All Men Women All Men Women
n = 2666 n = 1187 n = 1479 n = 1089 n = 452 n = 637 n = 415 n = 160 n = 255 Variable Mean Std Mean Std Mean Std Mean Std Mean Std Mean Std Mean Std Mean Std Mean Std
Gender (1=Female) 0.56 0.50 0.58 0.49 0.61 0.49 Age 43.70 11.81 44.72 11.71 42.88 11.84 44.53 11.61 45.38 11.57 43.92 11.60 44.38 10.97 43.98 11.49 44.63 10.65
Age-groups 35 and under 0.29 0.46 0.26 0.44 0.32 0.47 0.26 0.44 0.24 0.43 0.28 0.45 0.25 0.44 0.29 0.46 0.23 0.42 36-45 years 0.24 0.43 0.24 0.43 0.24 0.43 0.26 0.44 0.25 0.43 0.27 0.44 0.29 0.45 0.26 0.44 0.31 0.46 46-55 years 0.25 0.43 0.25 0.43 0.24 0.43 0.25 0.43 0.26 0.44 0.24 0.43 0.26 0.44 0.26 0.44 0.27 0.44 56-65 years 0.22 0.41 0.25 0.43 0.19 0.40 0.23 0.42 0.25 0.43 0.22 0.41 0.20 0.40 0.19 0.40 0.20 0.40
Citizenship Swedish born 0.85 0.36 0.84 0.37 0.85 0.35 0.82 0.38 0.82 0.39 0.82 0.38 0.78 0.41 0.81 0.40 0.77 0.42 Foreign born 0.08 0.28 0.09 0.29 0.07 0.26 0.09 0.29 0.10 0.30 0.09 0.29 0.12 0.32 0.13 0.33 0.12 0.32 Nationalized Swede 0.07 0.26 0.07 0.26 0.07 0.26 0.09 0.28 0.08 0.27 0.09 0.28 0.10 0.30 0.07 0.25 0.12 0.32
Educational level Low 0.63 0.48 0.69 0.47 0.59 0.49 0.65 0.48 0.71 0.45 0.61 0.49 0.67 0.47 0.69 0.46 0.65 0.48 Medium 0.28 0.45 0.27 0.44 0.30 0.46 0.29 0.45 0.26 0.44 0.31 0.46 0.28 0.45 0.29 0.45 0.27 0.45 High 0.08 0.28 0.05 0.21 0.11 0.32 0.06 0.24 0.03 0.17 0.08 0.27 0.06 0.23 0.02 0.14 0.08 0.27
Marital status Unmarried 0.27 0.44 0.31 0.46 0.23 0.42 0.25 0.43 0.31 0.46 0.21 0.41 0.24 0.42 0.31 0.47 0.19 0.39 Married 0.55 0.50 0.52 0.50 0.57 0.50 0.53 0.50 0.51 0.50 0.54 0.50 0.49 0.50 0.44 0.50 0.52 0.50 Divorced 0.16 0.37 0.16 0.37 0.17 0.37 0.19 0.39 0.16 0.37 0.21 0.41 0.24 0.43 0.22 0.42 0.25 0.44 Widowed 0.02 0.15 0.01 0.11 0.03 0.18 0.03 0.18 0.02 0.12 0.04 0.21 0.04 0.19 0.03 0.16 0.04 0.20 No. of children (<7 years) 0.17 0.48 0.01 0.09 0.30 0.62 0.20 0.54 0.00 0.05 0.34 0.68 0.15 0.49 0.01 0.08 0.24 0.61 No. of children (7-16 years) 0.17 0.49 0.02 0.16 0.29 0.61 0.21 0.52 0.02 0.14 0.35 0.64 0.21 0.49 0.03 0.21 0.32 0.58 Spell duration (in days) 306.4 371.9 327.8 384.2 289.1 360.8 271.0 282.7 285.0 300.5 261.1 269.1 282.0 261.8 289.5 271.2 277.2 256.1

16
First spell of long-term sickness Second spell of long-term sickness Third spell of long-term sickness All Men Women All Men Women All Men Women
n = 2666 n = 1187 n = 1479 n = 1089 n = 452 n = 637 n = 415 n = 160 n = 255 Variable Mean Std Mean Std Mean Std Mean Std Mean Std Mean Std Mean Std Mean Std Mean Std No. of spells before spell i 5.31 5.96 4.66 5.69 5.84 6.13 10.34 8.79 9.41 8.74 10.99 8.77 13.23 9.45 12.45 9.88 13.72 9.15 No. of ST spells before spell i 2.98 4.86 2.42 4.38 3.43 5.18 5.13 6.58 4.31 6.06 5.70 6.86 5.88 6.63 5.02 6.17 6.42 6.86
Diagnosis Musculoskeletal 0.39 0.49 0.38 0.49 0.39 0.49 0.44 0.50 0.41 0.49 0.47 0.50 0.47 0.50 0.43 0.50 0.49 0.50 Cardiovascular 0.07 0.25 0.10 0.30 0.04 0.20 0.06 0.24 0.09 0.28 0.04 0.20 0.03 0.18 0.04 0.21 0.03 0.16 Mental 0.12 0.32 0.12 0.33 0.12 0.32 0.13 0.34 0.17 0.38 0.11 0.31 0.19 0.39 0.26 0.44 0.14 0.35 Respiratory 0.03 0.16 0.03 0.17 0.02 0.15 0.03 0.17 0.03 0.17 0.03 0.18 0.01 0.11 0.03 0.16 0.00 0.06 General Symptoms 0.04 0.20 0.03 0.16 0.05 0.22 0.05 0.22 0.05 0.22 0.06 0.23 0.06 0.23 0.03 0.18 0.07 0.26 Injuries and poisoning 0.13 0.34 0.18 0.39 0.09 0.28 0.07 0.25 0.11 0.31 0.04 0.19 0.06 0.24 0.08 0.27 0.05 0.21 Other 0.23 0.42 0.16 0.37 0.29 0.45 0.21 0.41 0.15 0.35 0.26 0.44 0.19 0.39 0.13 0.34 0.22 0.42 Annual earnings (1000 SEK)* 160.2 76.3 184.8 83.4 140.6 63.7 162.9 61.7 184.6 66.5 147.3 52.9 162.5 61.7 186.7 69.1 147.3 51.1 Unemployment rate** 2.30 1.29 2.40 1.38 2.21 1.21 1.96 1.09 1.96 1.02 1.96 1.13 1.86 1.02 1.77 0.91 1.91 1.08 Note: * Annual Earnings of the year when the first LT sickness spell began were inflated to �present� values using the 1997 CPI; ** Unemployment rate is reported by quarter, gender and administrative region, and is shown here for the quarter when LT-sickness spell began.

17
The proportion of persons with lower education increased by spell, which might
be explained by the characteristics of the job and/or working environment, perhaps in
combination with the selection of persons with lower education to specific tasks.
The proportion of married people decreased by spell, perhaps because married
people cannot afford the income loss; on the other hand, marriage might be a healthier
state. It could also happen that �poor health� might make marriage less likely, or make
the transition from married to divorced more likely.
Third spells were, on average, shorter than first spells, but longer than second
spells. The average number of short-term sickness spells (i.e., spells of seven days or
less) preceding the LT sickness increased by spell, from about 3 before the first LT
spell, to over 5 before the second, and almost 6 before the third.
The proportion of spells with muskoloskeletal, mental, and general diagnoses
increased by spell, while the proportion of injuries and poisoning decreased by spell, as
did cardiovascular and �other� diagnosis. The fact that injuries and poisoning decrease
relatively makes sense since these are usually not conditional on whether a person has
previously had an event of this kind. On the other hand, the other diagnoses are more
likely, although not necessarily so.
The annual earnings of the year when the first LT sickness spell began, �adjusted�
for the loss due to sickness, changed very little by spell. The average regional
unemployment rate at the beginning of the LT sickness spell decreased by spell, but
there is no gender specific tendency.
Table 3 shows descriptive statistics of sickness variables (days and spells) by
individual. The average person in the sample was sick 582 days during the analyzed
period, with 1.7 spells of long-term sickness, and 8.9 spells of short-term sickness.
Table 3 Descriptive statistics by individual during 1986-1991 (N=2666)
Variable Min Max Mean Std Dev Days of Long-Term Sickness 60 3153 483.38 447.25 Days of Short-Term Sickness 0 1106 99.39 110.95 Total Days of Sickness 60 3346 582.78 466.78 Number of Long-Term Sickness Spells 1 10 1.66 1.02 Number of Short-Term Sickness Spells 0 101 8.89 10.41
18
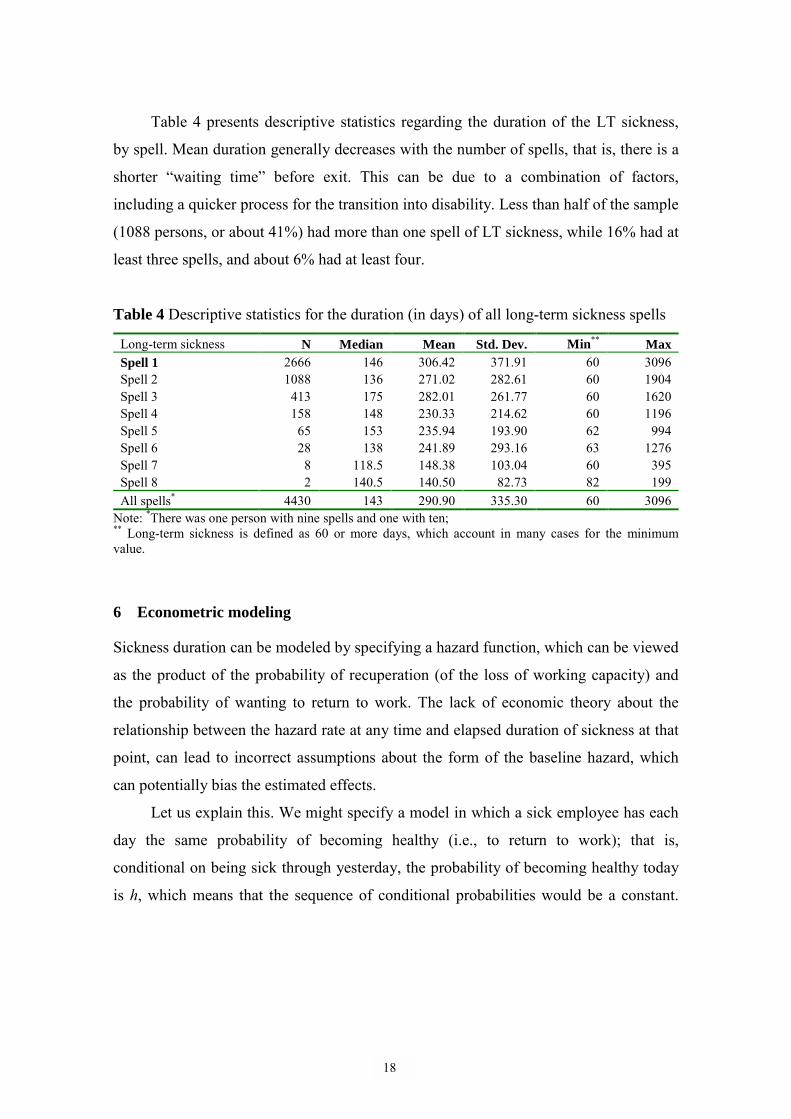
Table 4 presents descriptive statistics regarding the duration of the LT sickness,
by spell. Mean duration generally decreases with the number of spells, that is, there is a
shorter �waiting time� before exit. This can be due to a combination of factors,
including a quicker process for the transition into disability. Less than half of the sample
(1088 persons, or about 41%) had more than one spell of LT sickness, while 16% had at
least three spells, and about 6% had at least four.
Table 4 Descriptive statistics for the duration (in days) of all long-term sickness spells
Long-term sickness N Median Mean Std. Dev. Min** Max Spell 1 2666 146 306.42 371.91 60 3096 Spell 2 1088 136 271.02 282.61 60 1904 Spell 3 413 175 282.01 261.77 60 1620 Spell 4 158 148 230.33 214.62 60 1196 Spell 5 65 153 235.94 193.90 62 994 Spell 6 28 138 241.89 293.16 63 1276 Spell 7 8 118.5 148.38 103.04 60 395 Spell 8 2 140.5 140.50 82.73 82 199 All spells* 4430 143 290.90 335.30 60 3096
Note: *There was one person with nine spells and one with ten; ** Long-term sickness is defined as 60 or more days, which account in many cases for the minimum value.
6 Econometric modeling
Sickness duration can be modeled by specifying a hazard function, which can be viewed
as the product of the probability of recuperation (of the loss of working capacity) and
the probability of wanting to return to work. The lack of economic theory about the
relationship between the hazard rate at any time and elapsed duration of sickness at that
point, can lead to incorrect assumptions about the form of the baseline hazard, which
can potentially bias the estimated effects.
Let us explain this. We might specify a model in which a sick employee has each
day the same probability of becoming healthy (i.e., to return to work); that is,
conditional on being sick through yesterday, the probability of becoming healthy today
is h, which means that the sequence of conditional probabilities would be a constant.

19
But this assumption would not seem to represent the data used here, which contain
spells of long-term sickness, for which it might be more appropriate to assume that the
�conditional probability� of becoming healthy h(t), decreases with the length of spell.16
The random variable, D, which represents duration of sickness is expressed as the
number of days and the hazard function for this random variable, and is defined in terms
of the cumulative distribution function F(t) and the probability density function f(t) by
(1) )(1
)()(tF
tfthD −=
which, considering that 1 - F(t) = SD(t), can be rewritten as:
(2) dt
tSdth DD
)(log)( −=
where SD(t) is the survival function, or the probability that the sickness spell did not end
prior to time t.
The evolution of the hazard function in time gives information about the duration
dependence of an underlying stochastic process. If h(t)/t >0, then the process exhibits
positive duration dependence, which in our case would mean that the hazard of ending
sickness any given day increased over time. If h(t)/t < 0, then the process exhibits
negative duration dependence, which in our case would mean that the hazard of ending
sickness decreased over time.
The proportional hazards model developed by Cox (1972) assumes that the hazard
falls or rises over time at the same rate for all individuals, differing only according to
the individual�s vector of personal characteristics, x. Following Cox�s model, we
assume that the hazard function can be thus factored into a function of time and a
function of variables related to spell and to individual. A corresponding model for the
hazard of ending sickness is
16 The hazard rate (also called hazard function, risk function, intensity rate, failure rate, transition rate, or mortality rate), expresses the instantaneous risk of ending sickness at time t, given that this event did not occur before time t. It is not a probability, because h(t) is a positive number that can be greater than 1.

20
(3) )exp()();( 0 ii xthxth β= ,
where β are the coefficients to be estimated, and h0(t) is an unknown function of time.
The expression h0(t) gives the hazard function for the �standard� set of conditions, x = 0.
This model and its special cases, most notably the proportional hazards (PH) model,
have been used in hundreds of empirical studies (see Devine and Kiefer, 1991, for
references in micro labor economics). A flexible specification of the baseline hazard rate
allows for non-monotonic variation with duration, and therefore a wider range of
possible effects of duration on the hazard rate are captured.
A problem, associated in the literature with Heckman and Singer (1985), is that
the presence of unobserved heterogeneity tends to produce estimated hazard functions
that decline with time even when the hazard is not declining for any individual in the
sample. This occurs when �high hazard� individuals are �exiting� more rapidly at all
points in time, leaving in time a risk set that is made up only of �low hazard� people.
This problem could lead to errors in computing and interpreting the hazard functions
and the coefficients for the covariates. Additionally, with longitudinal data with
multiple spells, another problem is whether, given the observed explanatory variables,
the various durations are independently distributed or not.17 Current econometric
research often involves the simultaneous analysis of multiple observed spells, of either
the same type or of different types of duration for a given individual.
In trying to learn more about factors affecting long-term sickness spells, we will
here consider �families� of spells, i.e., groups of spells by individual, by diagnosis, and
by region. Thus we can consider the impact of unobserved group-level heterogeneity on
sickness duration. We will assume that spells in the same group share a common set of
time-invariant, generalized, unmeasured characteristics that can be captured by an
unobserved variable representing the group�s propensity to exit from LT sickness.
17 Van den Berg (2000) examines various types of relations between duration variables, as motivated by economic theory, and how they can be incorporated into multivariate extensions of the mixed proportional hazards model. One of his main conclusions regarding multiple-duration models is that, in micro-econometric research involving self-selection, duration data are much more informative than binary data.

21
Groups with identical observed characteristics can have different absence behavior due
to long-term sickness. Given otherwise similar characteristics, spells in one group might
be longer than spells in another partly as a result of genetics, but also because of
different nutrition, living conditions and access to healthcare at different times in life.
These factors are here considered to be part of an unmeasured group-level component
(or random effect) that contributes to the risk of exit from LT sickness. Other factors
(that unfortunately we cannot observe here) are working conditions, social contacts, job
satisfaction and cultural background. Similarly, the other �families� of spells (groups of
spells by diagnosis, and groups of spells by regions) share (other) common
characteristics.
Based on the various groups of spells, let Ti1, �. TiJ denote the J �waiting times�
(or, durations) before exit from long-term sickness in the �family� i. Let xij denote the
fixed and time-varying covariate vector associated with the jth individual in the ith group.
A group-level random effect, or frailty term, (wi) can be introduced to account for the
dependence of �waiting times� before exits from LT sickness within the groups.
Conditional on this unobserved �characteristic�, event times within groups are mutually
independent with the conditional (on heterogeneity) hazard function
(4) iijijiij wxthwth )exp()()|( 0 β′= ,
where β is a vector of fixed and time-varying effects, and h0(tij) denotes the baseline
hazard. The group-level random effect, wi, acts multiplicatively on the group i risk of
exit from LT sickness so that all spells� risks of ending in a particular group are
multiplied by this common factor. We will assume that the frailty term follows a gamma
distribution with density function, g(wi) = ααwiα-1exp(-αwi)/Γ(α), where the distribution is
normalized to have a unit mean and a variance of σ. When σ = 0, the observations are
mutually independent and the equation reduces to the standard proportional hazards
model for individual-spell data (3). The estimate of σ can be interpreted in terms of the
relative risk of exit from a hypothetical spell of long-term sickness.
Considering a group (i) of J spells, the ratio of the conditional hazard for a long-
term sickness spell on day t1, given that all other spells in the group ended at day t2, t3,
�tJ, to the conditional hazard of exiting a long-term sickness spell at day t1, given that a
specific subset of spells had not ended at those times is (1+σ) times the number of spells

22
hypothesized to have had ended at the specified times. The intra-group rank correlation
coefficient (or Kendall's tau) can be interpreted as the percentage of total variation in
the risk of exiting sickness that is between-group variation. The Expectation
Maximization (EM) algorithm is used to fit this model. Given the data, the algorithm
finds a frailty estimate for each group. The frailty distribution parameter, α, is estimated
in one step, and is then used to estimate each group's frailty (wi). The estimated frailty
(ŵi) is substituted for wi, and this process is repeated until the difference in successive
estimates of α is negligible.
7 Results
7.1 Nonparametric survival analysis
Figures 5a and 5b show the survival and hazard functions for first, second, and third
spells of long-term sickness, estimated by the life-table method. In order to have a
(more) detailed graphical representation, the plots were �truncated� for the first, second,
and third years of sickness. Spell durations were also �truncated� into intervals of seven
days, so the results can depend to some extent on these arbitrarily defined intervals. In
addition, there are relatively large numbers of cases for the first and second spells of LT
sickness (2021 and 1080, respectively), and relatively few (413) for the third, which
means that the method gives relatively better approximations for the first two spells of
long-term sickness.

23
a) Survival estimates (s) during I) first year, II) second year, III) third year of long-term sickness
b) (Smoothed) hazards during I) first year, II) second year, III) third year of long-term sickness
Figure 5 Survival and hazard functions of absenteeism due to long-term sickness, by spell, 1986-1991.

24
The plots of the survival function (Figure 5a) show estimates of the proportions of
sick people who have not yet become better (finished their sickness spell) up to a
specific duration calculated from the first day of sickness (even though all spells are of
at least 60 days). Most notable, the estimated proportion of people remaining sick fell
rapidly during the first four months, and then slowed considerably. After one year about
30% of all analyzed people were still recorded as being long-term sick, while about
70% have already exited.
Table A2 (in the Appendix) shows results of tests of whether spells 1, 2 and 3 can
be considered �equal�. They cannot, which means we cannot pool all spells and treat
them as single spells without affecting the parameter estimates and their standard errors.
The great variety in the number of spells per individual (Table 4) also suggested that the
analyzed sample is quite heterogeneous. As discussed above, neglected or unobserved
heterogeneity across observations can lead to apparent time-dependence and wrong
conclusions. Therefore, an unobservable multiplicative random effect shared by spells
within a group is considered, and the model is estimated now using all spells of LT
sickness (not only the first three), grouped by individual, diagnosis, and region.
7.2 Multivariate analysis
Table 5 shows the estimation results for the conditional hazard function (4) for spells
grouped by spells by individual, spells by diagnosis, and spells by regions. In general
the hazard of ending LT sickness was (18-46%) higher for women than men during
1986-1991. The hazard of ending LT sickness was lower for older people: For people
aged 36 to 45 it was about 77-81% of the hazard of those aged 35 or younger, while for
those aged 46 to 55 it was about 66-74%, and for those aged 56 to 65 it was 55-64%.

25
Table 5 Estimations results for 4430 spells grouped by individual, diagnosis, and region
Individuals (J = 2666 )
Diagnosis (J = 346)
Region (J =25)
Variables Estim. S.E. HR Estim. S.E. HR Estim. S.E. HR Frailty 0.31 0.03 1.36 0.32 0.04 1.37 0.01 0.01 1.01 Female (CGa: Male) 0.38 0.05 1.46 0.21 0.04 1.23 0.16 0.03 1.18 Age (CG: < 36 years) 36-45 years -0.26 0.06 0.77 -0.21 0.05 0.81 -0.25 0.05 0.78 46-55 years -0.42 0.07 0.66 -0.30 0.05 0.74 -0.35 0.05 0.70 56-65 years -0.59 0.07 0.55 -0.45 0.06 0.64 -0.47 0.05 0.63 Citizenship (CG: Swedish Born) Naturalized Swede -0.12 0.08 0.89 -0.12 0.06 0.88 -0.10 0.06 0.90 Foreign born 0.04 0.08 1.04 0.04 0.06 1.04 -0.02 0.06 0.98 Marital status (CG: Married) Unmarried -0.09 0.06 0.91 -0.07 0.05 0.94 -0.14 0.04 0.87 Divorced -0.06 0.06 0.94 -0.04 0.05 0.96 -0.02 0.04 0.98 Widowed 0.06 0.13 1.07 0.09 0.11 1.10 0.08 0.10 1.08 Educational level (CG: low) Medium -0.02 0.05 0.98 -0.03 0.04 0.97 0.01 0.04 1.01 High -0.26 0.09 0.77 -0.17 0.07 0.84 -0.04 0.06 0.96 Quarter (CG: Winter) Spring -0.06 0.06 0.94 -0.04 0.05 0.96 -0.06 0.05 0.94 Summer -0.30 0.05 0.74 -0.24 0.05 0.78 -0.23 0.04 0.79 Autumn -0.15 0.05 0.86 -0.15 0.05 0.86 -0.14 0.05 0.87 Year (CG: ≤ 1986) 1987 0.12 0.06 1.13 0.14 0.05 1.14 0.17 0.05 1.18 1988 -0.06 0.07 0.95 -0.03 0.06 0.97 0.02 0.06 1.02 1989 -0.13 0.08 0.88 -0.07 0.07 0.93 0.02 0.06 1.02 1990 -0.22 0.10 0.80 -0.14 0.08 0.87 -0.05 0.08 0.95 1991 -0.87 0.13 0.42 -0.75 0.12 0.47 -0.65 0.12 0.52 Diagnosis (CG: respiratory) Musculoskeletal -0.12 0.12 0.88 -0.04 0.10 0.96 Cardiovascular -0.16 0.14 0.85 -0.06 0.12 0.94 Mental 0.00 0.13 1.00 0.03 0.11 1.03 General symptoms 0.17 0.15 1.19 0.13 0.13 1.14 Injuries & poisoning 0.39 0.14 1.48 0.32 0.11 1.38 Other 0.24 0.13 1.27 0.24 0.10 1.27 Previous cases b 0.00 0.00 -0.29 0.00 0.00 0.10 0.00 0.00 0.16 Daily lossc (100 SEK) 0.03 0.00 3.16 0.02 0.00 2.20 0.01 0.00 1.22 Unemployment rate -0.07 0.03 -6.68 -0.06 0.02 -5.95 -0.05 0.02 -4.72 Region (CG: Göteborg) Kronoberg 0.36 0.19 1.43 0.25 0.15 1.29 Bohuslän -0.30 0.15 0.74 -0.29 0.11 0.75 Varmland 0.35 0.14 1.41 0.27 0.11 1.31 Kendall's TAU 0.13 0.14 0.006 -2 Log Likelihood 48550 48323 227 48628 48340 288.1 48621 48603 17.5 Note: Bolds are significant at the 10%-level; Italics for hazard ratio (HR) indicate that for the continuous variables it had been recomputed as phr = 100*(hr-1); a CG is the comparison group; b Previous cases of sickness before the analyzed spell, and starting with January 1983, regardless of their duration; c Daily earnings loss due to sickness.

26
The hazard of naturalized Swedes to exit LT-sickness was 88-90% of the hazard
for Swedish born people.
The hazard to exit LT-sickness for those with higher education was lower (about
77-84%) than the hazard for people with lower education. This result can be explained
by several characteristics of the two groups, such us: income, work environment and
working conditions, and health capital. Especially in Sweden, where medical insurance
is universal, it is possible that the individuals� care for their health is an important factor
driving this difference. People with higher education may be more careful with their
health, and more receptive to all information related to health issues than less educated
people.
People whose spells started in winter showed the highest hazard of exiting from
LT sickness. For those whose spells started in a summer quarter, the hazard of exiting
from LT sickness was 74-79% of the hazard of those whose spells started during the
winter quarter, while for those whose spells started in a autumn quarter it was about 86-
87%.
The hazard for exiting from LT sickness was (13-18%) higher for spells that
started in 1987 compared to those that started in 1986 or before (i.e., 1983-1986), while
for those started in 1991 it was only 42-52% as high. These were the only years with
several highly significant results, and they happen to coincide with two reforms of the
social insurance, which occurred under two very different macro trends: the relatively
good period of the end of the 1980s, and the beginning of the recession period in the
early 1990s. This can be an explanation of the different sign of the estimated
coefficients for years 1987 and 1991.
The hazard of exit from LT sickness was (38-48%) higher for those with injuries
or poisoning diagnosis, than for those with a respiratory diagnosis; and those with
�other� diagnosis were 27% higher.
The daily loss of earnings had a significant impact on the duration of absence due
to sickness: For each 100 Swedish crowns daily earnings loss, the hazard of exit from
LT sickness went up by 1.2-3.2%. The regional unemployment rate also had a
significant effect: Each additional percentage point was associated with a 4.7-6.0%
decrease in the hazard of exit from LT sickness.
There are also geographical differences. The hazard of exit from LT sickness was

27
(29-43%) higher for those living in Kronoberg and Värmland compared to those living
in Göteborg, while for those living in Bohuslän it was only about 75% of the hazard of
those living in Göteborg. Parameter estimates and hazard ratios for the other regions
that were not significant at the 10%-level are shown in Table A3 in the Appendix.
Judging by Kendall�s tau, the intra-group correlation was about 0.13 for spells
grouped by individual and by diagnosis, and less than 0.01 for spells grouped by region.
Thus there was a relatively low association in the risk of exit from LT sickness among
individuals and diagnoses, and almost no association among regions.
8 Summary and conclusions
This paper presented new evidence on the determinants of the duration of long-term
sickness for employed individuals in Sweden from mid-1980s through beginning of the
1990s, using longitudinal data from a representative subset of the insured population.
The probability of exiting long-term sickness declined considerably after about four
months (Figure 5), which suggests that policies aimed at helping the long term sick
return to work should focus on helping employees with health problems before this
period. Regarding this, prevention methods directed towards improving working
conditions and evaluating job tasks should be considered more often.
During the period of the study, women had a higher hazard to exit from LT
sickness than men (Table 5), much of which might be explained by the fact that women
exited into disability more often than men. The older people were, the lower was the
hazard of exit from LT sickness, which indicates that little is done to help older workers
back to the work place. This suggests that policy initiative to improve health status,
speed up the recovery and encourage work should also be targeted towards those in
older age groups. On the other hand, to prevent or slow down the increasing trend of LT
sickness, besides helping these people, special policies should be oriented to prevent
deterioration of the heath status of younger employees. These policies should relate both
to working conditions and to health problems related to work. One such policy would be
greater flexibility in working time. In this context the consequence of overtime work
and the burden of both paid careers and house work (usually) for women needs to be
analyzed in a long-term perspective as well, since over use work capacity today might
28
cause health problems in the future.
The hazard of exit from LT sickness was lower for naturalized Swedes than the
Swedish born. There was labor migration to Sweden during 1960s and early 1970s,
often to jobs requiring hard physical effort and/or with a less amenable working
environment (there was less competition from Swedes for these jobs). Many may have
worked many overtime hours as well, hoping to return home �wealthy�. If they did not
then return home, and they belong to the group of naturalized Swedes, it would not be
surprising that their LT sickness might last longer. This indicates that it is important to
pay more attention both to physical working conditions and to hours of work. Generally,
improving working conditions and designing the tasks of each job so as to prevent a
misuse of individuals� working capacity should be priorities for employers. In this sense
the involvement of employers in payment of their employees� sick pay (during the first
2, or even 4, weeks of each spell) is well motivated, not only as an instrument for
�disciplining� employees� absenteeism, but also as an indicator telling employers
something about the working conditions in their organizations. Under these
considerations, the employers� contributions to the social insurance should also be
redesigned.
The quarter when a LT sickness spell started also had an impact on the hazard of
exiting the spell: Starting during the summer implied the lowest hazard of exiting
compared to winter. These findings may suggest an effect of weather. During the colder
and darker months, persons with rheumatic or psychological problems may be affected
more.
Loss of earnings due to sickness decreased the length of the spell. On the other
hand, the presence of high unemployment increased the length of the spells, perhaps,
due to the uncertainty about the outcome if people return to work.
The medical examination is clearly a very important element in this whole
process, but even more so regarding the future of employed individuals. Having a well-
done evaluation, and flexible programs connected to it, can help the individual�s health
and wealth, and the society too. Nevertheless, being active in a �well-balanced� way is
considered to have a positive impact on health, especially in the long run.

29
References
Armstrong, D. (1999), Hidden male unemployment in Northern Ireland, Regional Studies 33 (6), 499-511.
Baum, J. F., and S. Youngblood (1985), Impact of an organizational control policy on absenteeism, performance, and satisfaction. Journal of Applied Psychology 60, 688-694.
Beatty, C., and S. Fothergill, (1996), Labour market adjustment in areas of chronic industrial decline: The case of the UK coalfields, Regional Studies 30(7), 627-640.
Brown, S. (1994), Dynamic implications of absence behaviour, Applied Economics, 26, 1163-1176.
Brown, S. and Sessions, J. G. (1996), The economics of absence: theory and evidence, Journal of Economic Surveys, 10(1), 23-53.
Brown, S. (1999), Worker absenteeism and overtime bans, Applied Economics 31, 165-174.
Butler, R.J., and J. Worrall (1985), Work injury compensation and the duration of nonwork spells, Economic Journal 95, 714-724.
Bäckman, O. (1998), Longitudinal studies on sickness absence in Sweden, Swedish Institute for Social Research 34, Doctoral Dissertation, Stockholm University.
Chaudhury, M., and I. Ng (1992), Absenteeism predictors: least squares, rank regression, and model selection results, The Canadian Journal of Economics 25, 615-635.
Chelius, J.R. (1981), Understanding absenteeism: The potential contribution of economic theory, Journal of Business Research 9, 409-18.
Cox, D.R. (1972). Regression models and life tables. Journal of the Royal Statistical Society. Series B 34, 187-220.
Dalton, D. R., and Mesch, D. J. (1992), The impact of employee-initiated transfer on absenteeism: a four-year cohort assessment, Human Relations 45, 291-304.
Devine, T.J. and N.M. Kiefer (1991), Empirical Labor Economics, Oxford University Press, Oxford.
Disney, R., and S. Webb (1991), Why are there so many long-term sick in Britain?, Economic Journal 101, 252-262.
Drago, R., and Wooden, M. (1992), The determinants of labor absence: economic factors and work group norms, Industrial and Labor Relations Review 45, 34-47.
Dunn, L.F., and Youngblood, S. A. (1986), Absenteeism as a mechanism for approaching an optimal labour market equilibrium: an empirical study, Review of Economics and Statistics 68, 668-74.
Fenn, P.T. (1981), Sickness duration, residual disability, and income replacement: an empirical analysis, Economic Journal 91, 158-173.
Forsythe, F.P. (1995), Male joblessness and job search: regional perspectives in the UK, 1981-1993, Regional Studies 29(5), 453-63.

30
Gilleskie, D. (1998), A dynamic stochastic model of medical care use and work absence, Econometrica 66, 1 - 45.
Gustafsson, B. and A. Klevmarken (1993), Taxes and transfers in Sweden: incentive effects on labor supply, in A.B. Atkinson and Gunnar Viby Mogensen, editors, Welfare and Work Incentives. A North European Perspective, Oxford University Press.
Hammarström, A. (1996) Ungdomsarbetslöshet och ohälsa (Youth unemployment and bad health), Studentlitteratur, Lund.
Heckman, J.J., and B. Singer (1985), �Social science duration analysis� in Longitudinal Analysis of Labor Market Data, ed J.J. Heckman and B. Singer, New York: Cambridge University Press, 39-110.
Johansson, P., and K. Brännäs (1998), A household model for work absence, Applied Economics 30, 1493-1503
Johansson, P., and M. Palme (1996), Do economic incentives affect worker absence? Empirical Evidence Using Swedish Data. Journal of Public Economics 59, 195-218.
Johnson, W.G., and Jan Ondrich (1990), The duration of post-injury absences from work, Review of Economics and Statistics 72, 578-86.
Knutsson, A., and H. Goine (1998), Occupation and unemployment rates as predictors of long term sickness absence in two Swedish counties, Social Science & Medicine 47: 25-31.
Lidwall, U. (1997) �Friskskrivning, förtidspensionering och sammansatta riskfaktorer� in Risk- och friskfaktorer −sjukskrivning och rehabilitering i Sverige (Sickness absenteeism and vocational rehabilitation in Sweden), ed. S. Marklund, RFV Redovisar 1997:6.
Lidwall, U., and P. Skogman Thoursie (2000), Sjukfrånvaro och förtidspension: en beskrivning och analys av utvecklingen under de senaste decennierna (Sickness absence and disability pension in Sweden during the last decades), RFV Analyserar 2002:2.
Marklund, S. (1995), �Vilka blir långtidssjuka?� in Rehabilitering i ett samhällsperspektiv (Rehabilitation from a social perspective), ed. S. Marklund, Studentlitteratur, Lund.
Marklund, S., and U. Lidwall (1997), �Vilka blir långtidssjukskrivna?� in Risk- och friskfaktorer −sjukskrivning och rehabilitering i Sverige, (Sickness absenteeism and vocational rehabilitation in Sweden), ed. S. Marklund, RFV Redovisar 1997:6.
Marnetoft S-U, J. Selander, A. Bergroth, and J. Ekholm (1996) Arbetslösa sjukskrivna �en jämförande studie av rehabiliteringsprocessen och betingelserna för rehabilitering av arbetslösa sjukskrivna och anställda sjukskrivna i Stockholm, Centrum för socialförsäkringsforskning, Mitthögskolan i Östersund, Rapport 1996:5.
National Social Insurance Board (1993), Social insurance statistics. FACTS 1992. National Social Insurance Board (1995), Social Insurance Facts 1995. National Social Insurance Board (1996), Social Insurance Facts 1996.

31
National Social Insurance Board (1997), Social Insurance Facts 1997. National Social Insurance Board (1998), Social Insurance Facts 1998. National Social Insurance Board (1999), Social Insurance in Sweden 1999. National Social Insurance Board (2000), Social Insurance- Annual Review of
Budget Year 1999. Paringer, L. (1983), Women and absenteeism: health or economics? American
Economic Review 73, 123-27. Selander, J., S-U Marnetoft, A. Bergroth, and J. Ekholm (1996a), Arbetslösa
sjukskrivna � en jämförande studie av arbetslösa sjukskrivna och anställda sjukskrivna i Stockholm, Centrum för socialförsäkringsforskning. Mitthögskolan i Östersund, Rapport 1996:6.
Selander, J., S-U Marnetoft, A. Bergroth, and J. Ekholm (1996b), Arbetslösa sjukskrivna � en jämförande studie av arbetslösa sjukskrivna och anställda sjukskrivna i Jämtlands glesbygd. Centrum för socialförsäkringsforskning. Mitthögskolan i Östersund, Rapport 1996:7.
Scot, K.D., and Markham, S. (1982), Absenteeism control methods: A survey of practices and results,. Personnel Administrator 27, 73-84.
Scott, K. D., Markham, S., and Roberts, R. Rewarding (1985), Good Attendance: A comparative study of positive ways to reduce absenteeism, Personnel Administrator 30, 71-85.
Youngblood, S.A. (1984), Work, non-work and withdrawal, Journal of Applied Psychology 49, 106-17.
Van den Berg, G.J. (2000), Duration models: specification, identification, and multiple durations Forthcoming in: James J. Heckman and Edward Leamer, editors, Handbook of Econometrics, Volume V (North-Holland, Amsterdam), to appear in 2001.
Winkler, D.R. (1980), The effects of sick-leave policy on teacher absenteeism, Industrial and Labor Relations Review 33, 232-40.

32
Appendix
Table A1 Employed part-time (in 100), by gender and age groups.
Age-groups 16-19 20-24 25-34 35-44 45-54 55-59 60-64 TotalWomen
1987 570 680 2120 2790 1836 839 677 95121988 552 669 2105 2700 1835 813 688 93621989 578 634 2080 2700 1839 780 650 92611990 581 599 2099 2582 1907 765 685 92181991 558 585 2028 2521 2004 742 699 91371992 469 577 1920 2420 2011 732 701 88301993 385 585 1830 2312 1971 727 636 84461994 354 680 1811 2231 1921 735 555 82871995 389 690 1804 2166 1915 727 573 82641996 354 684 1741 2079 1867 741 546 80121997 343 664 1663 2089 1830 762 485 78361998 383 664 1677 2010 1795 783 455 77671999 425 637 1632 1990 1783 763 470 7700
Men 1987 271 167 240 174 141 64 271 13281988 283 177 219 187 136 79 336 14171989 320 186 237 201 120 83 360 15071990 339 164 263 215 128 95 329 15331991 309 175 264 194 138 86 348 15141992 253 190 273 190 153 105 367 15311993 206 204 276 207 175 90 377 15351994 212 234 307 231 196 101 348 16291995 203 244 307 218 207 116 313 16081996 214 251 320 213 214 119 275 16061997 213 271 317 240 230 116 205 15921998 233 264 297 263 239 129 173 15981999 267 297 332 241 231 139 179 1686
Source: Statistics Sweden, Anställda (AKU) efter kön, ålder, hel/deltid och veckoarbetstid. År 1987-1999
Table A2 Test of equality over strata
Test Chi-Square DF Log-Rank 12.05 2 Wilcoxon 24.70 2 -2Log(LR) 4.69 2 Note: Bold =significant at less than 1%, and underline = significant at the 10% level.

33
Table A3 Estimates for region dummies (control = Göteborg)
Individuals (J =2666)
Diagnoses (J =346)
Region Estimate Std. Error Hazard ratio Estimate Std. Error Hazard ratio Blekinge -0.01 0.18 0.99 -0.01 0.14 0.99 Bohuslän -0.30 0.15 0.74 -0.29 0.11 0.75 Gotland 0.21 0.25 1.24 0.18 0.19 1.20 Gävleborg -0.12 0.14 0.89 -0.14 0.11 0.87 Halland 0.02 0.17 1.02 -0.05 0.13 0.95 Jämtland 0.04 0.17 1.04 -0.01 0.14 0.99 Jönköping -0.03 0.15 0.97 -0.06 0.12 0.94 Kalmar 0.05 0.15 1.05 0.01 0.12 1.01 Kopparberg -0.03 0.15 0.97 -0.04 0.11 0.96 Kristianstad 0.13 0.14 1.14 0.15 0.11 1.16 Kronoberg 0.36 0.19 1.43 0.25 0.15 1.29 Malmöhus 0.07 0.13 1.08 0.01 0.10 1.01 Norrbotten 0.13 0.14 1.14 0.07 0.11 1.07 Skaraborg 0.29 0.17 1.34 0.19 0.13 1.21 Stockholm 0.05 0.12 1.05 0.00 0.09 1.00 Södermanland -0.11 0.16 0.90 -0.14 0.12 0.87 Uppsala -0.06 0.15 0.94 -0.10 0.12 0.91 Värmland 0.35 0.14 1.41 0.27 0.11 1.31 Västerbotten -0.05 0.15 0.95 -0.05 0.12 0.95 Västernorrland -0.18 0.15 0.83 -0.12 0.12 0.89 Västmanland -0.17 0.14 0.84 -0.16 0.11 0.86 Älvsborg 0.06 0.14 1.06 0.05 0.11 1.05 Örebro 0.03 0.15 1.03 0.00 0.12 1.00 Östergötland -0.08 0.14 0.92 -0.09 0.11 0.91

34
Värmlands län
GÖTEBORGS OCH BOHUS LÄN
KRONEBERGS LÄN
Figure A1 The hazard of ending sickness of Sweden�s administrative regions, compared to Göteborg, 1986-1991.
Göteborg
a higher hazard of exitfrom LT sickness thanGöteborg;
a lower hazard of exit LT sickness than Göteborg; Note: the light-shadedregions were reorganizedduring 1990s.