Embed Size (px)
Citation preview

2727Technology and Applications Center
Newport Corporation
APPLICATION NOTE
Long Scan Autocorrelator

1. Introduction
Direct measurements of laser pulses less than 20ps usingphoto detectors remain a challenge. The response time ofhigh-speed photodiodes is currently limited to around 20picoseconds; moreover, large bandwidth oscilloscopes(>60 GHz) required to accurately measure the output ofthese detectors are quite expensive.
Several indirect methods for measuring ultrashort pulseshave been developed. Detailed reviews can be found in,“Frequency-Resolved Optical Gating: The Measurement ofUltrashort Laser Pulses,” by Rick Trebino, KluwerAcademic Publishers, Boston, 2002, and “Ultrashort LaserPulse Phenomena,” by Jean Claude Diels and WolfgangRudolph, Academic Press, New York, 1995. When phaseinformation of the pulse is not required, autocorrelation isthe simplest and most affordable method for determiningpulse width.
Dichroic Filter
Detector Iris Nonlinear Crystal Lens
E (t)
Variable Arm
Actuator
Beamsplitter
Fixed Arm
E (t)[E(t)+E(t+τ)]2
∫I(t)I(t+τ)dt E (t+τ)
E(t)2 + [2E(t)E(t+τ)] + E(t+τ)2
Figure 1.1 Schematic of the autocorrelator
Figure 1.1 illustrates a typical autocorrelator setup. Theprinciple of operation is based on recording the secondorder correlation function using a MichelsonInterferometer. An incoming pulse with electric field E(t),is first split into two replicas by means of a beamsplitter.The two replicas are sent down two independent delaylines, one variable and one fixed, in order to generate atime delay, τ, between the two replicas. The two replicas,E(t) and E(t+τ), are next recombined in a nonlinearcrystal. Under proper phase matching conditions asecond harmonic signal is generated in the crystal. Thetotal intensity of the second harmonic signal ISH, isproportional to,
[ ] 2)()(~)( ττ +++ tEtEtI SH
[ ] 22 )()()(2)(~)( τττ +++++ tEtEtEtEtI SH
[ ])()(2~)( ττ ++ tEtEtI SH
[ ]∫ + dttEtEI AC2)()(2~)( ττ
∫ + dttItII AC )()(~)( ττ
(1)
(2)
(3)
(4)
(5)
Unfolding the square of equation 1,
illustrates that there is a component of the secondharmonic, , that is due solely to the temporaloverlap of the two pulses (i.e. this component of thesignal will only be present when the two pulses areoverlapping in time). In the case that the two beams enterthe crystal in a noncollinear geometry as shown in Figure1.1, and when the phase matching conditions are satisfied
only for the two beam contribution, equation (2)simplifies to,
[ ])()(2~)( ττ ++ tEtEtI SH
The iris positioned after the doubling crystal blocks thetwo initial replica beams, and the middle secondharmonic beam is sent to a detector. On top of convertingthe second harmonic to an electrical signal, the detectorserves to square the incident field as well as integrate overthe duration of the femtosecond pulse, t. Now, theamplitude of the photo detector signal, IAC, isproportional to,
which, by relating the square of the electric field tointensity can be expressed as,
This represents the intensity autocorrelation of the laserpulse. It is proportional to the intensity of the tworeplicas. Equation 5 is formally a correlation integral andillustrates that the autocorrelation does not actuallymeasure the pulse width directly, but a correlationfunction of pulse of the two replicas. If indeed the tworeplicas are identical, then equation 5 can be solvedanalytically and the pulse width can be determined simplyby dividing the autocorrelation signal width by a constantfactor that depends on the profile of the pulse (note thatthe autocorrelation width is always greater than the widthof the actual pulse). Table 1.1 lists the parameters for twocommon pulse profiles, Gaussian and hyperbolic secantsquared.
Gaussian Pulse exp[-In(2)*(2τ /∆τ)2] exp[-In(2)*(2 t/∆t)2]
∆τ /∆t
sech2(1.76275t/∆t)3[(cτ/∆τ)*coth(cτ/∆τ)-1]/[sinh2(cτ/∆τ)]
IAC(τ)=
Hyberbolic Secantc=2.7196
I(t)=
1.41
1.54Squared Pulse1
Table 1 Parameters for Two Common Pulse Profiles
There are several commercially available autocorrelators onthe market, including Newport’s PulseScoutTM
(www.newport.com/pulsescout). They are usuallydesigned to measure pulses from a few femtoseconds toseveral picoseconds in duration within a limitedwavelength range. Very often, however, there is a need inresearch labs to combine the capabilities of measuringvery short pulses in the range of tens of femtosecondswith the capability of measuring long pulses on the orderof tens of picoseconds with femtosecond resolutions. Atypical example is the stretching of a femtosecond pulseto many picoseconds for experiments where largebandwidths are required. In many cases these
2
1Rick Trebino, Frequency-Resolved Optical Gating: The Measurement of Ultrashort Laser Pulses
(Boston: Kluwer Academic Publishers, 2002)

3
measurements are performed within a broad range ofwavelengths covering tuning curves of lasers, OPAs andOPOs. More than just measuring ultrashort pulses,autocorrelators can also be used to detect signals in timeregions relatively inaccessible by most detectors.
The autocorrelator kit described in this note provides asimple and cost effective solution for measuring pulsewidths of various ultrafast lasers with wavelength in the480 nm-2000 nm spectral range. It has 25 mm of travelcorresponding to a total time delay of greater than 160 pswith 25 fs resolution. This makes it a valuable tool forinvestigating sidebands and satellites of laser pulses,which may contain significant amounts of the total pulseenergy and interfere with complex time-domain signalsassociated with pump-probe experiments. In contrast tothe commercially available autocorrelators, which haveclear apertures of a few millimeters, the long scanautocorrelator described in this note is suitable for beamsizes of up to 10mm. The dynamic range of the detectionsystem allows contrast measurements up to 7000:1.
2. Building the Assemblies
WARNING-Radiation emitted by laser devices can bedangerous to the eyes and appropriate precautions mustbe taken when they are in use. Only individuals who areadequately trained in proper laser use and safetyprocedures should operate the laser devices describedherein.
Detailed diagrams for building subassemblies of the longscan autocorrelator are presented in the Appendix. Whenbuilding Delay Line 1 (Assembly 1), the silver mirrorsshould be glued to the mirror mounts using epoxy glue(not included). Make sure that the two mirrors arepositioned at a 90° angle with respect to each other and ata 45° angle with respect to the plane of the optical table.This is the correct orientation for the mirrors if the laserbeam is horizontally polarized. (If the laser is polarized inthe vertical direction, a l/2 wave-plate should be used torotate the polarization). This assembly is meant toprovide a vertical displacement to the incoming beam.When aligned correctly, the direction of the outgoingbeam will be independent of stage position.
When short pulses are measured and the typical delaytimes are within a few hundred femtoseconds, then rapidscanning and quick updates of the autocorrelation tracecan be achieved. In that case the computer controlledmotorized actuator should be installed on the Delay Line2 (see Appendix, Assembly 2; Fig. 1. 1, variable arm). Whentens of picoseconds of delays are required, the actuatorshould be installed on the Delay Line 1 (see Appendix,Assembly 1; Fig. 1. 1, fixed arm).
As an option, the kit can be made portable, by assemblingit on a base plate.
3. Routing the Beam
Prior to building the autocorrelator, the beam must berouted from the laser to the location of the autocorrelator.This should be done through the use of two routingmirrors. Figure 3.1 provides an illustrative example of atypical amplified femtosecond setup for experiments innonlinear spectroscopy. A possible layout for placing theautocorrelator (AC) and routing the beam of a Ti:Sapphirelaser or OPA into the AC, is shown.
Spitfire Pro
AC
AC
AC
OPA OPA
Experiment
Tsunami Millennia
Empo
wer
Figure. 3.1 Typical experimental setup for ultrafast nonlinear spectroscopy
The first mirror/beam sampler should be positioned suchthat the beam exiting the laser is centered on it. Thismirror should then be adjusted such that the reflectedbeam is centered on the second mirror. The height of thesecond mirror should be chosen carefully since it definesthe height of the beam throughout the autocorrelator.
4. Assembling the Autocorrelator
At this point, it is useful to construct an alignment toolusing the parts from the Iris Assembly. The Iris Assemblyshould be aligned such that the beam is centered in themiddle of the iris immediately after the second routingmirror as illustrated in Figure 4.1.
Using the hole pattern on the optical table as a guide, theiris should be moved in a straight line far from the 2ndrouting mirror as shown in Figure 4.2. Using the tip/tiltadjustment on the 2nd routing mirror, center the beam onthe iris.
Figure 4.1 The laser beam shouldbe centered in the middle of the iris
Figure 4.2 The iris should then bemoved away from the 2nd routingmirror

Repeat this procedure iteratively until the beam travelsparallel to the hole pattern of the table.
Position the Delay Line 1 Assembly at least 200 mm behind routing mirror 2 such that the beam iscentered on both mirrors (see Figure 4.3). Using the tworouting mirrors, ensure that the beam is traveling at aconstant height and parallel to the axis of motion of thestage. The beam should hit the center of the top mirrorand be reflected from the center of the bottom mirror. Thebeam exiting the delay line should travel parallel to theincoming beam with a vertical displacement ofapproximately 25 mm as show in Figure 4.4. The exitingbeam should not translate with position of the stage.
Insert Delay Line 2 approximately 115 mm behind theBeamsplitter Assembly. Using the tip/tilt adjustments onthe mirror mount, ensure that this beam travels back onitself. After the beamsplitter, verify that the two beamscorresponding to the two arms of the autocorrelator aredisplaced vertically by approximately 25 mm and aretraveling parallel to each other as well as to the table.
Insert the Focusing Assembly approximately 50 mm afterthe beamsplitter. Adjust the position of the lens such thatthe two beams are centered vertically and balancedhorizontally. The two beams should overlap in tight focusapproximately 200 mm behind the lens. If the two beamsdo not overlap in tight focus, use the tip/tilt adjustmenton the Delay Line 2 mirror to overlap them.
Insert the Crystal Assembly approximately 200 mm after the lens at the intersection of the twobeams. Make sure that the principle plane of the crystalis oriented at 90 degrees with respect to the polarizationplane of the incoming beam. Place the dichroic filterimmediately after the crystal. Using a sheet of white paper,rotate the crystal until the second harmonic of one of thetwo beams becomes visible on the paper (note the angle).Continue rotating the crystal until the second harmonic ofthe second beam becomes visible (note the angle). Thephase-matching angle for two beam second harmonic isthe half point between these two angles. Set the crystalangle to this half point.
Scan the two delay lines until a time dependent secondharmonic signal can be observed between the two beams.This is a delicate procedure, which may involve severaliterations of overlapping the two beams spatially in thecrystal followed by scanning the two delay lines. Once thetwo beam second harmonic is found, aperture it with theIris Assembly such that no additional contribution fromthe single beam second harmonic is passing through theiris. Place the detector head as close to the iris aspossible. Center the second harmonic on the detectorhead. When completed, the autocorrelator shouldresemble that shown in Figure 4.7.
Figure 4.3 Center the beam onboth mirrors
Figure 4.4 The beamexiting the delay lineshould travel parallelto the incoming beam
WARNING-Power densities greater than 1W/cm2 willresult in catastrophic damage to the beamsplitter. Caremust be taken to attenuate the beam if necessary.
Insert the Beamsplitter Assembly between routing mirror2 and Delay Line 1 as shown in Figure 4.5. The center ofthe beamsplitter should be approximately 100 mm from the edge of the stage and the beam shouldbe centered vertically on the beamsplitter approximately1 cm from the top. Using the tip/tilt adjustments on theBeamsplitter Assembly, ensure that the reflected beamtravels at constant height and is completelyperpendicular to the axis of motion of Delay Line 1 asshown in Figure 4.6. Use the procedure described aboveutilizing the Iris Assembly as a target.
Figure 4.5 The beamsplitter isinserted between the 2nd routingmirror and the 1st delay line
Figure 4.6 The reflected beam should travel at a constant height and be perpendicular to the axis ofmotion of the 1st delay line
Figure 4.7 Fully configured long scan autocorrelator
4
5
5. Detection and Data Acquisition
Detection is based on Newport’s 1935-C series powermeter with 918D-UV-OD3 photodiode head. The dataacquisition and analysis is accomplished throughLabView based software provided with this kit. You canalso request a copy by e-mailing [email protected];please reference Application Note 27.
Make sure the detector head is attached to the powermeter and turn the power meter on. Block the beam andzero the power meter. Unblock the beam and optimize thepower of the second harmonic using the micrometer onDelay Line 1 and the tip/tilt adjustment on the mirrormount of Delay Line 2. The minimum SH powerrequirement for the autocorrelator to operate is 1 nanowatt. If the average power of the second harmonicis less than 1 nanowatt, a photomultiplier will berequired.
Once the two beam signal is aligned on the detector andthe power is optimized, set the range to manual andconnect the power meter to the computer through theUSB port. If faster data acquisition rates are required, theanalog output of the power meter along with a fast D/Aconverter should be utilized. Provided software will workfor data transfer through USB only. Connect themotorized actuator on Delay Line 2 to the SMC100CCController shown in Figure 4.7 immediately above thecrystal assembly. Connect the SMC100CC Controller tothe computer using the RS232 cable provided. Install theSMC100CC software that comes with the controller andthe SMC Autocorrelation Software included in the kit, andreboot the computer. Run the SMC program from thePrograms folder under the Start Menu. Make sure theactuator is properly configured and then send the actuatorto the home position. The home position corresponds tothe actuator fully retracted. Now command the actuatorback to its original position such that the secondharmonic signal is again optimized on the detector; notethis offset value. Close the SMC200 program.
Open the SMC Autocorrelation Software (Figure 5.1) andset the home to the offset value determined above. Setthe acceleration and velocity using the sidebars and entera desired delay. Press the start switch. Congratulations,you are now autocorrelating!
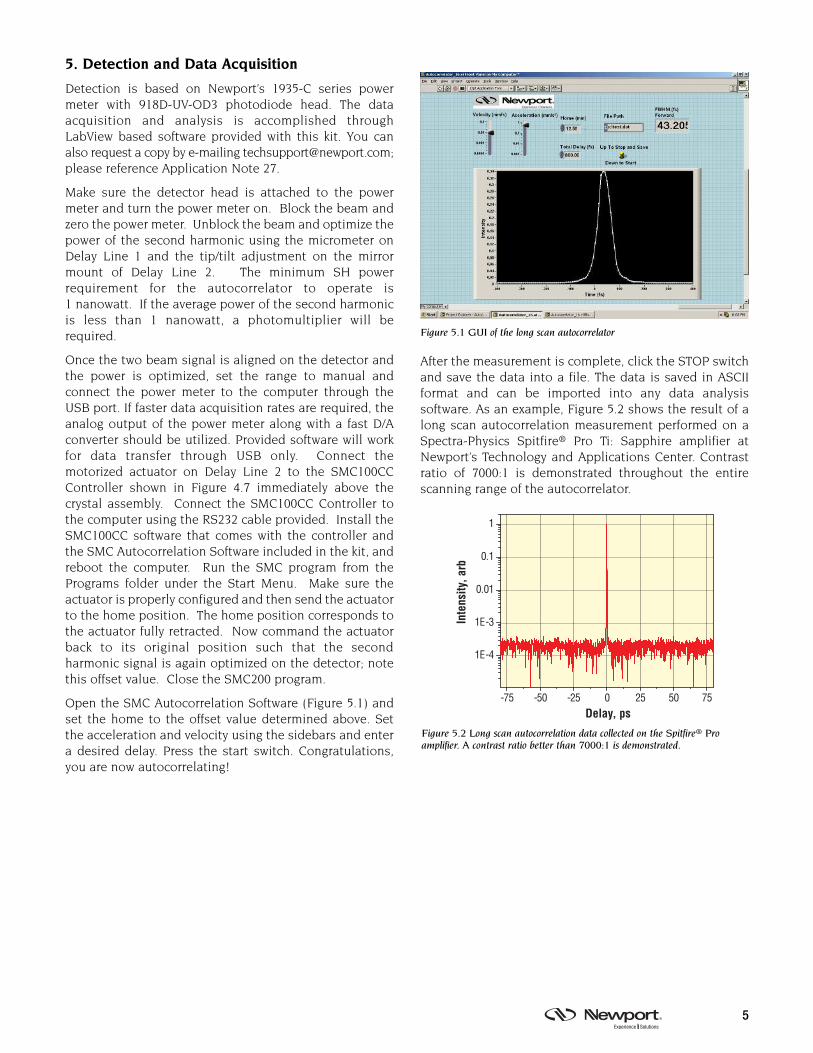
After the measurement is complete, click the STOP switchand save the data into a file. The data is saved in ASCIIformat and can be imported into any data analysissoftware. As an example, Figure 5.2 shows the result of along scan autocorrelation measurement performed on aSpectra-Physics Spitfire® Pro Ti: Sapphire amplifier atNewport’s Technology and Applications Center. Contrastratio of 7000:1 is demonstrated throughout the entirescanning range of the autocorrelator.
Figure 5.1 GUI of the long scan autocorrelator
-75 -50 -25 0 25 50 75
1E-4
1E-3
0.01
0.1
1
Delay, ps
Inte
nsity
,arb
Figure 5.2 Long scan autocorrelation data collected on the Spitfire® Proamplifier. A contrast ratio better than 7000:1 is demonstrated.

Appendix: Diagrams of Assemblies and Parts List
Assembly 1
Delay Line 1
1. Translation Stage: 1 x 426
2. Micrometer: 1 x SM-25
3. Mirror: 2 x 10SD520ER.2
4. Mirror Mount: 2 x P100-P
5. Mounting Post: 2 x SP-1
6. Bracket: 2 x CA-1
7. Post: 1 x SP-4
8. Post Holder: 2 x VPH-X-P
9. Clamp: 2 x PS-F
Assembly 2
Delay Line 2
1. Translation Stage: 1 x 426
2. Micrometer: 1 x CMA-25CCCL
3. Motion Controller: 1 x SMC100CC(not shown)
4. Mirror: 1 x 10D10ER.2
5. Mirror Mount: 1 x P100A-A
6. Post: 1 x SP-X
7. Post Holder: 1 x VPH-X-P
8. Clamp: 1 x PS-F
9. Misc: 1 x RS232 Cable
Assembly 3
Beamsplitter
1. Beamsplitter: 1 x PBS-2C
2. Mount: 1 x U300-A2K
3. Post: 1 x SP-X
4. Post Holder: 1 x VPH-X-P
5. Clamp: 1 x PS-F (not shown)
Assembly 4
Focusing Lens
1. Lens: 1 x KPX199
2. Mount: 1 xLH-2
3. Post: 1 x SP-X
4. Post Holder: 1 x VPH-X-P
5. Clamp: 1 x PS-F (not shown)
Assembly 5
Nonlinear Crystal
1. Crystal: 1 x 5mm x 5mm x 0.2mm BBO,
Type 1, u =48° for480nm-700nm,or u =29° for 700nm-2000nm
2. Crystal Mount: 1 inch diameter
3. Mount: 1 x LH-1
4. Rotation Stage: 1 x RS65
5. Actuator 1x SM13
6. Post: 1 x SP-X
7. Post Holder: 1 x VPH-X-P
8. Clamp: 1 x PS-F (not shown)
6

7
Parts ListDescription Quantity Newport Part Number
1. Delay Line 1 Assembly
Translation Stage: 1 426
Micrometer: 1 SM-25
Mirror: 2 10SD520ER.2
Mirror Mount: 2 P100-P
Mounting Post: 2 SP-1
Bracket: 2 CA-1
Post: 1 SP-4
Post Holder: 2 VPH-3-P
Clamp: 2 PS-F
2. Delay Line 2 Assembly
RS-232 Cable 1 Not included
Translation Stage: 1 426
Micrometer: 1 CMA-25CCCL
Motion Control: 1 SMC100CC
Mirror: 1 10D10ER.2
Mirror Mount: 1 P100A-A
Post: 1 SP-3
Post Holder: 1 VPH-3-P
Clamp: 1 PS-F
3. Beamsplitter Assembly
Beamsplitter: 1 PBS-2C
Mount: 1 U300-A2K
Post: 1 SP-3
Post Holder: 1 VPH-3-P
Clamp: 1 PS-F
4. Focusing Assembly
Lens: 1 KPX199
Mount: 1 LH-2
Post: 1 SP-3
Post Holder: 1 VPH-3-P
Clamp: 1 PS-F
5. Nonlinear Crystal Assembly
Crystal:
5mm x 5mmx 0.2mm BBO 1 Purchased outside Newport
Type 1,u=480 for (Not included)
480nm-700nm, Suggested suppliers:
or u=290 for Casix, EKSPLA
700nm-2000nm,
mounted for 1” holder
Mount: 1 LH-1
Rotation Stage: 1 RS65
Actuator 1 SM-13
Post: 1 SP-3
Post Holder: 1 VPH-3-P
Clamp: 1 PS-F
Description Quantity Newport Part Number
6. Detector Assembly
Power Meter: 1 1935-C
Detector: 1 918D-UV-OD3
Filter: (Choice of filter will depend on wavelength)
UV-Blue Bandpass: 1 FSR-BG3
Heat Absorbing: 1 FSR-KG5
UV Bandpass: 1 FSR-UG11
Mount: 1 LH-1
Post: 2 SP-3
Post Holder: 2 VPH-3-P
Clamp: 2 PS-F
7. Iris Assembly
Iris 1 ID-1.5
Post: 1 SP-3
Post Holder: 1 VPH-3-P
8. Routing Assembly
Mirror: 2 10D10ER.2
Mirror Mount: 2 P100A-A
Post: 2 SP-3
Post Holder: 2 VPH-3-P
Clamp: 2 PS-F
9. Aluminum plate
(optional) 1 SA-22
SP-3 Posts with VPH-3-P VPH-1-P, VPH-2-P, Post Holders will cover VPH-3-P, VPH-4-Poptical axis heights of SP-1, SP-2, SP-3, SP-43.75” - 6.5”. For optical heights outside this range, substitute shorter or longer sets of posts and post holders.

Visit Newport Online at: www.newport.com
Newport Corporation, Irvine, California, hasbeen certified compliant with ISO 9001 bythe British Standards Institution. DS-09065
Newport Corporation
Worldwide Headquarters1791 Deere Avenue
Irvine, CA 92606
(In U.S.): 800-222-6440Tel: 949-863-3144Fax: 949-253-1680
Internet: [email protected]
Copyright ©2006 Newport Corporation. All Rights Reserved.
This Application Note has been prepared based on development activities and experiments conducted in Newport’s Technologyand Applications Center and the results associated therewith. Actual results may vary based on laboratory environment and setupconditions and the type and condition of actual components and instruments used and user skills.
Nothing contained in this Application Note shall constitute any representation or warranty by Newport, express or implied, regarding the information contained herein or the products or software described herein. Any and all representations, warranties and obligations of Newport with respect to its products and software shall be as set forth in Newport’s terms and conditions of sale in effect at the time of sale or license of such products or software. Newport shall not be liable for any costs, damages and expenses whatsoever (including, without limitation, incidental, special and consequential damages) resulting fromany use of or reliance on the information contained herein, whether based on warranty, contract, tort or any other legal theory, andwhether or not Newport has been advised of the possibility of such damages.
Newport does not guarantee the availability of any products or software and reserves the right to discontinue or modify its products and software at any time. Users of the products or software described herein should refer to the User’s Manual and otherdocumentation accompanying such products or software at the time of sale or license for more detailed information regarding thehandling, operation and use of such products or software, including but not limited to important safety precautions.
This Application Note shall not be copied, reproduced, distributed or published, in whole or in part, without the prior written consent of Newport Corporation.


![Linear and nonlinear shaping of ultrashort optical pulses.scienze-como.uninsubria.it/phil/Doctorate/english/verifiche/... · Linear and nonlinear shaping of ultrashort optical pulses.]](https://img.pdfslide.us/doc/110x75/5e7c137d259a9a2cd039068a/linear-and-nonlinear-shaping-of-ultrashort-optical-linear-and-nonlinear-shaping.jpg)