Embed Size (px)
Citation preview
DI
SC
US
SI
ON
P
AP
ER
S
ER
IE
S
Forschungsinstitut zur Zukunft der ArbeitInstitute for the Study of Labor
Long-Run Effects of Gestation During the Dutch Hunger Winter Famine on Labor Market andHospitalization Outcomes
IZA DP No. 6307
January 2012
Robert S. ScholteGerard J. van den BergMaarten Lindeboom
Long-Run Effects of Gestation During the
Dutch Hunger Winter Famine on Labor Market and Hospitalization Outcomes
Robert S. Scholte
VU University Amsterdam, Tinbergen Institute and Netspar
Gerard J. van den Berg
University of Mannheim, IFAU-Uppsala, VU University Amsterdam and IZA
Maarten Lindeboom
VU University Amsterdam, Tinbergen Institute, Netspar, HEB Bergen and IZA
Discussion Paper No. 6307 January 2012
IZA
P.O. Box 7240 53072 Bonn
Germany
Phone: +49-228-3894-0 Fax: +49-228-3894-180
E-mail: [email protected]
Any opinions expressed here are those of the author(s) and not those of IZA. Research published in this series may include views on policy, but the institute itself takes no institutional policy positions. The Institute for the Study of Labor (IZA) in Bonn is a local and virtual international research center and a place of communication between science, politics and business. IZA is an independent nonprofit organization supported by Deutsche Post Foundation. The center is associated with the University of Bonn and offers a stimulating research environment through its international network, workshops and conferences, data service, project support, research visits and doctoral program. IZA engages in (i) original and internationally competitive research in all fields of labor economics, (ii) development of policy concepts, and (iii) dissemination of research results and concepts to the interested public. IZA Discussion Papers often represent preliminary work and are circulated to encourage discussion. Citation of such a paper should account for its provisional character. A revised version may be available directly from the author.
IZA Discussion Paper No. 6307 January 2012
ABSTRACT
Long-Run Effects of Gestation During the Dutch Hunger Winter Famine on Labor Market and Hospitalization Outcomes*
The Dutch Hunger Winter (1944/45) is the most-studied famine in the literature on long-run effects of malnutrition in utero. Its temporal and spatial demarcations are clear, it was severe, it was not anticipated, and nutritional conditions in society were favorable and stable before and after the famine. This is the first study to analyze effects of in utero exposure on labor market outcomes and hospitalization, and the first to use register data covering the full Dutch population to examine long-run effects of this famine. We provide results of famine exposure by sub-interval of gestation. We find a significantly negative effect of exposure during the first trimester of gestation on employment outcomes 53 or more years after birth. Hospitalization rates in the years before retirement are higher after middle or late gestational exposure. JEL Classification: I10, I12, J01, J10, J13, J24 Keywords: nutrition, ageing, developmental origins, morbidity, income, health, employment Corresponding author: Gerard J. van den Berg Department of Economics University of Mannheim L7, 3-5 68131 Mannheim Germany E-mail: [email protected]
* We thank Bertie Lumey, Hendrik Juerges, Aliaksandr Amialchuk, Rob Euwals, Rob Alessie, Felix Weinhardt and participants at presentations in the TI and VU Amsterdam, Mannheim, Tilburg, Naples, Louvain, Autonoma, Buch am Ammersee, and Netspar Pension Day, ASHE, EEA, SMYE and iHEA Toronto conferences, for useful comments. Thanks to Netspar for financial support and to Statistics Netherlands for the use of the micro data registers, including those of the municipality of birth.
1 Introduction
The Dutch Hunger Winter famine (December 1944-April 1945) is by far the most- stud-
ied famine in the epidemiological literature on long-run effects of in utero malnutrition
(see Lumey, Stein and Susser, 2011, for an excellent survey). The reason for this is that
this famine is uniquely suited as an instrument to assess the presence of such causal
long-run effects. As has been well-documented (see Section 2), it is sharply defined
in time and space, it was severe, it was not anticipated, it was embedded within an
era with affluent nutritional conditions, and it occurred in a society with reliable data
registration.
By now, long-run effects of exposure to the Dutch Hunger Winter famine have been
found for a number of health outcomes later in life (see again Lumey, Stein and Susser,
2011). These results contribute to the overwhelming evidence on long-run health effects
of early-life conditions in general (see e.g. the overviews in Pollitt, Rose and Kaufman,
2005, Barker, 2007, and Lawlor, 2008). These effects are typically explained by refer-
ence to Barker’s fetal origins or fetal programming hypothesis (see e.g. Barker, 1994).
In particular, effects of fetal undernutrition on metabolic adaptation in utero may affect
the phenotype such that the risk of diseases later in life is increased (Hales and Barker,
1992, Bateson, 2001, Gluckman and Hanson, 2004), notably cardiovascular diseases,
diabetes and hypertension. Underlying this model is the idea that several critical pe-
riods in utero influence the development of humans. During these periods, developing
systems modify their settings in response to social and biological cues (Kuzawa and
Quinn, 2009). This includes durable epigenetic changes that modify gene expressions.
Of course, severely adverse nutritional conditions may also directly affect the build-up
of organs and other body parts. All these biological causal pathways may potentially
be influenced by events and decisions throughout life.
This paper is the first study to analyze effects of in utero exposure to the Hunger
Winter famine on individual economic outcomes late in life. We consider three such
outcomes. Two of these (annual labor earnings and employment) are labor market
outcomes. The third, hospitalization, is an indicator of costly health care usage and as
such combines information on health with information on its costs. In fact, we examine
hospitalization occurrences by type of disease, notably for cardiovascular diseases and
for cancer. Studying long-run effects on labor market outcomes is informative on the
determinants of well-being of elderly workers and on the economic inequality among
them.1 Moreover, in the light of the current plans to increase the mandatory retirement
1Long-run effects of hunger early in life on late-life health and labor market outcomes are ofobvious relevance for developing countries. But in developed countries poor children may also facehunger spells, and households may rely on programs like the “Women, Infants and Children program”
2
ages across Europe, it is interesting to know to what extent the elderly can be expected
to remain productive at high ages or whether adverse conditions in utero on average
cause adverse economic conditions later in life. The Hunger Winter famine enables us
to address the latter while filtering out the effects of other systematic determinants of
late-life conditions.2
We connect our results to those in the literature on long-run health effects of con-
ditions in utero, and to those in the Hunger Winter famine literature in particular. To
shape thoughts, one could postulate the following chain of events: [ in utero exposure
to the famine ] → [ in utero malnutrition ] → [ adverse health later in life ] → [ adverse
economic outcomes later in life ]. This chain takes long-run health effects to translate
into effects on individual economic outcome variables. In particular, concerning the
third arrow, notice that adverse health outcomes may negatively affect productivity,
for example through cognitive ability or physical strength or through spells of sickness
absence, while productivity in turn affects labor market outcomes. It is also possible
that in utero malnutrition causes disadvantages in childhood, for example at school,
and this in itself may hurt economic and health outcomes later in life as well.
There are two additional reasons why our analysis is novel. First, we provide results
of famine exposure by sub-interval of gestation. This allows us to examine the presence
of critical periods in utero for economic outcomes late in life. Secondly, we are the first
to use register data covering the entire Dutch population to examine long-run effects
of this famine. These data contain the month and municipality of birth as well as the
above- mentioned economic outcomes.
The identification strategy exploits variation in the moment and place of birth.
Those exposed to the famine in utero may be compared to two “control groups”: those
born in the famine-stricken area before and/or after the famine, and those born in simi-
lar but non-stricken areas during the famine. We distinguish between famine exposures
by pregnancy trimester, and we assign trimester treatment statuses in accordance to
the epidemiological literature of the famine. As the famine mostly affected urban areas
in the Western part of the country, we restrict our sample to individuals born in cities.
We also restrict attention to males, which is in line with Stein et al. (1975) and takes
into account that only a small subpopulation of the females of this cohort is active in
the labor market at advanced ages.
for additional nutritional aid. This WIC-program provides aid to approximately 9.1 million individualsin the US in 2009 and has a budget of 6.9 billion dollars (see Food and Nutrition Service, 2009). Inaddition, qualitative hunger, i.e. lack of appropriate nutrients, may have adverse effects on the fetus.
2The existing evidence on the long-run socioeconomic effects of malnutrition early in life is ham-pered by methodological concerns and data limitations. Notably, independent variation in initial nu-trition and a sufficiently long observation window are required (see e.g. Van den Berg and Lindeboom,2012).
3
A few famine-based studies exist that focus on economic outcomes as well. Neelsen
and Stratmann (2011) use the Greek 1941-1942 famine to examine long-run effects on
economic outcomes at high ages. The other existing studies consider economic outcomes
at prime ages (up to 45) rather than high ages. Specifically, Almond et al. (2010), Chen
and Zhou (2007) and Meng and Qian (2009) use the Chinese 1959-1961 famine, while
Jurges (2011) relates the German 1945-1948 famine to outcomes in 1970 and 1987.
These studies provide important insights into long-run effects of major and prolonged
disruptive time periods in society (below we summarize results that are particularly
relevant for our purposes). However, the study of these famines also poses a number of
challenges in terms of empirical implementation. First, the famines are not as sharply
defined in time and space as the Dutch Hunger Winter famine. Therefore, it is harder
to distinguish between exposure in different intervals in gestation, and hence to identify
critical periods in utero. It is also more difficult to distinguish between exposure in utero
and exposure after birth. Secondly, these famines took place in less stable societies.
Notably, the Chinese famine was followed some years later by the so-called Cultural
Revolution (1966-1976). This potentially increases the risk of confounding and cohort
effects.3 Thirdly, the data are often less detailed. In many cases, the month of birth is
not observed, exacerbating the complications with exposure mapping. In some cases,
the birth place is not observed, and the city or area of residence in adulthood is used
as an indicator of location at birth. Fourthly, obviously, studies where the number of
years between famine and outcomes is less than 50 can not address long-run effects
and hence the connection to the epidemiological literature on long-run effects is more
complex. In terms of findings, the studies of the Chinese famine generally demonstrate
adverse effects on labor market status, wealth and marital outcomes. Jurges (2011)
finds effects on the level of education and on annual income, for a subset of the cohorts
born in the famine (namely, those whose gestation started in the first part of the first
winter in the famine). Neelsen and Stratmann (2011) do not find substantial effects of
exposure to the Greek famine.
The remainder of this paper is structured as follows. Section 2 describes the famine
and mentions epidemiological studies on health outcomes due to exposure to the famine.
Section 3 describes the data. Section 4 presents the estimation results. We also provide
a range of sensitivity analyses and we address the often-discussed issue that birth
cohorts of individuals exposed to a famine in utero may on average be less frail than
other birth cohorts, leading to possible selection biases. Section 5 discusses the results.
We relate them to the existing literatures on long-run effects of early-life conditions
and famines and on health effects by trimester of exposure to the Dutch Hunger Winter
3Long-run effects of reduced nutrition in utero are known to be stronger if the affected individualsare exposed to a much more favorable environment in childhood (Schulz, 2010).
4
famine. Finally, Section 6 concludes.
2 The Dutch Hunger Winter famine
2.1 Historical context
In the fall of 1944, towards the end of World War II, parts of the South of the Nether-
lands had been liberated by Allied forces, whereas the other parts were still occupied by
German forces. The London-based “Dutch government in exile” called out a railroad
strike in the occupied parts in order to support Allied military advances and in order
to display its authority over the nation. As a reaction, the occupying forces initiated an
embargo that prohibited food transports to the densely populated western part of the
country, i.e. the provinces of North and South Holland and Utrecht. The decision by
Allied Command to postpone the liberalization of the Netherlands and instead move
east towards the German mainland caused a military stalemate in the western part
of the Netherlands that lasted until the end of the war (European Theater) in May
1945. The effects of the food transport embargo were exacerbated by the early onset
of a harsh winter, the freezing of the waterways, the generally bad state of transport
infrastructure, and a naval trade blockade. As a result, the western part of the country
was closed-off from any imports of food, fuel, medication, etc. This caused a famine
in the western part that was particularly severe in the cities (Stein et al., 1975). The
situation lasted until the end of the occupation which coincided with the end of World
War II in Europe (early May 1945).
To study long-run effects, a famine must be an exogenous event with no long-run
impact apart from the effect running through household-specific nutritional conditions.
This prerequisite is more likely to apply if the famine is due to an external intervention
in society and if the famine is short and is not anticipated. From the above it follows
that the Dutch Hunger Winter famine satisfies these requirements.4
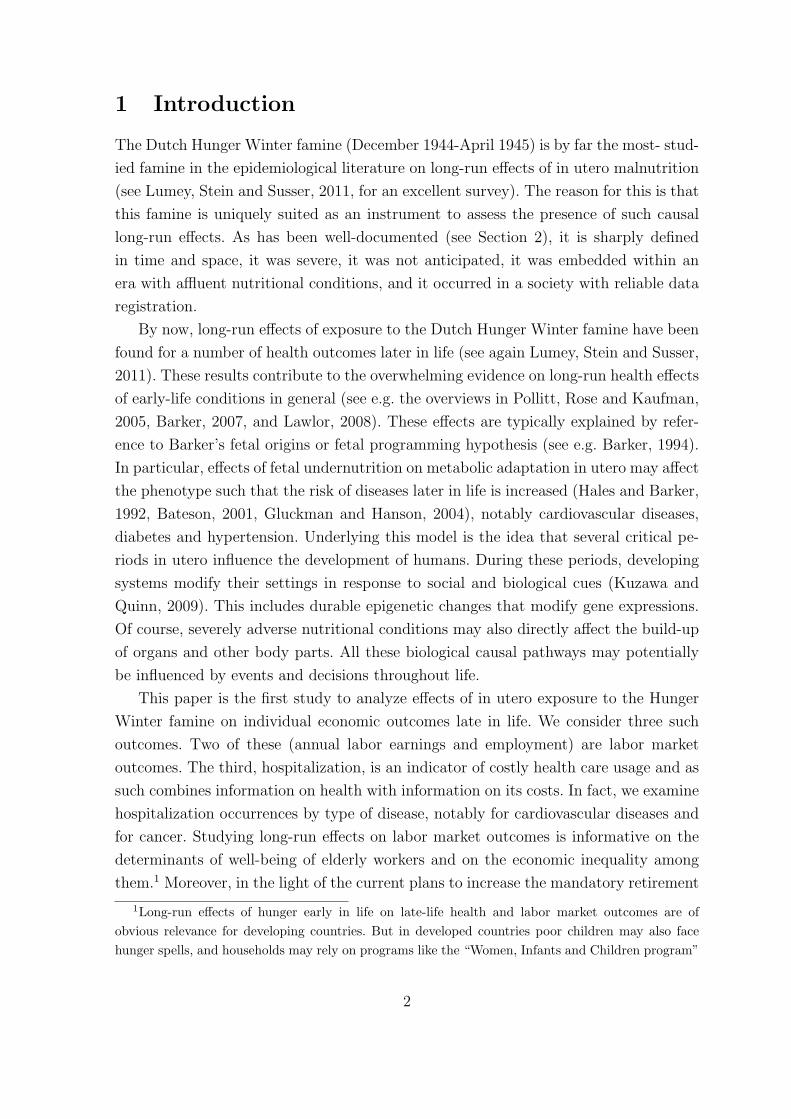
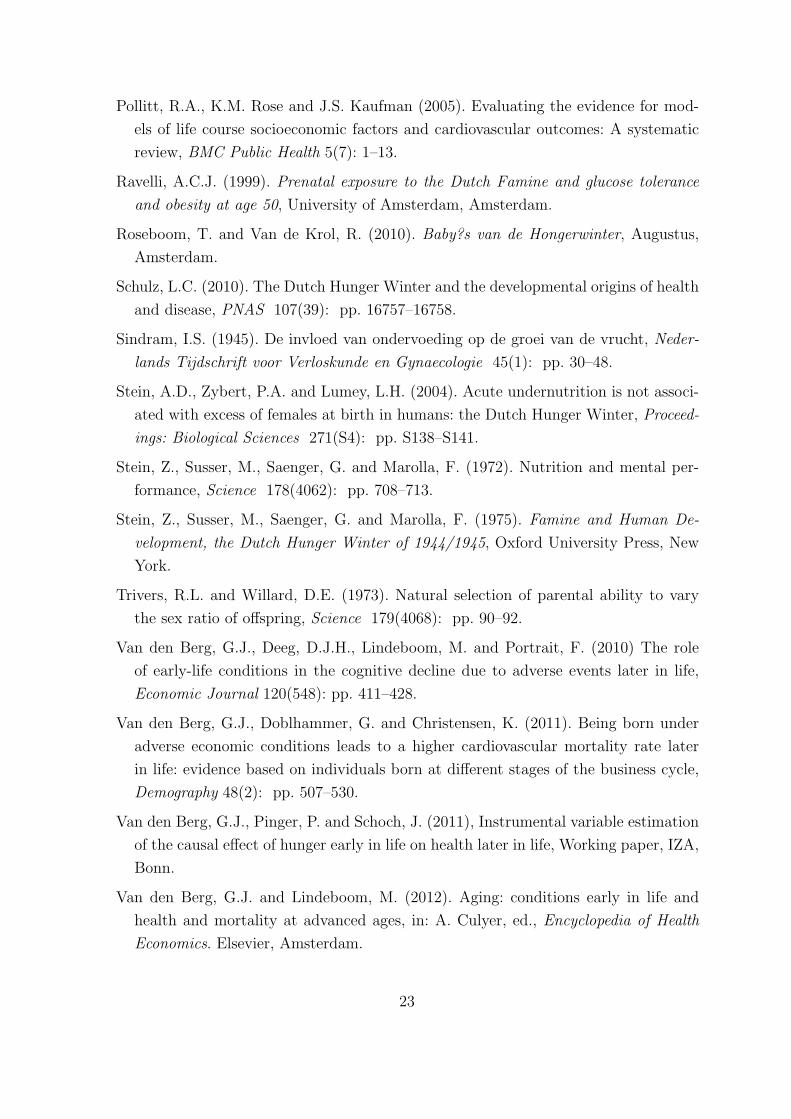
As noted above, we are in the fortunate position that a consensus has been reached
concerning the temporal and spatial bounds of the famine. Figure 1 displays the area
where the famine took place. Recall that we restrict attention to the cities. The North-
east was sparsely populated and contained a large agricultural sector (see e.g. Stein et
al., 1972). It was not subject to the food embargo. In accordance to the literature, we
add its cities to those in the South in order to obtain the set of cities that were not
4Since a famine is not equivalent to exposure to hunger, the causal long-run effects of malnutritionin utero will exceed the reduced-form long-run effects of exposure to the famine in utero (see Vanden Berg, Pinger and Schoch, 2011, for evidence in the context of the Dutch Hunger Winter famine).Selective fertility provides an additional cause of under-estimation; see Section 4.
5
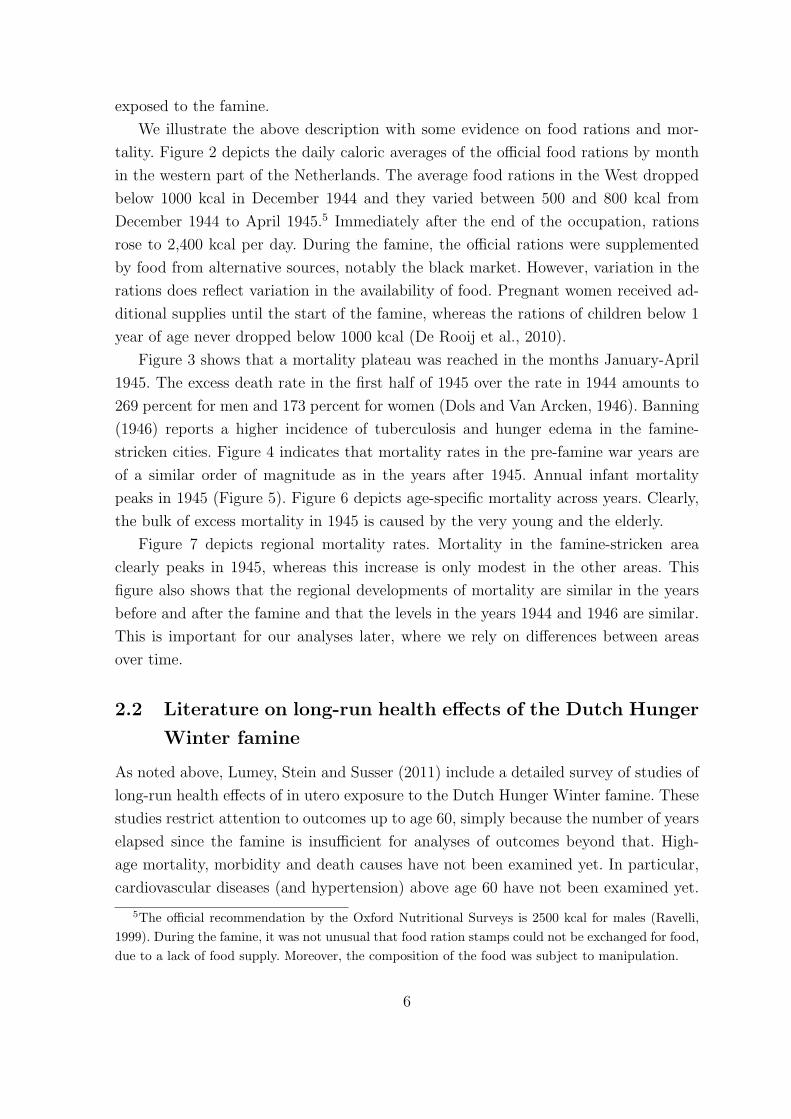
exposed to the famine.
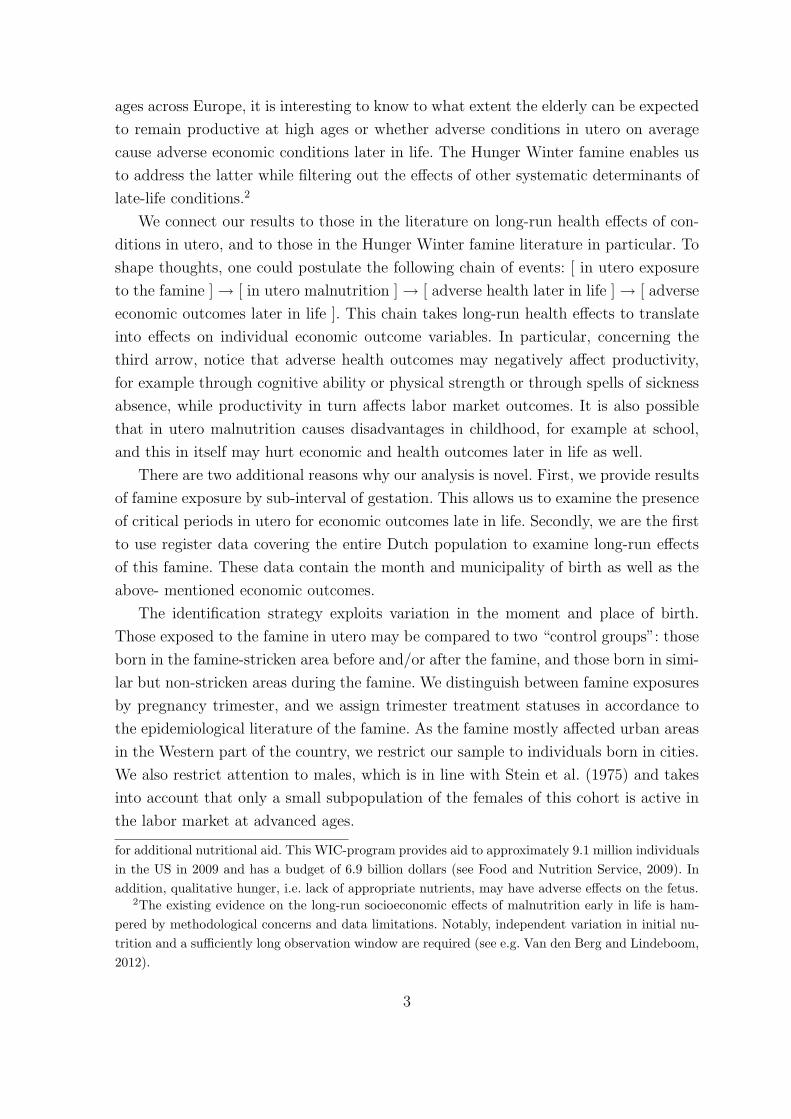
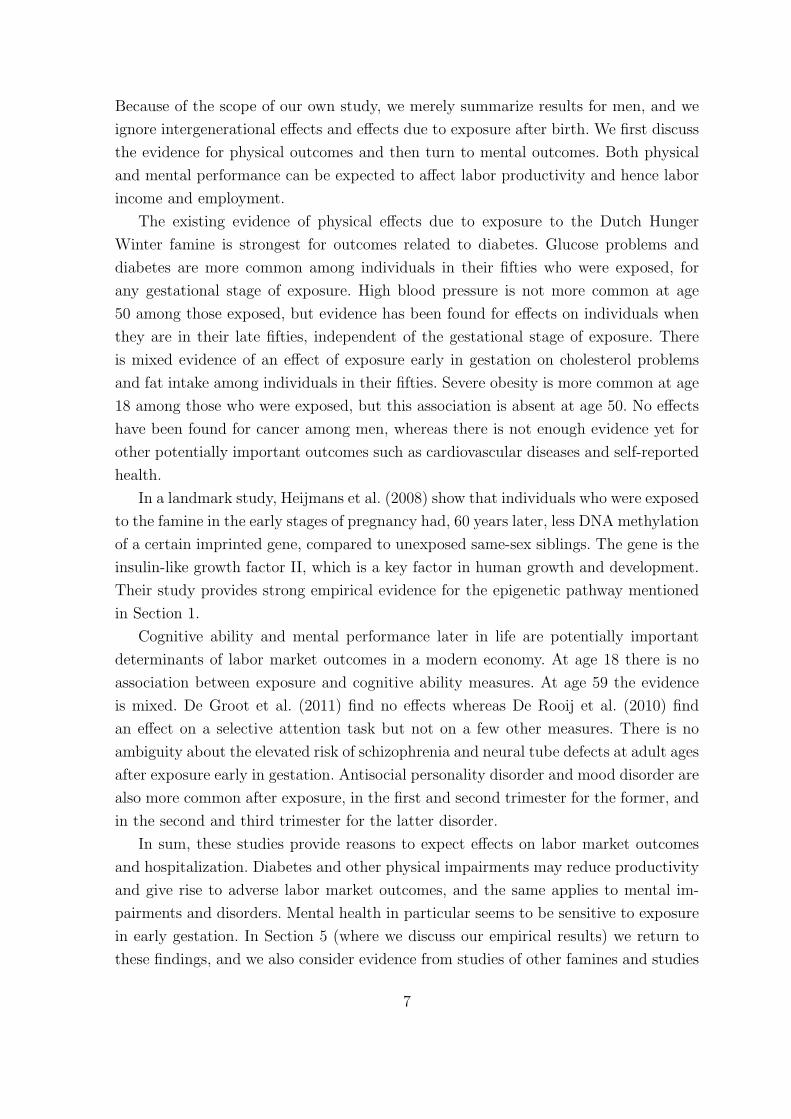
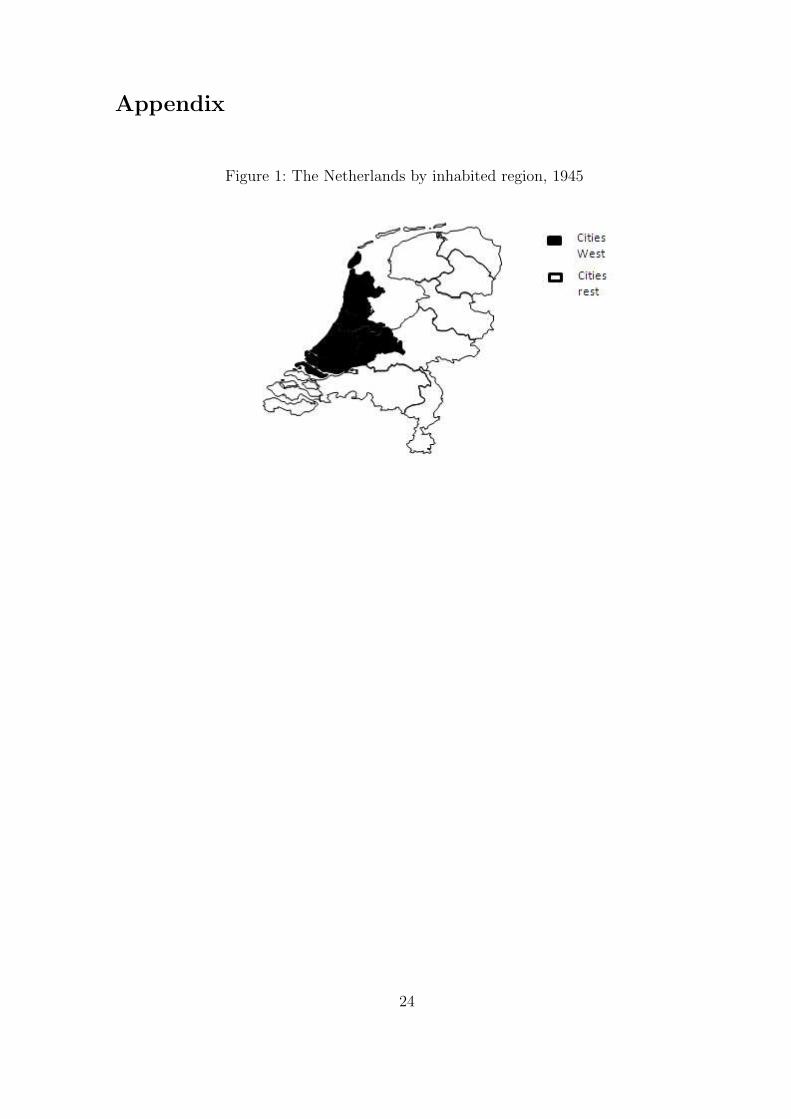
We illustrate the above description with some evidence on food rations and mor-
tality. Figure 2 depicts the daily caloric averages of the official food rations by month
in the western part of the Netherlands. The average food rations in the West dropped
below 1000 kcal in December 1944 and they varied between 500 and 800 kcal from
December 1944 to April 1945.5 Immediately after the end of the occupation, rations
rose to 2,400 kcal per day. During the famine, the official rations were supplemented
by food from alternative sources, notably the black market. However, variation in the
rations does reflect variation in the availability of food. Pregnant women received ad-
ditional supplies until the start of the famine, whereas the rations of children below 1
year of age never dropped below 1000 kcal (De Rooij et al., 2010).
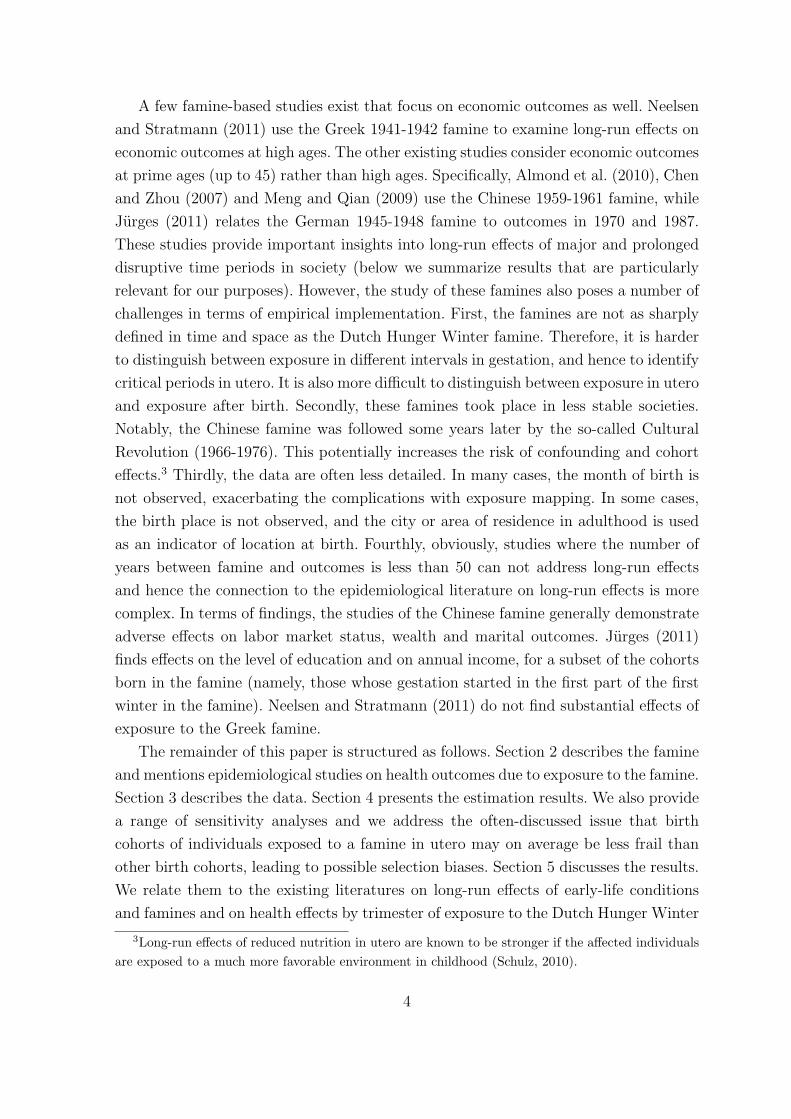
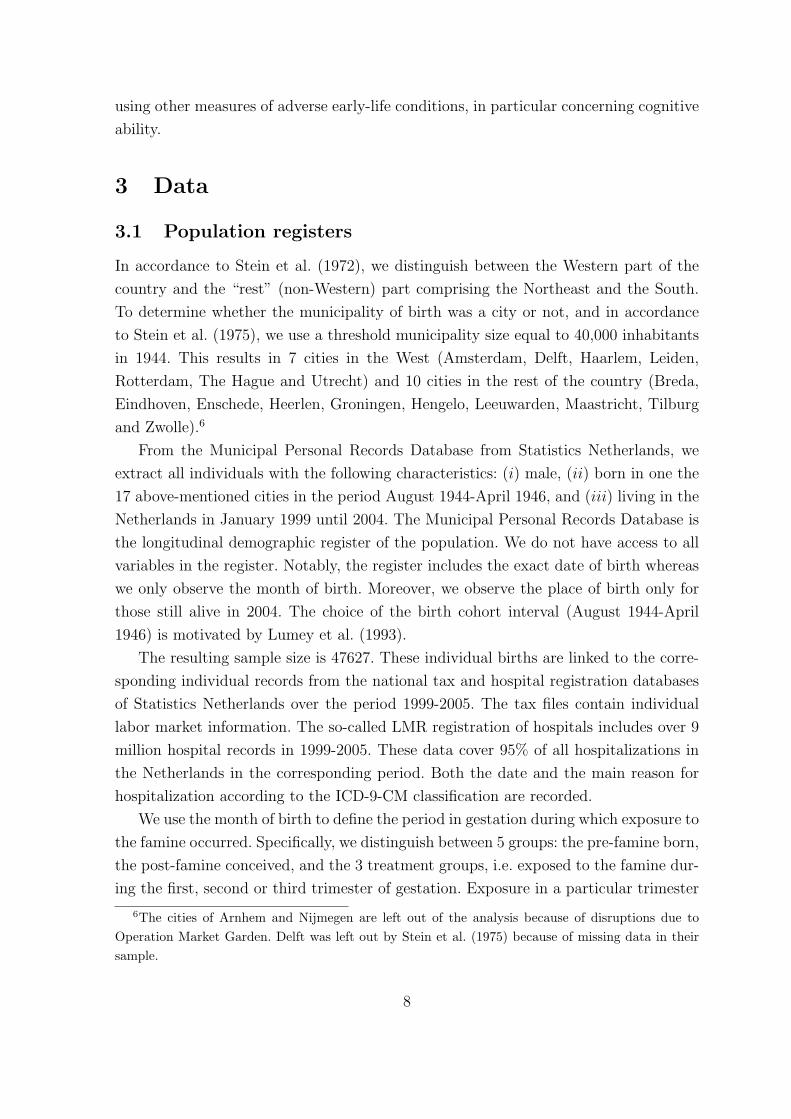
Figure 3 shows that a mortality plateau was reached in the months January-April
1945. The excess death rate in the first half of 1945 over the rate in 1944 amounts to
269 percent for men and 173 percent for women (Dols and Van Arcken, 1946). Banning
(1946) reports a higher incidence of tuberculosis and hunger edema in the famine-
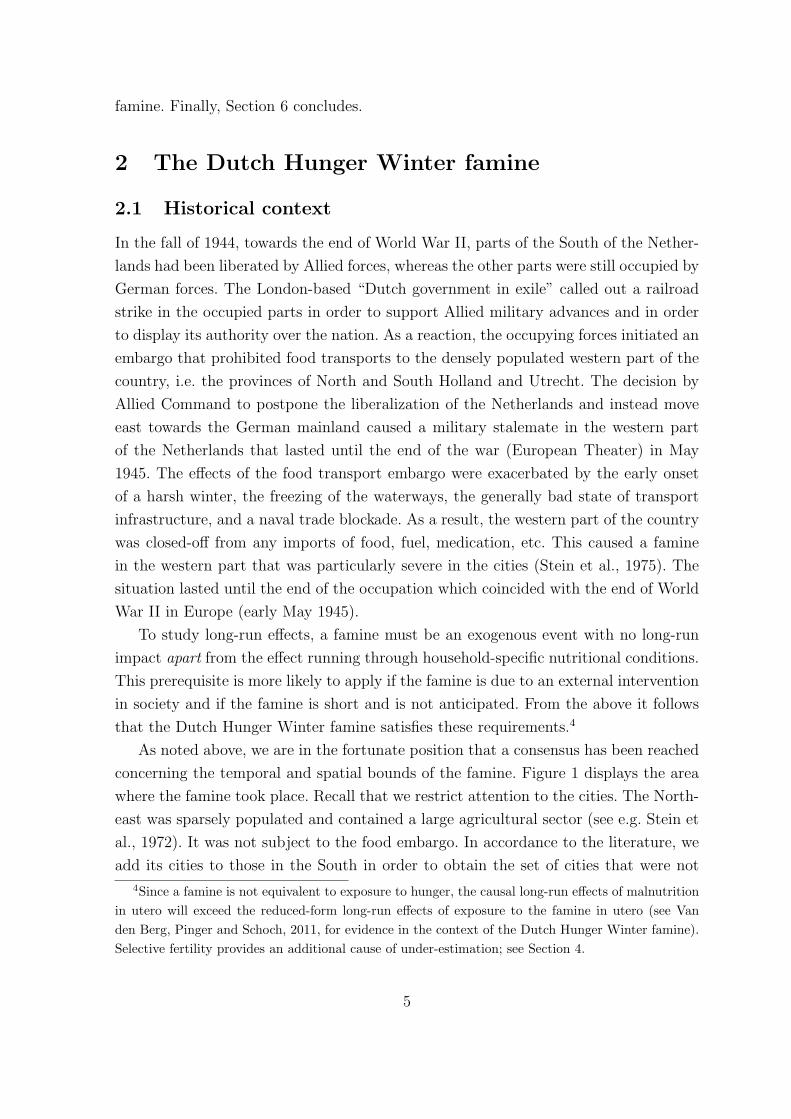
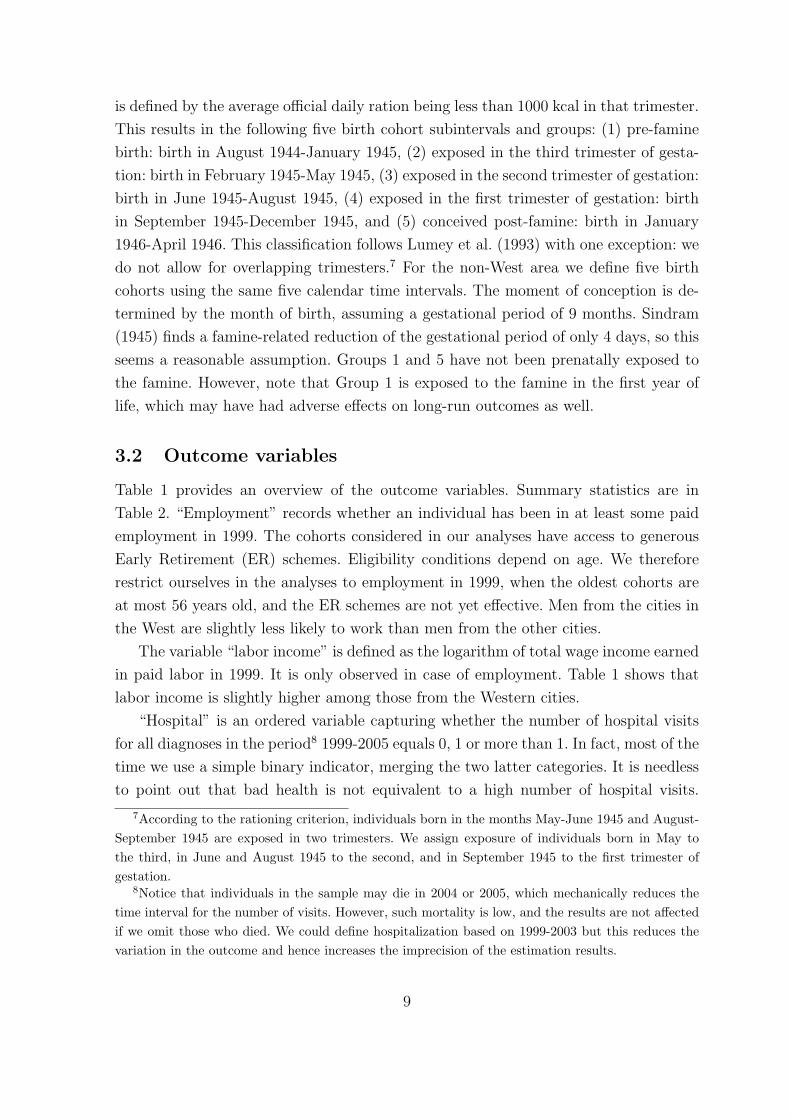
stricken cities. Figure 4 indicates that mortality rates in the pre-famine war years are
of a similar order of magnitude as in the years after 1945. Annual infant mortality
peaks in 1945 (Figure 5). Figure 6 depicts age-specific mortality across years. Clearly,
the bulk of excess mortality in 1945 is caused by the very young and the elderly.
Figure 7 depicts regional mortality rates. Mortality in the famine-stricken area
clearly peaks in 1945, whereas this increase is only modest in the other areas. This
figure also shows that the regional developments of mortality are similar in the years
before and after the famine and that the levels in the years 1944 and 1946 are similar.
This is important for our analyses later, where we rely on differences between areas
over time.
2.2 Literature on long-run health effects of the Dutch Hunger
Winter famine
As noted above, Lumey, Stein and Susser (2011) include a detailed survey of studies of
long-run health effects of in utero exposure to the Dutch Hunger Winter famine. These
studies restrict attention to outcomes up to age 60, simply because the number of years
elapsed since the famine is insufficient for analyses of outcomes beyond that. High-
age mortality, morbidity and death causes have not been examined yet. In particular,
cardiovascular diseases (and hypertension) above age 60 have not been examined yet.
5The official recommendation by the Oxford Nutritional Surveys is 2500 kcal for males (Ravelli,1999). During the famine, it was not unusual that food ration stamps could not be exchanged for food,due to a lack of food supply. Moreover, the composition of the food was subject to manipulation.
6
Because of the scope of our own study, we merely summarize results for men, and we
ignore intergenerational effects and effects due to exposure after birth. We first discuss
the evidence for physical outcomes and then turn to mental outcomes. Both physical
and mental performance can be expected to affect labor productivity and hence labor
income and employment.
The existing evidence of physical effects due to exposure to the Dutch Hunger
Winter famine is strongest for outcomes related to diabetes. Glucose problems and
diabetes are more common among individuals in their fifties who were exposed, for
any gestational stage of exposure. High blood pressure is not more common at age
50 among those exposed, but evidence has been found for effects on individuals when
they are in their late fifties, independent of the gestational stage of exposure. There
is mixed evidence of an effect of exposure early in gestation on cholesterol problems
and fat intake among individuals in their fifties. Severe obesity is more common at age
18 among those who were exposed, but this association is absent at age 50. No effects
have been found for cancer among men, whereas there is not enough evidence yet for
other potentially important outcomes such as cardiovascular diseases and self-reported
health.
In a landmark study, Heijmans et al. (2008) show that individuals who were exposed
to the famine in the early stages of pregnancy had, 60 years later, less DNA methylation
of a certain imprinted gene, compared to unexposed same-sex siblings. The gene is the
insulin-like growth factor II, which is a key factor in human growth and development.
Their study provides strong empirical evidence for the epigenetic pathway mentioned
in Section 1.
Cognitive ability and mental performance later in life are potentially important
determinants of labor market outcomes in a modern economy. At age 18 there is no
association between exposure and cognitive ability measures. At age 59 the evidence
is mixed. De Groot et al. (2011) find no effects whereas De Rooij et al. (2010) find
an effect on a selective attention task but not on a few other measures. There is no
ambiguity about the elevated risk of schizophrenia and neural tube defects at adult ages
after exposure early in gestation. Antisocial personality disorder and mood disorder are
also more common after exposure, in the first and second trimester for the former, and
in the second and third trimester for the latter disorder.
In sum, these studies provide reasons to expect effects on labor market outcomes
and hospitalization. Diabetes and other physical impairments may reduce productivity
and give rise to adverse labor market outcomes, and the same applies to mental im-
pairments and disorders. Mental health in particular seems to be sensitive to exposure
in early gestation. In Section 5 (where we discuss our empirical results) we return to
these findings, and we also consider evidence from studies of other famines and studies
7
using other measures of adverse early-life conditions, in particular concerning cognitive
ability.
3 Data
3.1 Population registers
In accordance to Stein et al. (1972), we distinguish between the Western part of the
country and the “rest” (non-Western) part comprising the Northeast and the South.
To determine whether the municipality of birth was a city or not, and in accordance
to Stein et al. (1975), we use a threshold municipality size equal to 40,000 inhabitants
in 1944. This results in 7 cities in the West (Amsterdam, Delft, Haarlem, Leiden,
Rotterdam, The Hague and Utrecht) and 10 cities in the rest of the country (Breda,
Eindhoven, Enschede, Heerlen, Groningen, Hengelo, Leeuwarden, Maastricht, Tilburg
and Zwolle).6
From the Municipal Personal Records Database from Statistics Netherlands, we
extract all individuals with the following characteristics: (i) male, (ii) born in one the
17 above-mentioned cities in the period August 1944-April 1946, and (iii) living in the
Netherlands in January 1999 until 2004. The Municipal Personal Records Database is
the longitudinal demographic register of the population. We do not have access to all
variables in the register. Notably, the register includes the exact date of birth whereas
we only observe the month of birth. Moreover, we observe the place of birth only for
those still alive in 2004. The choice of the birth cohort interval (August 1944-April
1946) is motivated by Lumey et al. (1993).
The resulting sample size is 47627. These individual births are linked to the corre-
sponding individual records from the national tax and hospital registration databases
of Statistics Netherlands over the period 1999-2005. The tax files contain individual
labor market information. The so-called LMR registration of hospitals includes over 9
million hospital records in 1999-2005. These data cover 95% of all hospitalizations in
the Netherlands in the corresponding period. Both the date and the main reason for
hospitalization according to the ICD-9-CM classification are recorded.
We use the month of birth to define the period in gestation during which exposure to
the famine occurred. Specifically, we distinguish between 5 groups: the pre-famine born,
the post-famine conceived, and the 3 treatment groups, i.e. exposed to the famine dur-
ing the first, second or third trimester of gestation. Exposure in a particular trimester
6The cities of Arnhem and Nijmegen are left out of the analysis because of disruptions due toOperation Market Garden. Delft was left out by Stein et al. (1975) because of missing data in theirsample.
8
is defined by the average official daily ration being less than 1000 kcal in that trimester.
This results in the following five birth cohort subintervals and groups: (1) pre-famine
birth: birth in August 1944-January 1945, (2) exposed in the third trimester of gesta-
tion: birth in February 1945-May 1945, (3) exposed in the second trimester of gestation:
birth in June 1945-August 1945, (4) exposed in the first trimester of gestation: birth
in September 1945-December 1945, and (5) conceived post-famine: birth in January
1946-April 1946. This classification follows Lumey et al. (1993) with one exception: we
do not allow for overlapping trimesters.7 For the non-West area we define five birth
cohorts using the same five calendar time intervals. The moment of conception is de-
termined by the month of birth, assuming a gestational period of 9 months. Sindram
(1945) finds a famine-related reduction of the gestational period of only 4 days, so this
seems a reasonable assumption. Groups 1 and 5 have not been prenatally exposed to
the famine. However, note that Group 1 is exposed to the famine in the first year of
life, which may have had adverse effects on long-run outcomes as well.
3.2 Outcome variables
Table 1 provides an overview of the outcome variables. Summary statistics are in
Table 2. “Employment” records whether an individual has been in at least some paid
employment in 1999. The cohorts considered in our analyses have access to generous
Early Retirement (ER) schemes. Eligibility conditions depend on age. We therefore
restrict ourselves in the analyses to employment in 1999, when the oldest cohorts are
at most 56 years old, and the ER schemes are not yet effective. Men from the cities in
the West are slightly less likely to work than men from the other cities.
The variable “labor income” is defined as the logarithm of total wage income earned
in paid labor in 1999. It is only observed in case of employment. Table 1 shows that
labor income is slightly higher among those from the Western cities.
“Hospital” is an ordered variable capturing whether the number of hospital visits
for all diagnoses in the period8 1999-2005 equals 0, 1 or more than 1. In fact, most of the
time we use a simple binary indicator, merging the two latter categories. It is needless
to point out that bad health is not equivalent to a high number of hospital visits.
7According to the rationing criterion, individuals born in the months May-June 1945 and August-September 1945 are exposed in two trimesters. We assign exposure of individuals born in May tothe third, in June and August 1945 to the second, and in September 1945 to the first trimester ofgestation.
8Notice that individuals in the sample may die in 2004 or 2005, which mechanically reduces thetime interval for the number of visits. However, such mortality is low, and the results are not affectedif we omit those who died. We could define hospitalization based on 1999-2003 but this reduces thevariation in the outcome and hence increases the imprecision of the estimation results.
9
Hospital visits may also be part of preventive health care. Moreover, visiting a hospital
involves psychological costs. However, in the Dutch health care system, physicians act
as first-line caregivers and as gate-keepers. They regulate access to care in hospitals
and they provide most of the preventive care. This is also evident from our data: on
average around 90% of the individuals (aged between 53 and 61) do not go to a hospital
in any given year. Visits to physicians are much more common. We therefore feel that
our outcome variable captures the health dimension that involves most costs.
“CVD” is analogously defined as “hospital”, but it is restricted to hospitalizations
for cardiovascular reasons (ICD-codes 390-459). Cancer is a binary indicator indicat-
ing a cancer-related hospital record (ICD-codes 140-208). Notice that the seven-year
averages of the cause- specific hospitalization variables are low. The annual averages
are about 0.02 for CVD and 0.005 for cancer. A priori we do not expect large effects
of prenatal famine exposure on cancer (Van den Berg, Doblhammer and Christensen,
2011).
Individuals born in the Western cities are slightly less likely to visit a hospital and
are also slightly less likely to do so for cardiovascular reasons. They are slightly more
likely to visit the hospital for cancer-related diagnoses.
4 Estimation results
4.1 Results based on between-cohort variation in the famine-
stricken cities
In this subsection, we use the pre-famine and post-famine birth cohorts in the cities
in the West as “controls” when estimating the long-run effects of famine exposure in
utero. Thus, we only use the subpopulation of individuals born in those cities. We
perform the following regression,
yi = β0 + β1Q1,i + β2Q2,i + β3Q3,i + β4Pi + εi (1)
where yi is an outcome value of individual i and Qj,i are binary indicators for birth
in the cohort that was exposed to the famine in gestational trimester j. The binary
indicator Pi equals one iff the individual is born in the pre-famine cohort. Together,
Q1,i, Q2,i, Q3,i and Pi characterize the 5 birth-cohort groups, where the post-famine
born cohort represents the baseline level. For example, a man i born in Amsterdam
in March 1945 (implying famine exposure in the 3rd trimester) has Q3,i = 1 and
Q2,i = Q1,i = Pi = 0.
Table 5 presents the results. Not surprisingly, they are in broad agreement to the
10
sample statistics by group, presented in Table 3. We do not discuss the results in these
tables separately.9 Individuals exposed to the famine in the first or second trimester of
gestation have significantly lower rates of being employed in 1999, compared to the pre-
and post-famine cohorts. The three in-utero exposed cohorts have lower labor income
in 1999 than the pre- and post-famine groups, but these differences are insignificant.
All 3 prenatally-exposed cohorts face higher hospitalization rates in 1999-2005 in
comparison to the surrounding cohorts. These differences are highly significant. The
prenatally-exposed cohorts also face significantly higher CVD rates compared to the
surrounding cohorts in these famine-stricken cities. There seems to be no effect of the
famine on cancer-specific hospitalization rates in the famine- stricken cities.
To proceed, we also estimate the regression (1) separately for the subpopulation of
individuals born in the cities in the (non-West) rest of the country. In this area there
was no famine. We define Qj,i as a binary indicator for the calendar time interval in
which birth took place, as follows: if the man would instead have been born in the
West in this interval then this would entail famine exposure in gestational trimester j.
Pi is defined analogously. As an example, consider a man i born in Eindhoven in March
1945. If he were born in the West then he would be exposed to the famine in the 3rd
gestational trimester; hence, Q3,i = 1 and Q2,i = Q1,i = Pi = 0. The regressions for
those born in the non-West cities are informative on the extent to which conditions in
the famine period were affected by nationwide cohort-specific events that are not due
to the famine. If present, such events may affect the interpretation of the results in
regression (1) for the famine-stricken cities, in the sense that such differences may be
partly explained by such events and not by the famine.
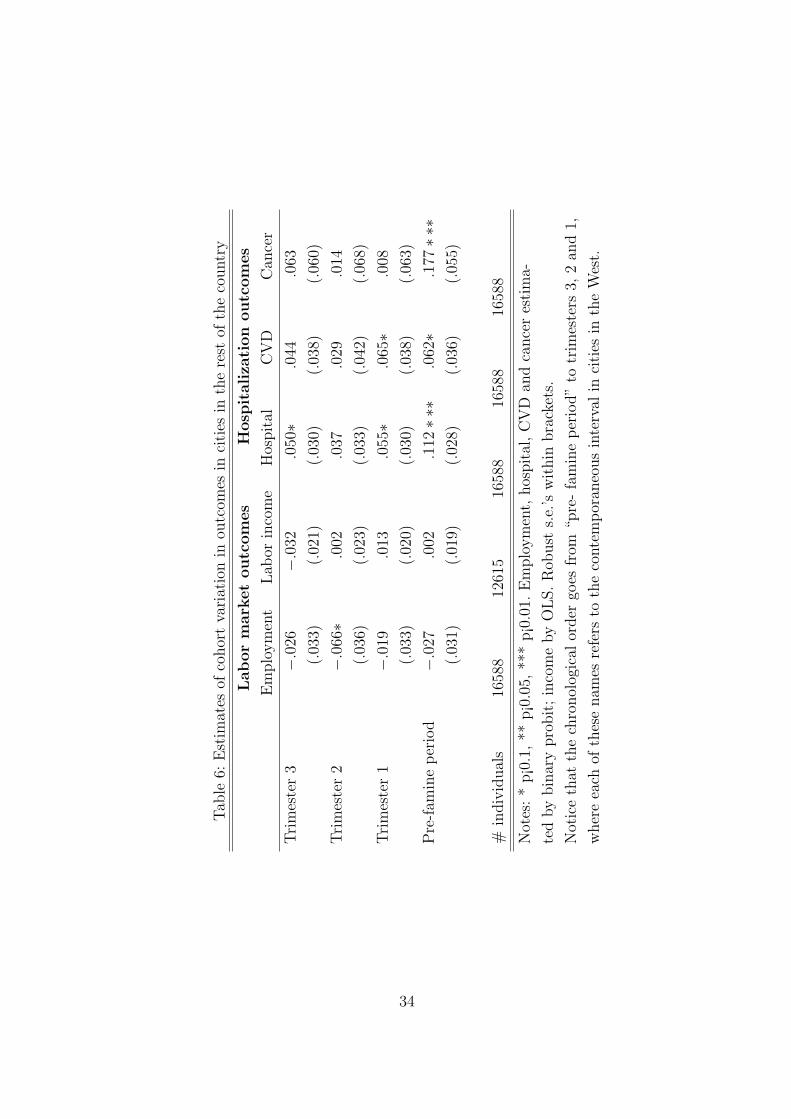
Table 6 presents the results. Again, not surprisingly, they are in broad agreement
to the sample statistics by group, presented in Table 4. Significant differences indicate
that those born in the non- famine area have unusually low or high outcomes later in
life if they were in utero in the period when the famine struck the West. Note that
these are not effects due to the famine.
We find some evidence that in the non-West area, employment in 1999 among
those born in June 1945-August 1945 (i.e., in the so-called second-trimester interval)
is lower than in the cohorts corresponding to the pre- and post-famine period. The
same applies to income in 1999 among those born in February 1945-May 1945 (i.e. in
the third- trimester interval) although here the regression coefficient is not significant.
There are also some between-cohort differences in hospitalization rates and CVD rates
in 1999-2005. Notably, those born in the so-called pre-famine interval and in the first-
9The main difference between the statistical tests reported in these two tables is that the tests inTable 3 lump the pre- famine and post-famine cohorts together into one control cohort whereas thetests in Table 5 are with respect to the post-famine cohort.
11
trimester interval have significantly larger regression coefficients than those born in the
post-famine interval. The pattern for the cancer rate in 1999-2005 seems to be driven
by age effects: it is monotonically decreasing as a function of the birth date.
Thus, it seems that in terms of the long-run effects we are after, the time interval in
which the Dutch Hunger Winter famine took place in the West may have been unusual
not only because of the famine but also in some other respects, for those in gestation.
Some additional evidence for unusual circumstances is provided by the facts that in the
non-West part of the country, stillbirth rates and infant mortality rates were higher in
the cohorts that were in gestation around the time interval of the famine, and over-all
mortality was higher in 1945, than in surrounding years (see Stein et al., 1975, Figure
7, and archives of Statistics Netherlands).
We may distinguish between different explanations for this. First, the winter of
1944/45 was unusually harsh, and this may have had adverse effects on those in famine-
stricken and non-stricken areas alike, for example due to exposure to infectious agents.
This motivates a correction of the results for the cities in the West with the results for
those in the non-West. Second, the non-West may have been subject to food shortages
as well. In that case, a correction of the results for the West with the results for the
non-West would entail results of the effect of the famine in the West relative to the
effect of food shortages in the non-West. It would then be more informative to restrict
attention to the results using cohorts born in the West only.
There is some evidence of food shortages in the East. There were no serious short-
ages in the South. However, stillbirth rates and infant mortality were higher in the
cohorts that were in gestation around the time interval of the famine than in surround-
ing cohorts (Stein et al., 1975, and archives of Statistics Netherlands). Annual over-all
mortality in the cities in the South was elevated in 1944 and 1945. The maximum level
was attained in 1944, but this may be due to the fact that the front line of World War
II was in the South in the second half of 1944.
The results in this subsection motivate the joint analysis of all available cohorts
and regions. This should also take into account (i) that the five different groups we
define cover different seasons of the year, (ii) that the outcomes are measured at ages
that depend on the membership of the group, and (iii) that there may be a systematic
time-invariant difference between outcomes for those born in the West and those born
in the non-West.
4.2 Results based on variation within and between cohorts
In this subsection we simultaneously use all available information, by estimating the
following regression model,
12
yi = β0 +β1Q1,iF +β2Q2,iF +β3Q3,iFi +β4Q1,i +β5Q2,i +β6Q3,i +β7Fi +β8Xi +εi (2)
where Fi is an indicator of a birth in a city in the West. Since the sample size is larger
than in the regressions of the previous subsection, we have some additional flexibility
at our disposal. We therefore replace the pre-famine indicator Pi by a vector X that
contains a linear function of the birth in calendar time (where the latter is measured
in reverse chronological order, from the value 21 in August 1944 to the value 1 in April
1946). This controls for smooth secular cohort effects over time. Moreover, since the
outcomes are measured at a common point in calendar time, it also controls for age
effects on the outcome. The vector X also contains indicators of the month of birth,
in order to control for season-of-birth effects (Doblhammer and Vaupel, 2001).
The interaction terms Qj,iFi capture exposure to the famine in gestational trimester
j. Hence, the corresponding coefficients β1, β2, β3 are the parameters of interest. They
represent the effect of exposure over and above the effect of birth in a city in the West,
and over and above the effect of being born at a particular moment in time (the latter
effect abstracting from famine exposure). The effect of birth in a city in the West
is represented by β7 and the effect of being born at a particular moment in time is
represented by β4, β5, β6 and β8. Intuitively, the effect of being born at a particular
moment in time is identified by the outcomes of those born in non-West cities, and
the effect of birth in a city in the West is subsequently identified by the outcomes of
those in the pre- and post-famine cohorts in the cities in the West. In sum, we use the
variation between cohorts and between areas to identify the effects of famine exposure
by gestational trimester.
Table 7 shows the estimation results. In comparison to those in the previous sub-
section, we find, as expected, that the estimated famine effects are qualitatively similar
but somewhat less strong. The only significant effect on labor market outcomes later
in life is the effect of famine exposure in the first gestational trimester on employment.
All 3 prenatally-exposed cohorts face significantly higher hospitalization rates in 1999-
2005. These cohorts also face higher CVD rates, but the effect is only significant for
exposure in the second trimester. We do not find significant effects of the famine on
cancer-specific hospitalization rates. The linear effect of the (reverse-measured) month
of birth is significantly positive for labor income. This means that income in 1999
is positively correlated to age in 1999. Similarly, all hospitalization rates in 1999 are
positively related to age in 1999, but the latter relations are not significant.
In the light of the large sample sizes, one might have expected more coefficients to
be significantly different from zero. The explanation of this apparent paradox is that
the magnitude of the estimated long-run effects is small. The latter is in line with
13
the small differences between mean outcomes per area and birth group, as reported
in Subsections 3.2 and 4.1. For example, the estimated effect of exposure in the first
gestational trimester on the employment probability is slightly less than 3 percentage
points, implying that the employment rate changes from say 73% to 76% in a cohort.
In Section 5 we discuss the results presented here, and we relate them to other
studies.
4.3 Sensitivity analyses
We perform a range of additional analyses to assess the robustness of the results. In this
subsection first examine alternative model specifications and then turn to alternative
variable definitions and sample selections. In each case, the parameter estimates are
available upon request.
First, we divide the single “non-West” area into separate North/East and South
areas. Specifically, we include a separate indicator for North/East versus South. The
results are not sensitive to this. As an alternative, we include binary indicators for
the city of birth to control for within-city differences in conditions that are constant
over time. The estimates of interest are virtually identical to those reported. We also
consider alternatives for the linear functional form for the function capturing the effects
of smooth secular changes in society on mean outcomes. It turns out that adopting
higher-degree polynomials, or adopting a binary “pre- famine” indicator for birth before
the onset of the famine, does not affect the coefficients of interest. The same applies if
we omit the 11 binary indicators for the month of birth.
So far we have not used the information on the number of hospital visits in 1999-2005
beyond the binary indicator for the number being positive. To proceed, we estimate
ordered probit models, distinguishing between 0, 1 and more than 1 visits. The estima-
tion results are virtually identical to those reported in the previous subsections. In yet
another specification, we estimate probits for the hospitalization outcomes in the year
1999 and in the year 2005 separately. Clearly, this reduces the variation in outcomes
considerably, and as a result all coefficients are insignificantly different from zero, for
1999 as well as for 2005.
We also examine whether the results depend on the choice of the birth cohort
observation window which is rather small. We re-estimate the models with the windows
July 1944-May 1946 and June 1944-June 1946. The coefficients of interest are not out
of line with those reported in the paper. The same applies if we omit all observations
born before December 1944, i.e., all those born before the famine.
So far we have not exploited the data on labor market outcomes in 2000-2005.
Mechanical re-estimation of our models with data from one of these years is not very
14
interesting because, as explained in Section 3, the results are confounded by early-
retirement schemes. We may estimate a dynamic model for the age at which the
individual leaves employment conditional on being employed in 1999, and make the
transition rate dependent on famine exposure. This model takes the early-retirement
schemes into account. However, the employment requirement for 1999 creates a selec-
tion problem. It turns out that the results are dominated by the effect of current age,
reflecting early-retirement decisions.
4.4 Cohort size and selection effects
As in any study of long-run effects of in-utero exposure to famines, the survivors who
were exposed to the famine may be systematically different in terms of unobserved
characteristics than the survivors who were not exposed to the famine. This selectivity
may lead to biased inference. In our setting one may distinguish between three phases
of selection: at conception, in utero, and between birth and survival at high ages.
First, the conception rate may systematically differ between an exposed cohort and
the corresponding control cohorts. Specifically, families living in poor conditions may
experience a particularly strong fertility reduction during the famine. This is relevant
for the evaluation of the effect of famine exposure in the first gestational trimester.
The evaluation of the effects of famine exposure in the second or third trimester is not
affected by this first selection phase, because the exposed individuals were conceived
before the famine, and the famine was not anticipated. Secondly, death in utero may
occur more frequently during the famine, especially among frail fetuses (where frailty
refers to individual characteristics that are not driven by the famine and that are
not observed in our data). The same applies to spontaneous abortions and stillbirths.
Thirdly, it is conceivable that mortality in between birth and 2004 depends on famine
exposure. Such mortality may disproportionally affect the frailer individuals in the
cohort.
As a result of all this, the birth cohorts of those exposed in the first, second or third
gestational trimester may on average have less frail characteristics than the correspond-
ing control cohorts. This difference may be exacerbated at high ages. All this tends
to reduce the observed difference in outcomes between the exposed cohorts and the
corresponding control cohorts. In sum, the estimated effect underestimates the causal
effect of exposure in absolute value.
Our data are not suitable to study the extent of selectivity, since they only contain
the cohort members who are actually conceived, born alive, and still alive in 2004.
However, other data and other studies provide some insights. We focus on selectivity
in terms of the cohort composition at (i.e. immediately after) birth.
15
As a starting point, we examine the size of the birth cohorts. Figure 8 indicates that
the average national fertility fell in 1945 and increased strongly in 1946. From some
simple interpolations of the sizes of cohorts that were not exposed in utero, we infer
that the exposed cohorts are about 20%, 30% and 55% smaller than in the absence
of the famine, for those exposed in the third, second and first trimester in gestation,
respectively. It is plausible that the reduction is strongest for the cohort exposed in
the first trimester, as this cohort suffers both from a reduced conception rate and from
an increased in utero mortality rate, whereas the cohorts exposed in the second or
third trimester only suffer from the latter. Roseboom and Van de Krol (2010) show
that during the famine itself, about half of the women in the exposed areas did not
menstruate. This is in line with the 55% reduction in the size of the cohort of those
exposed in the first trimester of gestation.
A reduction in cohort size does not automatically entail a change in composition.
Unfortunately, we have no information on parental characteristics to capture the par-
ents’ socioeconomic class. Stein et al. (1975) observe parental occupations, using mil-
itary conscription data of the cohorts born in and around the famine. They find that
the higher the occupational category of the father, the lower the reduction of the birth
rate of the cohorts exposed in utero, as compared to the non-exposed cohorts. Painter,
Roseboom and Bleker (2005) show that this finding does not change when adjusting
for maternal characteristics such as age, parity, weight and weight gain during gesta-
tion. This suggests that the exposed cohorts consist on average of less frail individuals,
and this may lead us to underestimate the magnitudes of the average causal effects of
exposure.10
The analysis could in principle also be confounded by educational reforms after the
famine that took place in such a way that exposed and (some of the) non- exposed
cohorts faced different educational systems. However, there were no major educational
changes until 1968 (see Dodde, 1983). The latter reform occurred too late to impact
the schooling outcomes of the birth cohorts we use.
5 Discussion
Concerning labor market outcomes at ages around 55, the main finding is that the
probability of employment is significantly lower if the individual was exposed to the
famine during the first trimester of gestation. The quantitative effect is small, but this
10The Trivers and Willard (1973) hypothesis states that the gender composition or sex ratio of theoffspring under adverse conditions is biased towards girls. Stein et al. (2004) and Cramer and Lumey(2010) study sex ratio effects of the famine. They find no evidence of an effect. This provides anargument against severe selectivity of birth cohorts.
16
may be due to selectivity of those who are conceived during the famine and subsequently
survive gestation. The qualitative result can be connected to the literature on the long-
run effects of adverse conditions early in life on cognitive ability later in life. Notably, as
we have seen in Subsection 2.2, there is evidence for a lower cognitive ability at similar
ages among those who were exposed in their first gestational trimester to the Dutch
Hunger Winter famine. (The latter evidence is not uniform across ability measures, but
that may be a result of selection effects as well.) Plausibly, the lower cognitive ability
has led to a lower productivity and hence a lower employment probability. Since there
does not seem to be any cognitive effects at age 18, the cognitive ability reduction at
age 55 would be the result of a decline somewhere in between. An additional role may
be played by mental disorders that reduce productivity in the labor market, notably
schizophrenia, neural tube defects, and antisocial personality disorder. After all, these
are also more common upon exposure in the first trimester of gestation. The prevalence
of these disorders is relatively low, but their productivity effects may be severe.
The above argument fits in with results from studies that examine adverse nu-
tritional conditions early in life that are different from famines. The occurrence of
Ramadan during the first month of pregnancy increases the risk of mental/learning dis-
abilities, among prime-aged men in Muslim populations in Uganda and Iraq (Almond
and Mazumder, 2010). This confirms the importance of early gestation for cognitive
and mental outcomes. Notice that Ramadan is fully anticipated and may involve a
temporary adoption of a different lifestyle, which makes the exposure effects poten-
tially different in magnitude from famine exposure effects. Doblhammer, Van den Berg
and Fritze (2011) relate cognitive functioning beyond age 60 to exogenous and unan-
ticipated macro-economic fluctuations in the year(s) of birth and gestation, using data
from 11 countries. It turns out that a recession around birth significantly decreases cog-
nitive ability in most dimensions (including numerical, verbal, and over- all). In terms
of the adversity of nutritional conditions, recessions are mild in comparison to famines,
so selective fertility is less of an issue. However, business cycle fluctuations are hard to
use for separate analyses by gestational stage, since they are typically only measured
annually. In any case, the results demonstrate that cognitive ability at higher ages is
responsive to early-life economic conditions. This is further confirmed by Van den Berg
et al. (2010) who find that among individuals born in the Netherlands in recessions,
the decline in mental fitness after experiencing a negative life event at high ages, such
as stroke, surgery, illness or death of a family member, is worse. If such life events
are more common or more intrusive at high ages than at prime ages, their result may
explain why adverse cognitive effects are found more often among the elderly. This in
turn may mean that employment effects increase as individuals approach retirement.
The individual productivity may also be affected by adverse physical health condi-
17
tions among those exposed. However, the hospitalization effects are weaker for those
exposed in the first trimester than for those exposed in late gestation. This suggests
that physical effects are not the major driving force behind the employment effect.
The effects on labor income are not significant. Labor income and the sample for
which it is observed are truncated from below by minimum wages. In fact, the effective
truncation point may often be much higher than that, because elderly individuals in the
Netherlands in the 1990s had access to generous disability and UI schemes in the case
of job loss. This may weaken the extent to which income reflects the mean productivity
within the cohort.
The cause-specific hospitalization results provide a major confirmation of the epi-
demiological literature on the developmental origins of late-life health. Specifically, this
literature points at an impact on cardiovascular conditions but not on cancer (see the
overviews mentioned in Section 1 and Van den Berg et al., 2010). Variation in the over-
all hospitalization variable is partly driven by variation in CVD and, to a lesser extent,
cancer. Moreover, it is driven by other health problems that are known to be respon-
sive to famine exposure in utero. In this sense it is not surprising that hospitalization
depends on exposure in any gestational trimester.
The CVD effects are larger for exposure in the second gestational trimester than
for exposure in the third (although the difference between the two coefficients is not
significantly different from zero). The epidemiological literature typically finds that nu-
tritional conditions during the third trimester are most important (see the overviews
cited in Section 1 and references therein). Much of this literature considers effects on
cardiovascular mortality or morbidity at higher ages (see also Van den Berg, Doblham-
mer and Christensen, 2011, who find that the cardiovascular mortality rate depends
more strongly on the business cycle in the third trimester than in the second trimester,
although, again, the differences are not significant). For most individuals, mortality
occurs beyond the ages at which we observe our outcome variables. It is therefore not
inconceivable that the effect on cardiovascular mortality and morbidity at higher ages
is driven by conditions in the third trimester whereas the CVD effects at ages around
55 are also driven by conditions earlier in gestation. This is a topic for further research.
We found that the linear effect of the month of birth is significantly negative for
labor income, meaning that the age in 1999 is positively correlated to the income
among employed individuals in 1999. This probably just reflects increasing age-income
career profiles. An alternative explanation is that individuals from older cohorts with a
low labor income exited employment just before 1999 more frequently than individuals
from younger cohorts with a low labor income while the exit rate was identical for high-
income individuals. Such an exit pattern could again be due to the generous benefits
schemes for elderly workers in the late 1990s. However, in that case we would have
18
expected a negative relation between age in 1999 and employment in 1999, and this is
not what we find.
6 Conclusions
This paper establishes a connection between individual in-utero exposure to nutritional
deficiencies on the one hand, and labor market outcomes and hospitalization indicators
of the same individuals more than 50 years later on the other hand. The most striking
result is that the probability of being employed is significantly lower in case of exposure
during the first trimester of gestation. This result can be connected to the existing evi-
dence on long-run effects of adverse conditions early in life on cognitive ability later in
life. We conclude that the employment effect is most likely at least partially the result
of a reduced cognitive ability but not a reduced physical ability. Mental illnesses and
disorders may contribute to the ability pathway although their quantitative importance
is probably small. As predicted by the epidemiological literature on the developmen-
tal origins of late-life health, we find significant effects of exposure on cardiovascular
conditions but not on cancer.
The results include effects on hospitalization rates that provide inputs for assess-
ments of the costs of adverse conditions in utero. The results of the paper are also
useful in the light of current plans to increase mandatory retirement ages. We find that
adverse conditions in utero restrict the productivity of the elderly. The extent to which
individuals from poor countries or from countries that used to be poor in the 1940s or
1950s can be expected to continue working at a minimum necessary productivity level
beyond the current retirement ages may be limited.
The paper uses data that are unprecedented in the literature on long-run effects
of in-utero exposure to nutritional deficiencies. They cover the full population of the
Netherlands in 2004, including records from the income tax and hospitalization regis-
ters. Observation of the month and municipality of birth allows us to exploit the fact
that the Dutch Hunger Winter famine is sharply defined in time and space. Moreover,
the famine’s duration was so short that it enables inference by gestational stage. Nev-
ertheless, the variation in individual circumstances around birth and in childhood is
not recorded beyond the date and place of birth. Sibling pairs can not be identified. It
is therefore a challenge for future research to widen the setting by including additional
registers and/or survey data on individual conditions early in life. This might allow us
to control for variation in those conditions and to examine to what extent decisions
and events after birth are able to mitigate the effects of adverse nutritional conditions
in utero. Similarly, it would be interesting to obtain data on outcomes at ages be-
19

yond retirement. This should enable a more precise assessment of the relevant causal
pathways. The retirement literature has documented strong effects of health on labor
market withdrawal. Therefore, it may be interesting to take the retirement patterns
of different cohorts into account. Since the famine cohorts have only just passed the
mandatory retirement age, we leave this to future work.
20
References
Almond, D. and Mazumder, B. (2010). Health capital and the prenatal environment:
the effect of Ramadan observance during pregnancy, American Economic Journal:
Applied Economics 3(4): pp. 56–85.
Almond, D., Edlund, L., Li, H. and Zhang, J. (2010). Long-term effects of the 1959-
1961 China Famine: mainland China and Hong Kong, in: T. Ito and A.K. Rose,
eds., The Economic Consequences of Demographic Change in East Asia. University
of Chicago Press, Chicago.
Banning, C. (1945). Food shortage and public health, first half of 1945, The ANNALS
of the American Academy of Political and Social Sciences 245(1): pp. 93–110.
Barker, D.J.P. (1994). Mothers, Babies, and Disease in Later Life. British Medical
Journal Publishing Group, London.
Barker, D.J.P. (2007). The origins of the developmental origins theory, Journal of
Internal Medicine 261: 412–417.
Bateson, P. (2001). Fetal experience and good adult design. International Journal of
Epidemiology, 30: 928–934.
Chen, Y. and Zhou, L.-A. (2007). The long-term health and economic consequences of
the 1959-1961 famine in China, Journal of Health Economics 26(4): pp. 659–681.
Cramer, J.S. and Lumey, L.H. (2010). Maternal preconception diet and the sex ratio,
Human Biology 82(1): pp. 103–107.
De Groot, R.H.M., Stein, A.D., Jolles, J., Van Boxtel, M.P.J., Blauw, G.-J., Van de
Bor, M. and Lumey, L.H. (2011). Prenatal famine exposure and cognition at age 59
years, International Journal of Epidemiology 40(2): pp. 327–337.
De Rooij, S.R., Wouters, H., Yonker, J.E., Painter, R.C. and Roseboom, T.J. (2010).
Prenatal undernutrition and cognitive function in late adulthood, PNAS 107(39): pp.
16881–16886.
Doblhammer, G. and Vaupel, J.W. (2001). Lifespan depends on month of birth, Pro-
ceedings of the National Acadamy of Sciences of the United States of America
98(5): pp. 2934–2939.
Doblhammer, G., Van den Berg, G.J. and Fritze, T. (2011). Economic conditions at
the time of birth and cognitive abilities late in life: evidence from eleven European
countries, Working paper, IZA Bonn.
Dodde, N.L. (1983). Het Nederlandse onderwijs verandert: ontwikkelingen sinds 1800,
Coutinho, Muiderberg.
21
Dols, M.J.L. and Van Arcken, D.J.A.M. (1946). Food supply and nutrition in the
Netherlands during and immediately after World War II. The Milbank Memorial
Fund Quarterly, 24(4): 319–358.
Food and Nutrition Service (2009). WIC Fact Sheet.
Gluckman, P.D., and Hanson, M.A. (2004). Living with the past: evolution, develop-
ment, and patterns of disease. Science 305: 1733–1736.
Hales, C.N., and Barker, D.J. (1992). Type 2 (non-insulin-dependent) diabetes mellitus:
the thrifty phenotype hypothesis. Diabetologia 35(7): 595–601.
Heijmans, B.T., Tobi, E.W., Stein, A.D., Putter, H., Blauw, G.J., Susser, E.S., et al.
(2008). Persistent epigenetic differences associated with prenatal exposure to famine
in humans. Proceedings of the National Academy of Sciences of the USA, 105(44):
17046–17049.
Jurges, H. (2011). Collateral damage: Educational attainment and labor market out-
comes among German war and post-war cohorts. Working paper, University of Wup-
pertal.
Kuzawa, C., and Quinn, E.A. (2009). Developmental origins of adult function and
health: evolutionary hypotheses. Annual Review of Anthropology 38: 131–147.
Lawlor, D.A. (2008). The developmental origins of health and disease: where do we go
from here?, Epidemiology 19: 206–208.
Lumey, L.H., Ravelli, A.C.J., Wiessing, L.G., Koppe, J.G., Treffers, P.E. and Stein,
Z.A. (1993). The Dutch famine birth cohort study: design, validation of exposure and
selected characteristics of subjects after 43 years follow-up, Paediatric and Perinatal
Epidemiology 7(4): pp. 354–367.
Lumey, L., Stein, A.D. and Susser, E. (2011). Prenatal famine and adult health, Annual
Review of Public Health 32: pp. 237–262.
Meng, X. and Qian, N. (2009). The long-run consequences of famine on survivors:
evidence from a unique natural experiment using China’s Great Famine, N.B.E.R.
Working Paper 14917.
Neelsen, S. and Stratmann, T. (2011). Effects of prenatal and early life malnutrition:
Evidence from the Greek famine, Journal of Health Economics 30(3): pp. 479–488.
Painter, R.C., Roseboom, T.J. and Bleker, O.P. (2005). Prenatal exposure to the Dutch
Famine and disease in later life: an overview, Reproductive Toxicology 20(3): pp.
345–352.
22
Pollitt, R.A., K.M. Rose and J.S. Kaufman (2005). Evaluating the evidence for mod-
els of life course socioeconomic factors and cardiovascular outcomes: A systematic
review, BMC Public Health 5(7): 1–13.
Ravelli, A.C.J. (1999). Prenatal exposure to the Dutch Famine and glucose tolerance
and obesity at age 50, University of Amsterdam, Amsterdam.
Roseboom, T. and Van de Krol, R. (2010). Baby?s van de Hongerwinter, Augustus,
Amsterdam.
Schulz, L.C. (2010). The Dutch Hunger Winter and the developmental origins of health
and disease, PNAS 107(39): pp. 16757–16758.
Sindram, I.S. (1945). De invloed van ondervoeding op de groei van de vrucht, Neder-
lands Tijdschrift voor Verloskunde en Gynaecologie 45(1): pp. 30–48.
Stein, A.D., Zybert, P.A. and Lumey, L.H. (2004). Acute undernutrition is not associ-
ated with excess of females at birth in humans: the Dutch Hunger Winter, Proceed-
ings: Biological Sciences 271(S4): pp. S138–S141.
Stein, Z., Susser, M., Saenger, G. and Marolla, F. (1972). Nutrition and mental per-
formance, Science 178(4062): pp. 708–713.
Stein, Z., Susser, M., Saenger, G. and Marolla, F. (1975). Famine and Human De-
velopment, the Dutch Hunger Winter of 1944/1945, Oxford University Press, New
York.
Trivers, R.L. and Willard, D.E. (1973). Natural selection of parental ability to vary
the sex ratio of offspring, Science 179(4068): pp. 90–92.
Van den Berg, G.J., Deeg, D.J.H., Lindeboom, M. and Portrait, F. (2010) The role
of early-life conditions in the cognitive decline due to adverse events later in life,
Economic Journal 120(548): pp. 411–428.
Van den Berg, G.J., Doblhammer, G. and Christensen, K. (2011). Being born under
adverse economic conditions leads to a higher cardiovascular mortality rate later
in life: evidence based on individuals born at different stages of the business cycle,
Demography 48(2): pp. 507–530.
Van den Berg, G.J., Pinger, P. and Schoch, J. (2011), Instrumental variable estimation
of the causal effect of hunger early in life on health later in life, Working paper, IZA,
Bonn.
Van den Berg, G.J. and Lindeboom, M. (2012). Aging: conditions early in life and
health and mortality at advanced ages, in: A. Culyer, ed., Encyclopedia of Health
Economics. Elsevier, Amsterdam.
23
Appendix
Figure 1: The Netherlands by inhabited region, 1945
24
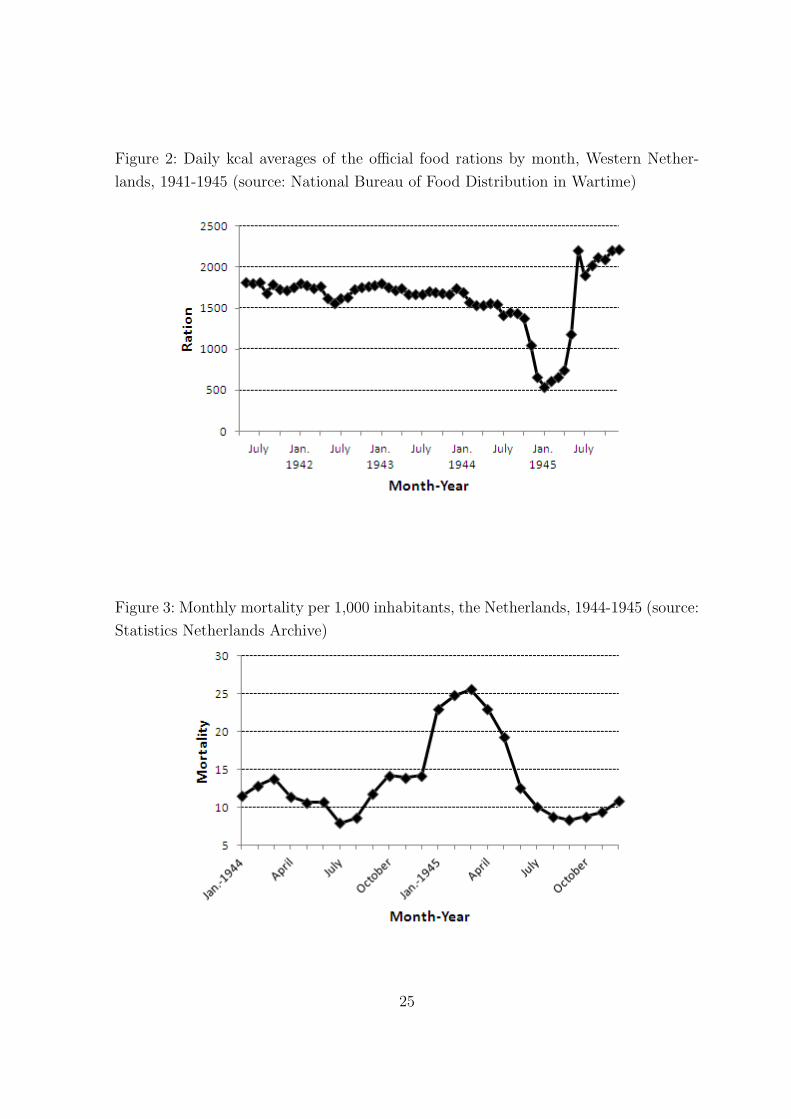
Figure 2: Daily kcal averages of the official food rations by month, Western Nether-
lands, 1941-1945 (source: National Bureau of Food Distribution in Wartime)
Figure 3: Monthly mortality per 1,000 inhabitants, the Netherlands, 1944-1945 (source:
Statistics Netherlands Archive)
25
Figure 4: Yearly mortality per 1,000 inhabitants, the Netherlands, 1935-1949 (source:
Statistics Netherlands, statline.cbs.nl)
Figure 5: Deaths within the first year of life per 1,000 live births, the Netherlands,
1940-1949 (source: Statistics Netherlands, statline.cbs.nl)
26
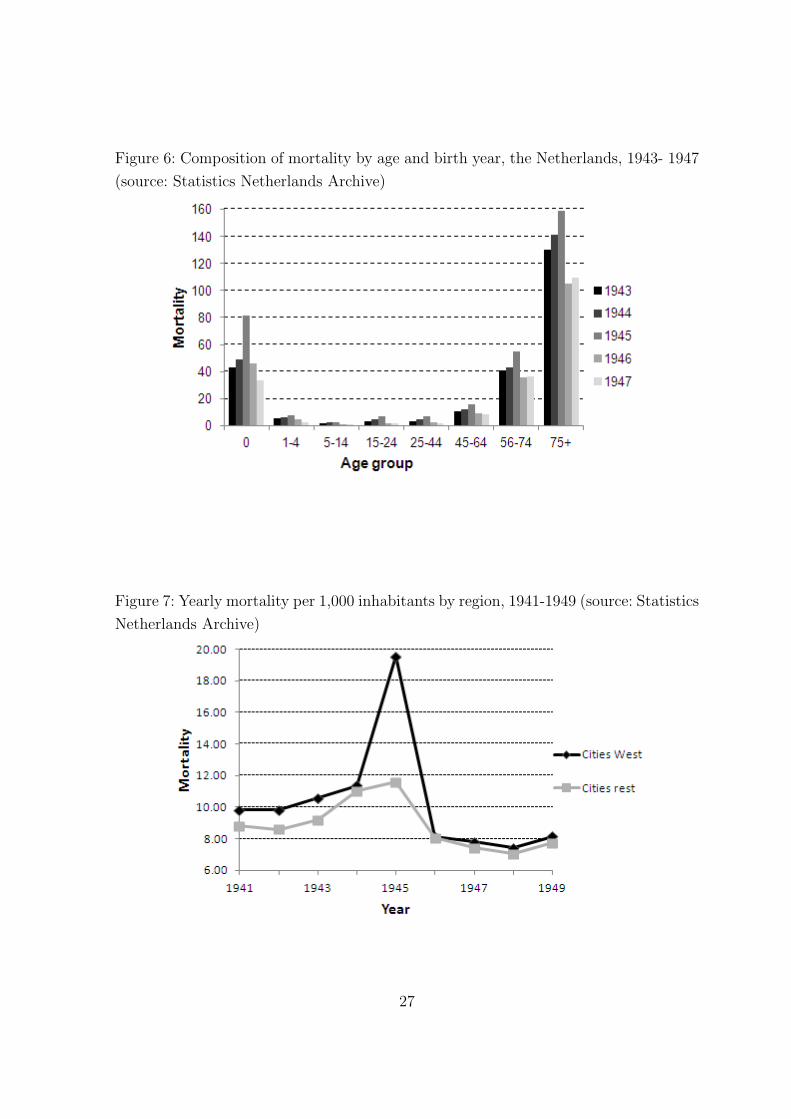
Figure 6: Composition of mortality by age and birth year, the Netherlands, 1943- 1947
(source: Statistics Netherlands Archive)
Figure 7: Yearly mortality per 1,000 inhabitants by region, 1941-1949 (source: Statistics
Netherlands Archive)
27
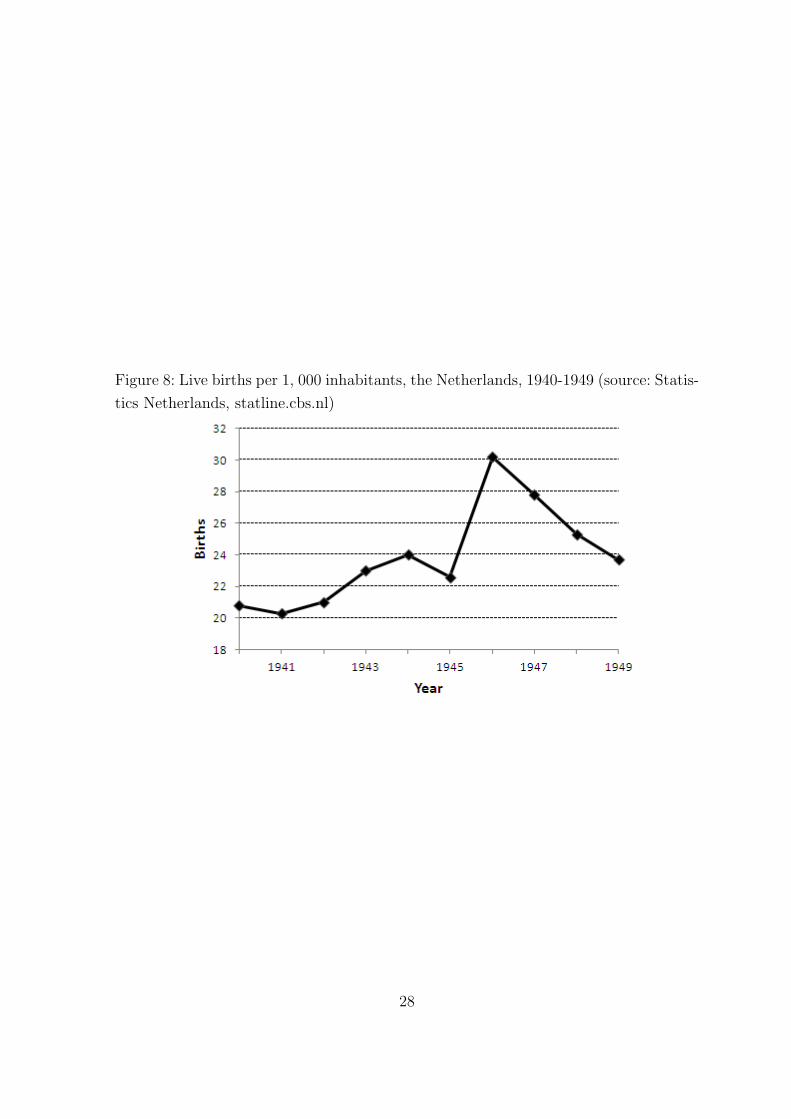
Figure 8: Live births per 1, 000 inhabitants, the Netherlands, 1940-1949 (source: Statis-
tics Netherlands, statline.cbs.nl)
28

Tab
le1:
Lis
tof
outc
ome
vari
able
s
Outc
om
eD
efinit
ion
Lab
orm
arke
t
Em
plo
ym
ent
Bin
ary
indic
ator
for
whet
her
the
indiv
idual
isin
pai
dem
plo
ym
ent
in19
99.
Lab
orin
com
eT
he
loga
rith
mof
the
fisc
alla
bor
inco
me
in19
99.
Hos
pita
liza
tion
Hos
pit
alB
inar
yin
dic
ator
for
atle
ast
one
hos
pit
alvis
it(a
llca
use
s)in
1999
-200
5.
CV
DB
inar
yin
dic
ator
for
atle
ast
one
card
iova
scula
r-re
late
dhos
pit
alvis
itin
1999
-200
5,
i.e.
ICD
-9C
Mco
des
390-
459.
Can
cer
Bin
ary
indic
ator
for
atle
ast
one
cance
r-re
late
dhos
pit
alvis
itin
1999
-200
5,
i.e.
ICD
-9C
Mco
des
140-
208.
29
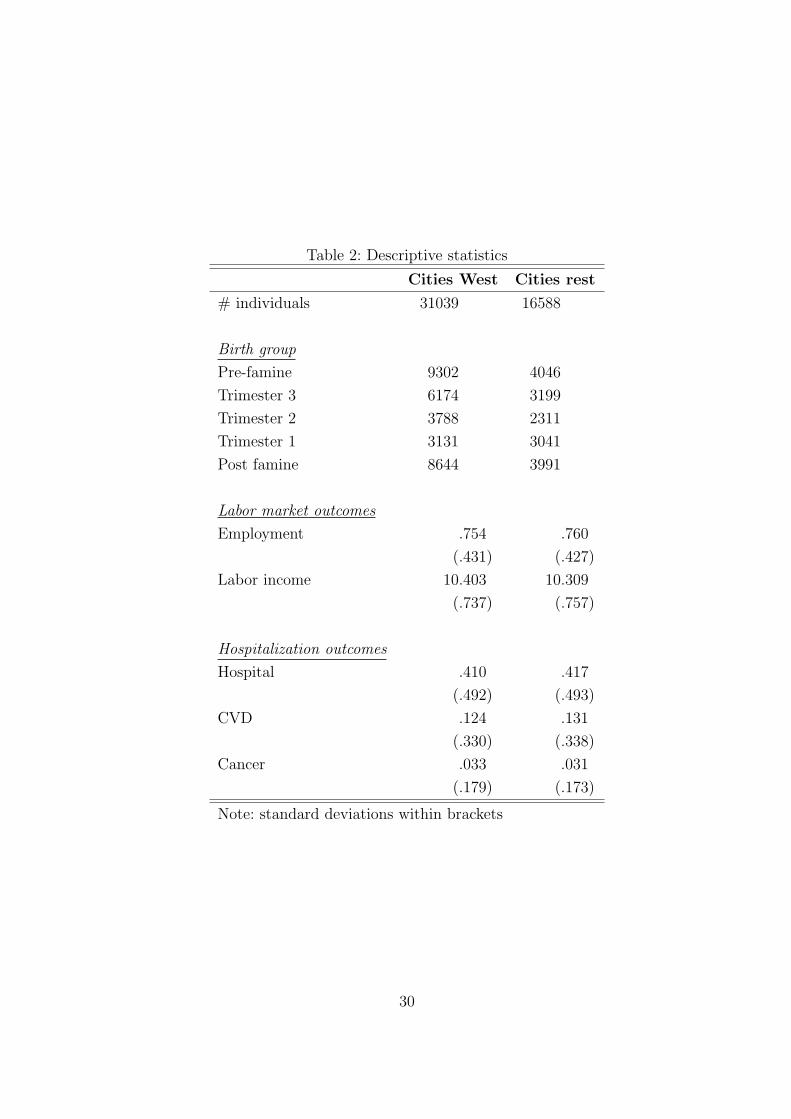
Table 2: Descriptive statistics
Cities West Cities rest
# individuals 31039 16588
Birth group
Pre-famine 9302 4046
Trimester 3 6174 3199
Trimester 2 3788 2311
Trimester 1 3131 3041
Post famine 8644 3991
Labor market outcomes
Employment .754 .760
(.431) (.427)
Labor income 10.403 10.309
(.737) (.757)
Hospitalization outcomes
Hospital .410 .417
(.492) (.493)
CVD .124 .131
(.330) (.338)
Cancer .033 .031
(.179) (.173)
Note: standard deviations within brackets
30
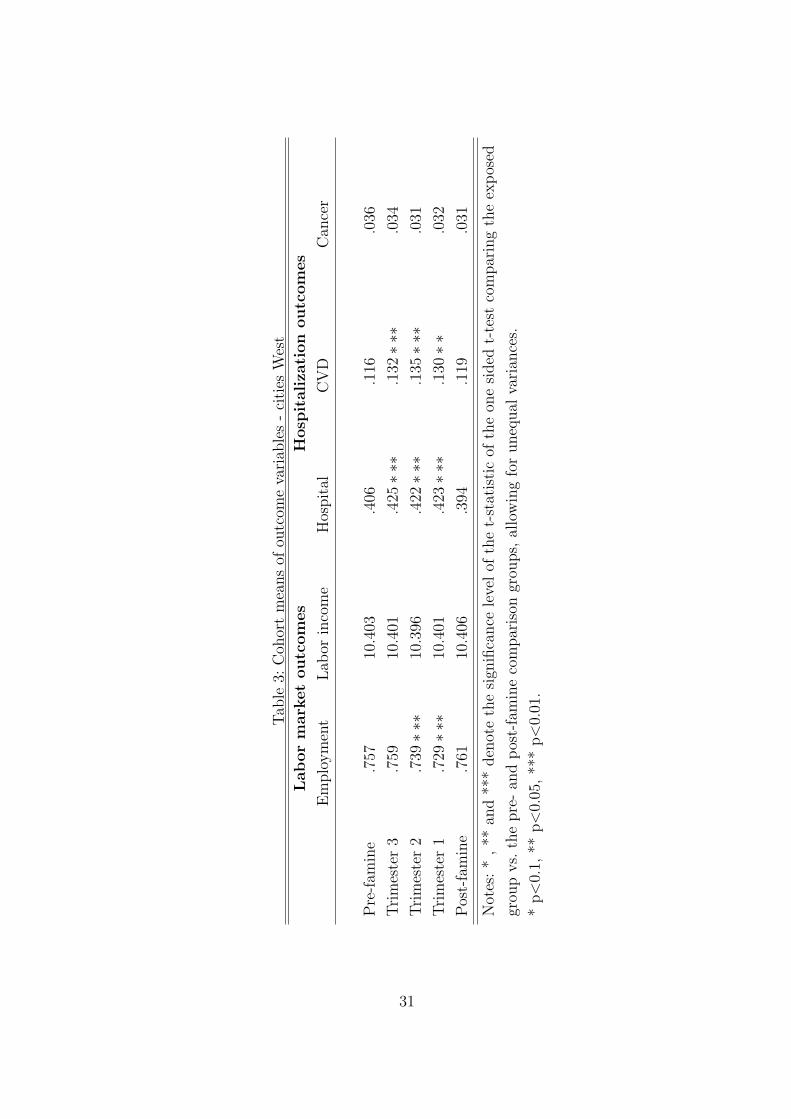
Tab
le3:
Coh
ort
mea
ns
ofou
tcom
eva
riab
les
-ci
ties
Wes
t
Labor
mark
et
outc
om
es
Hosp
italiza
tion
outc
om
es
Em
plo
ym
ent
Lab
orin
com
eH
ospit
alC
VD
Can
cer
Pre
-fam
ine
.757
10.4
03.4
06.1
16.0
36
Tri
mes
ter
3.7
5910
.401
.425∗∗∗
.132∗∗∗
.034
Tri
mes
ter
2.7
39∗∗∗
10.3
96.4
22∗∗∗
.135∗∗∗
.031
Tri
mes
ter
1.7
29∗∗∗
10.4
01.4
23∗∗∗
.130∗∗
.032
Pos
t-fa
min
e.7
6110
.406
.394
.119
.031
Not
es:*
,**
and
***
den
ote
the
sign
ifica
nce
leve
lof
the
t-st
atis
tic
ofth
eon
esi
ded
t-te
stco
mpar
ing
the
expos
ed
grou
pvs.
the
pre
-an
dpos
t-fa
min
eco
mpar
ison
grou
ps,
allo
win
gfo
runeq
ual
vari
ance
s.
*p<
0.1,
**p<
0.05
,**
*p<
0.01
.
31

Tab
le4:
Coh
ort
mea
ns
ofou
tcom
eva
riab
les
-ci
ties
rest
Labor
mark
et
outc
om
es
Hosp
italiza
tion
outc
om
es
Em
plo
ym
ent
Lab
orin
com
eH
ospit
alC
VD
Can
cer
Pre
-fam
ine
.760
10.3
14.4
40.1
36.0
40
Tri
mes
ter
3.7
6010
.280∗∗
.416
.132
.031
Tri
mes
ter
2.7
47∗
10.3
14.4
11.1
29.0
28
Tri
mes
ter
1.7
6210
.325
.418
.137
.027
Pos
t-fa
min
e.7
6810
.312
.396
.123
.027
Not
es:*
,**
and
***
den
ote
the
sign
ifica
nce
leve
lof
the
t-st
atis
tic
ofth
eon
esi
ded
t-te
stco
mpar
ing
the
expos
ed
grou
pvs.
the
pre
-an
dpos
t-fa
min
eco
mpar
ison
grou
ps,
allo
win
gfo
runeq
ual
vari
ance
s.
*p<
0.1,
**p<
0.05
,**
*p<
0.01
.
32

Tab
le5:
Est
imat
esof
fam
ine
expos
ure
effec
ts,bas
edon
bet
wee
n-c
ohor
tva
riat
ion
inth
efa
min
e-st
rick
enci
ties
Labor
mark
et
outc
om
es
Hosp
italiza
tion
outc
om
es
Em
plo
ym
ent
Lab
orin
com
eH
ospit
alC
VD
Can
cer
Tri
mes
ter
3−.
005
−.00
5.0
78∗∗∗
.065∗∗
.046
(.02
3)(.
014)
(.02
1)(.
027)
(.04
1)
Tri
mes
ter
2−.
068∗∗
−.01
0.0
70∗∗∗
.077∗∗
.011
(.02
6)(.
016)
(.02
5)(.
031)
(.04
8)
Tri
mes
ter
1−.
100∗∗∗
−.00
5.0
74∗∗∗
.054
.023
(.02
8)(.
019)
(.02
6)(.
033)
(.05
1)
Pre
-fam
ine
−.01
3−.
003
.031
−.01
5.0
71∗
(.02
1)(.
013)
(.01
9)(.
024)
(.03
6)
#in
div
idual
s31
039
2339
131
039
3103
931
039
Not
es:*
p<
0.1,
**p<
0.05
,**
*p<
0.01
.E
mplo
ym
ent,
hos
pit
al,C
VD
and
cance
res
tim
a-
ted
by
bin
ary
pro
bit
;la
bor
inco
me
by
OLS.R
obust
s.e.
’sw
ithin
bra
cket
s.
Not
ice
that
the
chro
nol
ogic
alor
der
goes
from
“pre
-fa
min
e”to
trim
este
rs3,
2an
d1.
33
Tab
le6:
Est
imat
esof
cohor
tva
riat
ion
inou
tcom
esin
citi
esin
the
rest
ofth
eco
untr
y
Labor
mark
et
outc
om
es
Hosp
italiza
tion
outc
om
es
Em
plo
ym
ent
Lab
orin
com
eH
ospit
alC
VD
Can
cer
Tri
mes
ter
3−.
026
−.03
2.0
50∗
.044
.063
(.03
3)(.
021)
(.03
0)(.
038)
(.06
0)
Tri
mes
ter
2−.
066∗
.002
.037
.029
.014
(.03
6)(.
023)
(.03
3)(.
042)
(.06
8)
Tri
mes
ter
1−.
019
.013
.055∗
.065∗
.008
(.03
3)(.
020)
(.03
0)(.
038)
(.06
3)
Pre
-fam
ine
per
iod
−.02
7.0
02.1
12∗∗∗
.062∗
.177∗∗∗
(.03
1)(.
019)
(.02
8)(.
036)
(.05
5)
#in
div
idual
s16
588
1261
516
588
1658
816
588
Not
es:*
p¡0
.1,**
p¡0
.05,
***
p¡0
.01.
Em
plo
ym
ent,
hos
pit
al,C
VD
and
cance
res
tim
a-
ted
by
bin
ary
pro
bit
;in
com
eby
OLS.R
obust
s.e.
’sw
ithin
bra
cket
s.
Not
ice
that
the
chro
nol
ogic
alor
der
goes
from
“pre
-fa
min
eper
iod”
totr
imes
ters
3,2
and
1,
wher
eea
chof
thes
enam
esre
fers
toth
eco
nte
mpor
aneo
us
inte
rval
inci
ties
inth
eW
est.
34

Tab
le7:
Est
imat
esof
fam
ine
expos
ure
effec
ts,bas
edon
wit
hin
-an
dbet
wee
n-
cohor
tva
riat
ion
Labor
mark
et
outc
om
es
Hosp
italiza
tion
outc
om
es
Em
plo
ym
ent
Lab
orin
com
eH
ospit
alC
VD
Can
cer
Inte
ract
ion
citi
esW
est
Xtr
imes
ter
3.0
15.0
31.0
70∗∗
.063
.044
(.03
5)(.
022)
(.03
2)(.
041)
(.06
2)
Inte
ract
ion
citi
esW
est
Xtr
imes
ter
2−.
003
−.01
1.0
77∗∗
.093∗∗
.053
(.04
0)(.
026)
(.03
8)(.
047)
(.07
5)
Inte
ract
ion
citi
esW
est
Xtr
imes
ter
1−.
087∗∗
−.01
4.0
62∗
.031
.069
(.03
9)(.
026)
(.03
6)(.
046)
(.07
2)
Tri
mes
ter
3−.
009
−.12
0∗∗∗
−.04
0−.
014
−.00
3
(.05
4)(.
033)
(.05
0)(.
063)
(.09
4)
Tri
mes
ter
2.0
20.0
69∗
.089
.079
−.05
9
(.06
4)(.
041)
(.05
9)(.
075)
(.11
3)
Tri
mes
ter
1−.
028
.100∗∗∗
.017
.061
−.13
1
(.05
2)(.
032)
(.04
8)(.
061)
(.09
3)
Cit
ies
Wes
t−.
017
.090∗∗∗
−.04
7∗∗∗
−.06
1∗∗∗
.003
(.01
9)(.
011)
(.01
7)(.
022)
(.03
3)
#m
onth
sbor
nbef
ore
May
1946
−.00
1.0
07∗∗∗
.005
.003
.001
(.00
4)(.
002)
(.00
3)(.
004)
(.00
6)
#in
div
idual
s47
627
3600
647
627
4762
747
627
Not
es:*
p<
0.1,
**p<
0.05
,**
*p<
0.01
.R
obust
s.e.
’sin
cluded
wit
hin
bra
cket
s.E
mplo
ym
ent,
hos
pit
al,C
VD
and
cance
res
tim
ated
by
bin
ary
pro
bit
;la
bor
inco
me
by
OLS.B
inar
yin
dic
ator
sfo
rm
onth
ofbir
thar
ein
cluded
inth
em
odel
but
are
omit
ted
from
the
table
.
35