Embed Size (px)
Citation preview
Long-run Effects of Villagization in Tanzania
Philip Osafo-Kwaako∗
This Draft: October 2011
Abstract
Developmental villages (vijiji uya maendeleo) were introduced in mainland Tanzania over the period 1974-
1982 as part of a large-scale resettlement program. This paper investigates the long-run impacts of these villages,
examining whether variation in intensity of the governments villagization program explains within-region vari-
ation in social capital outcomes today. An earlier body of social science research largely criticized Tanzania’s
villagization program as a failed example of large-scale state planning with adverse consequences for peasants.
Combining historic data on Tanzania from the 1970s and recent national household surveys, I first document that
developmental villages led to an increase in primary school completion rates. Today, districts which experienced
a high share of developmental villages have greater availability of public goods and report higher rates of partici-
pation in community activities. I also report instrumental variable estimates based on a drought which facilitated
the resettlement of peasants in these villages.
Keywords: social capital, state capacity, villages.
JEL Classification: P16, P32, N47
VERY PRELIMINARY — PREPARED FOR NEUDC CONFERENCE.
PLEASE DO NOT CITE.
∗I am grateful to James Robinson for encouraging me to work on this project, and to Nathan Nunn and Rick Hornbeck for their continued
advice. I have also benefitted from helpful suggestions from: Marcella Alsan, Jennifer Brea, Melissa Dell, James Feigenbaum, James Habya-
rimana, Horacio Larreguy, Ameet Morjaria, Tristan Reed, Christopher Robert and seminar participants at the Harvard Economic History Tea.
I also thank faculty at the University of Dar es Salaam, particularly Vincent Leyaro, Adolf Mkenda, and Issa Shivji for helpful discussions and
for assisting with data. Scott Walker and Horacio Larreguy provided helpful assistance with GIS datasets. I thank the NSF/AERC/IGC 2010
Agriculture Workshops for funding. All errors are my own. Contact email: [email protected].
1
1 Introduction
In States and Power in Africa, Jeffrey Herbst (2000) observes a recurring challenge concerning state development
in Africa: that central authorities have often faced the difficulty of broadcasting their power throughout their ter-
ritories. Since precolonial times, he argues, state development in Africa has been limited partly because of an
unfavorable political geography characterized by low population density. Given the relative land abundance in
many parts of Africa, scattered peasant populations presented a problem of state consolidation in newly indepen-
dent African states in the 1960s. The ability of the state to raise taxes, to defend its territorial boundaries, and
to provide public goods (enforcing property rights and providing social services) was hindered by large peasant
populations in the hinterland that often tended to avoid the control of central governments.
Since Chayanov (1966), the unique features of peasants in pre-capitalist societies has been noted in the liter-
ature: their primary concern with subsistence production, catering to needs of their households, and preserving
their traditional norms. Peasant households in Africa were also different from smallholder farming communities
in South Asia, where land scarcity and the need for investments in irrigation often required some dependence
on the state or markets for survival. In contrast, peasant communities in Africa relied predominantly on rain-fed
agriculture, and so remained independent of (”uncaptured by”) the state or other social classes such as capitalist
landlords (Hyden, 1980, pp.31). The exercise in state formation in newly independent Africa necessarily involved
bringing many such rural communities effectively under state administration.
This paper examines the impacts of an historical experiment in state capacity building in rural Africa. Specif-
ically, I examine the case of villagization which commenced in mainland Tanzania in 1973, and resulted in an
experiment of developmental villages between 1973 and 1982 in rural parts of Tanzania. An earlier body of social
science research, relying largely on village case studies, generally criticized this villagization program as a failed
example of large-scale state planning with adverse economic and ecological consequences for peasants (Scott,
1998). Villagization refers simply to the agglomeration of rural living units to facilitate state administration.
However, these government-planned villages in Tanzania in the 1970s (termed as developmental or registered vil-
lages) involved more than the concentration of rural populations. These villages introduced state capacity at the
local level by introducing village councils responsible for taxation, enforcement of property rights, and provision
of public goods. The experiment of development villages was largely halted in 1982 following the repeal of the
villages legislation and the commencement of an IMF economic liberalization program.
Using historical data from the 1978 Tanzania Census, I construct a measure of villagization as the fraction of
a district’s population living in registered or developmental villages. I then examine impacts of the villagization
treatment on various short- and long-run outcomes. Using the IPUMS microsample for the 1988 Tanzania census,
I first examine the short-run impact of the program on completion of primary education. I exploit variation in the
intensity of villagization across Tanzanian districts and differences in exposure to villagization across birth cohorts
2
due to the timing of the program, and document an increase in primary school completion for cohorts exposed to
the program.
For contemporary outcomes, I examine impacts of the program on public goods provision and community
participation. Using the 2009 Tanzania National Panel Household Survey, I find evidence of higher public good
provision and greater participation in community activities in treated districts today. The OLS regression results
are conditional on region fixed effects, and remain robust to controlling for various pre-treatment covariates such
as: geographic characteristics (latitude, slope, altitude, mean and standard deviation of long-run precipitation)
agricultural characteristics, health and education infrastructure, and per capita local government revenues.
A primary concern in my analysis is the problem of selection into the villagization treatment, and the need to
explain the source of the observed variation in treatment. The historical account of Tanzania during this period
highlight the occurrence of a drought in the mid-1970s which supported the government’s villagization program
(Hyden, 1980; Nyerere, 1977). The droughts in 1973-1975 facilitated peasant resettlement since with a bad har-
vest and the need for famine relief many peasants agreed to relocate to new government-planned villages. In
addition, ethnographic accounts suggest that higher ethnolinguistic fragmentation in a district hindered coopera-
tion and thus inhibited village formation (McHenry, 1979). I construct an instrument based on the interaction of
the drought severity and pre-treatment ethnic fragmentation which explains the observed variation in villagization
treatment across districts. I conduct falsification tests with this instrument by showing that interaction of ethnic
fragmentation with similar rainfall shocks in the three-year period preceding, and immediately following, the pe-
riod of villagization do not explain the observed variation in intensity of villagization. My instrumental variable
estimates support the OLS results above.
Next, I explore the possible channels of persistence. The historical accounts suggest two channels which are
likely to be important, namely: electoral participation (Cliffe, 1967; Barker and Saul, 1974) and the development
of local government fiscal capacities (Ngware and Haule, 1992). Using data from the Tanzanian National Electoral
Commission, I present some initial results on the electoral participation channel. Tanzania remained a one-party
state from 1960 to 1992, and the nationalist TANU/CCM party remains the dominant political party. I find that
treatment is associated today with reduced vote share for opposition parties, suggesting that areas which expe-
rienced high levels of government-planned villagization in the 1970s remain loyal supporters of the governing
TANU/CCM party.
This study contributes to several strands of research in the literature. First, it contributes to recent research
projects examining the subject of state capacity (Acemoglu, 2005; Besley and Persson, 2009; 2011b). An im-
portant component of this research project examines the case of developing countries where post-colonial states
have often been fragile and vulnerable (Besley and Persson, 2011a). In a sense, Tanzania’s villagization program
may be viewed as a good example of state development in the countryside involving the taxation of citizens,
enforcement of legal rights and spending on public goods. Collier, Radwan and and Wangwe (1986) note that
3
Tanzania’s development villages in the late-1970s performed these functions by controlling crop marketing and
communal production (taxation), allocating land among private cultivators (legal enforcement) and providing and
maintaining social infrastructure.
Second, the research project also contributes to the literature examining the historical determinants of social
capital and its importance for economic development. Following Putnam (1993), social capital is often viewed
as the set of social norms, trust and civic networks in a given society. The empirical literature for developing
countries suggests that social capital may help in solving the collective action problem at the local level and
improve economic outcomes (Wade, 1988; Narayan and Pritchett, 1999). Recent historical evidence suggests that
cultural norms relating to social capital could be persistent. The results of this study therefore complements recent
work examining the historical sources of differences in cultural norms of behavior (Guiso, Sapienza, and Zingales,
2007; Nunn and Wantchekon, 2010).
Third, this paper also provides insights into the legacy of large-scale development planning projects which
were widely implemented in the 1970s, in many developing countries (Chenery, 1971). Critics of such planning
projects often point to the specific case of Tanzania’s villagization policy as a prototypical example of failed large-
scale state planning in developing countries (Scott, 1998). My results in this paper suggest that, despite Tanzania’s
economic decline in the late-1970s, the state-led development program may have yielded other benefits.
The rest of this paper is organized as follows. In section 2, I present a historical overview of post-colonial
Tanzania, highlighting attempts by the government to encourage village formation and communal production. In
Section 3, I describe the various data sources. Next, I present the empirical strategy and OLS results in section 4,
followed by the IV-2SLS results in section 5. I briefly discuss channels of persistence in section 6, and conclude
in section 7.
2 Historical Overview of Village Formation
2.1 Phase I: 1961-1973
At independence in 1961, about 90 percent of the mainland Tanzanian population lived in the rural countryside
in scattered hamlets which were not organized into formal villages. A visiting World Bank team in 1959 urged
the country’s leadership to consider the settlement of sparsely populated areas which had agricultural development
potential (World Bank, 1961).1 The country’s low population density had often been highlighted in official records
by German and British colonial staff as an obstacle to economic development of the colony. Julius Nyerere,
president of the newly independent Tanzania, however advocated a more voluntary resettlement plan in which
exhortations and inducements (such as provision of clean water and schools) served as the major tools to encourage
1Other proposals were also offered to the Tanganyika leadership, for example, one based on the Israeli model of moshav village communities
which were similar to the kibbutzim but involved a lesser degree of communalization (Kaplan, 1961).
4
village formation. The use of exhortation to promote villagization was clearly evident in Nyerere’s inaugural
address:
[W]hat we must do is to try and make it possible for groups of farmers to get together and share
the cost and the use of a tractor between them. But we cannot even do this if our people are going to
continue living scattered over a wide area, far apart from each other...The first and absolute essential
thing to do, therefore, if we want to be able to start using tractors for cultivation, is to begin living in
proper villages...unless we do so we shall not be able to provide ourselves with the things we need
to develop our land and to raise our standard of living. We shall not be able to use tractors; we shall
not be able to build hospitals, or have clean drinking water, it will be quite impossible to start village
industries (Nyerere 1962: 183-4 quoted in Coulson, 1982).
There were isolated settlement schemes which autonomously formed in some parts of the country, often with a
nucleus of youth activists of the governing TANU party. The approach to rural development in the period follow-
ing independence involved largely the use of persistent persuasion to encourage progressive (yeomen) farmers to
adopt modern agricultural techniques in cultivating the main cash crops (sisal, coffee, cotton, tobacco and maize).
There were also a few government-planned settlements which were developed in mainland Tanzania (Hyden,
1980). With the exception of the Ruvuma Development Association (RDA), many such village settlements failed.
In a landmark speech in 1967, called the Arusha Declaration, Nyerere outlined a socialist vision for the Tanza-
nian state, which involved a policy of national economic self-reliance, nationalization of commercial farms and
industries, and the promotion of socialism in the villages (ujamaa vijijini).
The idealized ujamaa villages would involve a collection of peasant households working on communal farms,
and who via disciplined hardwork would gradually raise their living standards, and generate surplus income to
finance various social infrastructure. However, as the ujamaa philosophy was seen as extension of traditional
norms of cooperation in villages, Nyerere’s TANU party prevented the use of compulsion in starting new villages.
In the years following the Arusha Declaration, various inducements - such as the provision of social infrastructure
(schools, clean water and dispensaries) - were the main instruments used to promote village formation. By 1973,
official estimates suggest that nearly 10 percent of rural households lived in some form of a village.
2.2 Phase II: 1973-1982
However, given the slow pace of village formation, in November 1973, the Nyerere administration announced the
mandatory resettlement of all peasant households into villages by the end of 1976. Villages were to be established
within the stipulated 35-month window, and were to be termed as registered or developmental villages (vijiji uya
maendeleo). The major relocations were broadly termed as Operation Sogeza (meaning moving in Swahili). In a
span of 20 months, there was a remarkable transformation of the Tanzanian countryside, with nearly 85 percent of
all rural households now living in some form a village. New villages were hastily planned and with a minimum
of 250 families needed. The actual implementation of Operation Sogeza varied across regions, but in most cases
5
operations were divided into a number of stages with a time-table involving: identifying existing location of
farmers, selecting new village sites, and final resetttlement (McHenry, 1979).
Although several factors may have contributed to the relative success of villagization across districts, drought
conditions which hit several parts of Tanzania in the mid-1970s appear to have been the turning point for many
peasant households. The anthropological literature has often highlighted the independence of the peasant mode of
production in Tanzania, as many rural households often engaged in subsistence production without much concern
for the broader activities of the nation-state. The droughts of the mid-1970s however created the need for famine
relief which was provided in newly planned villages, and for farmers without a harvest, the costs of relocation was
lowered. I revisit the use of the drought severity as an instrument for the intensity of villagization at the district
level in Section 5 on my IV-2SLS results.
2.3 Institutional Features of Developmental Villages, 1973-1982
The new developmental villages were not simply agglomerations of rural households but involved institutional
changes legislated in the Villages and Ujamaa Villages Act of July 1975. The reforms in village administration
in rural Tanzania approximately spanned the period 1974-1982 until the repeal of the Act, the commencement of
an economic liberalization program, and the announcement of President Nyerere’s imminent resignation (Shivji
and Peters, 2003; IMF, 1983; IMF 2009). Chieftaincies which had served as a focal point of native administration
during the colonial period had been abolished by the TANU administration in 1963, and all lands nationalised to
be under the control of the Presidency2. Villagization therefore reorganized the Tanzanian countryside with four
main institutional changes (Verhagen, 1980; Collier, Radwan and Wangwe, 1986).
First, all adult residents in a village became members of a Village Assembly, which met at least once a year.
Policy-making at the village level was delegated to a Village Council (with a Chairman and CEO), and elected by
the Village Assembly. Further, the Village Council established five committees responsible for finance, produc-
tion, education, works and defense. Second, the developmental village, once registered, was legally entitled to take
contract loans and engage in economic activity such as marketing of crop produce. Co-operatives which had pre-
viously dominated the crop marketing chain were abolished, with their functions now handled by village councils.
With all lands effectively nationalised, the Village Council was also empowered to allocate land among private cul-
tivators. Third, the village also mobilized the local community to support the provision and maintenance of social
infrastructure. Finally, the village became the center of development planning. Village development plans were
designed and forwarded to the district and regional administrators for review and implementation. In 1978, about
4000 development managers were appointed and deployed to live in registered villages to assist in preparation of
village development plans.
2Chiefaincies were abolished following the legislation of the African Chiefs Ordinance (Repeal) Act, 1963.
6

This episode of village participatory development was largely halted in the early 1980s when village councils
lost their significance as units for economic planning or for governance and decision-making. Specifically, in
1982, the Villages and Ujamaa Village Act was repealed and replaced with the more orthodox Local Government
(District Authorities) Act (1982, No 7). Decision making in these new local governments was directed from
central government officials, and suffered from the ”lack of democratic participation from below” (Shivji and
Peters, 2003, pp. 13). Nyerere also announced his decision not to contest the 1985 presidential election, while
Tanzania embarked on an economic liberalization program supported by the IMF (IMF, 1983; IMF, 2009). The
IMF adjustment program involving liberalization of agricultural markets, removal of domestic price controls, and
reform of parastatals withdrew many government subsidies previously channeled to village councils (Skarstein,
2005).
3 Data
I examine the long-run effects of the late 1970s villagization by examining their impacts on education, community
participation and public good provision in Tanzania today. The villagization treatment varies at the district level
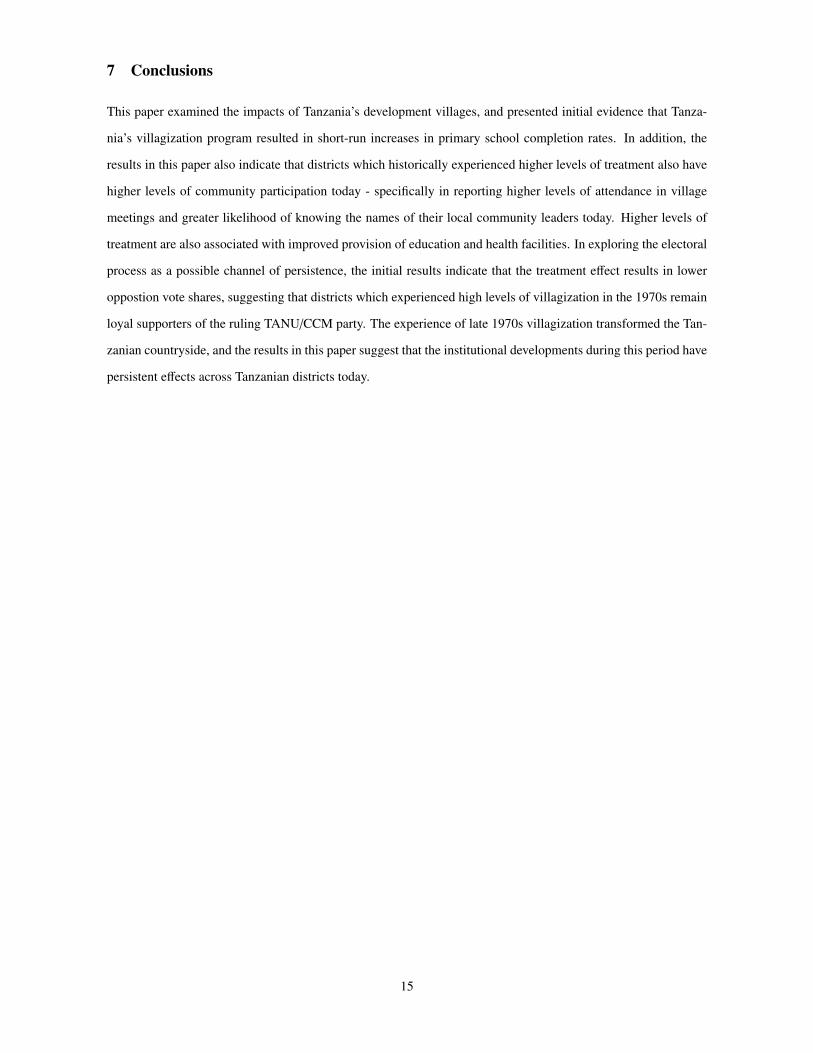
and is constructed using data from village gazetteers in the 1978 Tanzania National Census. I focus on the district,
as this administrative unit remained the center of political and economic activity in the period following indepen-
dence (Iliffe, 1975). Using 1978 boundaries, I calculate the treatment measure for each district as the share of the
population living in developmental or registered villages:
Td =Pd,r
Pd,t(1)
where Pd,r refers to population in all registered villages in district, d and Pd,t is the total population in district, d.
Figure 1 provides a graphical illustration of the spatial variation in treatment intensities.
For outcome measures, I use two main sources: the IPUMS microsample of the 1988 Tanzania census and the
2008/2009 Tanzania National Household Panel Survey. The IPUMS dataset provides a 10 percent microsample
of the 1988 Tanzania census, with about 2.4 million persons. In the subsection examining short-run education
outcomes, I restrict my analyses to cohorts aged between 1 and 24 in 1974 comprised of about 820,000 individuals
in mainland Tanzania. The Tanzania National Household Panel Survey (2008/9) is the first wave of a nationally
representative household survey conducted by the Tanzania National Bureau of Statistics, and forms part of the
World Bank’s Living Standard Measurement Surveys (LSMS). The survey includes separate units for a household
survey, a community module, and an agricultural survey. The household survey is comprised of a nationally
representative sample of 3280 households and about 16710 individuals. The household module also records
respondents’ districts of birth, thus enabling me to link migrants to their initial districts of birth. In examining
7
electoral outcomes today as a possible channel of persistence, I utilze results of the 2010 Tanzania presidential
election results, as obtained from the National Electoral Commission of Tanzania.
Precipitation data is obtained from the Tanzania Meteorological Agency (TMA). Previous research on Africa
with climate data often utilized global gridded datasets in which precipitation and temperature data are obtained
by spatially interpolating information from selected rainfall stations. For most parts of Africa, the low density of
stations used in the spatial interpolation implies that very local climate variability may not be adequately detected.
For example, the East Anglia Climate Research Unit (CRU) data for Tanzania is based on observations for only
three stations (Dar es Salaam, Songea and Tabora). Therefore, in this project, in order to investigate the local
variation in drought conditions needed for my IV-2SLS estimates, I obtained data on 108 rainfall stations in
Tanzania covering the period 1960-2010. Many rainfall stations in the TMA network have been in existence since
the colonial period under the East Africa Meteorological Agency (EAMA, 1962). I calculate district-level mean
precipitation for the villagization period based on 1978 district boundaries.
Finally district-level geographic controls are also used, including the long-run precipitation (mean and standard
deviation), latitude, mean area weighted elevation and slope, distance from the centroid of each district to the coast
and to the nearest railway line (in 1975). Pre-treatment controls are obtained from Jensen (1968) which provides
district-level data on demographic characteristics, health infrastructure, schools and education enrollment rates,
local government revenues, agricultural characteristics and economic activity. Details of the data compilation
process are provided in Appendix A. Table 1 provides a summary of district characteristics.
4 Program Effects
4.1 Short-run Effects on Education
I begin by studying the expansion of educational outcomes in Tanzania in the 1970s, which was viewed as a central
component of the villagization program (Nyerere,1977; Mbilinyi, 1976). In contrast to other large education ex-
pansion programs financed by resource booms during this period (e.g. in Indonesia (Duflo, 2001), in Nigeria (Osili
and Long, 2008)), Tanzania’s program was achieved via village councils in development villages using informal
labor for the construction of primary schools and teachers’ quarters under the direction of regional government of-
ficials (Stabler, 1979; Sheffield, 1979). The sudden implementation of the villagization program (1974-1976) and
its variation across districts induces differences in exposure across various year of birth cohorts. This motivates a
difference-in-differences estimator of the treatment effect as in Duflo (2001). The program commenced in 1974,
and Tanzanian government policy stipulated school enrollment for children aged 7-13 years. Therefore children
aged 1-6 years in 1974 were fully exposed to the villagization experiment whereas cohorts aged 14-19 fall out of
the prescribed education window and may have made their primary education decisions prior to the commence-
8
ment of the program3. The IPUMS subsample for the 1988 Tanzania census, provides educational attainment and
district of residence on about 2.3 million observations. I assume that the district of current residence is highly
correlated with the district of education.
An overview of the results of the program on completion of primary education is presented in the two-by-two
matrix in Table 2. High and low treatment areas are respectively districts that fall in the top and bottom quintiles
of the villagization distribution. Panel A presents the experiment of interest comparing primary school completion
rates for children aged 1-6 years in 1974 (and thus were fully exposed to the villagization experiment during their
primary school years), to those aged 14-19 years who had little or no exposure. Primary education rates increase
over the period in both high and low treatment areas by 0.29 and 0.18 points respectively. Under the identifying
assumption that high and low treatment areas would have experienced similar increases in educational attainment,
the difference in differences may be interpreted as the causal effect of the program. As shown in Table 2, primary
school completion rates increased by about 11.5 percentage points more in high treatment areas copmared with
low treatment areas during the villagization period.
In Panel B, I provide results for a control experiment which compares education completion for two cohorts
of children, aged 14-19 and 20-25 in 1974. As both cohorts were not exposed to the program during their years
of primary education, we would not expect to see any significant difference between primary completion rates
for these two groups. The difference in difference estimate in Panel B is about 0.9 percentage points, and not
significantly different from zero - suggesting that primary school completion would not have evolved differently
in high and low treatment areas in the absence of the program.
Below, I provide more precise estimates of the effect of the program in a regression framework. Specifically,
consider the fixed effects regression:
Pidt = c1 + α j + βk + (T j ∗ Ei)γ1 + (C j ∗ Ei)δ1 + εidt (2)
where Pidt is a dummy equal to one for primary school completion, Ei is a ”young” dummy equal to one if
the individual was 6 years or younger in 1974, and thus exposed to the program, α j and βk are respectively fixed
effects for districts of birth and year of birth, T j refers to the villagization intensity in district j, and C j is a vector of
controls of pre-treatment characteristics for district j. The identification assumption here requires that no omitted
time-varying and district-specific effects are correlated with the treatment intensity of the program. Therefore,
to address possible omitted variables, I present results controlling for the interaction of the ”young” dummy
with various pre-treatment district characteristics such as primary school enrollment rates, health infrastructure,
demographic, agricultural and geographic characteristics.
Table 3 presents the results, comparing cohorts aged 1-6 (in 1974) to those aged 14-19 years in 1974. The
3Delayed enrollment and grade repetition implies that some of the older cohorts would be treated, and in this case should bias my results
downwards against finding a treatment effect.
9
baseline regression without controls is presented in column 1, while in columns (2), (3) and (4) I successively
control for pre-treatment education enrollment, health characteristics and finally all controls. The results indicate
that moving from zero to full villagization increased the probability of primary school completion by about 13
percentage points. In Panel B, I repeat this exercise but now comparing cohorts aged 14-19 years in 1974 to those
aged 20-25 in 1974 (i.e. the control experiment in Table 2 above). In this case, the coefficients are are much
smaller, and not significant.
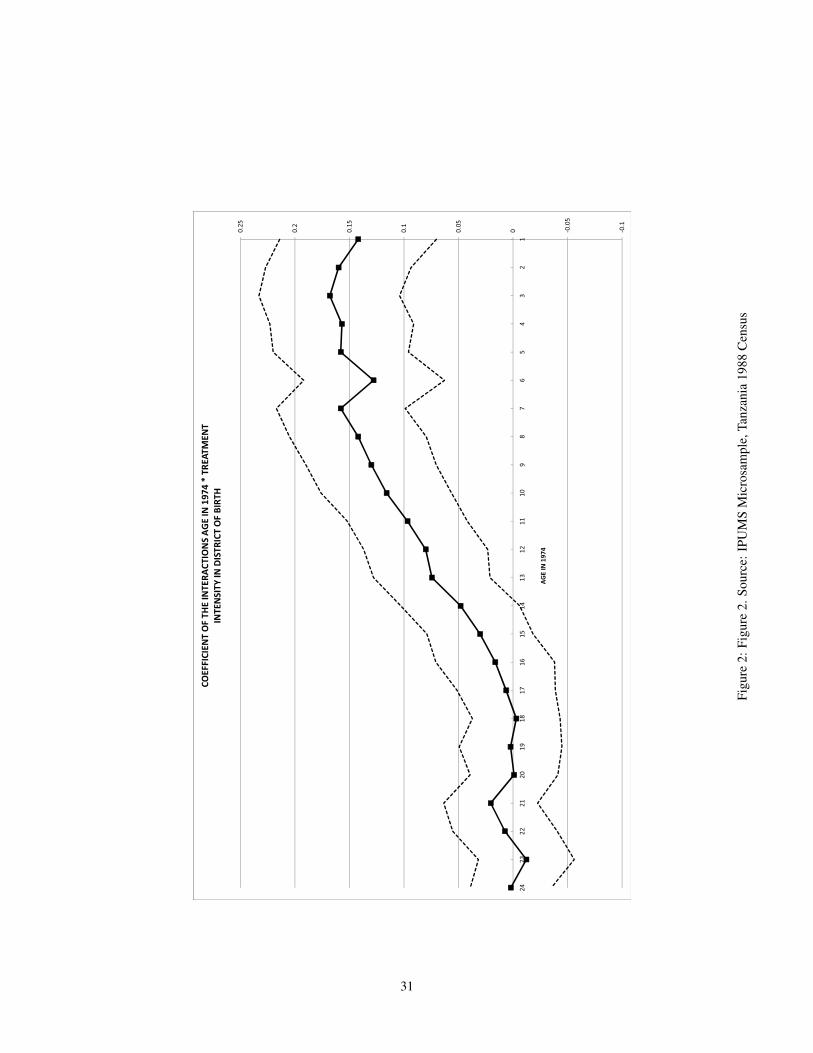
Finally, I extend the analysis in equation (2) above to examine impacts of the treatment on education comple-
tion for various age cohorts. I run the following regression:
Pidt = c1 + α j + βk +
24∑
l=1
(T j ∗ dil)γ1l + (C j ∗ Ei)δ1 + εidt (3)
where dil refers to a year of birth dummy for individual i. The omitted dummy category is for l=26. For each
cohort, the coefficient γ1l provides estimates for the impact of the villagization treatment. We would therefore
expect no impact of the program on cohorts aged 14 and above in 1974 who would have completed their primary
education prior to the introduction of development village. Similarly, we expect the effect of the treatment to be
positive for cohorts aged 13 and below (in 1974) and for this effect to increase for younger cohorts. Table 4 below
provides evidence in support of this observation. The coefficients on the interaction of age cohort and treatment
intensity are positive and significant for younger cohorts up to cohorts aged 14 in 1974. For older cohorts, aged
between 15 and 24 in 1974, the coefficient is smaller and no longer significant. Figure 2 displays these coefficients.
The rise in the coefficients begin for cohorts aged 17, although the 95 percent confidence intervals include zero,
up until cohorts aged 13 years in 1974. The positive coefficients for cohorts aged 14-17 may be partly the result of
these cohorts being partly treated if some older individuals were still enrolled in school in 1974. This may be likely
given previous evidence of delayed primary enrollment in Tanzania (Bommier and Lambert, 1999). Overall, the
discussion in this section provides some evidence that the villagization program yielded some short-term impacts
in primary education completion in treated areas.
4.2 Effects on Community Participation and Public Goods Provision
Next, I examine impacts of the villagization program on current levels of community participation and public
goods provision. My baseline estimating equation examines the relationship between the degree of villagization
in an individual’s district and the outcome variable, Yid. This is presented in a regression framework as:
Yid = β(Td) + δr + Z′dφ + X
′iλ + εid (4)
10
where Td refers to a historical measure of treatment intensity in district d, δr is a region fixed effect, and Zd and
Xi are respectively district and individual controls. In all specifications above, standard errors are clustered at the
district level based on 1978 boundaries. When examining district-level outcomes, I run regressions similar to (2)
above, but with district level outcomes. The coefficient of interest is β, which provides a point estimate of the
relationship between villagization treatment and the outcome variable of interest. The individual level controls X′i
are for age, gender, and marital status; while the district controls are for various pre-treatment characteristics such
as geographic characteristics, demographic composition, agricultural output, economic activity, local government
revenues, and health and education infrastructure.
The OLS results based on equation (4) above are presented for social capital outcomes and public goods
provision in Tables 5 and 6. My results indicate that, conditional on region fixed effects, individuals born in
treated districts today have higher levels of attendance of local community meetings, and also are more likely to
correctly name their village executive officer. These results remain robust to the inclusion of a variety of controls.
Thus, a 1 standard deviation increase in villagization treatment increases the probability of participating in village
meetings today by about 6 percentage points, and also results in a 5 percentage point increase in ability to correctly
name the local community leader.
Next, table 6 examines the impact of treatment on provision of health and education infrastructure. Again,
villagization treatment is associated with an increased probability of a community having a government primary
school and a health facility. The treatment effect is significant across various specifications. For example, a 1
standard deviation increase in treatment is associated with a 9 percentage point increase in the probability of
having a school in the local community today.
5 Instrumental Variable Results
In this section, I consider the use of instrumental variables. The results in the previous section suggest that,
conditional on various controls, treatment had significant effects on current levels of community participation
and public goods provision. However, these results could still be biased if there are omitted variables correlated
with the historical measure of villagization treatment. To address this problem, an instrument is needed which is
correlated with historic treatment intensities, but uncorrelated with any other district or individual characteristics
which may affect our outcome variables today. The instrument is motivated by two observations which influenced
villagization: the incidence of prolonged droughts in the 1970s which coincided with the time period for imple-
mentation of villagization, and secondly, the variation in ethnolinguistic fragmentation across districts prior to
village formation.
First, the incidence of droughts which occurred across parts of Tanzania between 1973-1975 is well docu-
mented in the historical literature (Nyerere, 1977) and was important for two reasons. First, famine relief which
11
was typically provided following such natural disasters would be selectively allocated to new village sites to en-
courage resettlement, and second, the poor harvests reduced the costs of relocation for many peasant farmers.
Hyden (1980, pp 146-147) summarizes this view:
Villagization coincided with the drought that hit large parts of Tanzania in 1973/74. It is fair to
say that from the viewpoint of the objectives of villagization, the drought was a blessing in disguise in
that in many areas it facilitated the movement of people. There was little they left behind on the land
and consequently it was easier for them to accept living in new villages. It is one of the reasons why
some people did not object to moving but did so without government pressure...[W]eather continued
to play havoc with agricultural production in some areas during 1974/75 and there was clearly a limit
to what the peasants could produce before having settled in properly.
Using precipitation data covering 108 stations in Tanzania for the period 1960-2010 from the Tanzania Meteoro-
logical Agency, I compute a precipitation index for each district as the mean monthly total precipitation during the
main (masika) rainy seasons in 1973-1975 divided by the long-term average masika precipitation for the 50-year
period, with this index censored at 1. A higher precipitation index means less severe drought. I also examine a
standardized rainfall measure by substracting the district long-term mean rainfall from the 1973-1975 mean and
dividing by the standard deviation, with this index censored at zero. Maize served as the major food crop for most
peasant communities (Herrick et al, 1968), and the censoring of the drought measure is based on agricultural field
experiments for maize which suggest minimal benefits from increasing rainfall above its long-run mean levels (see
Hollinger and Chagnnon, 1993; and Dell (2011)). Panel A of table 7A shows the relationship between 1973-75
drought severity and villagization intensity.
Secondly, ethnic and linguistic diversity hindered communication and cooperation, so that village formation
was likely to be more successful in less ethnically fragmented districts (McHenry (1979, pp 176).4. Thus we
would expect village formation to be lower in districts which were more ethnicallly and linguistically fragmented
(i.e. higher ELF index). The ethnolinguistic fragmentation, ELF, is calculated from the 1967 Tanzania National
Census (prior to the Arusha Declaration) and with the usual formulation in the literature, ELFd = (1 − ∑ e2id),
where ei is the fraction of the population in district, d, belonging to ethnic group, i.
I use the interaction of the drought and ethnolinguistic fragmentation as the instrument, while controlling for
the direct effect of ELF. Specifically, I examine the first-stage by regressing the villagization treatment intensity
(Td) on the instrument as follows:
Td = γ0 + γ1Rain f all ∗ ELF + γ2ELF + X′dλ + εd (5)
where Xd is a vector of controls including geographic characteristics and district pre-treatment characteristics.
4von Freyhold (1979, pp 142) provides an example of such an encounter between two neighboring ethnic groups in Ilala district attempting
to move into a common ujamaa village: ”According to the Tibili villagers it was the Tibili site that was intended to be the site of the Ujamaa
village all along. According to the Chanika villagers it was the Chanika site, and it was only when they went to cut poles to start house
building that they realized that the village was to be at Tibili, for the government lorry dropped the poles at the Tibili site. When the villagers
complained, there was an argument during which the divisional executive officer announced that Tibili was the approved site and that those
who were not interested in building at Tibili could stay out.”
12
The geographic controls include controls for latitude, slope, altitude, and the mean and standard deviation of
precipitation over the period 1960-2010. We expect the coefficient γ1¡0 since both higher rainfall and higher ELF
result in less village formation. The results of the first stage regressions are provided in Table 7A. Columns (1) and
(2) present results interacting the ethnolinguistic fragmentation with the ratio of mean precipitation to the long run
mean, while columns (3) and (4) show the interaction with the standardized precipitation index. In all cases, there
is a negative and significant relationship between the instrument and the intensity of villagization. However, the
instruments are a bit weak (F-stat ranging between 6.00 and 9.4), and thus suggesting that the IV-2SLS estimates
are likely to be biased towards my OLS estimates (Bound, Jaeger, and Baker 1995; Staiger and Stock 1997).
For this instrument to be valid, the exclusion restrictions require that the droughts within this specific window
of villagization affects our outcome variables today only via the villagization channel, and so is uncorrelated
with other factors which determine contemporary outcomes. Although this cannot be formally tested, I conduct
two further falsification exercises based on placebo droughts which may have occurred in the three-year period
just prior to (1970-1972) and just following (1976-1978) the implementation of the villagization policy. This
provides a further check to ensure that village formation is not simply occurring in drought-prone areas, but
occurs specifically in areas which experienced droughts during the stipulated time period for villagization. In both
placebo checks, I do not find a significant relationship between drought severity and the intensity of villagization
(Table 7B).
Using the instrument above, I examine the 2SLS regressions for the community participation and public goods
provision outcomes in Tables 8 and 9. For the results on attendance of community meetings in Table 8, the IV es-
timates yields a treatment effect wth a point estimate of 0.67 (s.e.=0.24) in the preferred regression in column (6).
This result includes controls for geographic characteristics and pre-treatment agricultural, health and education
characteristics. Thus a 1 standard deviation increase in villagization treatment resulted in about a 12 percentage
point increase in participation rates in community meetings. Similarly, the size of the point estimates for the treat-
ment effect for the ability to name the local village official similarly remains positive. In the preferred regression
model (6), the coefficient on treatement is 0.63 (s.e.=0.32). The size of the estimated treatment effect for the
outcomes on public good provision are positive for the primary school outcome variable, and significant in many
specifications. Overall, the IV-2SLS estimated impact is larger: for example, for the primary school outcomes in
Table 9, the probability of having a government primary school increases from about 0.398 (s.e.=0.114) in the
OLS regression in column 3, to 0.795 (s.e.=0.401) in the IV regression in column 6. The increase in magnitude
of the point estimates in the IV regressions may be because the instrument, in this instance, estimates the impact
of villagization treatment on the outcome variable for those districts (compliers) in which village formation was
induced by drought and low ethnic fragmentation.
13
6 Channels of Persistence
The discussion thus far presents villagization essentially as a package of institutional reforms in the Tanzanaian
countryside which has resulted in long-term effects on community participation and public goods provision. In
this section, I attempt to unpack the specific components of the reform program which may be important. The
historical account suggests two channels which may be important namely: electoral participation (Cliffe, 1967;
Barker and Saul, 1974) and the development of local government fiscal capacities (Ngware and Haule, 1992).
First, the widespread mobilization in developmental villages in the late 1970s raised the political conscious-
ness of many Tanzanian citizens, and encouraged high levels of participation in national elections. The electoral
democracy channel may therefore be one channel through which the historical differences persist today. Second,
these government-planned villages introduced some form of (informal) taxation among village residents for most
of the 1970s. Such taxation occurred either via working on village farms, participating in communal activities to
maintain village infrastructure such as granaries, or selling produce to village cooperatives (Collier, Radwan and
Wangwe, 1986). The poll tax introduced by British colonial officials proved highly unpopular had been abolished
by Nyerere’s TANU government in the years following Independence. Thus besides the implicit taxation of agri-
cultural produce (by state marketing co-operatives), the informal taxation imposed by village councils constituted
the next major form of taxation imposed on peasants in the countryside. Households and officials in highly villag-
ized districts therefore historically obtained greater experience in taxation, and it is plausible that these effects may
persist today. I investigate (in future revisions) whether variation in fiscal capacity of Tanzanian districts today
may be explained by within-region variations in historic villagization experiences.
Below I present some initial results exploring the electoral participation channel. Tanzania remained a one-
party state from 1960 to 1992, and the nationalist TANU/CCM party dominates both parliamentary and presiden-
tial elections in Tanzania. I therefore use the combined share of votes received by opposition parties as a measure
of electoral competition. Results are presented in Table 10 using data from the 2010 presidential elections. I
find that, conditional on region fixed effects, treated districts are associated today with a reduced vote share for
opposition parties. These preliminary OLS results are robust to the inclusion of various demographic, agricultural
and geographic controls. These results suggest that treated districts which experienced high levels of government-
planned villagization in the late 1970s remain loyal supporters of the governing TANU/CCM party. In a model of
distributive politics, in which elected officials reward their loyal bases (for example, as in Cox and McCubbins,
1986), then the continued allegiance of treated districts to the TANU/CCM may partly explain the higher provision
of public goods available in these districts.
14
7 Conclusions
This paper examined the impacts of Tanzania’s development villages, and presented initial evidence that Tanza-
nia’s villagization program resulted in short-run increases in primary school completion rates. In addition, the
results in this paper also indicate that districts which historically experienced higher levels of treatment also have
higher levels of community participation today - specifically in reporting higher levels of attendance in village
meetings and greater likelihood of knowing the names of their local community leaders today. Higher levels of
treatment are also associated with improved provision of education and health facilities. In exploring the electoral
process as a possible channel of persistence, the initial results indicate that the treatment effect results in lower
oppostion vote shares, suggesting that districts which experienced high levels of villagization in the 1970s remain
loyal supporters of the ruling TANU/CCM party. The experience of late 1970s villagization transformed the Tan-
zanian countryside, and the results in this paper suggest that the institutional developments during this period have
persistent effects across Tanzanian districts today.
15
References
[1] Barkan, Joel D. (1984), Politics and Public Policy in Kenya and Tanzania, New York: Praeger Publishers
[2] Barker, JS and Saul JS (1974), The Tanzania Elections in Post-Arusha Perspective, in Socialism and Partici-
pation: Tanzania’s 1970 Elections, Dar es Salaam: Tanzania Publishing House Ltd.
[3] Besley, T. and Persson T. (2009), The Origins of State Capacity: Property Rights, Taxation and Politics,
American Economic Review 99, 1218-1244
[4] Besley, T. and Persson T., (2011a), Fragile States and Development Policy, LSE, mimeo
[5] Besley, T. and Persson T. (2011b), Pillars of Prosperity, forthcoming, Princeton: Princeton University Press
[6] Bommier A and S Lambert (1999), Education Demand and Age at School Enrollment in Tanzania, Journal of
Human Resources, XXXV(1)
[7] Bound, John, David A. Jaeger, and Regina M. Baker, (1995), Problems with Instrumental Variables Estima-
tion When the Correlation between the Instruments and the Endogenous Explanatory Variable Is Weak, J.
American Statis. Assoc. 90 (June): 44350.
[8] Chayanov AV (1966), The Theory of the Peasant Economy, Homewood Ill: Richard D. Irwin, Inc.
[9] Chenery, H (Ed.) (1971), Studies in Development Planning, Boston: Harvard University Press
[10] Cliffe Lionel (1967), One Party Democracy: The 1965 Tanzania General Elections, Nairobi: East African
Publishing House
[11] Collier, P., Radwan R and Wangwe, S., (1986), Labour and poverty in rural Tanzania : ujamaa and rural
development in the United Republic of Tanzania, Oxford: Clarendon Press
[12] Coulson A (1982), Tanzania: A Political Economy, New York: Oxford University Press
[13] Dell, M (2011), Insurgency, agrarian reform, and long-run development: Lessons from the Mexican Revolu-
tion, mimeo Massachusetts Institute of Technology
[14] Cox, Gary W., and Mathew D. McCubbins, (1986), Electoral Politics as a Redistributive Game, Journal of
Politics, 48 (2) (1986), 370-389.
[15] EAMA (1962) Monthly and annual rainfall in Tanganyika and Zanzibar during the 30 years, 1931-1960.
[16] Gellner, Ernest and Charles Micaud, eds., (1972), Arabs and Berbers: From Tribe to Nation in North Africa,
Lexington, Mass.: D. C. Heath and Co.
[17] Government of Tanzania, (1968), 1967 Tanzania Population Census, Dar es Salaam : United Republic of
Tanzania, Central Census Office
[18] Government of Tanzania, (1979), 1978 Population Census, Dar es Salaam : United Republic of Tanzania,
Bureau of Statistics, Ministry of Planning and Economic Affairs
[19] Guiso, Luigi, Paola Sapienza, and Luigi Zingales, (2007) Long-Term Persistence, University of Chicago
mimeo
[20] Herbst, Jeffrey (2000), States and Power in Africa: Comparative lessons in authority and control, Princeton:
Princeton University Press
[21] Herrick AB, Harrison SA, John HJ, MacKnight S, Skapa B (1968), Area Handbook for Tanzania, Washington
DC: US Government Printing Office
[22] Hollinger S and Changnon S (1993), Response of corn and soybean yields to precipitation augmentation and
implications for weather modification in Illinois, Bulletin 73
[23] Hyden, Goran (1980), Beyond Ujamaa in Tanzania: Underdevelopment and an uncaptured peasantry, Lon-
don: Heinemann Educational Books
16
[24] Iliffe J. (1975) in Tanzania in Maps edited by L. Berry, London: University of London Press
[25] IMF (2009), Tanzania - The Story of An African Transition, Washington DC: International Monetary Fund
[26] Jensen (1968), Government of Tanzania District Statistics, Dar es Salaam: Government Printers
[27] Kaplan, B. (1961), New settlement and agricultural development in Tanganyika, (unpublished paper) Dar es
Salaam
[28] Mamdani, M. (1996), Citizen and Subject: Contemporary Africa and the Legacy of Late Colonialism, Prince-
ton: Princeton University Press
[29] Mbilinyi M.J., (1976) Peasants’ Education in Tanzania, The African Review (Dar es Salaam), 6 (2)
[30] McHenry, Dean E., (1979), Tanzania’s Ujamaa villages: The Implementation of a Rural Development Strat-
egy, Berkeley: Institute of International Studies
[31] Miguel, Edward (2004), Tribe or Nation? Nation Building and Public Goods in Kenya versus Tanzania.,
World Politics 56, no. 3 (2004): 327-362
[32] Narayan D. and L. Pritchett, (1999), Cents and Sociability: Household Incomes and Social Capital in Rural
Tanzania, Economic Development and Cultural Change, 47:4 (July 1999)
[33] Nyerere, Julius (1967), Education for Self-Reliance, Dar es Salaam: Government Printers
[34] Nyerere, Julius (1977), Arusha Declaration: Ten Years After, Dar es Salaam: Government Printers
[35] Ngware S. and M. Haule (1992), The Forgotten Level: Village Government in Tanzania, Hamburg: Institut
fuer Afrika-Kunde
[36] Nunn N. and Wantchekon L., (2009), The Slave Trade and the Origins of Mistrust in Africa, NBER Working
Paper No. 14783
[37] Omari, CK, (Ed.) (1984), Towards rural development in Tanzania: Some issues on policy implementation in
the 1970s. Arusha: Eastern Africa Publications Limited
[38] Osili, U. O. and B. T. Long (2008), Does female schooling reduce fertility? Evidence from Nigeria, Journal
of Development Economics 87 (2008) 57 75
[39] Prewitt, K., (Ed.) (1971), Education and Political Values: An East African Case Study, Nairobi: East African
Publishing House
[40] Putnam, Robert D. (1993), Making Democracy Work, Princeton: Princeton University Press
[41] Scott, James C. (1999), Seeing Like a State: How Certain Schemes to Improve the Human Condition have
Failed, New Haven: Yale University Press
[42] Scott, James C. (2009), The Art of Not Being Governed: An Anarchist History of Upland Southeast Asia,
New Haven: Yale University Press
[43] Sheffield, J.R. (1979), Basic Education for the Rural Poor: The Tanzanian Case, Journal of Developing
Areas, Vol. 14, No. 1 (Oct., 1979)
[44] Shivji Issa, G. and Peter, Chris M., (2003), Village Democracy Initiative Report, Prepared for The President’s
Office - Regional Administration and Local Government
[45] Skarstein, R. (2005), Economic Liberalization and Smallholder Productivity in Tanzania. From Promised
Success to Real Failure, 19851998, Journal of Agrarian Change 5 (3)
[46] Stabler, E., (1979), Kenya and Tanzani: Strategies and Realities in Education and Development, African
Affairs (London) 78(310): 33-56
[47] Staiger, Douglas, and James H. Stock. 1997. Instrumental Variables Regression with Weak Instruments.
Econometrica 65 (May): 55786.
17

[48] Verhagen, K., (1980) Tanzanian Rural Development Policy, 1975-78, Development and Change, Vol 11
(1980), 285-95
[49] von der Muhll, George (1971), Education, Citizenship and Social Revolution in Tanzania, in Education and
Political Values: An East African Case Study (ed. Kenneth Prewitt), Nairobi: East African Publishing House
[50] Wade, R., 1988. Village Republics. Cambridge University Press, Cambridge.
[51] World Bank (1961), The Economic Development of Tanganyika, Baltimore: Johns Hopkins University Press
18
Figure 1: Figure 1: District Treatment Intensities. Source: Tanzania National Census, 1978
19
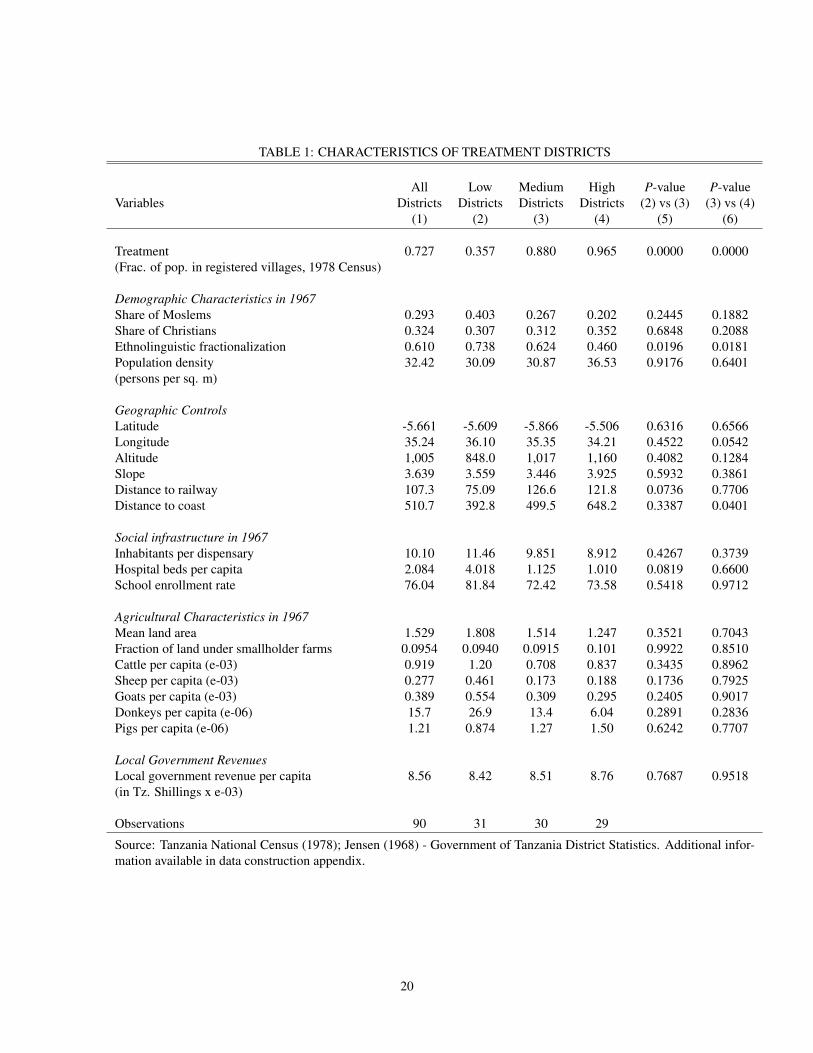
TABLE 1: CHARACTERISTICS OF TREATMENT DISTRICTS
All Low Medium High P-value P-value
Variables Districts Districts Districts Districts (2) vs (3) (3) vs (4)
(1) (2) (3) (4) (5) (6)
Treatment 0.727 0.357 0.880 0.965 0.0000 0.0000
(Frac. of pop. in registered villages, 1978 Census)
Demographic Characteristics in 1967Share of Moslems 0.293 0.403 0.267 0.202 0.2445 0.1882
Share of Christians 0.324 0.307 0.312 0.352 0.6848 0.2088
Ethnolinguistic fractionalization 0.610 0.738 0.624 0.460 0.0196 0.0181
Population density 32.42 30.09 30.87 36.53 0.9176 0.6401
(persons per sq. m)
Geographic ControlsLatitude -5.661 -5.609 -5.866 -5.506 0.6316 0.6566
Longitude 35.24 36.10 35.35 34.21 0.4522 0.0542
Altitude 1,005 848.0 1,017 1,160 0.4082 0.1284
Slope 3.639 3.559 3.446 3.925 0.5932 0.3861
Distance to railway 107.3 75.09 126.6 121.8 0.0736 0.7706
Distance to coast 510.7 392.8 499.5 648.2 0.3387 0.0401
Social infrastructure in 1967Inhabitants per dispensary 10.10 11.46 9.851 8.912 0.4267 0.3739
Hospital beds per capita 2.084 4.018 1.125 1.010 0.0819 0.6600
School enrollment rate 76.04 81.84 72.42 73.58 0.5418 0.9712
Agricultural Characteristics in 1967Mean land area 1.529 1.808 1.514 1.247 0.3521 0.7043
Fraction of land under smallholder farms 0.0954 0.0940 0.0915 0.101 0.9922 0.8510
Cattle per capita (e-03) 0.919 1.20 0.708 0.837 0.3435 0.8962
Sheep per capita (e-03) 0.277 0.461 0.173 0.188 0.1736 0.7925
Goats per capita (e-03) 0.389 0.554 0.309 0.295 0.2405 0.9017
Donkeys per capita (e-06) 15.7 26.9 13.4 6.04 0.2891 0.2836
Pigs per capita (e-06) 1.21 0.874 1.27 1.50 0.6242 0.7707
Local Government RevenuesLocal government revenue per capita 8.56 8.42 8.51 8.76 0.7687 0.9518
(in Tz. Shillings x e-03)
Observations 90 31 30 29
Source: Tanzania National Census (1978); Jensen (1968) - Government of Tanzania District Statistics. Additional infor-
mation available in data construction appendix.
20
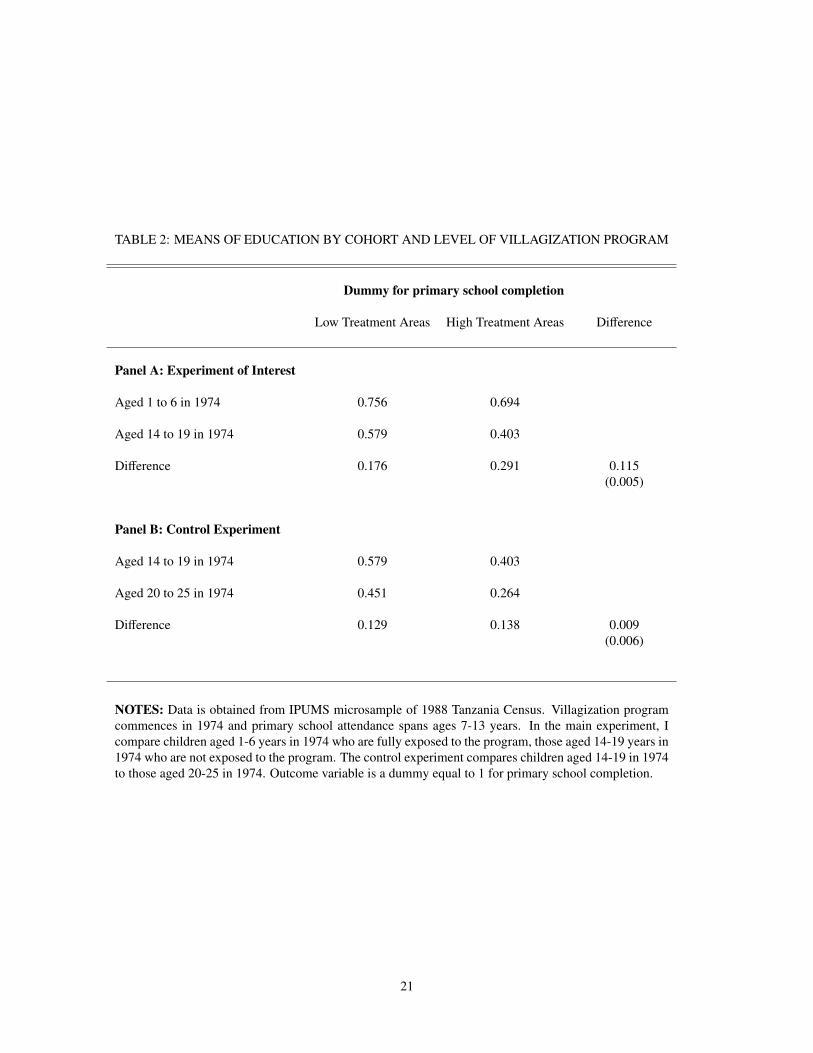
TABLE 2: MEANS OF EDUCATION BY COHORT AND LEVEL OF VILLAGIZATION PROGRAM
Dummy for primary school completion
Low Treatment Areas High Treatment Areas Difference
Panel A: Experiment of Interest
Aged 1 to 6 in 1974 0.756 0.694
Aged 14 to 19 in 1974 0.579 0.403
Difference 0.176 0.291 0.115
(0.005)
Panel B: Control Experiment
Aged 14 to 19 in 1974 0.579 0.403
Aged 20 to 25 in 1974 0.451 0.264
Difference 0.129 0.138 0.009
(0.006)
NOTES: Data is obtained from IPUMS microsample of 1988 Tanzania Census. Villagization program
commences in 1974 and primary school attendance spans ages 7-13 years. In the main experiment, I
compare children aged 1-6 years in 1974 who are fully exposed to the program, those aged 14-19 years in
1974 who are not exposed to the program. The control experiment compares children aged 14-19 in 1974
to those aged 20-25 in 1974. Outcome variable is a dummy equal to 1 for primary school completion.
21
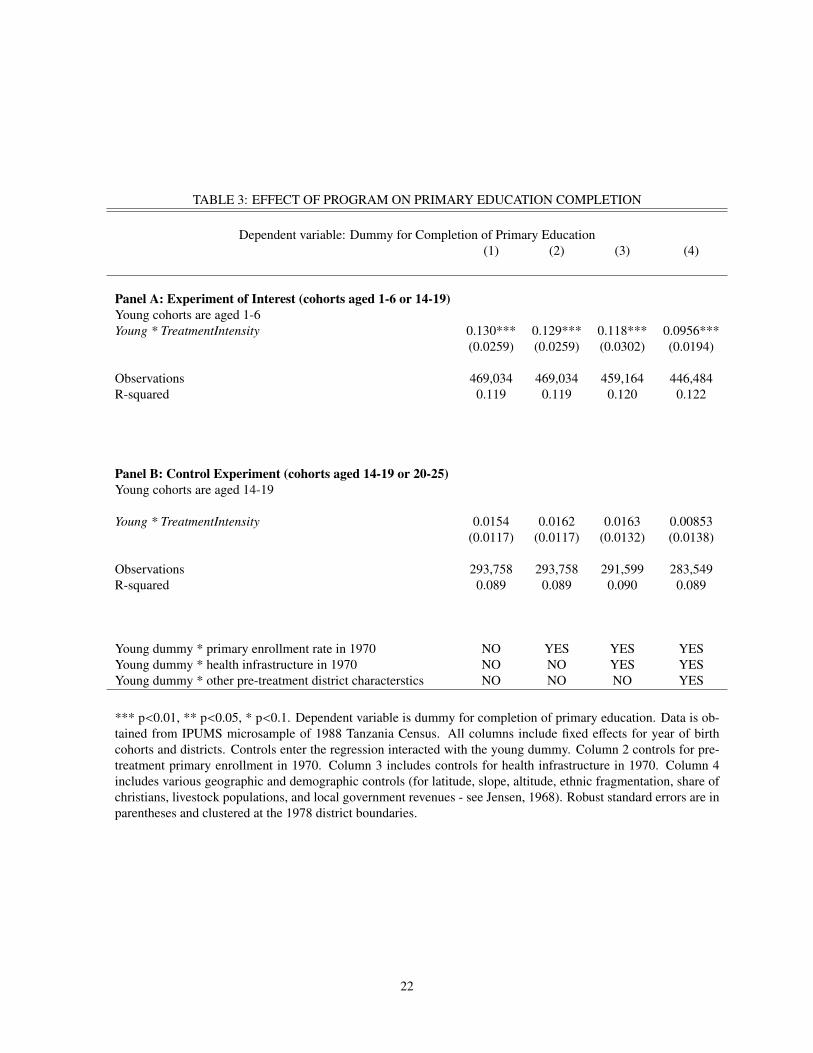
TABLE 3: EFFECT OF PROGRAM ON PRIMARY EDUCATION COMPLETION
Dependent variable: Dummy for Completion of Primary Education
(1) (2) (3) (4)
Panel A: Experiment of Interest (cohorts aged 1-6 or 14-19)Young cohorts are aged 1-6
Young * TreatmentIntensity 0.130*** 0.129*** 0.118*** 0.0956***
(0.0259) (0.0259) (0.0302) (0.0194)
Observations 469,034 469,034 459,164 446,484
R-squared 0.119 0.119 0.120 0.122
Panel B: Control Experiment (cohorts aged 14-19 or 20-25)Young cohorts are aged 14-19
Young * TreatmentIntensity 0.0154 0.0162 0.0163 0.00853
(0.0117) (0.0117) (0.0132) (0.0138)
Observations 293,758 293,758 291,599 283,549
R-squared 0.089 0.089 0.090 0.089
Young dummy * primary enrollment rate in 1970 NO YES YES YES
Young dummy * health infrastructure in 1970 NO NO YES YES
Young dummy * other pre-treatment district characterstics NO NO NO YES
*** p<0.01, ** p<0.05, * p<0.1. Dependent variable is dummy for completion of primary education. Data is ob-
tained from IPUMS microsample of 1988 Tanzania Census. All columns include fixed effects for year of birth
cohorts and districts. Controls enter the regression interacted with the young dummy. Column 2 controls for pre-
treatment primary enrollment in 1970. Column 3 includes controls for health infrastructure in 1970. Column 4
includes various geographic and demographic controls (for latitude, slope, altitude, ethnic fragmentation, share of
christians, livestock populations, and local government revenues - see Jensen, 1968). Robust standard errors are in
parentheses and clustered at the 1978 district boundaries.
22
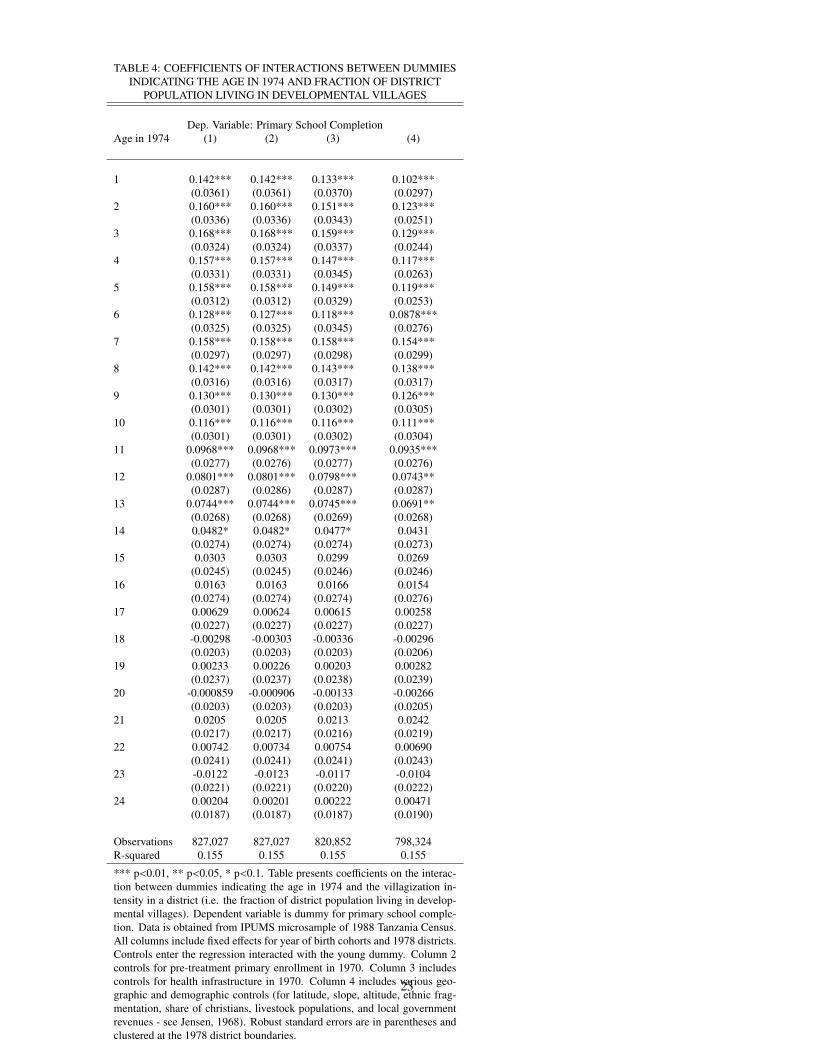
TABLE 4: COEFFICIENTS OF INTERACTIONS BETWEEN DUMMIES
INDICATING THE AGE IN 1974 AND FRACTION OF DISTRICT
POPULATION LIVING IN DEVELOPMENTAL VILLAGES
Dep. Variable: Primary School Completion
Age in 1974 (1) (2) (3) (4)
1 0.142*** 0.142*** 0.133*** 0.102***
(0.0361) (0.0361) (0.0370) (0.0297)
2 0.160*** 0.160*** 0.151*** 0.123***
(0.0336) (0.0336) (0.0343) (0.0251)
3 0.168*** 0.168*** 0.159*** 0.129***
(0.0324) (0.0324) (0.0337) (0.0244)
4 0.157*** 0.157*** 0.147*** 0.117***
(0.0331) (0.0331) (0.0345) (0.0263)
5 0.158*** 0.158*** 0.149*** 0.119***
(0.0312) (0.0312) (0.0329) (0.0253)
6 0.128*** 0.127*** 0.118*** 0.0878***
(0.0325) (0.0325) (0.0345) (0.0276)
7 0.158*** 0.158*** 0.158*** 0.154***
(0.0297) (0.0297) (0.0298) (0.0299)
8 0.142*** 0.142*** 0.143*** 0.138***
(0.0316) (0.0316) (0.0317) (0.0317)
9 0.130*** 0.130*** 0.130*** 0.126***
(0.0301) (0.0301) (0.0302) (0.0305)
10 0.116*** 0.116*** 0.116*** 0.111***
(0.0301) (0.0301) (0.0302) (0.0304)
11 0.0968*** 0.0968*** 0.0973*** 0.0935***
(0.0277) (0.0276) (0.0277) (0.0276)
12 0.0801*** 0.0801*** 0.0798*** 0.0743**
(0.0287) (0.0286) (0.0287) (0.0287)
13 0.0744*** 0.0744*** 0.0745*** 0.0691**
(0.0268) (0.0268) (0.0269) (0.0268)
14 0.0482* 0.0482* 0.0477* 0.0431
(0.0274) (0.0274) (0.0274) (0.0273)
15 0.0303 0.0303 0.0299 0.0269
(0.0245) (0.0245) (0.0246) (0.0246)
16 0.0163 0.0163 0.0166 0.0154
(0.0274) (0.0274) (0.0274) (0.0276)
17 0.00629 0.00624 0.00615 0.00258
(0.0227) (0.0227) (0.0227) (0.0227)
18 -0.00298 -0.00303 -0.00336 -0.00296
(0.0203) (0.0203) (0.0203) (0.0206)
19 0.00233 0.00226 0.00203 0.00282
(0.0237) (0.0237) (0.0238) (0.0239)
20 -0.000859 -0.000906 -0.00133 -0.00266
(0.0203) (0.0203) (0.0203) (0.0205)
21 0.0205 0.0205 0.0213 0.0242
(0.0217) (0.0217) (0.0216) (0.0219)
22 0.00742 0.00734 0.00754 0.00690
(0.0241) (0.0241) (0.0241) (0.0243)
23 -0.0122 -0.0123 -0.0117 -0.0104
(0.0221) (0.0221) (0.0220) (0.0222)
24 0.00204 0.00201 0.00222 0.00471
(0.0187) (0.0187) (0.0187) (0.0190)
Observations 827,027 827,027 820,852 798,324
R-squared 0.155 0.155 0.155 0.155
*** p<0.01, ** p<0.05, * p<0.1. Table presents coefficients on the interac-
tion between dummies indicating the age in 1974 and the villagization in-
tensity in a district (i.e. the fraction of district population living in develop-
mental villages). Dependent variable is dummy for primary school comple-
tion. Data is obtained from IPUMS microsample of 1988 Tanzania Census.
All columns include fixed effects for year of birth cohorts and 1978 districts.
Controls enter the regression interacted with the young dummy. Column 2
controls for pre-treatment primary enrollment in 1970. Column 3 includes
controls for health infrastructure in 1970. Column 4 includes various geo-
graphic and demographic controls (for latitude, slope, altitude, ethnic frag-
mentation, share of christians, livestock populations, and local government
revenues - see Jensen, 1968). Robust standard errors are in parentheses and
clustered at the 1978 district boundaries.
23
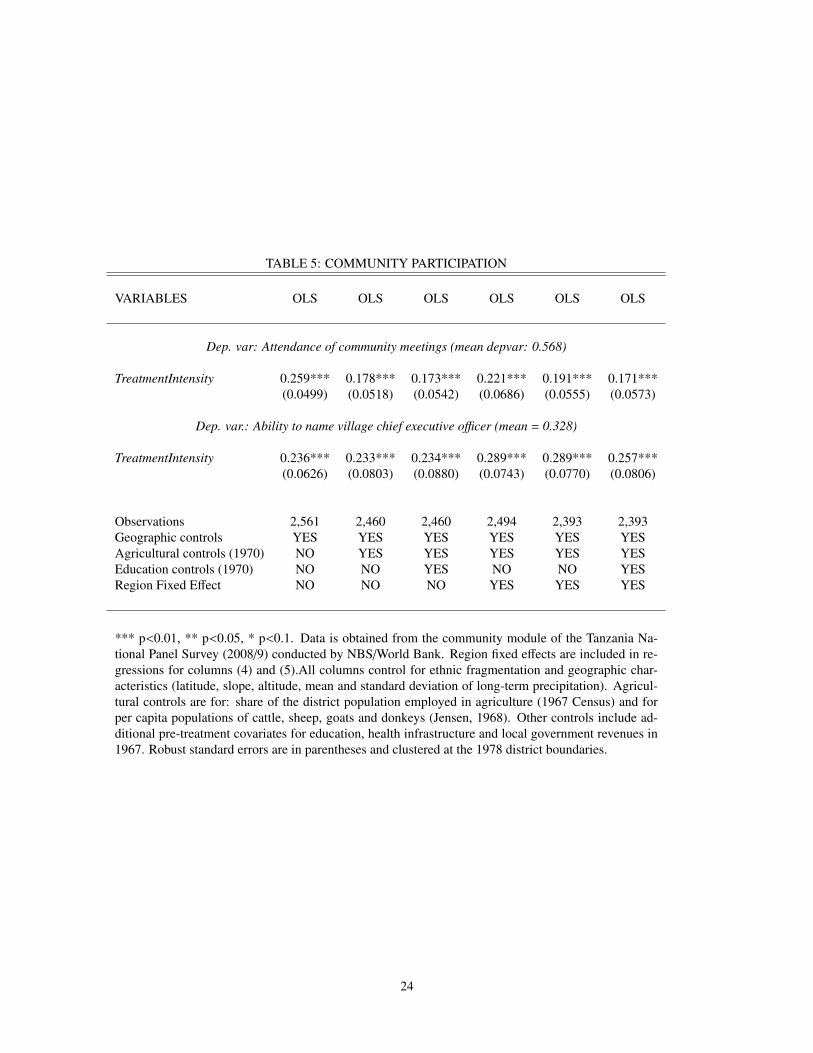
TABLE 5: COMMUNITY PARTICIPATION
VARIABLES OLS OLS OLS OLS OLS OLS
Dep. var: Attendance of community meetings (mean depvar: 0.568)
TreatmentIntensity 0.259*** 0.178*** 0.173*** 0.221*** 0.191*** 0.171***
(0.0499) (0.0518) (0.0542) (0.0686) (0.0555) (0.0573)
Dep. var.: Ability to name village chief executive officer (mean = 0.328)
TreatmentIntensity 0.236*** 0.233*** 0.234*** 0.289*** 0.289*** 0.257***
(0.0626) (0.0803) (0.0880) (0.0743) (0.0770) (0.0806)
Observations 2,561 2,460 2,460 2,494 2,393 2,393
Geographic controls YES YES YES YES YES YES
Agricultural controls (1970) NO YES YES YES YES YES
Education controls (1970) NO NO YES NO NO YES
Region Fixed Effect NO NO NO YES YES YES
*** p<0.01, ** p<0.05, * p<0.1. Data is obtained from the community module of the Tanzania Na-
tional Panel Survey (2008/9) conducted by NBS/World Bank. Region fixed effects are included in re-
gressions for columns (4) and (5).All columns control for ethnic fragmentation and geographic char-
acteristics (latitude, slope, altitude, mean and standard deviation of long-term precipitation). Agricul-
tural controls are for: share of the district population employed in agriculture (1967 Census) and for
per capita populations of cattle, sheep, goats and donkeys (Jensen, 1968). Other controls include ad-
ditional pre-treatment covariates for education, health infrastructure and local government revenues in
1967. Robust standard errors are in parentheses and clustered at the 1978 district boundaries.
24
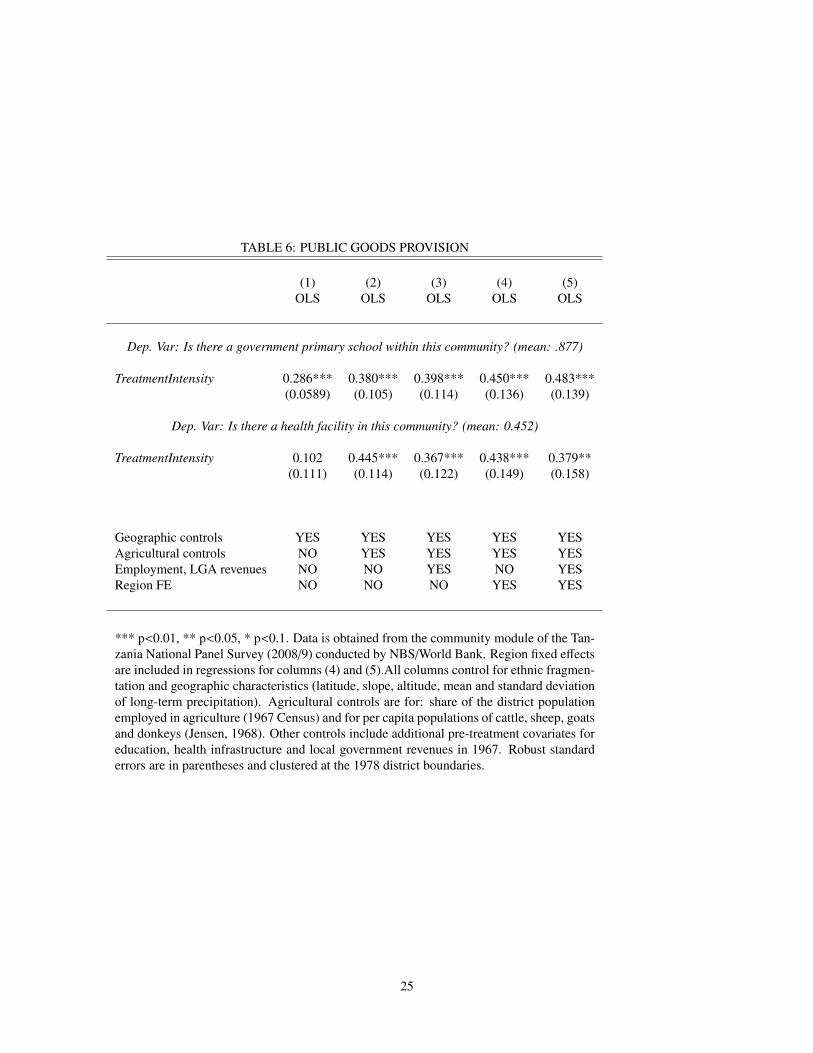
TABLE 6: PUBLIC GOODS PROVISION
(1) (2) (3) (4) (5)
OLS OLS OLS OLS OLS
Dep. Var: Is there a government primary school within this community? (mean: .877)
TreatmentIntensity 0.286*** 0.380*** 0.398*** 0.450*** 0.483***
(0.0589) (0.105) (0.114) (0.136) (0.139)
Dep. Var: Is there a health facility in this community? (mean: 0.452)
TreatmentIntensity 0.102 0.445*** 0.367*** 0.438*** 0.379**
(0.111) (0.114) (0.122) (0.149) (0.158)
Geographic controls YES YES YES YES YES
Agricultural controls NO YES YES YES YES
Employment, LGA revenues NO NO YES NO YES
Region FE NO NO NO YES YES
*** p<0.01, ** p<0.05, * p<0.1. Data is obtained from the community module of the Tan-
zania National Panel Survey (2008/9) conducted by NBS/World Bank. Region fixed effects
are included in regressions for columns (4) and (5).All columns control for ethnic fragmen-
tation and geographic characteristics (latitude, slope, altitude, mean and standard deviation
of long-term precipitation). Agricultural controls are for: share of the district population
employed in agriculture (1967 Census) and for per capita populations of cattle, sheep, goats
and donkeys (Jensen, 1968). Other controls include additional pre-treatment covariates for
education, health infrastructure and local government revenues in 1967. Robust standard
errors are in parentheses and clustered at the 1978 district boundaries.
25
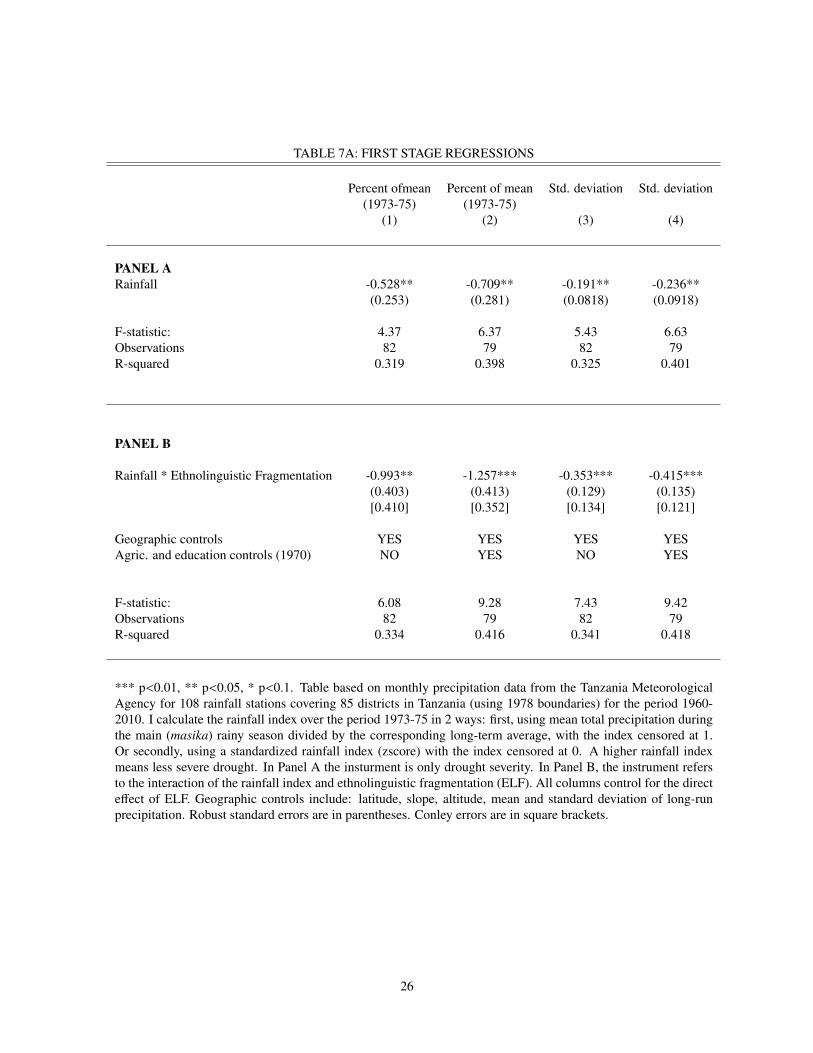
TABLE 7A: FIRST STAGE REGRESSIONS
Percent ofmean Percent of mean Std. deviation Std. deviation
(1973-75) (1973-75)
(1) (2) (3) (4)
PANEL ARainfall -0.528** -0.709** -0.191** -0.236**
(0.253) (0.281) (0.0818) (0.0918)
F-statistic: 4.37 6.37 5.43 6.63
Observations 82 79 82 79
R-squared 0.319 0.398 0.325 0.401
PANEL B
Rainfall * Ethnolinguistic Fragmentation -0.993** -1.257*** -0.353*** -0.415***
(0.403) (0.413) (0.129) (0.135)
[0.410] [0.352] [0.134] [0.121]
Geographic controls YES YES YES YES
Agric. and education controls (1970) NO YES NO YES
F-statistic: 6.08 9.28 7.43 9.42
Observations 82 79 82 79
R-squared 0.334 0.416 0.341 0.418
*** p<0.01, ** p<0.05, * p<0.1. Table based on monthly precipitation data from the Tanzania Meteorological
Agency for 108 rainfall stations covering 85 districts in Tanzania (using 1978 boundaries) for the period 1960-
2010. I calculate the rainfall index over the period 1973-75 in 2 ways: first, using mean total precipitation during
the main (masika) rainy season divided by the corresponding long-term average, with the index censored at 1.
Or secondly, using a standardized rainfall index (zscore) with the index censored at 0. A higher rainfall index
means less severe drought. In Panel A the insturment is only drought severity. In Panel B, the instrument refers
to the interaction of the rainfall index and ethnolinguistic fragmentation (ELF). All columns control for the direct
effect of ELF. Geographic controls include: latitude, slope, altitude, mean and standard deviation of long-run
precipitation. Robust standard errors are in parentheses. Conley errors are in square brackets.
26
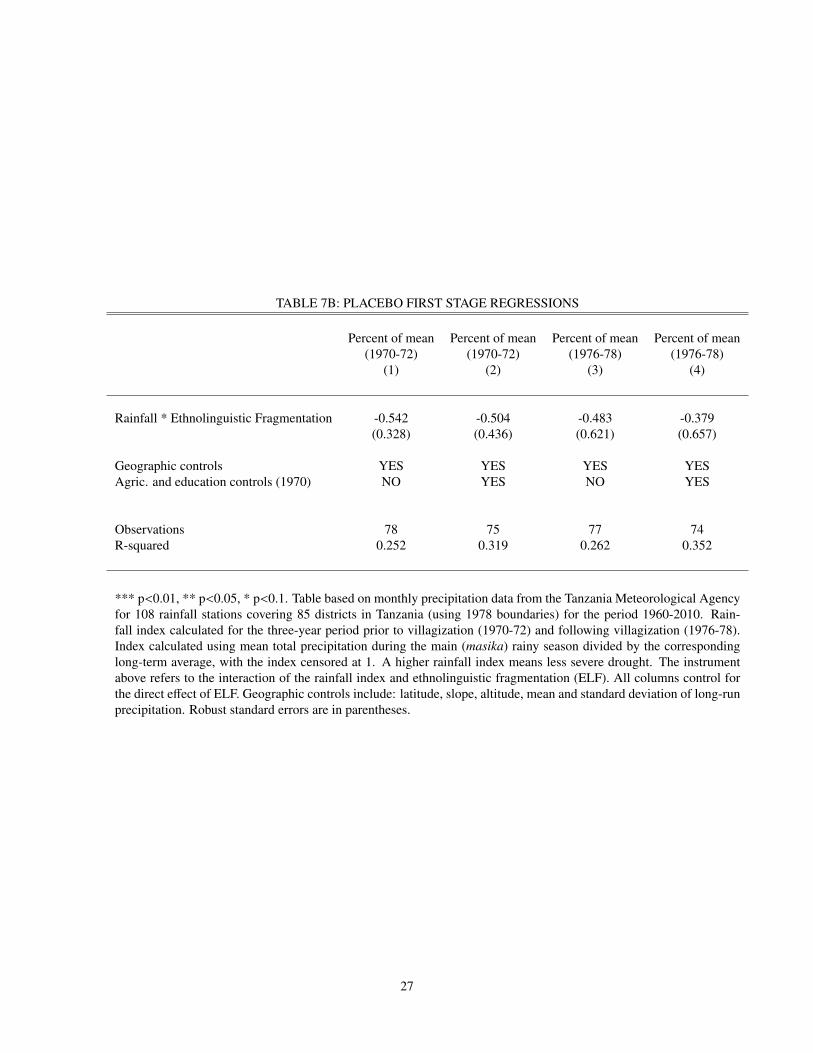
TABLE 7B: PLACEBO FIRST STAGE REGRESSIONS
Percent of mean Percent of mean Percent of mean Percent of mean
(1970-72) (1970-72) (1976-78) (1976-78)
(1) (2) (3) (4)
Rainfall * Ethnolinguistic Fragmentation -0.542 -0.504 -0.483 -0.379
(0.328) (0.436) (0.621) (0.657)
Geographic controls YES YES YES YES
Agric. and education controls (1970) NO YES NO YES
Observations 78 75 77 74
R-squared 0.252 0.319 0.262 0.352
*** p<0.01, ** p<0.05, * p<0.1. Table based on monthly precipitation data from the Tanzania Meteorological Agency
for 108 rainfall stations covering 85 districts in Tanzania (using 1978 boundaries) for the period 1960-2010. Rain-
fall index calculated for the three-year period prior to villagization (1970-72) and following villagization (1976-78).
Index calculated using mean total precipitation during the main (masika) rainy season divided by the corresponding
long-term average, with the index censored at 1. A higher rainfall index means less severe drought. The instrument
above refers to the interaction of the rainfall index and ethnolinguistic fragmentation (ELF). All columns control for
the direct effect of ELF. Geographic controls include: latitude, slope, altitude, mean and standard deviation of long-run
precipitation. Robust standard errors are in parentheses.
27
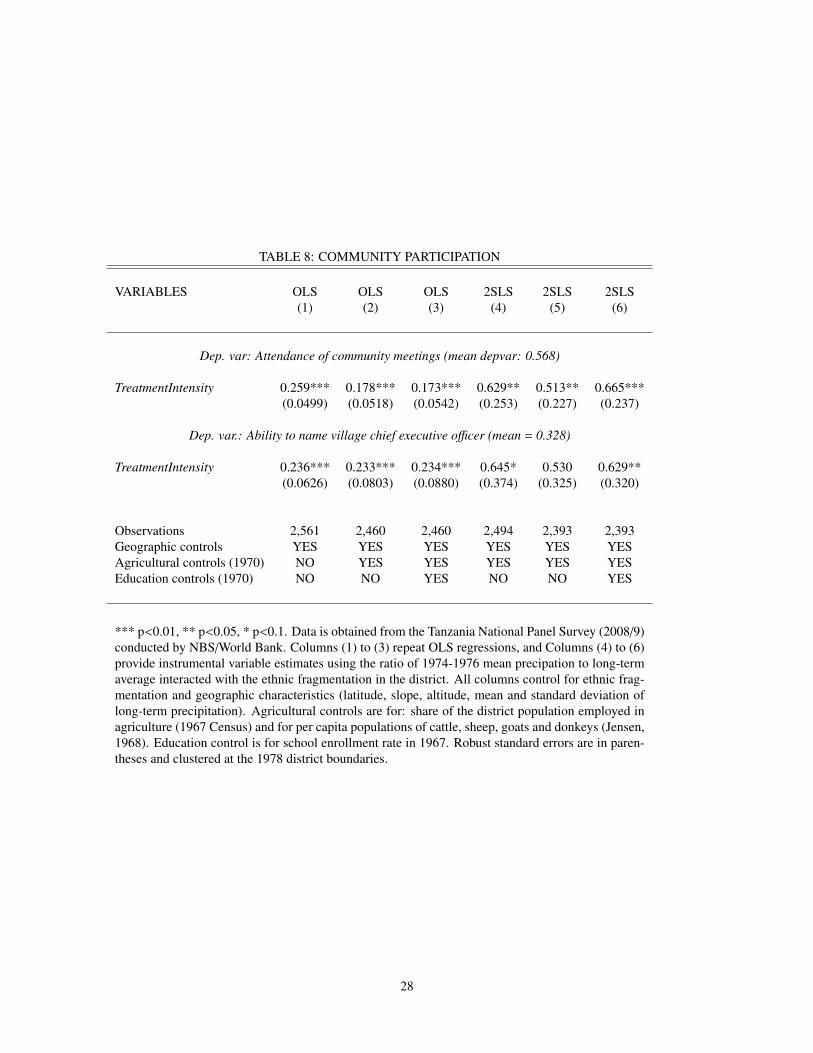
TABLE 8: COMMUNITY PARTICIPATION
VARIABLES OLS OLS OLS 2SLS 2SLS 2SLS
(1) (2) (3) (4) (5) (6)
Dep. var: Attendance of community meetings (mean depvar: 0.568)
TreatmentIntensity 0.259*** 0.178*** 0.173*** 0.629** 0.513** 0.665***
(0.0499) (0.0518) (0.0542) (0.253) (0.227) (0.237)
Dep. var.: Ability to name village chief executive officer (mean = 0.328)
TreatmentIntensity 0.236*** 0.233*** 0.234*** 0.645* 0.530 0.629**
(0.0626) (0.0803) (0.0880) (0.374) (0.325) (0.320)
Observations 2,561 2,460 2,460 2,494 2,393 2,393
Geographic controls YES YES YES YES YES YES
Agricultural controls (1970) NO YES YES YES YES YES
Education controls (1970) NO NO YES NO NO YES
*** p<0.01, ** p<0.05, * p<0.1. Data is obtained from the Tanzania National Panel Survey (2008/9)
conducted by NBS/World Bank. Columns (1) to (3) repeat OLS regressions, and Columns (4) to (6)
provide instrumental variable estimates using the ratio of 1974-1976 mean precipation to long-term
average interacted with the ethnic fragmentation in the district. All columns control for ethnic frag-
mentation and geographic characteristics (latitude, slope, altitude, mean and standard deviation of
long-term precipitation). Agricultural controls are for: share of the district population employed in
agriculture (1967 Census) and for per capita populations of cattle, sheep, goats and donkeys (Jensen,
1968). Education control is for school enrollment rate in 1967. Robust standard errors are in paren-
theses and clustered at the 1978 district boundaries.
28

TABLE 9: PUBLIC GOODS PROVISION
VARIABLES OLS OLS OLS 2SLS 2SLS 2SLS
(1) (2) (3) (4) (5) (6)
Dep. Var: Is there a government primary school within this community? (mean: .877)
TreatmentIntensity 0.286*** 0.380*** 0.398*** 0.441** 0.797* 0.795**
(0.0589) (0.105) (0.114) (0.186) (0.423) (0.401)
Dep. Var: Is there a health facility in this community? (mean depvar: 0.452)
TreatmentIntensity 0.102 0.445*** 0.367*** -0.305 -0.0725 -0.0975
(0.111) (0.114) (0.122) (0.214) (0.429) (0.387)
Geographic controls YES YES YES YES YES YES
Agricultural controls (1970) NO YES YES YES YES YES
Education controls (1970) NO NO YES NO NO YES
*** p<0.01, ** p<0.05, * p<0.1. Data is obtained from the community module of the Tanzania Na-
tional Panel Survey (2008/9) conducted by NBS/World Bank. Columns (1) to (3) repeat the OLS
regressions in Table 6 for comparison. Columns (4) to (6) provide instrumental variable estimates
using the ratio of 1974-1976 mean precipation to long-term average interacted with the ethnic frag-
mentation in the district. All columns control for ethnic fragmentation and geographic characteris-
tics (latitude, slope, altitude, mean and standard deviation of long-term precipitation). Agricultural
controls are for: share of the district population employed in agriculture (1967 Census) and for
per capita populations of cattle, sheep, goats and donkeys (Jensen, 1968). Education control is for
school enrollment rate in 1967. Robust standard errors are in parentheses and clustered at the 1978
district boundaries.
29
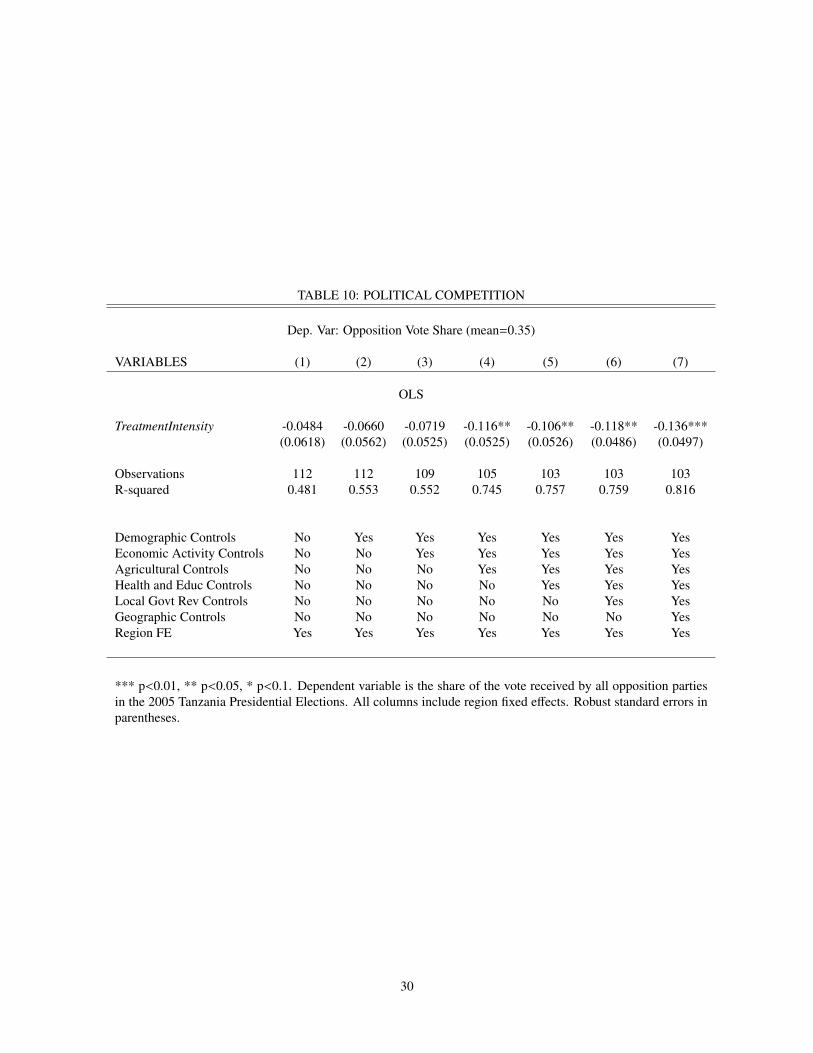
TABLE 10: POLITICAL COMPETITION
Dep. Var: Opposition Vote Share (mean=0.35)
VARIABLES (1) (2) (3) (4) (5) (6) (7)
OLS
TreatmentIntensity -0.0484 -0.0660 -0.0719 -0.116** -0.106** -0.118** -0.136***
(0.0618) (0.0562) (0.0525) (0.0525) (0.0526) (0.0486) (0.0497)
Observations 112 112 109 105 103 103 103
R-squared 0.481 0.553 0.552 0.745 0.757 0.759 0.816
Demographic Controls No Yes Yes Yes Yes Yes Yes
Economic Activity Controls No No Yes Yes Yes Yes Yes
Agricultural Controls No No No Yes Yes Yes Yes
Health and Educ Controls No No No No Yes Yes Yes
Local Govt Rev Controls No No No No No Yes Yes
Geographic Controls No No No No No No Yes
Region FE Yes Yes Yes Yes Yes Yes Yes
*** p<0.01, ** p<0.05, * p<0.1. Dependent variable is the share of the vote received by all opposition parties
in the 2005 Tanzania Presidential Elections. All columns include region fixed effects. Robust standard errors in
parentheses.
30
0.1
0.15
0.2
0.25
COEFFICIEN
T�OF�TH
E�INTERA
CTIONS�AGE�IN�1974�*�TR
EATM
ENT�
INTENSITY�IN
�DISTR
ICT�OF�BIRT
H
�0.1
�0.05
00.05
12
34
56
78
910
1112
1314
1516
1718
1920
2122
2324
AGE�IN�1974
Fig
ure
2:
Fig
ure
2.
So
urc
e:IP
UM
SM
icro
sam
ple
,T
anza
nia
19
88
Cen
sus
31