Embed Size (px)
Citation preview

Long range tRNA–tRNA electrostatic interactions in saltfree and lowsalt tRNAsolutionsA. Patkowski, Erdogan Gulari, and B. Chu Citation: The Journal of Chemical Physics 73, 4178 (1980); doi: 10.1063/1.440725 View online: http://dx.doi.org/10.1063/1.440725 View Table of Contents: http://scitation.aip.org/content/aip/journal/jcp/73/9?ver=pdfcov Published by the AIP Publishing Articles you may be interested in The stability of a salt-free colloidal dispersion J. Chem. Phys. 128, 104509 (2008); 10.1063/1.2888994 Simulation of nonlinear shear rheology of dilute salt-free polyelectrolyte solutions J. Chem. Phys. 126, 124906 (2007); 10.1063/1.2712182 Brownian dynamics simulations of salt-free polyelectrolyte solutions J. Chem. Phys. 116, 5284 (2002); 10.1063/1.1453396 Ion condensation in saltfree dilute polyelectrolyte solutions J. Chem. Phys. 103, 3145 (1995); 10.1063/1.470248 Mobilities of polyLlysine molecules in lowsalt solutions J. Chem. Phys. 80, 1610 (1984); 10.1063/1.446860
This article is copyrighted as indicated in the article. Reuse of AIP content is subject to the terms at: http://scitation.aip.org/termsconditions. Downloaded to IP:
128.114.34.22 On: Mon, 01 Dec 2014 03:53:32
Long range tRNA-tRNA electrostatic interactions in saltfree and low-salt tRNA solutions
A. Patkowski,a) Erdogan Gulari,b) and B. ChuC)
State University of New York at Stony Brook, Long Island, New York, 11794 (Received 3 December 1979; accepted 19 June 1980)
An ordering of salt-free and low·salt tRNA solutions due to long-range electrostatic tRNA-tRNA interactions has been studied by means of intensity and linewidth measurements of scattered light as well as small-angle x-ray scattering. From the position of the Bragg peak in small-angle x-ray scattering data an apparent intermacromolecuJar distance in the ordered tRNA clusters was calculated, while the angular asymmetry and photon correlation measurements of scattered light supply us with estimates of the tRNA cluster size. Based on an isolated hard sphere approximation, static and hydrodynamic radii of the tRNA clusters were always different, pointing to a more complicated pattern of macromolecular dynamics in the presence of long-range electrostatic interactions. The order, as well as the tRNA cluster size, decreases with decreasing tRNA concentration and/or increasing counterion concentration in solution. In tRNA solutions of NaCl concentration lower than 0.1 M the electrostatic tRNA-tRNA interactions are substantial and have to be taken into account in conformational studies of the macromolecule.
I. INTRODUCTION
In light scattering the measured structural parameters, such as the radius of gyration, of macromolecules in solution can be interpreted precisely only if intermolecular polymer interactions are negligibly small. Therefore, we need to extrapolate the measured physical parame ter to zero macromolecular concentration which represents the corresponding system due to a collection of isolated macromolecules in solution. In linewidth measurements of salt-free and low-salt tRNA solutions! the experimentally measured time correlation function of scattered light is very complex because it contains contributions connected with translational motions, with the dynamics of ionization reactions of tRNA and with the dynamics of ordered tRNA clusters. The structure of solutions of highly charged macromolecules was studied experimentally by means of light scattering for solutions of large macromolecules like R-17 virusZ,3 or polystyrene spheres. 4.5 In addition, a qualitative theoretical description of these solutions has been elaborated upon. 6 For low-salt tRNA solutions of fairly narrow molecular weight distributions the time correlation function exhibits a non-single exponential behavior and has a large value of IJ.Jfz, which is a useful index indicating an apparent high polydispersity effect. The average linewidth r and the second moment IJ.z are defined as
f= f rG(r)dr , (1)
IJ.2= f (r - f)2G(r)dr , (2)
respectively, with G(r) being the normalized distribution of linewidth. A proper interpretation of the measured time correlation function of low-salt and salt-
"'On leave of absence from Quantum Electronics Laboratory, Institute of Physics. A. Mickiewicz University, Pozna6, Poland.
b)Present address: Department of Chemical Engineering, University of Michigan. Ann Arbor. Mich. 48104.
C) Author to whom requests for reprints should be addressed.
free tRNA solutions requires us to take into account the effects of long-range electrostatic interactions which playa very important role in macromolecular reactions, such as specific and nonspecific protein-nucleic acid interactions in solution. 7-9 Therefore, we hope to get additional information on the dynamics of tRNA in solution by examining the complex characteristic times in combination with structural parameters.
We used (1) small-angle x-ray scattering (SAXS), (2) light scattering angular asymmetry (LSAA), and (3) quasielastic light scattering (QLS) to characterize the size and characteristic time of those long-range tRNAtRNA electrostatic interactions as follows:
(1) SAXS: This method is usually used to determine the radius of gyration of a macromolecule. In our case, we used the Bragg peak to monitor the ordering of tRNA molecules within the clusters and to determine the intermolecular distance among tRNA's in the clusters. It should be noted that the clusters we refer to are not permanent aggregates but represent ordered regions in solution where the intermolecular tRNA-tRNA distance is fixed.
(2) LSAA: The dissymmetry in the angular dependence of scattered light intenSity occurs when the size of the scatterers or the extension of local fluctuations of the refractive index approaches the wavelength of the incident light. As individual tRNA molecules are small when compared with the wavelength of visible light, the observed asymmetry must be related to tRNA clusters. From the dissymmetry value we can denote a correlation length ~ based on the extension of local concentration fluctuations or a size parameter related to local clustering.
(3) QLS: We measured the time correlation function of scattered light by means of photon correlation spectroscopy.
In salt-free and low-salt tRNA solutions, we have detected an extremely slow characteristic time which is related to the dynamiCS of ordered tRNA clusters.
Our studies on electrostatic interactions in salt-free
4178 J. Chern. Phys. 73(9), 1 Nov. 1980 0021·9606/80/214178-07$01.00 © 1980 American Institute of Physics
This article is copyrighted as indicated in the article. Reuse of AIP content is subject to the terms at: http://scitation.aip.org/termsconditions. Downloaded to IP:
128.114.34.22 On: Mon, 01 Dec 2014 03:53:32
Patkowski, Gulari, and Chu: Long range tRNA-tRNA electrostatic interactions 4179
and low-salt tRNA solutions (containing NaCI or MgClz) by means of the above-mentioned methods have led us to the following conclusions: Repulsive long-range electrostatic tRNA-tRNA interactions cause creation of ordered tRNA clusters in salt-free and low-salt tRNA solutions. The apparent size of these ordered clusters in solution decreases with decreasing tRNA concentration and with increasing salt concentration. The electrostatic interactions playa very important role in the dynamics of tRNA solutions when salt concentrations fall below ~ O. 1M. At higher salt concentrations, the effects due to electrostatic interactions become negligible because of shielding by counterions.
II. EXPERIMENTAL
A. Materials
A sodium-potassium salt of bulk tRNA from baker's yeast (Boehringer-Mannheim) was purified, dialyzed, and lyophilized as was previously described. 1 To study electrostatic tRNA-tRNA interactions in salt-free solutions, solutions of tRNA concentrations amounting to 7.3, 10.8, 16.7, 22.0, 30.9, 37.0, and 46.0 mg/ml were prepared. tRNA solutions of different NaCI and MgClz concentrations were prepared by adding 10 IJ.I of salt solution of the appropriate salt concentration to 1 ml of 46.0 mg/ml tRNA solution in 1mM NaCI (or MgClz). In this way, tRNA solutions in 1, 6, 12, and 60mM NaCI and in 1, 2, 6, and 12mM MgClz were obtained. The pH of all the tRNA solutions was in the range of 3.7 to 4.3. No buffer was used in order to avoid any additional ions in solution.
B. Experimental methods and methods of data analysis
The excess intensity of 18(&) of light scattered by macromolecules in solution can be described by the following formula10 :
_1_ "" 1 2 1.(8) - M
wP(8) + 2A zC+3A 3 C + .•• , (3)
where C is the concentration of macromolecules in solution, Mw is the weight-average molecular weight of the macromolecules, Az and A3 denote the second and the third virial coefficients, respectively, and P(8) is the particle scattering factor which depends on the scattering angle 8.
The particle scattering factor P(8) can be related to size parameters of isolated macromolecules in solution where intermolecular polymer interactions are negligibly small. However, intramolecular segmental interactions still remain. In our case, the tRNA macromolecules are small when compared with the wavelength of incident light. Consequently, the existence of angular asymmetry in the scattered intensity Signals the presence of either larger tRNA aggregates or larger tRNA clusters which are made up of many tRNA molecules in solution. In a concentrated solution, the angular dependence of excess scattered intensity Is can be related to a correlation length ~ which is a measure of the extension of local concentration fluctuations:
~z 1.(K) 0: 1 + ~z KZ , (4)
where K= (41Tn/Xo) sin(8/2). If the clusters had been noninteracting uniform spheres, the correlation length ~ would have been related to a cluster size. By using the appropriate table10 we have computed the cluster diameter D from the measured value of the dissymmetry Z d defined as
_ 1,(8 =45°) Zr 1
8(8 = 1350)
The static correlation length ~ can also be calculated from the dissymmetry value using the formula
(5)
(6)
The experimental setup used for light scattering measurements was described elsewhere. 1 For each of the tRNA solutions the intensity of scattered light was measured at 23°C and from 8 = 30° to 150° at 5 ° intervals. Distilled benzene was used as a standard scattering reference. The measured scattered light intensity was normalized with respect to the intensity of incident light. Measurements of the angular dependence of the intensity of light scattered by each tRNA solution were repeated at least three times and were reproducible within 1%. After correction for scattering volume, incident intensity variations, and solvent background, the absolute excess scattered intensity was then plotted as a function of scattering angle.
1. Spectrum of scattered light
The experimental setup for linewidth measurements by means of photon correlation spectroscopy has been described elsewhere. 1 Correlation function measurements in the time intervals appropriate for translational diffusion and dynamics of ionization reaction in the case of salt-free and low-salt tRNA solutions have been discussed in our previous paper. 1 Here we will be dealing only with the slowly decaying component of the measured correlation function which is related to the dynamics of ordered tRNA clusters in solution. The appropriate correlation functions were measured in the time interval of 700 IJ.S per correlation function while for translational diffusion the time interval range of 20 IJ.S per correlation function was used and the tRNA charge fluctuations require even shorter time intervals. Thus, translational diffusion and tRNA charge fluctuations contribute only to the very few first channels of the correlation function. This separation of characteristic time allowed us to develop simple empirical procedures which permit us to extract information on the tRNA cluster dynamics from the complex correlation function. The procedures were necessary because the exact analytical form of the correlation function, taking into account those three processes, is not known although it was theoretically predicted that it should consist of three decay times. 6
To determine the linewidth corresponding to tRNA cluster dynamics the first order correlation functions were fitted in the following form:
g(1)(r)=B 1 exp(-r1r)+Bzexp(-rzr) • (7)
In the fitting procedure all but a few first points of the
J. Chem. Phys., Vol. 73, No.9, 1 November 1980
This article is copyrighted as indicated in the article. Reuse of AIP content is subject to the terms at: http://scitation.aip.org/termsconditions. Downloaded to IP:
128.114.34.22 On: Mon, 01 Dec 2014 03:53:32
4180 Patkowski, Gulari, and Chu: Long range tRNA-tRNA electrostatic interactions
1%
08 N
.. . ...... . "to . . ..
" Cll. 0-4 -<
o L ______________ ...J_I%
o 20 40 60 80 channel number
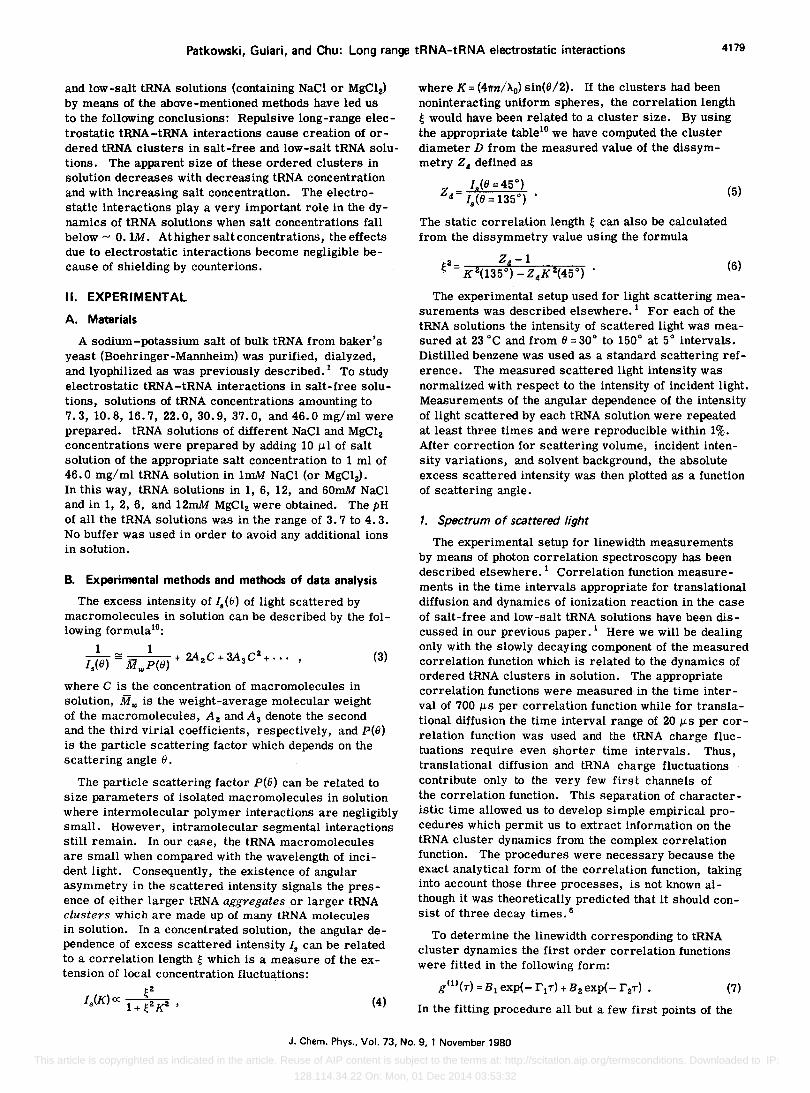
FIG.!. Measured (dots) and computed [Eq. (7), solid line] correlation functions and their difference (+) for a salt-free tRNA solution at C = 37.0 mg/ml.
measured correlation function were used. We do not assume that Eq. (7) gives the correct form of the correlation function which contains information on the translational motion of tRNA molecules and of tRNA clusters as well as ionization reactions. We assume only that the first term in Eq. (7) describes the dynamics of ordered tRNA clusters while the second one takes into account the residual contributions of tRNA translational diffusion and charge fluctuations that are at least two orders of magnitude fas ter. Obviously, the numerical values that correspond to the second term of Eq. (7) do not have any physical meaning and depend on the starting point in the fitting procedure. Some evidence for the above-presented considerations comes from Fig. 1, which shows that the measured correlation function (dots) can well be fitted with Eq. (7) (solid line) and the difference (+) between the calculated and measured values is smaller than 0.5% and the crosses are randomly distributed. Thus, we can conclude that our method of analysis yields a correct characteristic time which is related to tRNA cluster dynamics in solution.
We have also determined the value of the slow component of correlation function in a slightly different way. If the measured correlation function describes mainly a slow process with corresponding linewidth r. and is additionally distorted by some much faster processes of corresponding linewidths rj (i== 1, 2, ..• ) and r j » r., the net signal correlation function A,Blg(1)(r)1 2 except for a few first points may be described by a single exponential function exp( - 2r. T). In other words, the plot of In[lg1(r)1 2 j versus T is a straight line except for the first few points and from the slope of the line the r. value may be determined. We used both methods to obtain rs values, and the results were consistent within experimental error. Thus, we can evaluate a slow characteristic time which is connected with the dynamics of ordered tRNA clusters in solution by means of photon correlation spectroscopy. From the linewidth data, we can also obtain an equivalent hydrodynamic radius (or dynamical correlation length) rH by using the Stokes-Einstein relation
(8)
where the translational diffusion coefficient DT = r /K2, K is the scattering vector, k is the Boltzmann constant,
T is the absolute temperature, and 1/ is the solvent viscosity. It should be noted that the Stokes-Einstein relation is appropriate only for isolated noninteracting rigid spheres. Therefore, the equivalent hydrodynamiC radius may serve only as an indication of the cluster size and its corresponding changes in a qualitative way.
2. Low-angle x-ray scattering
The angular dependence of x-ray intenSity Ix(K) scattered by a dilute solution of monodisperse macromolecules at random orientation is represented byll
(9)
where K is the scattering vector and R is the electronic radius of gyration. It is a common practice to obtain the R value from the limiting slope in a plot of Inlx(K) versus K2, known as the Guinier method.
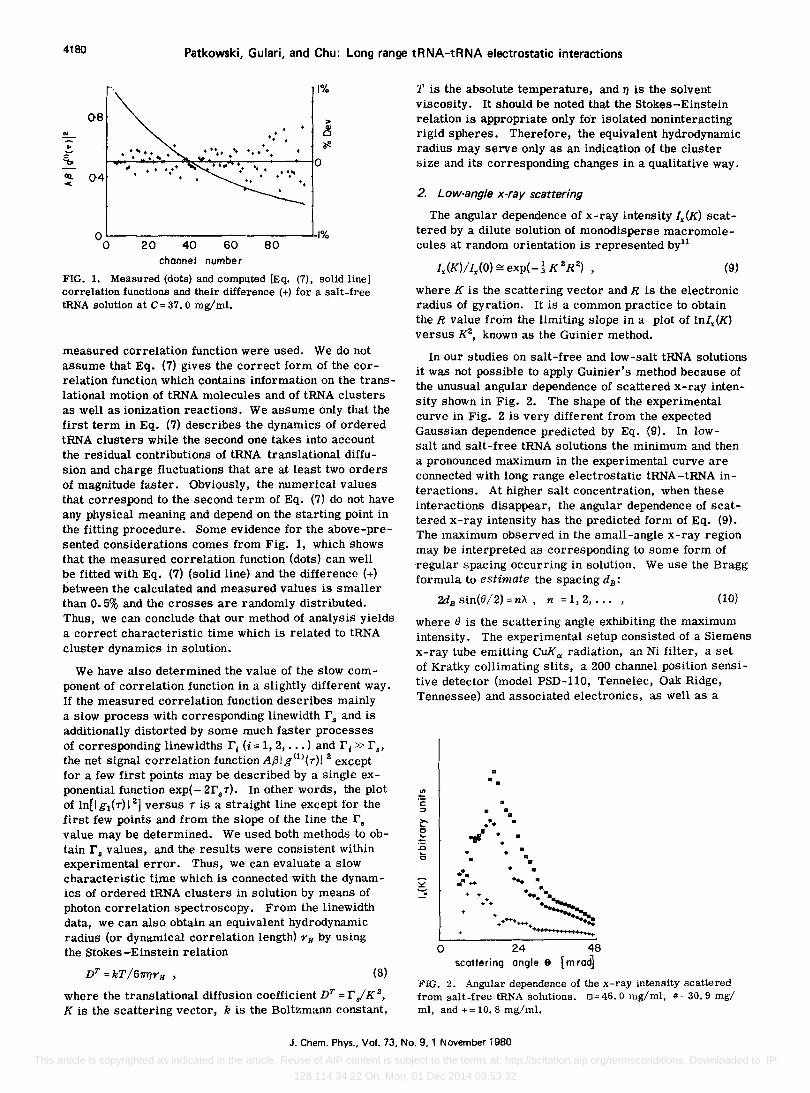
In our studies on salt-free and low-salt tRNA solutions it was not possible to apply Guinier's method because of the unusual angular dependence of scattered x-ray intensity shown in Fig. 2. The shape of the experimental curve in Fig. 2 is very different from the expected Gaussian dependence predicted by Eq. (9). In low-salt and salt-free tRNA solutions the minimum and then a pronounced maximum in the experimental curve are connected with long range electrostatic tRNA-tRNA interactions. At higher salt concentration, when these interactions disappear, the angular dependence of scattered x-ray intensity has the predicted form of Eq. (9). The maximum observed in the small-angle x-ray region may be interpreted as corresponding to some form of regular spacing occurring in solution_ We use the Bragg formula to estimate the spacing dB:
2dB sin(II/2) =nA, n = 1,2, .. , , (10)
where II is the scattering angle exhibiting the maximum intensity. The experimental setup consisted of a Siemens x-ray tube emitting CuKe> radiation, an Ni filter, a set of Kratky COllimating slits, a 200 channel poSition sensitive detector (model PSD-llO, Tennelec, Oak Ridge, Tennessee) and associated electronics, as well as a
~ c !: :a .. c
. •
• •• . •
..,,' . . • .
• ••• .- ++
• • . • ... -
o 24 48 scattering angle 8 [m rod]
FIG. 2. Angular dependence of the x-ray intensity scattered from salt-free tRNA solutions_ 0= 46.0 mg/ml, # = 30.9 mg/ ml, and + = 10. 8 mg/ml.
J. Chem. Phys., Vol. 73, No.9, 1 November 1980
This article is copyrighted as indicated in the article. Reuse of AIP content is subject to the terms at: http://scitation.aip.org/termsconditions. Downloaded to IP:
128.114.34.22 On: Mon, 01 Dec 2014 03:53:32
Patkowski, Gulari, and Chu: Long range tRNA-tRNA electrostatic interactions 4181
TABLE I. Values of number CN and weight Cw tRNA concentrations, position of the first maximum In low-angle xray scattering data and corresponding Bragg spacing dB. average distance between macromolecules cil l3, dissymmetry of angular dependence of scattered light Zd and corresponding scatterer diameter D, and slow component of the correlation function of scattered photons r s and corresponding hydrodynamic diameter 2rH for salt-free tRNA solutions (t=23°C).
tRNA concentration Bragg Average
Peak spacing distance Diameterb Hydrodynamic Cw CN x 10-17a position dB x 108 CilI/3x 108 Dissym- D xlOB rs diameterb
(mg/ml) (cm-~ (mrad) (cm) (cm) metry Zd (cm) (rad/s) 2rHx 108 (cm)
46.0 10.76 17.1 90 97.5 37.0 8.66 15.9 97 105 30.9 7.23 15.9 97 III 22.0 5.15 13.5 115 125 16.7 3.91 11.5 135 137 10.8 2.53 10.3 150 158 7.8 1.71 9.8 160 180
aMolecular weight of tRNA = 26 500. ~quivalent diameter of isolated spheres.
multichannel analyzer (NS-900, Northern Scientific Company). The accumulated data were transferred
1.120 1.058 1.019 1.002
from the multichannel analyzer to the HP9830A calculator and then were stored on magnetic tapes for further analysis. Typical measurements lasted 1000 s, assuring an accumulation of about 5000 counts in the peak channels and about 1000 counts at the tail end. The angular resolution of the setup amounted to O. 6 mrad per channel. The x-ray intensity scattered by the solvent was subtracted from the intensity scattered by the solution. The experimentally measured curves were corrected for the finite width of collimating slits and the incident beam. 12
III. RESULTS AND DISCUSSION
Table I lists the numerical values of number and weight tRNA concentrations (CN and C w), scattering angle (9) corresponding to the poSition of the maximum scattered intensity in the low-angle x-ray scattering data and corresponding Bragg spacing dB' average distance between tRNA molecules CN1/3 calculated from the value of tRNA number concentration, dissymmetry value Zd and corresponding equivalent diameter of the scatterer D, linewidth of the slow component of the correlation function r s' and corresponding hydrodynamiC diameter of the scatterer 2rH for the salt-free tRNA solutions.
The measured angular dependence of the intensity of x-rays scattered by salt-free tRNA solutions of different tRNA concentrations is shown in Fig. 2. We can see that the peak is moving toward lower angles as tRNA concentration decreases, which Signifies an increase in the average intermolecular distance (Fig. 3). The values of dB (Table I) are very close to the average intermolecular distance cil lS for all tRNA solutions studied. Therefore, dB is interpreted as the "fixed" tRNA-tRNA spacing in ordered tRNA clusters. This interpretation is corroborated by the fact that the peak disappears after adding an appropriate amolmt of salt to salt-free tRNA solutions because the counterions screen macromolecular charges, diminish electrostatic interactions so that
514 2320 1108 367 2610 985 220 2890 890
4020 640
the ordered tRNA clusters disappear, and the tRNAtRNA distance is no longer fixed.
The dissymmetry values (Table I) were not equal to one only for three tRNA solutions of the highest macromolecular concentrations. The diameter D of ordered tRNA clusters calculated from the dissymmetry values amounted to 514, 367, and 220 A for solutions of decreaSing tRNA concentration corresponding, respectively, to about six, four, and two intermolecular distances. The diameters D were calculated on the assumption that the scatterers are isolated rigid spherical particles. This assumption is not strictly valid for ordered tRNA clusters. Therefore, the calculated D values are not equal to the real cluster size, but they may be used as an estimate of the cluster size, and may also be used in order to monitor cluster size changes. Furthermore, the dissymmetry ZtJ was calculated from the total excess scattered light intensity including contributions from individual tRNA molecules as well as their clusters instead of the intensity scattered by the tRNA clusters themselves. Therefore, the obtained values of dissymmetry Z d and scatterer diameter D were lower than the real ones. By decreaSing the tRNA concentration in salt-free solutions, we observed a decrease in the ordered cluster size (Table I). This is due to the increase of the average tRNA-tRNA distance and thus a decrease in the strength of electrostatic interactions
.. 106 d-' B
10
~8 , 56
4
2
0 0 2 4
FIG. 3. Plot of dil versus cJl3 for salt-free tRNA solutions.
J. Chem. Phys., Vol. 73, No.9, 1 November 1980
This article is copyrighted as indicated in the article. Reuse of AIP content is subject to the terms at: http://scitation.aip.org/termsconditions. Downloaded to IP:
128.114.34.22 On: Mon, 01 Dec 2014 03:53:32
4182 Patkowski, Gulari, and Chu: Long range tRNA-tRNA electrostatic interactions
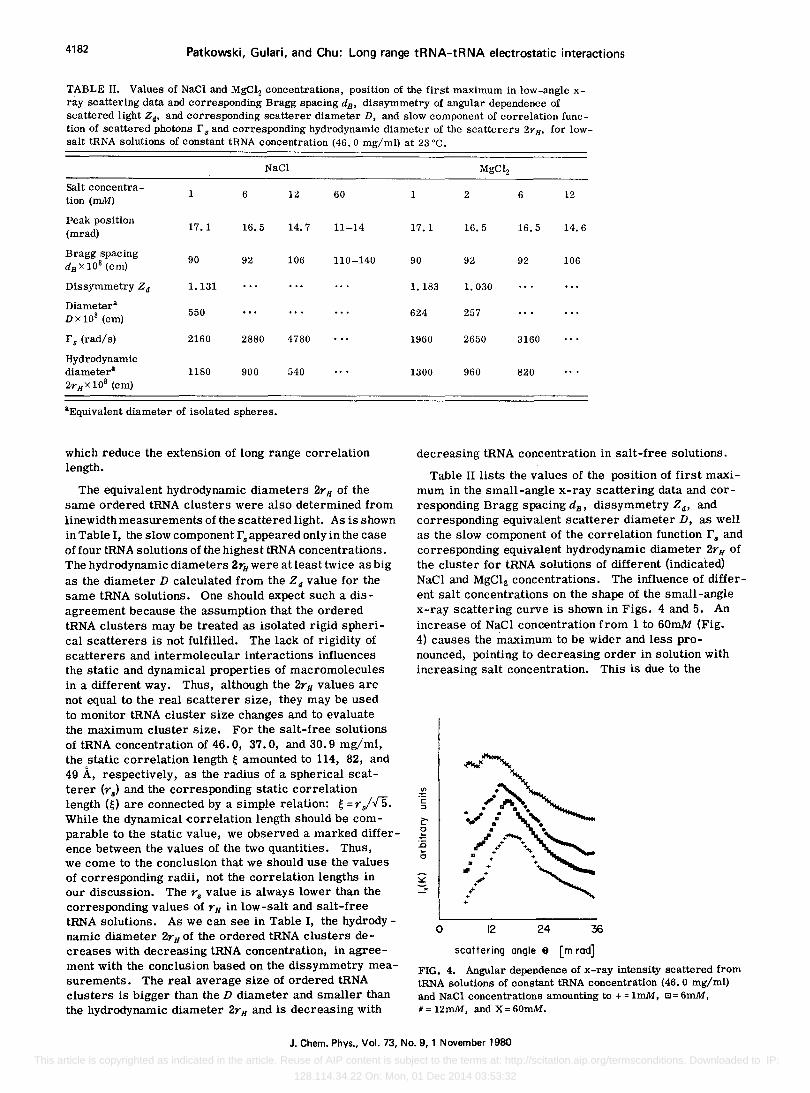
TABLE II. Values of NaCI and MgCl2 concentrations, position of the first maximum in low-angle xray scattering data and corresponding Bragg spacing dB. dissymmetry of angular dependence of scattered light Zd' and corresponding scatterer diameter D, and slow component of correlation function of scattered photons r s and corresponding hydrodynamic diameter of the scatterers 2rH' for lowsalt tRNA solutions of constant tRNA concentration (46.0 mg/ml) at 23°C.
Salt concentration (rnM)
Peak position (mrad)
Bragg spacing dBX10B (em)
Dissymmetry Zd
Diametera
Dx lOB (cm)
r. (rad/s)
Hydrodynamic diametera
2rHxlOB (em)
1
17.1
90
1.131
550
2160
1180
NaCI
6 12
16.5 14.7
92 106
2880 4780
900 540
aEquivalent diameter of isolated spheres.
60
11-14
110-140
which reduce the extension of long range correlation length.
The equivalent hydrodynamic diameters 2r H of the same ordered tRNA clusters were also determined from linewidth measurements of the scattered light. As is shown in Table I, the slow component rs appeared only in the case of four tRNA solutions of the highest tRNA concentrations. The hydrodynamic diameters 2rH were at least twice as big as the diameter D calculated from the Z d value for the same tRNA solutions. One should expect such a disagreement because the assumption that the ordered tRNA clusters may be treated as isolated rigid spherical scatterers is not fulfilled. The lack of rigidity of scatterers and intermolecular interactions influences the static and dynamical properties of macromolecules in a different way. Thus, although the 2rH values are not equal to the real scatterer size, they may be used to monitor tRNA cluster size changes and to evaluate the maximum cluster size. For the salt-free solutions of tRNA concentration of 46.0, 37.0, and 30.9 mg/ml, the static correlation length ~ amounted to 114, 82, and 49 A, respectively, as the radius of a spherical scatterer (rs ) and the corresponding static correlation length (~) are connected by a Simple relation: ~ =r /15. While the dynamical -correlation length should be comparable to the static value, we observed a marked difference between the values of the two quantities. Thus, we come to the conclusion that we should use the values of corresponding radii, not the correlation lengths in our discussion. The rs value is always lower than the corresponding values of rH in low-salt and salt-free tRNA solutions. As we can see in Table I, the hydrodynamic diameter 2rH of the ordered tRNA clusters decreases with decreasing tRNA concentration, in agreement with the conclusion based on the dissymmetry measurements. The real average size of ordered tRNA clusters is bigger than the D diameter and smaller than the hydrodynamic diameter 2rH and is decreasing with
1 2 6 12
17.1 16.5 16.5 14.6
90 92 92 106
1.183 1. 030
624 257
1960 2650 3160
1300 960 820
decreasing tRNA concentration in salt-free solutions.
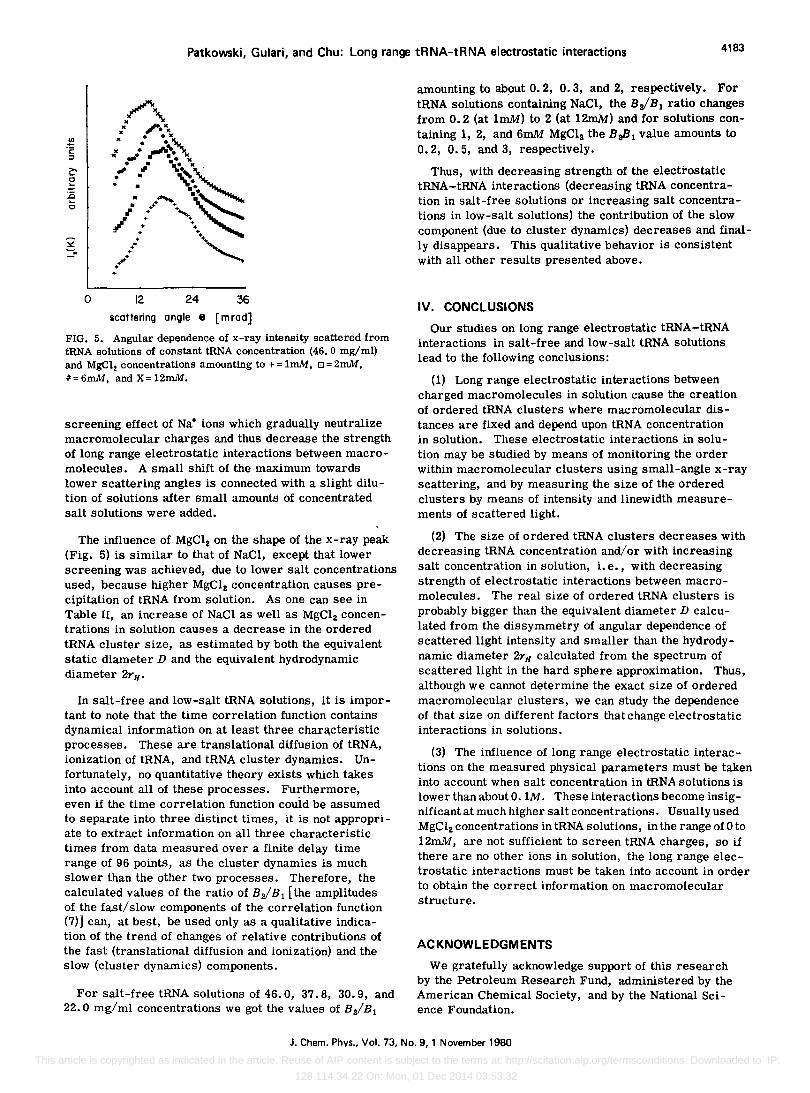
Table II lists the values of the position of first maximum in the small-angle x-ray scattering data and corresponding Bragg spacing dB' dissymmetry Zd' and corresponding equivalent scatterer diameter D, as well as the slow component of the correlation function r. and corresponding equivalent hydrodynamic diameter 2rH of the cluster for tRNA solutions of different (indicated) NaCI and MgClz concentrations. The influence of different salt concentrations on the shape of the small-angle x-ray scattering curve is shown in Figs. 4 and 5. An increase of NaCI concentration from 1 to 60mM (Fig. 4) causes the maximum to be wider and less pronounced, pointing to decreasing order in solution with increasing salt concentration. This is due to the
o 12 24 36
scattering angle 8 [m rOd]
FIG. 4. Angular dependence of x-ray intensity scattered from tRNA solutions of constant tRNA concentration (46.0 mg/rol) and NaCI concentrations amounting to + = ImM. t:l = 6mM, # = 12mM, and X = 60mM.
J. Chern. Phys., Vol. 73, No.9, 1 November 1980
This article is copyrighted as indicated in the article. Reuse of AIP content is subject to the terms at: http://scitation.aip.org/termsconditions. Downloaded to IP:
128.114.34.22 On: Mon, 01 Dec 2014 03:53:32
Patkowski, Gulari, and Chu: Long range tRNA-tRNA electrostatic interactions 4183
o 12 24 36
scattering angle 8 [m rOd]
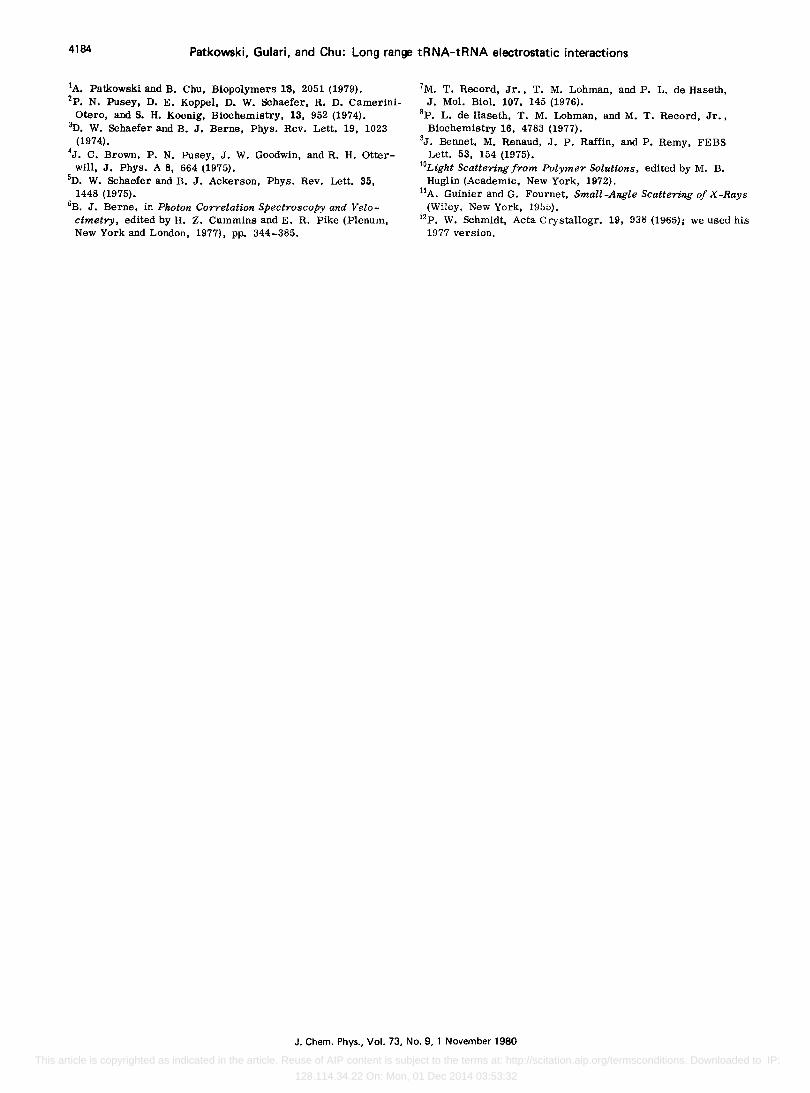
FIG. 5. Angular dependence of x-ray intensity scattered from tRNA solutions of constant tRNA concentration (46.0 mg/ml) and MgCl2 concentrations amounting to + = ImM, D = 2mM, #=6mM, and X=12mM.
screening effect of Na+ ions which gradually neutralize macromolecular charges and thus decrease the strength of long range electrostatic interactions between macromolecules. A small shift of the maximum towards lower scattering angles is connected with a slight dilution of solutions after small amounts of concentrated salt solutions were added.
The influence of MgCla on the shape of the x-ray peak (Fig. 5) is similar to that of NaCI, except that lower screening was achieved, due to lower salt concentrations used, because higher MgCla concentration causes precipitation of tRNA from solution. As one can see in Table II, an increase of NaCl as well as MgCla concentrations in solution causes a decrease in the ordered tRNA cluster size, as estimated by both the equivalent static diameter D and the equivalent hydrodynamic diameter 2rH'
In salt-free and low-salt tRNA solutions, it is important to note that the time correlation function contains dynamical information on at least three chara,cteristic processes. These are translational diffusion of tRNA, ionization of tRNA, and tRNA cluster dynamics. Unfortunately, no quantitative theory exists which takes into account all of these processes. Furthermore, even if the time correlation function couid be assumed to separate into three distinct times, it is not appropriate to extract information on all three characteristic times from data measured over a finite delay time range of 96 points, as the cluster dynamics is much slower than the other two processes. Therefore, the calculated values of the ratio of BalBl [the amplitudes of the fast/slow components of the correlation function (7)] can, at best, be used only as a qualitative indication of the trend of changes of relative contributions of the fast (translational diffusion and ionization) and the slow (cluster dynamics) components.
For salt-free tRNA solutions of 46.0, 37.8, 30.9, and 22.0 mg/ml concentrations we got the values of Ba/Bl
amounting to about 0.2, 0.3, and 2, respectively. For tRNA solutions containing NaCI, the BalBl ratio changes from 0.2 (at ImM) to 2 (at 12mM) and for solutions containing 1, 2, and 6mM MgClz the BaHl value amounts to 0.2, 0.5, and 3, respectively.
Thus, with decreasing strength of the electrostatic tRNA-tRNA interactions (decreasing tRNA concentration in salt-free solutions or increasing salt concentrations in low-salt solutions) the contribution of the slow component (due to cluster dynamics) decreases and finally disappears. This qualitative behavior is consistent with all other results presented above.
IV. CONCLUSIONS
Our studies on long range electrostatic tRNA-tRNA interactions in salt-free and low-salt tRNA solutions lead to the following conclusions:
(1) Long range electrostatic interactions between charged macromolecules in solution cause the creation of ordered tRNA clusters where macromolecular distances are fixed and depend upon tRNA concentration in solution. These electrostatic interactions in solution may be studied by means of monitoring the order within macromolecular clusters using small-angle x-ray scattering, and by measuring the size of the ordered clusters by means of intensity and linewidth measurements of scattered light.
(2) The size of ordered tRNA clusters decreases with decreasing tRNA concentration and/or with increaSing salt concentration in solution, i. e., with decreaSing strength of electrostatic interactions between macromolecules. The real size of ordered tRNA clusters is probably bigger than the equivalent diameter D calculated from the dissymmetry of angular dependence of scattered light intensity and smaller than the hydrodynamic diameter 2rH calculated from the spectrum of scattered light in the hard sphere approximation. Thus, although we cannot determine the exact size of ordered macromolecular clusters, we can study the dependence of that size on different factors that change electrostatic interactions in solutions.
(3) The influence of long range electrostatic interactions on the measured physical parameters must be taken into account when salt concentration in tRNA solutions is lower than about O. 1M. These interactions become insignificant at much higher salt concentrations. Usually used MgClz concentrations in tRNA solutions, in the range of 0 to 12mM, are not sufficient to screen tRNA charges, so if there are no other ions in solution, the long range electrostatic interactions must be taken into account in order to obtain the correct information on macromolecular structure.
ACKNOWLEDGMENTS
We gratefully acknowledge support of this research by the Petroleum Research Fund, administered by the American Chemical Society, and by the National Science Foundation.
J. Chern. Phys., Vol. 73, No.9, 1 November 1980
This article is copyrighted as indicated in the article. Reuse of AIP content is subject to the terms at: http://scitation.aip.org/termsconditions. Downloaded to IP:
128.114.34.22 On: Mon, 01 Dec 2014 03:53:32
4184 Patkowski, Gulari, and Chu: Long range tRNA-tRNA electrostatic interactions
IA. Patkowski and B. Chu, Biopolymers 18, 2051 (1979). 2p. N. Pusey, D. E. Koppel, D. W. Schaefer, R. D. Camerini
Otero, and S. H. Koenig, Biochemistry, 13, 952 (1974). 3D. W. Schaefer and B. J. Berne, Phys. Rev. Lett. 19, 1023
(1974). 4J • C. Brown, P. N. Pusey, J. W. Goodwin, and R. H. Otter
will, J. Phys. A 8, 664 (1975). 5D• W. Schaefer and B. J. Ackerson, Phys. Rev. Lett. 35,
1448 (1975). 6B. J. Berne, in Photon Correlation Spectroscopy and Velo
cimetry, edited by H. Z. Cummins and E. R. Pike (Plenum, New York and London, 1977), pp. 344-385.
7M. T. Record, Jr., T. M. Lohman, and P. L. de Haseth, J. Mol. BioI. 107, 145 (1976).
Bp. L. de Haseth, T. M. Lohman, and M. T. Record, Jr., Biochemistry 16, 4783 (1977).
9J . Bennet, M. Renaud, J. P. Raffin, and P. Remy, FEBS Lett. 53, 154 (1975).
IOLight Scattering from Polymer Solutions, edited by M. B. Huglin (Academic, New York, 1972).
IIA. Guinier and G. Fournet, Small-Angle Scattering of X-Rays (Wiley, New York, 1955).
12p. W. Schmidt, Acta Crystallogr. 19, 938 (1965); we used his 1977 version.
J. Chem. Phys., Vol. 73, No.9, 1 November 1980
This article is copyrighted as indicated in the article. Reuse of AIP content is subject to the terms at: http://scitation.aip.org/termsconditions. Downloaded to IP:
128.114.34.22 On: Mon, 01 Dec 2014 03:53:32


![RESEARCH ARTICLE Open Access Fragmentation of ... - SLU.SE · 18–46 nt pieces derived from mature tRNA or the 3 ′ end of precursor-tRNA (pre-tRNA) [14-16]. tRNA fragmenta-tion](https://img.pdfslide.us/doc/110x75/60474a078cb48655a57c0958/research-article-open-access-fragmentation-of-sluse-18a46-nt-pieces-derived.jpg)