Embed Size (px)
Citation preview
LONG-RANGE PLANNING FOR SMART-WATER NETWORK IN
BOSTONAPRIL 17,2015
John P. Sullivan, P.E.Chief Engineer and Operations Officer
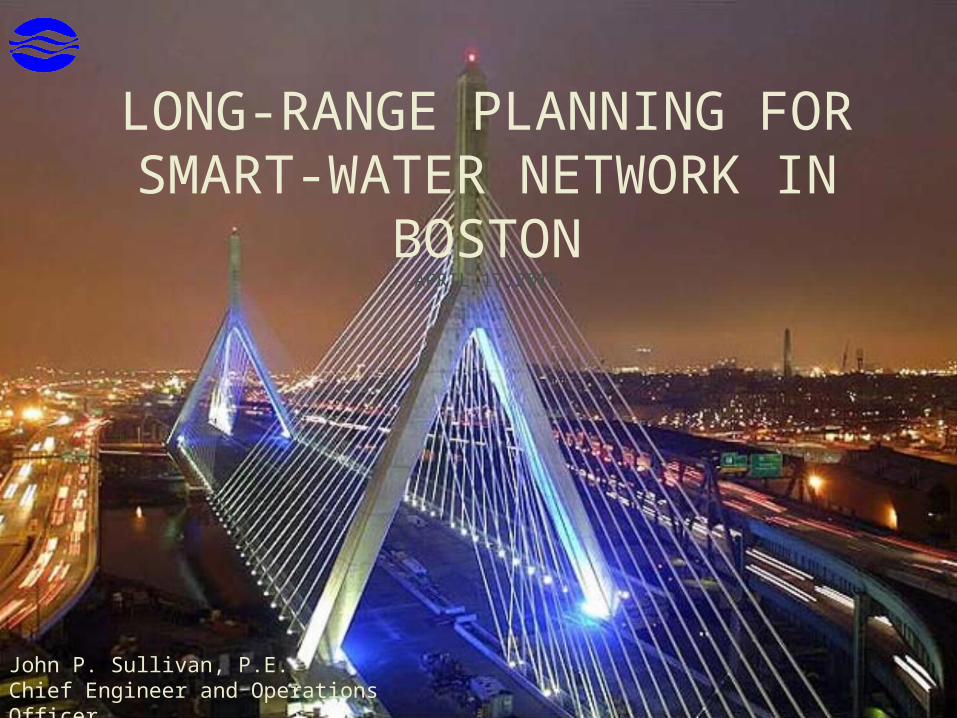
AGENDA
• Background and System Characteristics
• In place systems and technologies
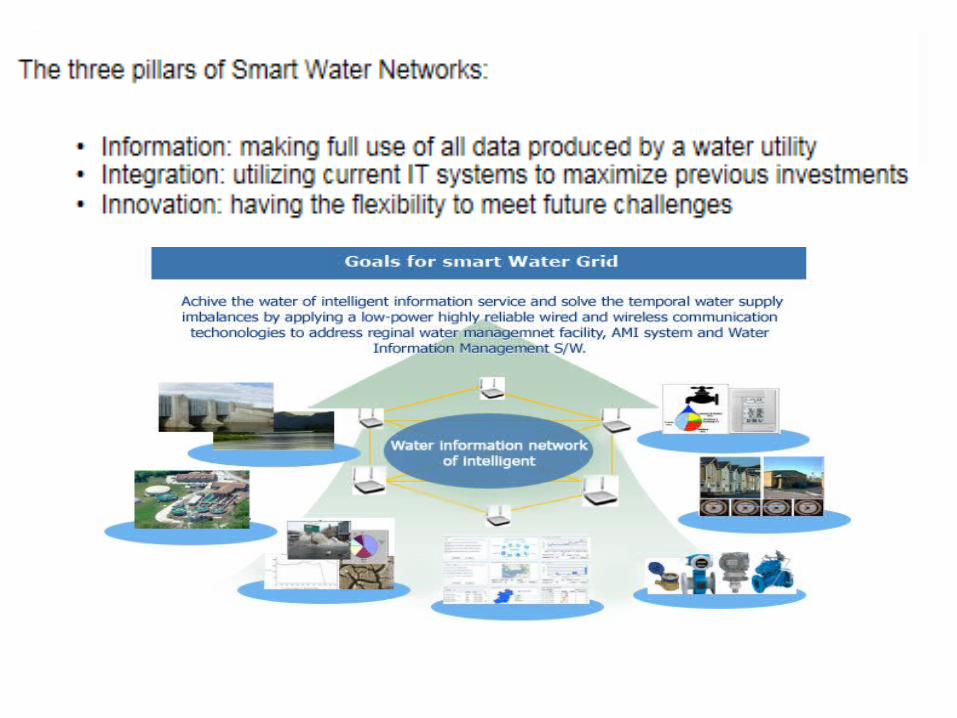
• Future Smart- Water network
• Challenges
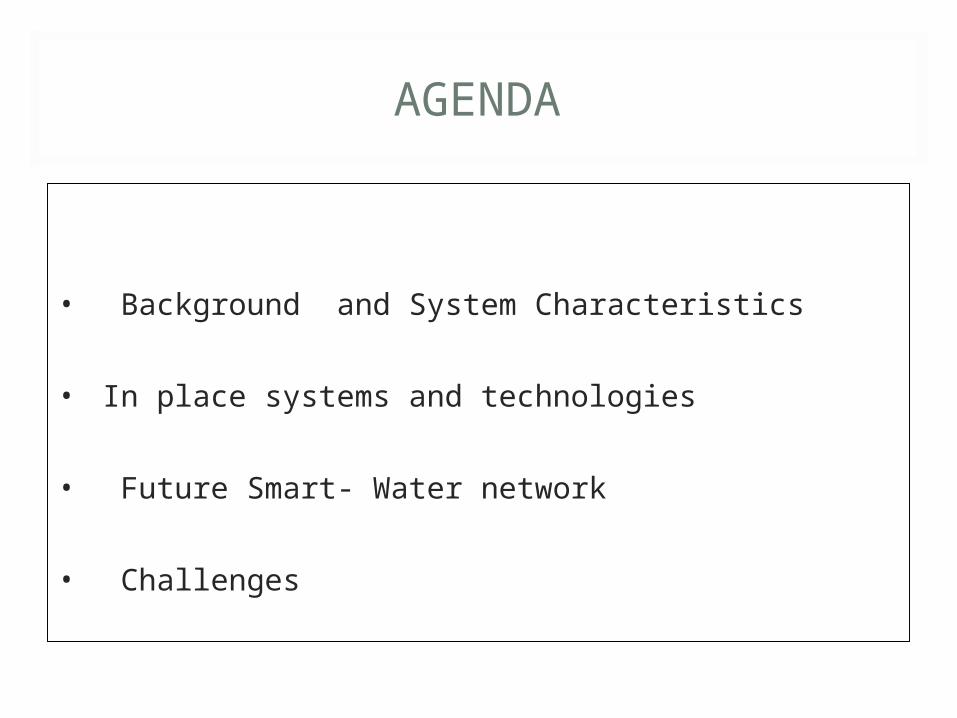
• MWRA provides wholesale water and wastewater services to over 2.5 million customers in 61 communities
• On average, MWRA delivers an average of 200 million gallons per day to its water customers, with a peak demand of 350 million gallons
• MWRA collects and treats an average of 350 million gallons of wastewater per day, with a peak capacity of 1.2 billion gallons
MWRA IS A REGIONAL WATER AND WASTEWATER WHOLESALER
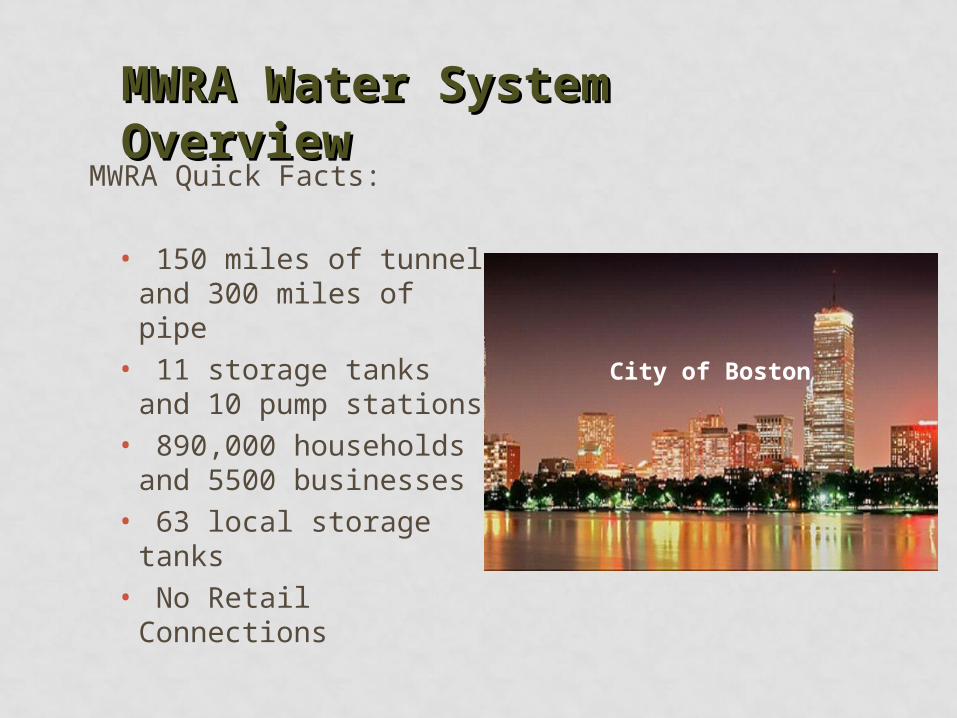
MWRA Water System OverviewMWRA Water System Overview
MWRA Quick Facts:
• 150 miles of tunnel and 300 miles of pipe
• 11 storage tanks and 10 pump stations
• 890,000 households and 5500 businesses
• 63 local storage tanks• No Retail Connections
City of Boston
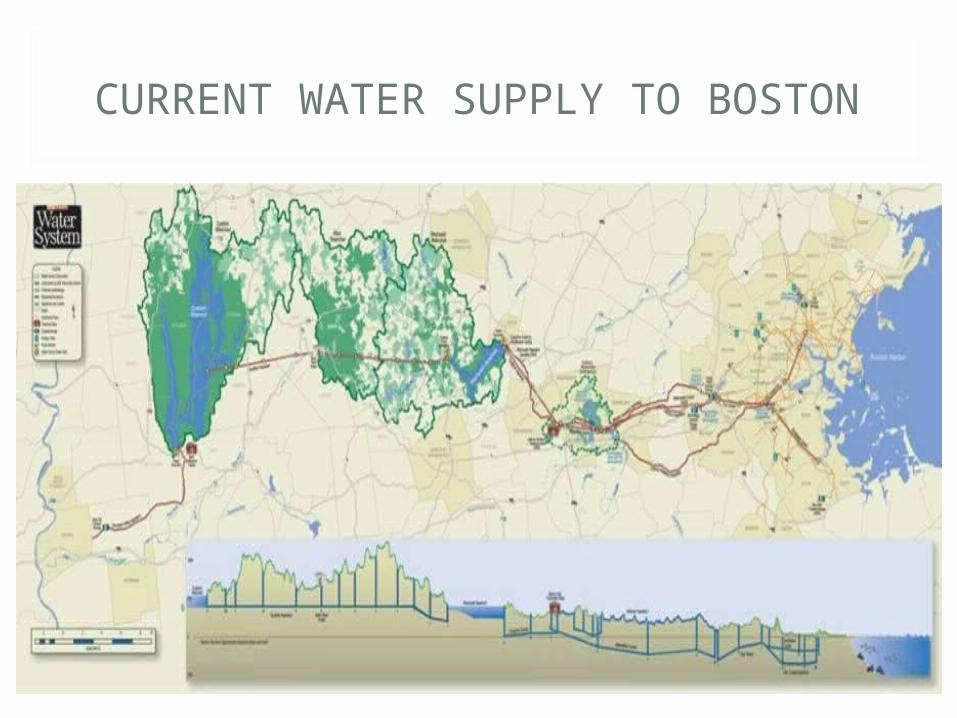
CURRENT WATER SUPPLY TO BOSTON
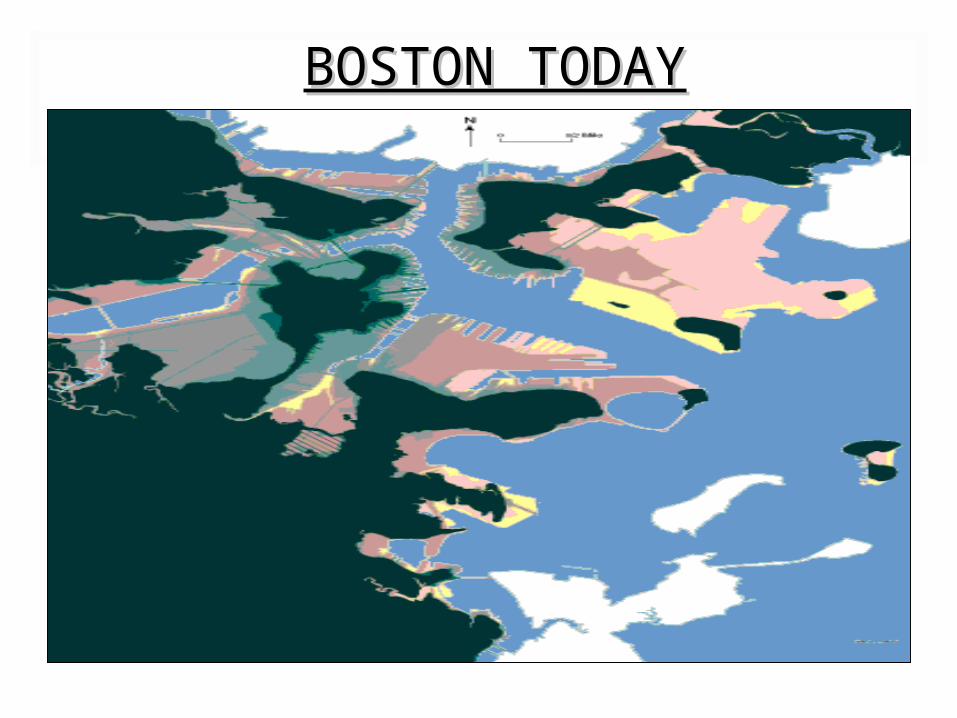
BOSTON TODAYBOSTON TODAY
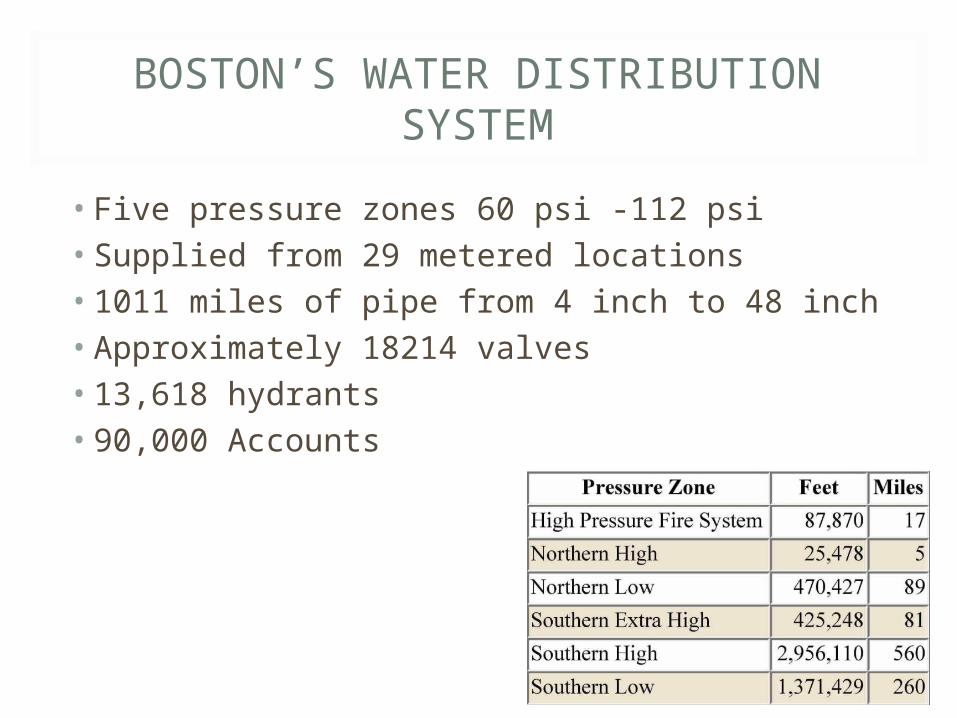
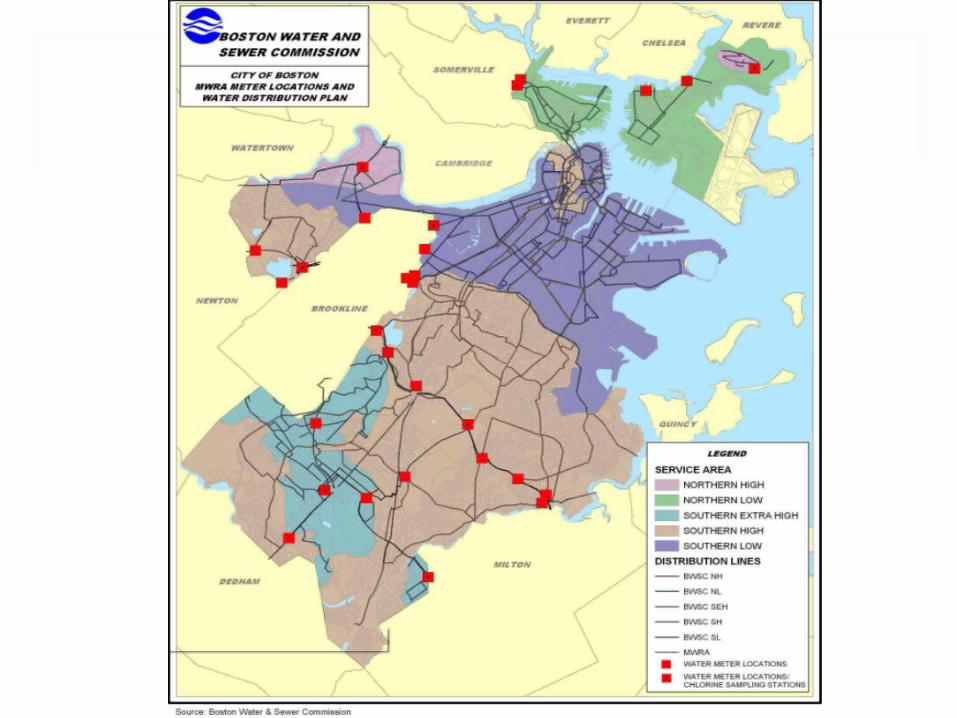
BOSTON’S WATER DISTRIBUTION SYSTEM
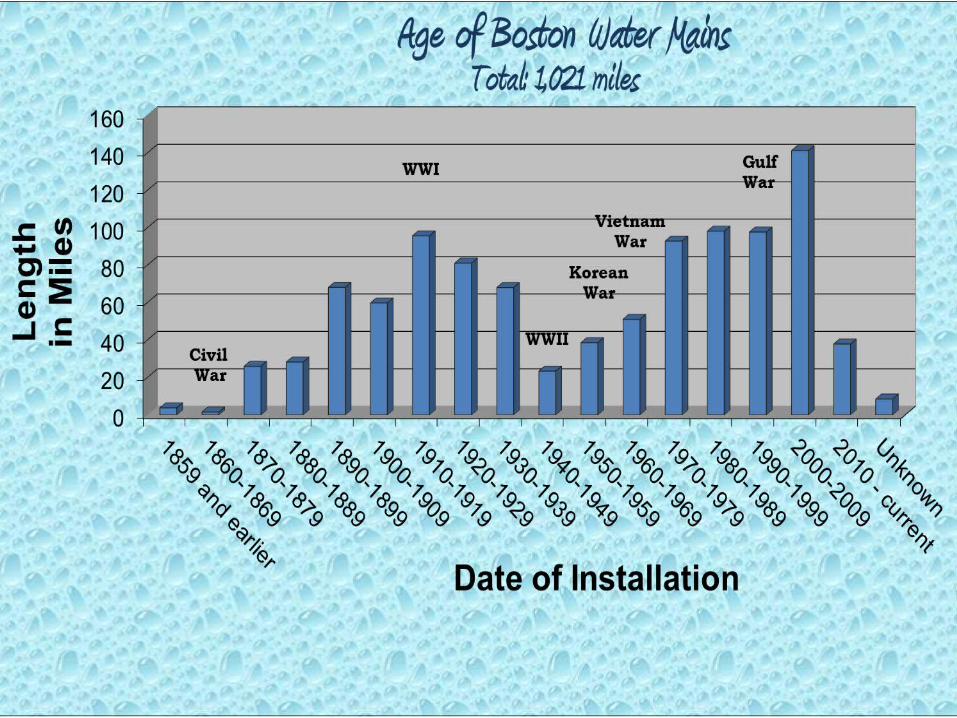
• Five pressure zones 60 psi -112 psi• Supplied from 29 metered locations• 1011 miles of pipe from 4 inch to 48 inch• Approximately 18214 valves• 13,618 hydrants • 90,000 Accounts

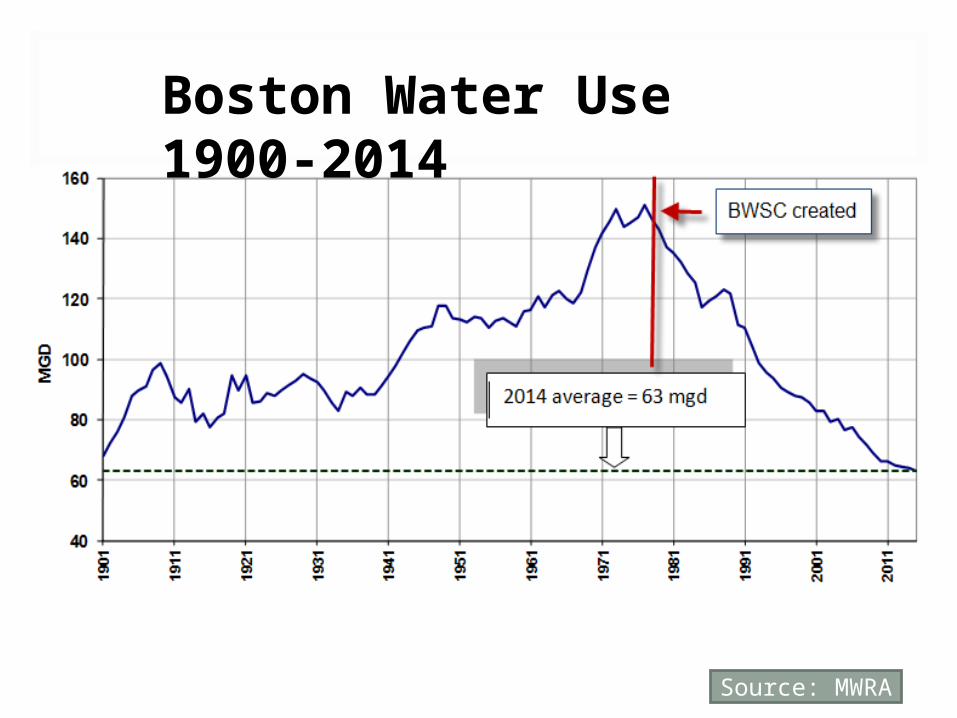
Boston Water Use 1900-2014
Source: MWRA
CURRENT WATER MANAGEMENT
• Active Asset Management of Physical Plant
• MWRA Water Quality Monitoring (Supply)
• Master Metering and Alarms
• AMI
• Leak detection
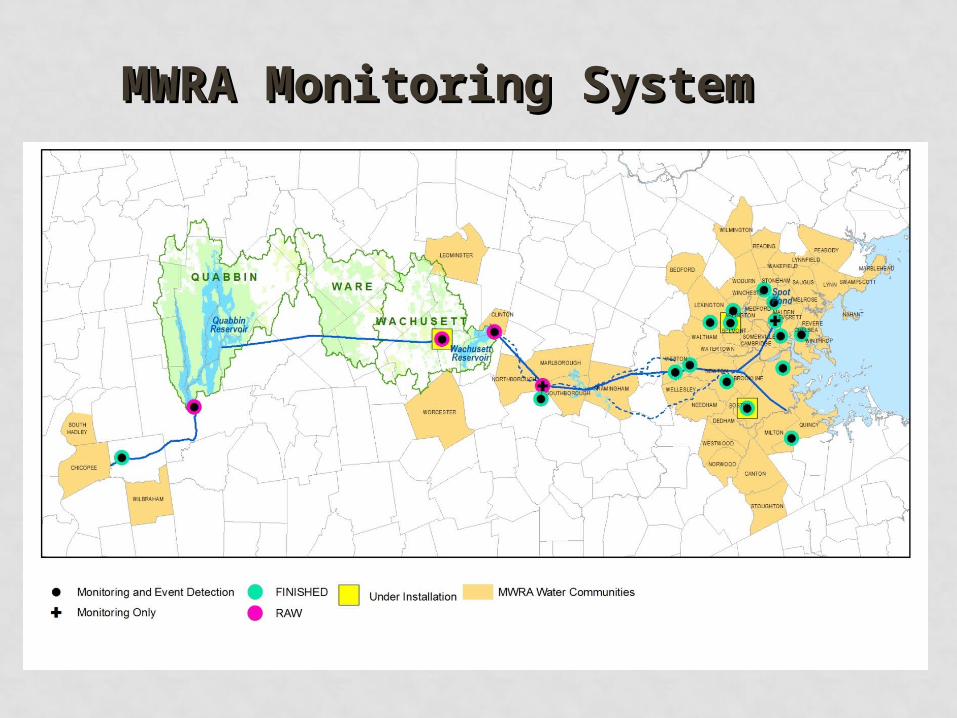
MWRA Monitoring SystemMWRA Monitoring System
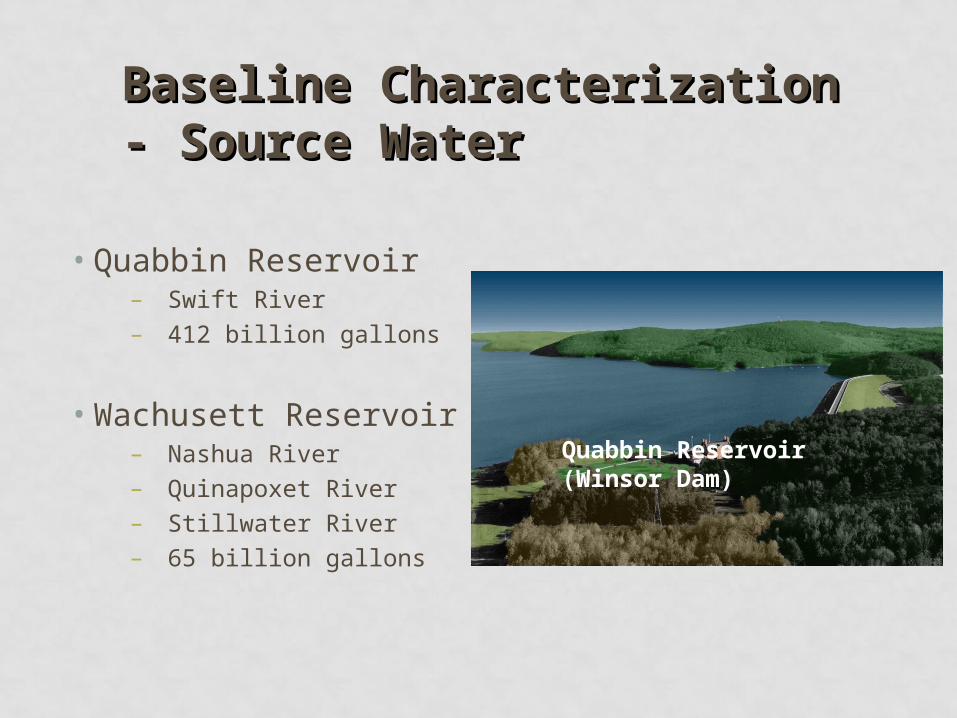
• Quabbin Reservoir– Swift River– 412 billion gallons
• Wachusett Reservoir– Nashua River– Quinapoxet River– Stillwater River– 65 billion gallons
Baseline Characterization - Source Baseline Characterization - Source WaterWater
Norumbega Covered StorageQuabbin Reservoir
(Winsor Dam)
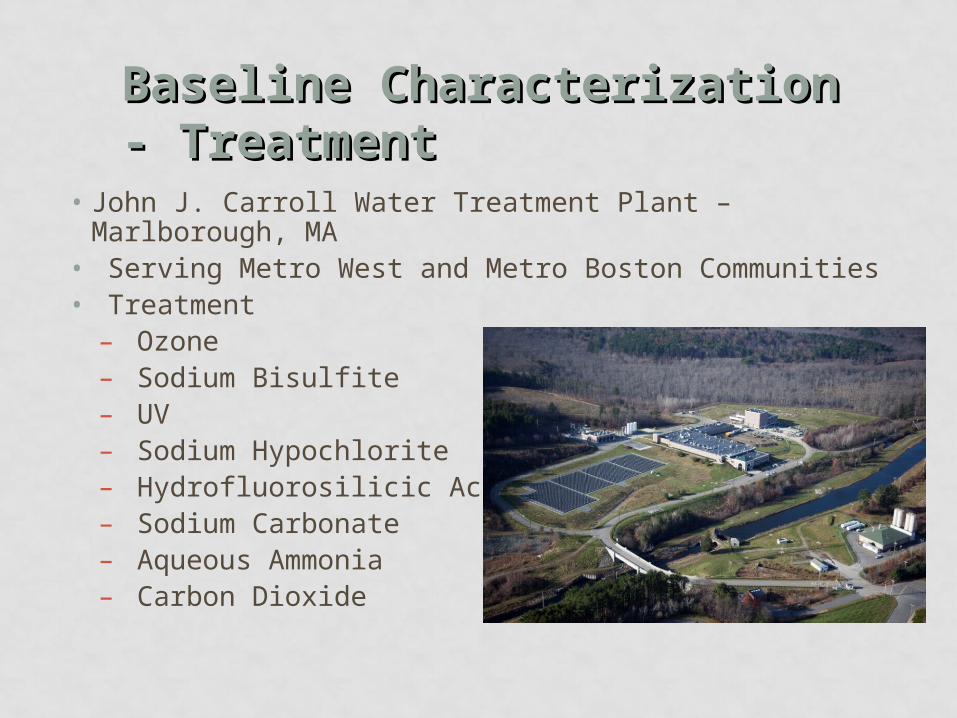
• John J. Carroll Water Treatment Plant – Marlborough, MA• Serving Metro West and Metro Boston Communities• Treatment
– Ozone– Sodium Bisulfite– UV– Sodium Hypochlorite– Hydrofluorosilicic Acid– Sodium Carbonate– Aqueous Ammonia– Carbon Dioxide
Baseline Characterization - Baseline Characterization - TreatmentTreatment
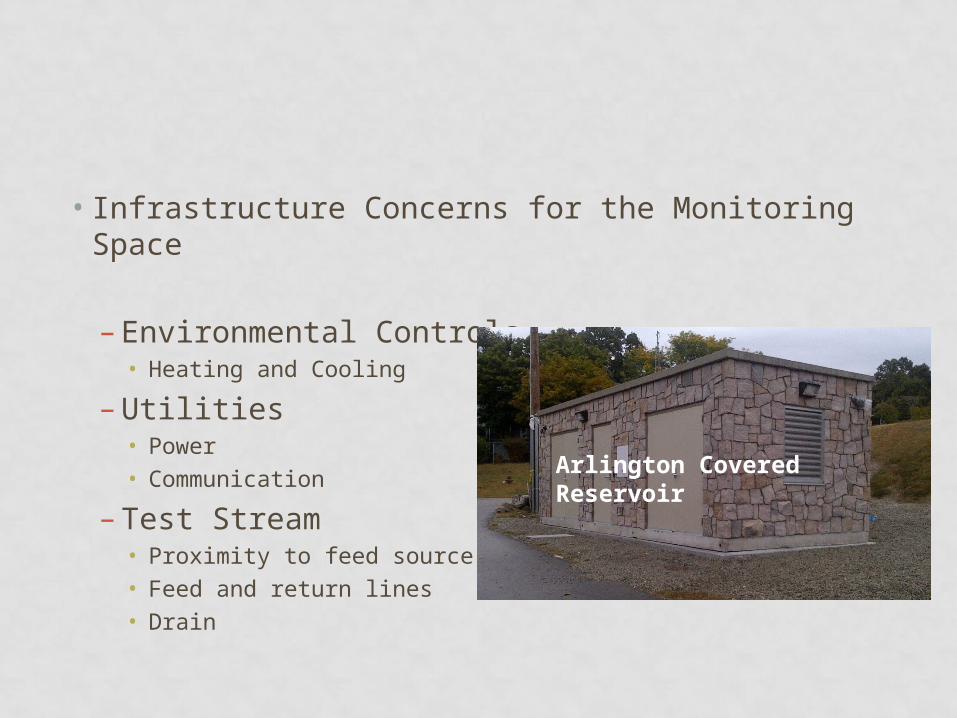
• Infrastructure Concerns for the Monitoring Space
– Environmental Controls• Heating and Cooling
– Utilities• Power• Communication
– Test Stream• Proximity to feed source• Feed and return lines• Drain
Arlington Covered Reservoir
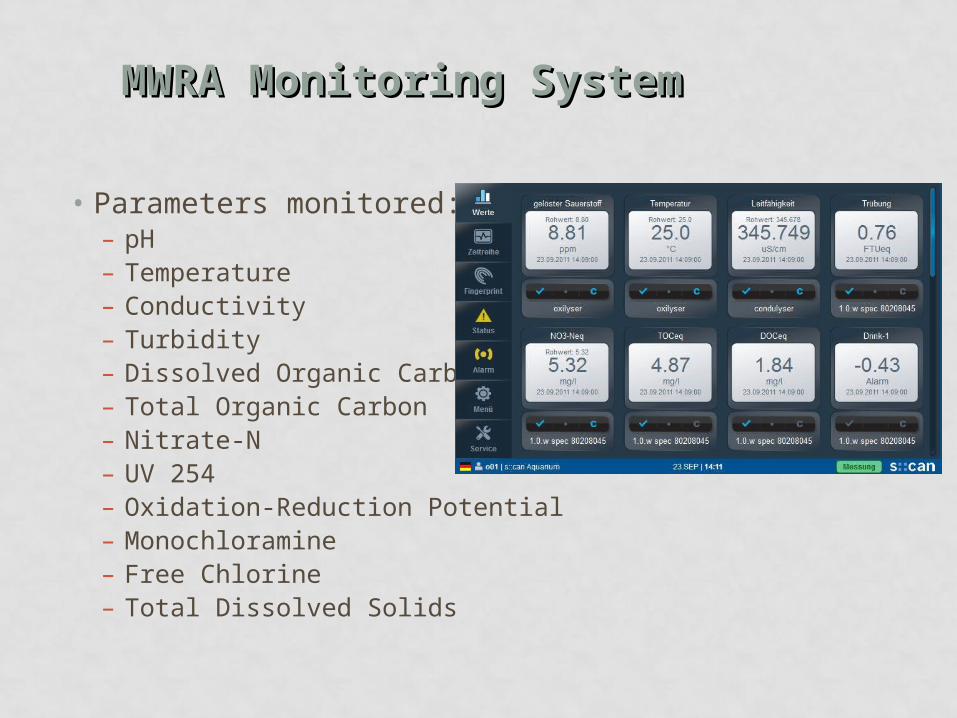
• Parameters monitored:– pH– Temperature– Conductivity– Turbidity– Dissolved Organic Carbon– Total Organic Carbon– Nitrate-N– UV 254– Oxidation-Reduction Potential– Monochloramine – Free Chlorine– Total Dissolved Solids
MWRA Monitoring SystemMWRA Monitoring System
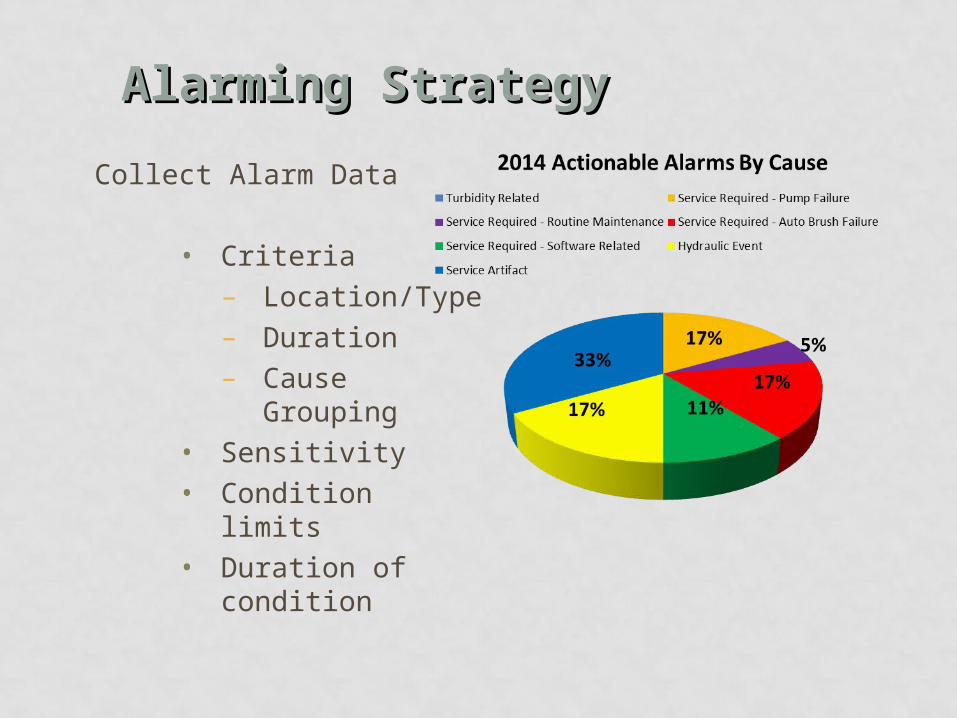
Collect Alarm Data
• Criteria– Location/Type– Duration– Cause
Grouping• Sensitivity• Condition limits • Duration of
condition
Alarming StrategyAlarming Strategy
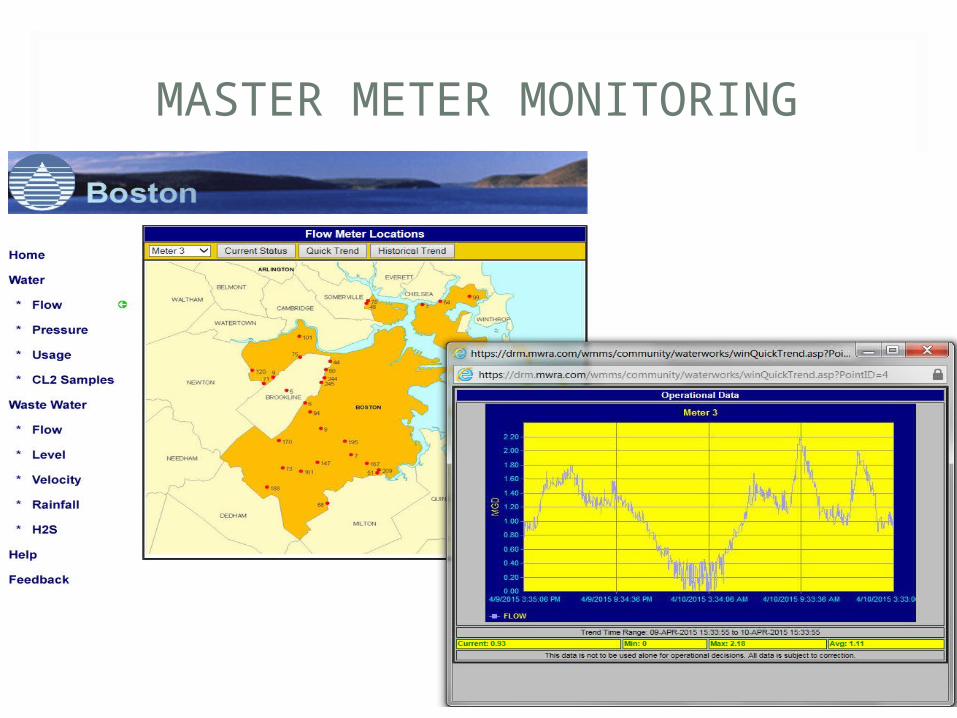
MASTER METER MONITORING

AUTOMATED METERING READING AUTOMATED METERING READING SYSTEMSYSTEM
System operating successfully for over 12 yearsSystem operating successfully for over 12 years
90,000 residential/commercial meters90,000 residential/commercial meters
Four reads per day for each meter – Four reads per day for each meter – 99% accuracy99% accuracy
Updating system to obtain hourly readingsUpdating system to obtain hourly readings
Transmits over a secured FCC licensed frequencyTransmits over a secured FCC licensed frequency
Reduced calls to Customer ServiceReduced calls to Customer Service
74% Reduction in 74% Reduction in Customer Service CallsCustomer Service Calls
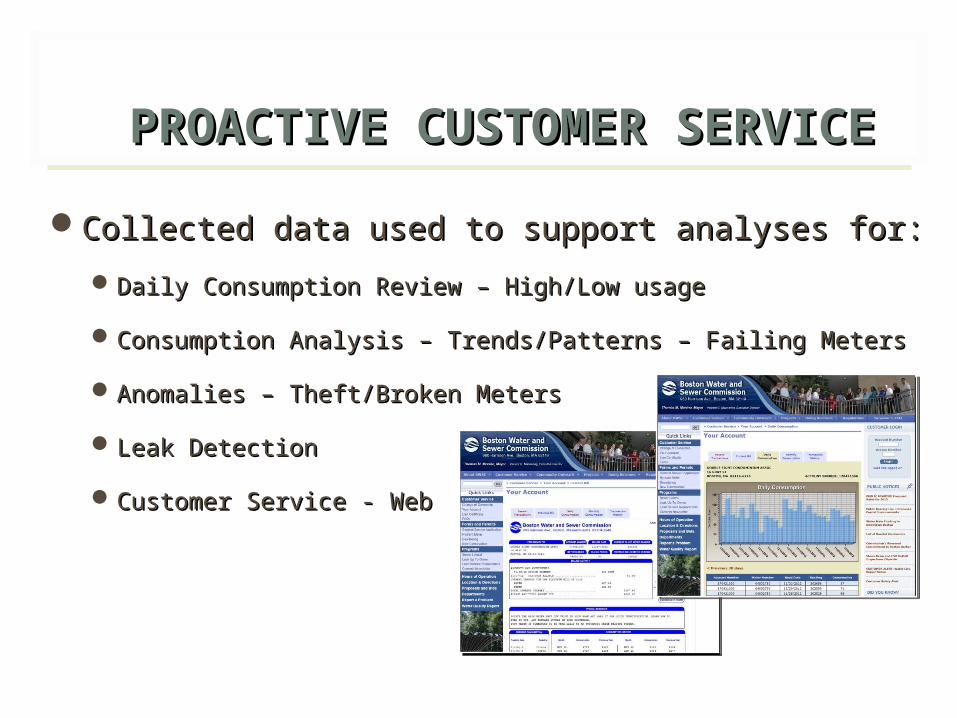
PROACTIVE CUSTOMER SERVICEPROACTIVE CUSTOMER SERVICE
Collected data used to support analyses for: Collected data used to support analyses for:
Daily Consumption Review – High/Low usageDaily Consumption Review – High/Low usage
Consumption Analysis – Trends/Patterns – Failing MetersConsumption Analysis – Trends/Patterns – Failing Meters
Anomalies – Theft/Broken MetersAnomalies – Theft/Broken Meters
Leak DetectionLeak Detection
Customer Service - WebCustomer Service - Web
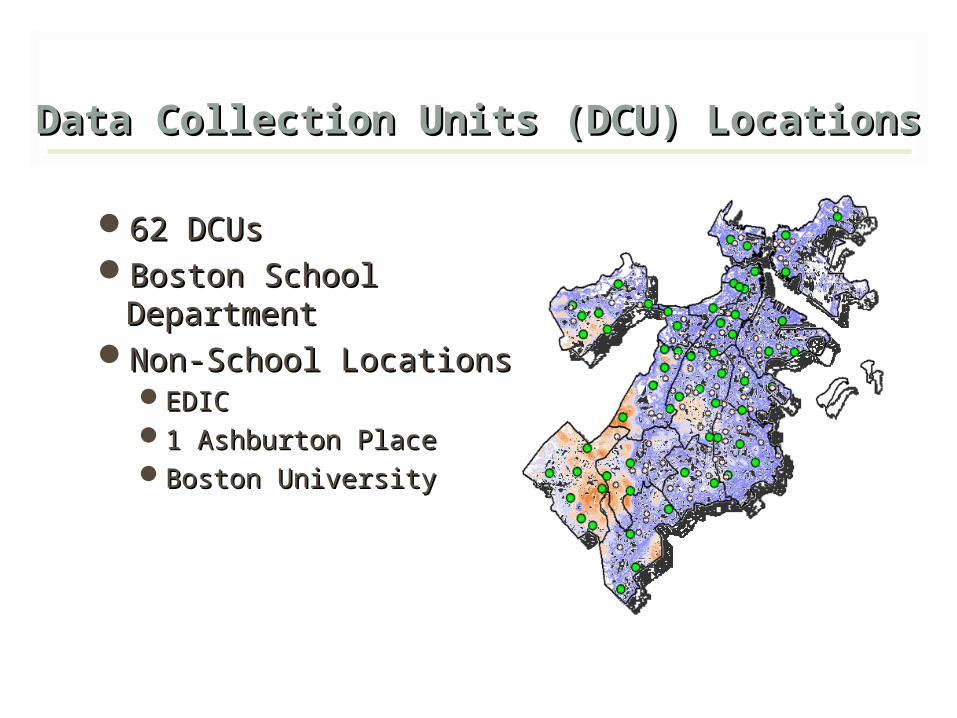
62 DCUs62 DCUsBoston School Boston School
DepartmentDepartmentNon-School LocationsNon-School Locations
EDICEDIC1 Ashburton Place1 Ashburton PlaceBoston UniversityBoston University
Data Collection Units (DCU) LocationsData Collection Units (DCU) Locations
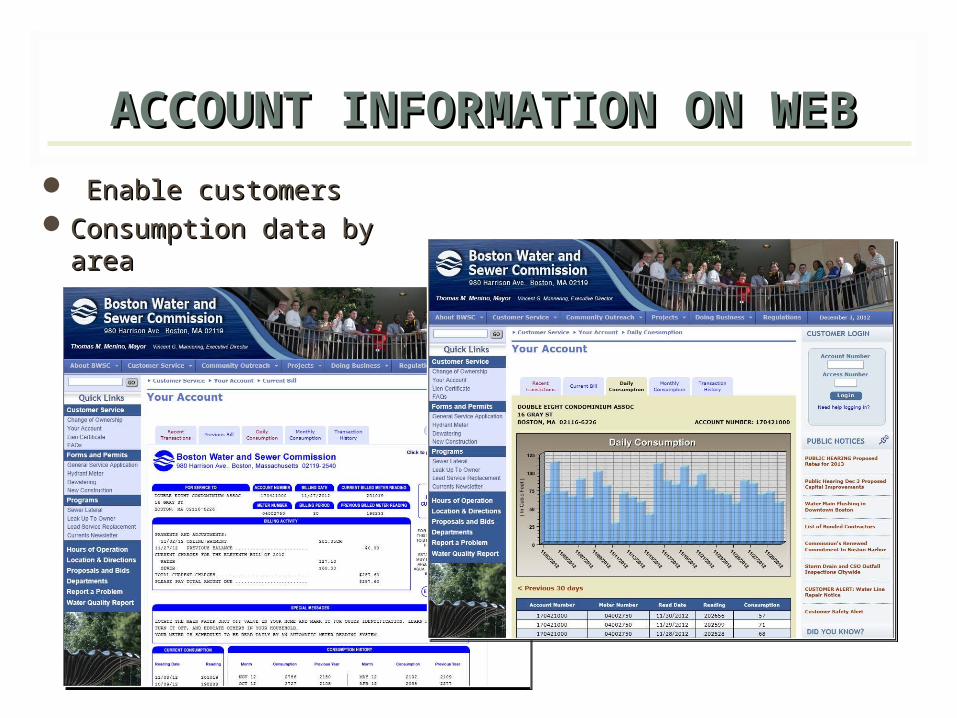
ACCOUNT INFORMATION ON WEBACCOUNT INFORMATION ON WEB Enable customersEnable customersConsumption data by Consumption data by
areaarea
Current UpgradeCurrent Upgrade
• More accurate data - From 4 reads to 24 reads/dayMore accurate data - From 4 reads to 24 reads/day
• Two-way communicationTwo-way communication
• Switch from cellular to WiFi protocolSwitch from cellular to WiFi protocol
• Improved analysis of dataImproved analysis of data
• More robust reporting - Better customer serviceMore robust reporting - Better customer service
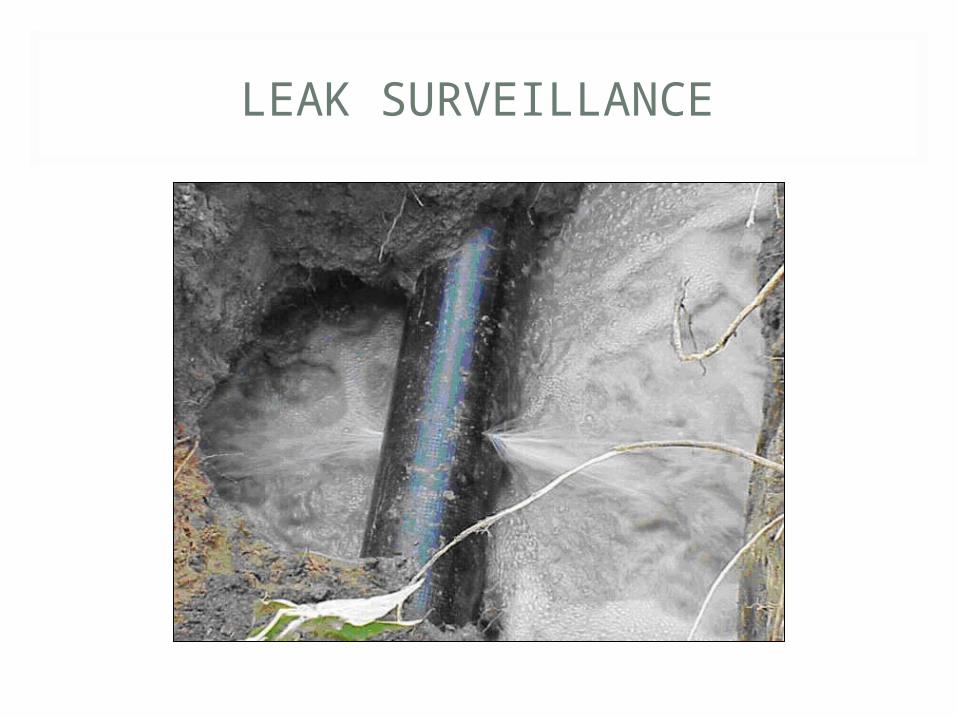
LEAK SURVEILLANCE
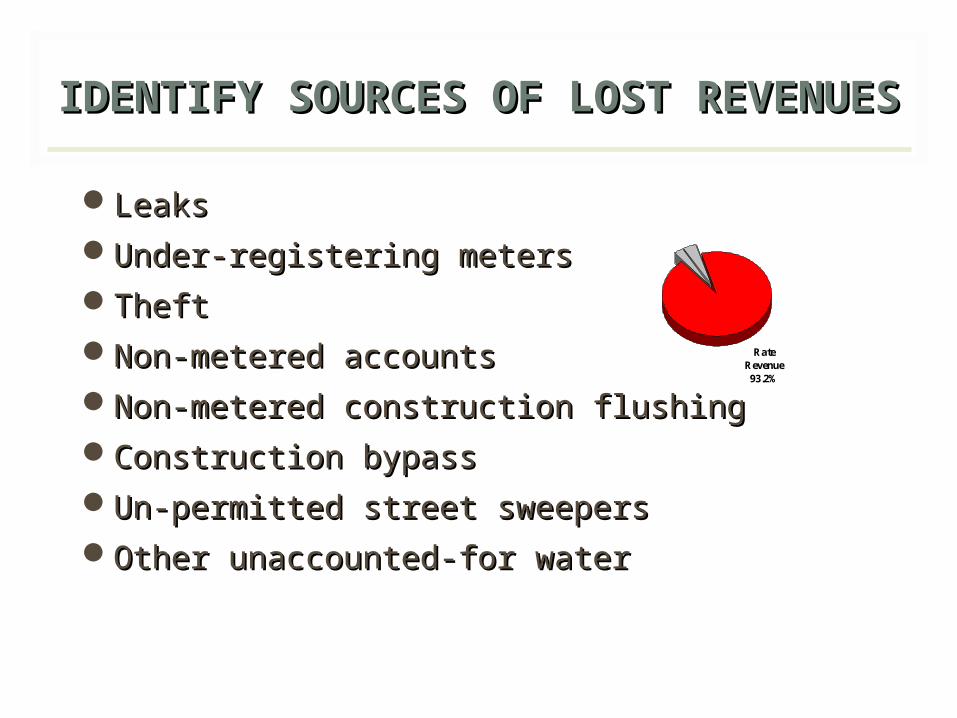
IDENTIFY SOURCES OF LOST IDENTIFY SOURCES OF LOST REVENUESREVENUES
LeaksLeaksUnder-registering metersUnder-registering metersTheftTheftNon-metered accountsNon-metered accountsNon-metered construction flushingNon-metered construction flushingConstruction bypassConstruction bypassUn-permitted street sweepersUn-permitted street sweepersOther unaccounted-for waterOther unaccounted-for water
Rate Revenue93.2%
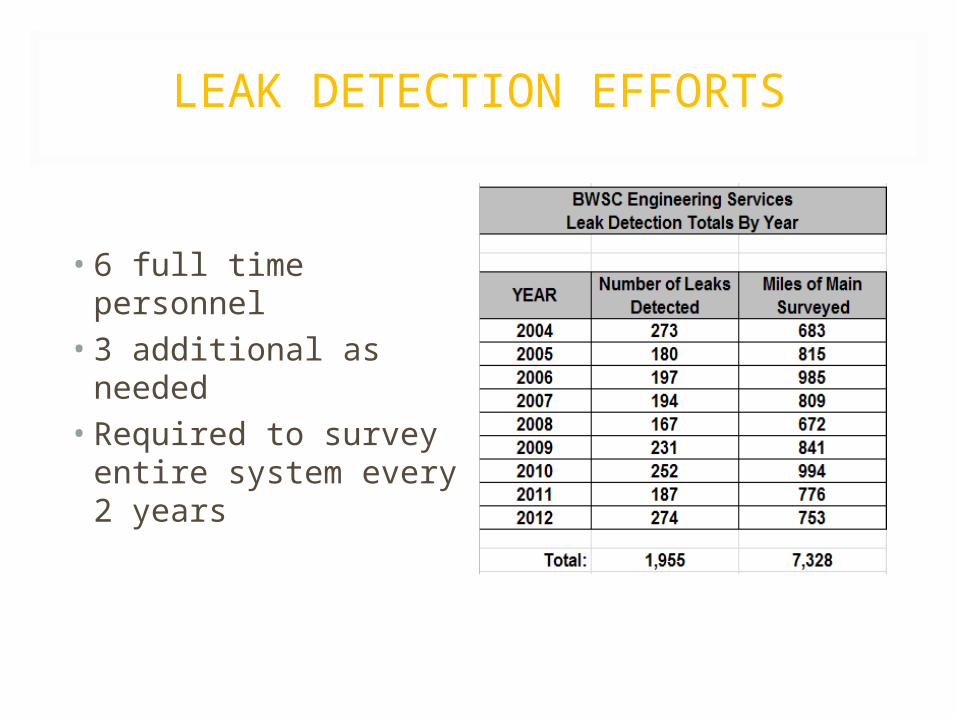
LEAK DETECTION EFFORTS
• 6 full time personnel • 3 additional as needed• Required to survey
entire system every 2 years
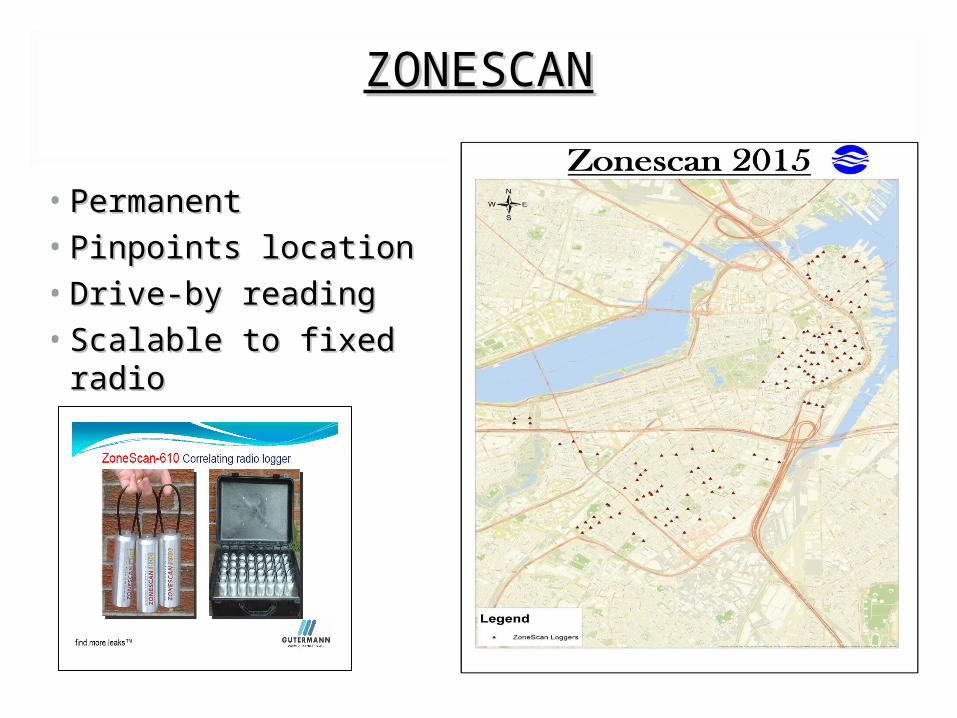
ZONESCANZONESCAN
• PermanentPermanent• Pinpoints locationPinpoints location• Drive-by readingDrive-by reading• Scalable to fixed radioScalable to fixed radio
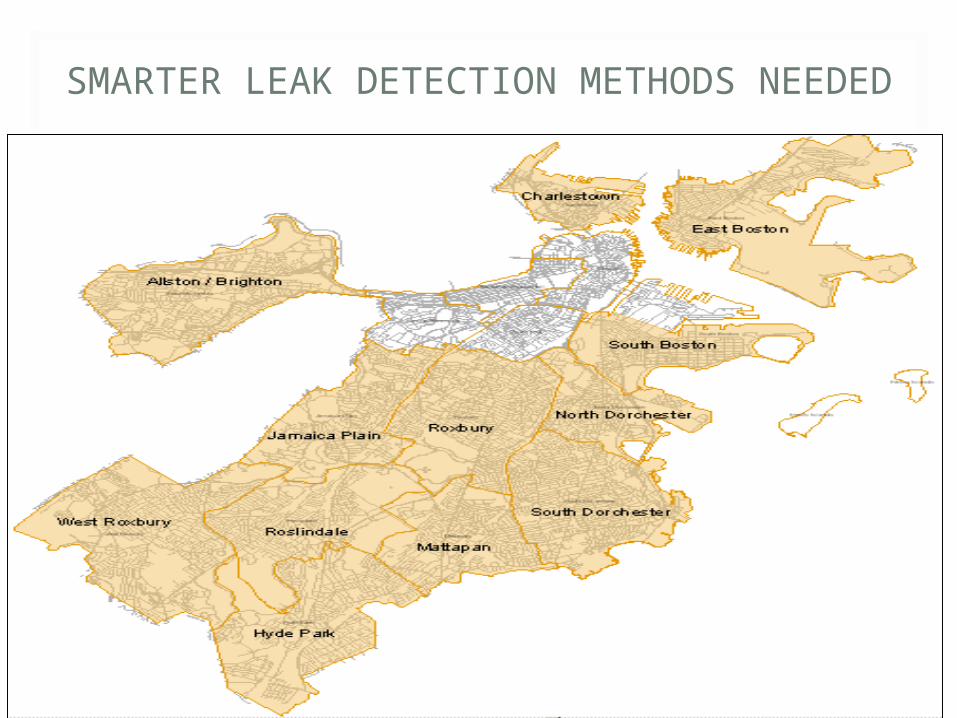
SMARTER LEAK DETECTION METHODS NEEDED
• Permaloggers
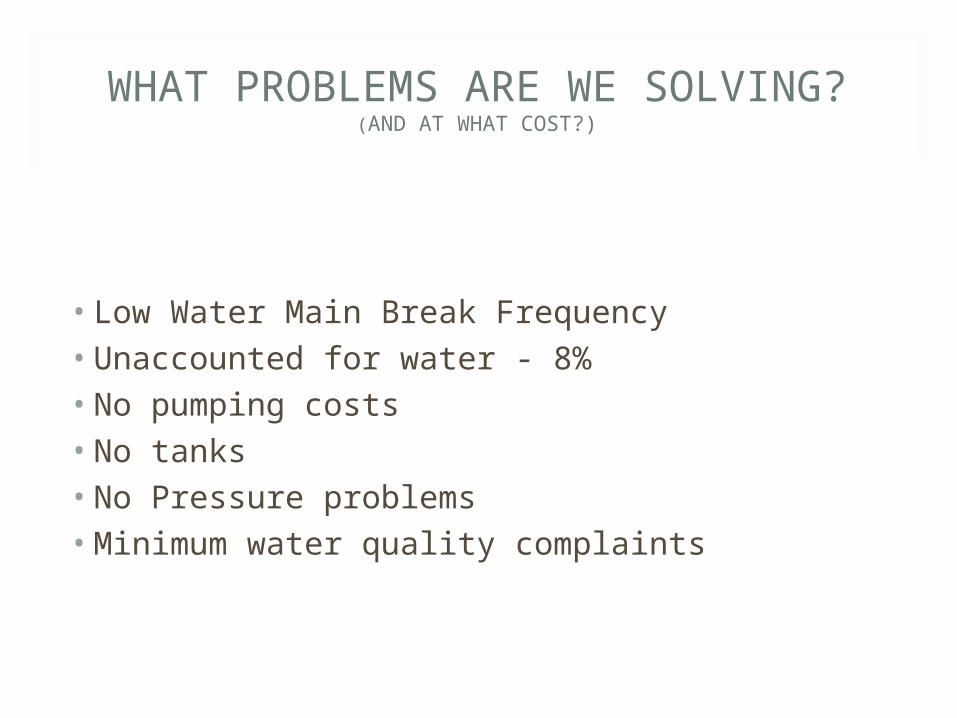
WHAT PROBLEMS ARE WE SOLVING?(AND AT WHAT COST?)
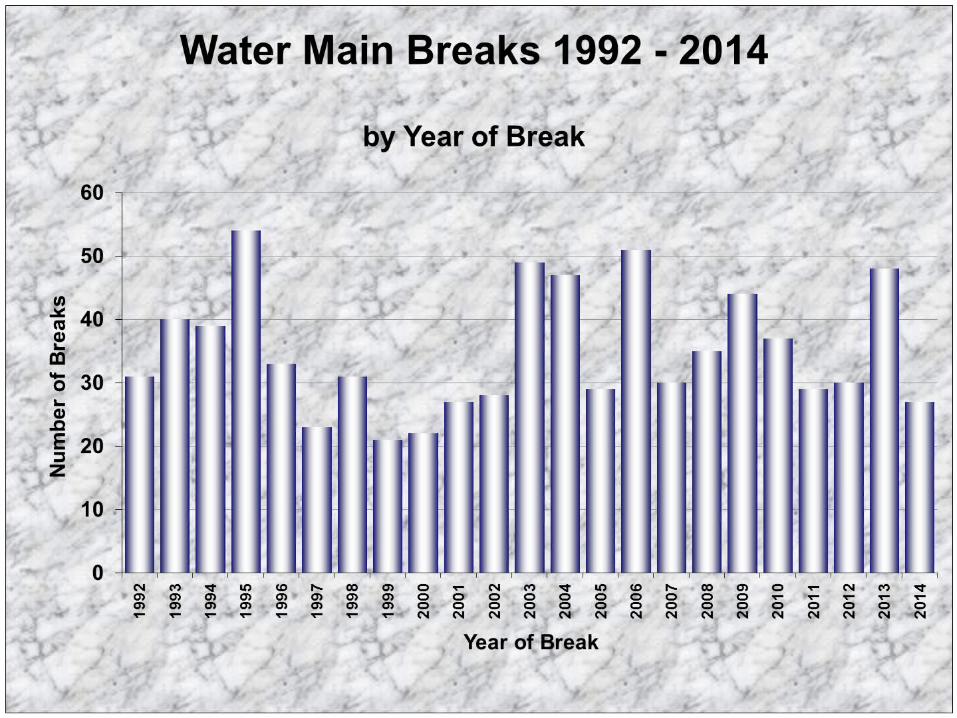
• Low Water Main Break Frequency• Unaccounted for water - 8%• No pumping costs• No tanks• No Pressure problems• Minimum water quality complaints
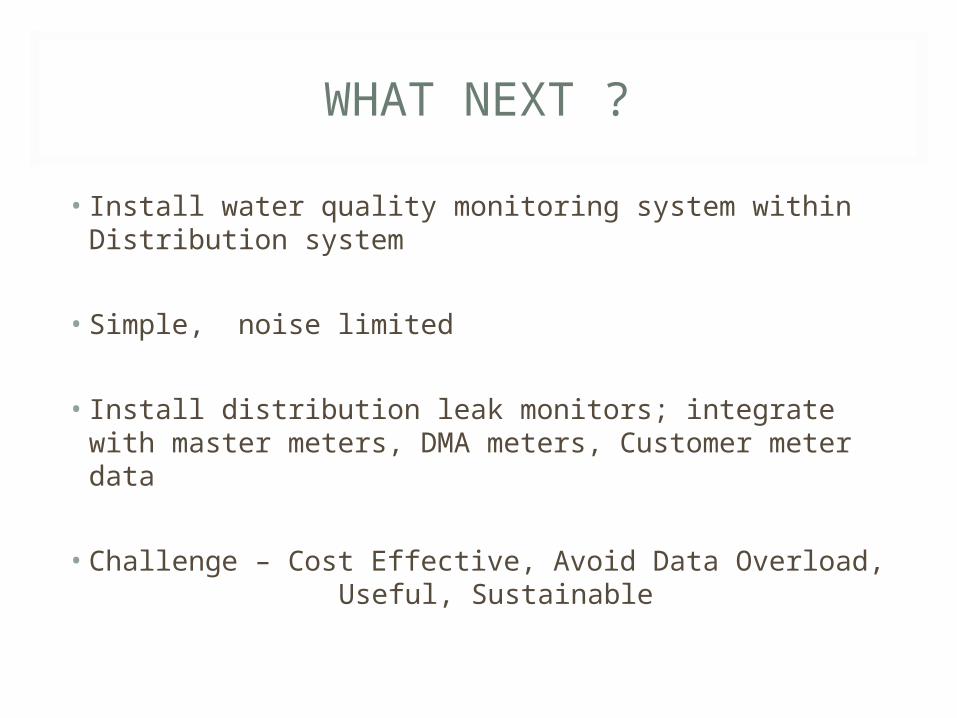
WHAT NEXT ?
• Install water quality monitoring system within Distribution system
• Simple, noise limited
• Install distribution leak monitors; integrate with master meters, DMA meters, Customer meter data
• Challenge – Cost Effective, Avoid Data Overload, Useful, Sustainable

GOAL

Wicked Smart City