Embed Size (px)
Citation preview
Spike-field coherency across marmoset V1
Page 1 of 25
Long-range neural coherence encodes stimulus information in primate visual cortex
Abbreviated Title: Spike-LFP coherency across marmoset V1
Mojtaba Kermani1, Elizabeth Zavitz1, Brian Oakley1, Nicholas S.C. Price1, Maureen A. Hagan1,*,
Yan T. Wong1,2,*
1 Department of Physiology Biomedicine Discovery Institute Monash University Clayton, VIC 3800, Australia 2 Department of Electrical and Computer Systems Engineering Monash University Clayton, VIC 3800, Australia *Joint senior authors
Correspondence should be addressed to:
Yan T Wong, PhD. Electrical and Computer Science Engineering 14 Alliance Lane Monash University Australia [email protected] +61 3 9905 1935
Word counts Abstract (< 250) Significance Statement (<120 words) Introduction (< 650, including citations) Discussion (< 1500) 5 Figures Key Words: Marmoset, V1, spike-LFP coherence, synchronization, mutual information.
Conflict of Interest: The authors declare no competing financial interests.
Acknowledgements: We acknowledge the Australian Research Council (DE180100344, DP200100179) and the National Health and Medical Research Council (APP1185442, APP1120667) for financial support. We also thank Janssen-Cilag for the donation of sufentanil citrate which made our experiments possible.
Spike-field coherency across marmoset V1
Page 2 of 25
Abstract
In the primary visual cortex, neurons with similar receptive field properties are bound together
through widespread networks of horizontal connections that span orientation columns. How
connectivity across the cortical surface relates to stimulus information is not fully understood. We
recorded spiking activity and the local field potential (LFP) from the primary visual cortex of
marmoset monkeys and examined how connectivity between distant orientation columns affect the
encoding of visual orientation.
Regardless of their spatial separation, recording sites with similar orientation preferences have
higher coherence between spiking activity and the local field potential than sites with different
preferred orientation. Using information theoretic methods, we measured the amount of stimulus
information that is shared between pairs of sites. More stimulus information can be decoded from
pairs with the same preferred stimulus orientation than the pairs with a different preferred
orientation, and the amount of information is significantly correlated with the magnitude of beta-
band spike-LFP coherence. These effects remained after controlling for firing rate differences.
Our results thus show that spike-LFP synchronization in the beta-band is associated with the
encoding of stimulus information within the primary visual cortex of marmoset monkeys.
Significance Statement
A fundamental step in processing images in the visual cortex is coordinating the neural activity
across distributed populations of neurons. Here, we demonstrate that populations of neurons in the
primary visual cortex of marmoset monkeys with the same stimulus orientation preference
temporally coordinate their activity patterns when presented with a visual stimulus. We find
maximum synchronization in the beta range depends on the similarity of orientation preference at
each pair of the neural population.
Spike-field coherency across marmoset V1
Page 3 of 25
Introduction
The columnar hypothesis proposes that sensory cortices are comprised of highly connected
modular columns of neurons. In the visual cortex, these columns are formed by clusters of neurons
with similar receptive field properties such as orientation preference (Mountcastle, 1997). A
fundamental step in analyzing a visual object is combining different features of the object such as
orientation which are encoded in spatially separate functional columns.
To combine encoded features, it has been proposed that neurons use intricate networks of long-
range horizontal connections which often preferentially connect clusters of neurons that have
similar orientation preference (Gilbert and Wiesel, 1989; Kisvarday et al., 1989; Kisvárday and
Eysel, 1992; Bosking et al., 1997). Such functional specificity may allow single neurons to
combine information from a larger area in the visual field (i.e. neighboring orientation columns)
than that covered by their individual receptive fields (Burkhalter, 1989; Schwarz and Bolz, 1991;
Malach et al., 1993, 1993; Bosking et al., 1997, Anon, 2013; Liang et al., 2017).
Cross column processing requires temporal structure similarity between columns (Fries, 2005,
2015; Womelsdorf et al., 2007; Fries et al., 2008) and neural synchrony has been theorized as a
major contributor for the precise timing required for neural communications (Buzsáki and
Draguhn, 2004; Fries, 2005, 2015; Dean et al., 2012; Hawellek et al., 2016; Wong et al., 2016).
Earlier studies of the visual cortex of cats have supported this idea by showing that spatially-
separated, orientation-selective neurons with the same stimulus preference synchronize the pattern
of their spiking activities when they are stimulated with a visual stimulus (Gray et al., 1989). Spike
threshold have been shown to be closely correlated with fluctuations in membrane potentials of
cortical neurons in a frequency dependent manner, where spiking activity exhibit a higher
correlation with high-frequency components of membrane potential than the mean membrane
potential (Azouz and Gray, 2003). Therefore, the local field potential (LFP), which is combined
electrical activity in the extracellular medium (Mitzdorf, 1985; Einevoll et al., 2013) may play a
key role on neural synchronization through modulating the excitability of neurons (Buzsáki and
Draguhn, 2004; Buzsaki and Schomburg, 2015; Fries, 2015).
Spike-field coherency across marmoset V1
Page 4 of 25
The relationship between spikes and the LFP in the visual cortex has been quantified using spike-
LFP coherence (SFC), which is the degree of correlation between spikes and different frequency
bands of the LFP. The idea of communication through coherence (CTC) between spikes and the
LFP has been studied in several studies. SFC in visual area V4 is predictive of monkey’s reaction
times for detecting stimulus changes (Womelsdorf et al., 2006). Perception of stimuli during
interocular rivalry can also be tracked by the degree of SFC in primary visual cortex (V1) neurons
(Fries et al., 1997). Visual attention increases SFC between neurons within area V4 (Fries et al.,
2008) and between area V4 and prefrontal cortex neurons (Gregoriou et al., 2009). Layers of the
visual cortex (V1, V2 and V4) exhibit SFC in different frequency bands (Buffalo et al., 2011;
Lashgari et al., 2012). Although these studies have proposed synchronization between visual
neurons as the way of establishing channels for neural communication which can be tracked by
SFC, how SFC across the cortical surface relates to stimulus information is not fully understood.
We propose that in the visual cortex, communication between functional columns is facilitated
when spikes in one column are synchronized with the LFP in another column. Therefore, higher
SFC magnitude is expected to be extracted from pairs of columns with the same stimulus
orientation preference as they are more interconnected than pairs of columns with different
orientation preferences.
We simultaneously recorded visually-evoked spikes and LFPs from V1 of anesthetized marmoset
monkeys. We used spike-LFP coherence and information-theoretic methods to quantify the degree
of synchronization within and between orientation columns. Sites with similar orientation
preferences had higher spike-LFP coherence than sites at the same spatial separation with different
preferred orientations. We measured the amount of stimulus information that is shared between
pairs of sites and found that pairs with the same preferred stimulus orientation hold more stimulus
information than the pairs with different preferred stimulus orientation. The amount of shared
information between pairs is also significantly correlated with beta-band spike-LFP coherence (22
Hz). This suggests that CTC is a plausible mechanism for inter-column information processing.
Methods
Material and methods
Spike-field coherency across marmoset V1
Page 5 of 25
Four adult marmoset monkeys (3 male, 1 female; Callithrix jacchus) were used in this study. All
experimental procedures were approved by the Monash University Animal Ethics committee and
were conducted in accordance with the Australian Code of Practice for the Care and Use of
Animals for Scientific Purposes. After the initial induction of anesthesia using Alfaxalone
(8mg/kg, IM), a tracheotomy, vein cannulation and craniotomy were performed (Zavitz et al.,
2016). After paralyzing the skeletal muscles by using an intravenous bolus of paralytic
(Pancuronium Bromide; 4 mg), the animal was artificially ventilated with a mixture of nitrous
oxide and oxygen (7:3). Anesthesia was maintained by the intravenous administration of
Sufentanil.
Pupillary dilation was achieved with the topical application of atropine (1%, 1 drop/eye) and
phenylephrine hydrochloride (10%; 1 drop/eye). Eyes were fitted with a pair of rigid gas-
permeable contact lenses to prevent corneal drying and appropriate corrective spectacle lenses
were used to bring a display at 1 m into focus.
A craniotomy opening was made over V1. Following a durotomy, a 96-channel “Utah” array
(Blackrock Microsystems) with 1.5 mm electrodes was implanted in each animal using a
pneumatic insertion tool. The location of the array was chosen based on gross anatomical
landmarks and was verified histologically and based on the characteristics of neurons’ receptive
fields. The ipsilateral eye was occluded to achieve monocular vision.
Visual stimuli
Visual stimuli were generated by Psychtoolbox running on MATLAB and presented on an LCD
monitor with linear gamma (Display++, Cambridge Research Systems, UK; 700 mm display
width; 1920 × 1080 pixels refreshed at 120 Hz) positioned at a viewing distance of 1 m. The stimuli
consisted of drifting full contrast sine wave gratings in a circular aperture with 12 equally spaced
directions (six orientations), presented for 500 ms followed by 500 ms grey screen after each trial.
Neurons were characterized based on receptive field location (using flashed squares, 0.25-1
degree), spatial frequency (between 0.2 and 2 cycles per degree) and temporal frequency (between
1 and 10 Hz) tuning. The spatial and temporal frequency that best evoked responses across the
array were chosen and run across stimulus directions where each direction was randomly repeated
Spike-field coherency across marmoset V1
Page 6 of 25
75 times in each block of trials (Fig. 1a). The size of the stimuli was selected to cover all neurons’
receptive fields across the array and ranged from 4.5 to 6 degrees of visual angle.
Electrophysiology
The raw voltage signal was recorded with a Cerebus multichannel data acquisition system
(Blackrock Microsystems) and was filtered at 0.1 – 4000 Hz with a sampling rate of 30 kHz. To
extract spikes and LFP from each electrode, the recorded signal was band-pass filtered in the 4 -
100 Hz range for LFP and in the 300 – 4000 Hz range for the spiking activity. Spike density
functions were derived for each site by binning the spike trains in 50 ms bins and then calculating
a trial-averaged rate smoothed by a Gaussian kernel with 50 ms width for better visualization. The
PSTHs at each of the orientation directions were plotted to visualize the responsiveness of sites to
the stimuli.
In one monkey (M 1), we extracted single units using Wave_clus toolbox running on MATLAB
(Quiroga et al., 2004), which is a semi-automatic spike detection and sorting toolbox using
wavelets and super-paramagnetic clustering. Spikes were detected with a pre-defined amplitude
threshold (3*standard deviation of baseline noise) and were clustered based on their wavelet
coefficients. We found that the peak coherence computed for sorted spikes and multiunit threshold
crossings were not significantly different (p = 0.038, Wilcoxon rank-sum test). Therefore, for that
animal and the other three animals, we only used multiunit data for all further analyses (Trautmann
et al., 2019).
Orientation tuning
For each test direction, we calculated the mean firing rate throughout the stimulus presentation
(500 ms) and plotted them together to yield the tuning curve for each recording site. Orientation
sensitivity was estimated by fitting a Von Mises function described by Equation 1: (Swindale et
al., 2003)
𝑂𝑂𝜃𝜃 = 𝐴𝐴 exp{𝑘𝑘 �cos 2 �Ɵ − Ɵ𝑝𝑝� − 1�} (1)
Spike-field coherency across marmoset V1
Page 7 of 25
Where, O is the response of the model for the stimulus orientation Ɵ, A and k are the maximum
height and width of the orientation tuning curve and Ɵp is the preferred orientation.
Only sites where the fit had an r2 value larger than 0.7 and showed a significantly better fit than a
straight-line function (p-value < 0.05, F test) were identified as orientation-selective and included
for further analysis.
Spike-LFP coherence
The coherency spectrum between spiking activity and LFP was measured using Equation 2 (Mitra
and Pesaran, 1999):
𝐶𝐶𝑎𝑎𝑎𝑎 = 𝑆𝑆𝑎𝑎𝑎𝑎 (𝑓𝑓)√𝑆𝑆𝑎𝑎 (𝑓𝑓)× 𝑆𝑆𝑎𝑎 (𝑓𝑓)
(2)
Where, Sa, Sb and Sab are spectra of spikes, the LFP and their cross-spectral densities. The
coherence magnitude ranges from zero to one where a magnitude of one denotes maximum
correspondence of the two. We used the multitaper method (Thomson, 1982), implemented in
Chronux 2.0 (Bokil et al., 2010) with a 500 ms analysis window and 6 Hz smoothing aligned to
the onset of the stimulus.
Information-theoretic analysis
We quantified how much information about the stimulus is shared between sites by using the
information theoretic analysis method (Shannon, 1948). We calculated the mutual information
(MI) using Equation. (3):
𝑀𝑀𝑀𝑀 (𝑋𝑋:𝑌𝑌) = � 𝑝𝑝 (𝑥𝑥,𝑦𝑦) 𝑙𝑙𝑙𝑙𝑙𝑙2 �𝑝𝑝 (𝑥𝑥,𝑦𝑦)𝑝𝑝 (𝑥𝑥)𝑃𝑃(𝑦𝑦)
�𝑥𝑥 ∈𝑋𝑋,𝑦𝑦 ∈𝑌𝑌
Where, X and Y are spike counts for site 1 and 2, p(X) and P(Y) are the probabilities of observing
the response in the site 1 and 2 evoked by the stimulus during 50 - 350ms stimulus window.
Information theoretic measures suffer from sampling or stimulus-response bias (Panzeri et al.,
2007). To achieve an unbiased estimation of information, we performed bootstrap-based bias-
(3)
Spike-field coherency across marmoset V1
Page 8 of 25
correction method (Panzeri et al., 2007). We also performed significance testing on estimated MI
using Monte Carlo analysis (Timme and Lapish, 2018) and only pairs with p < 0.05 were included
for further analysis.
Spike-Count Correlation Measurements
Spike-count correlations (rsc) were calculated as the Pearson correlation between spike counts of
trial-averaged responses to 12 directions for each pairings, counted over the entire duration of the
stimulus.
LFP phase difference analysis
To quantify the LFP phase difference between pairs, we used a wavelet-based filter to isolate the
22 Hz frequency components of the LFP. Then we applied the fast Fourier transform to estimate
the phase of this complex signal throughout stimulus presentation and quantified the phase
difference for pairs with distance from 400 to 1260 µm.
Statistical analysis
Non-parametric permutation testing was used to assess the statistical significance of the magnitude
of the spike-LFP coherence in each frequency band. In each group, the order of trials in LFP sites
was shuffled 1000 times to create a null distribution. The initial significance was assessed by
comparing the actual spike-LFP coherency (SFC) magnitude values with that of the shuffled
dataset. A cluster-based correction was used for multiple comparisons (Maris and Oostenveld,
2007). All circular statistics were performed using custom-made MATLAB scripts.
Results
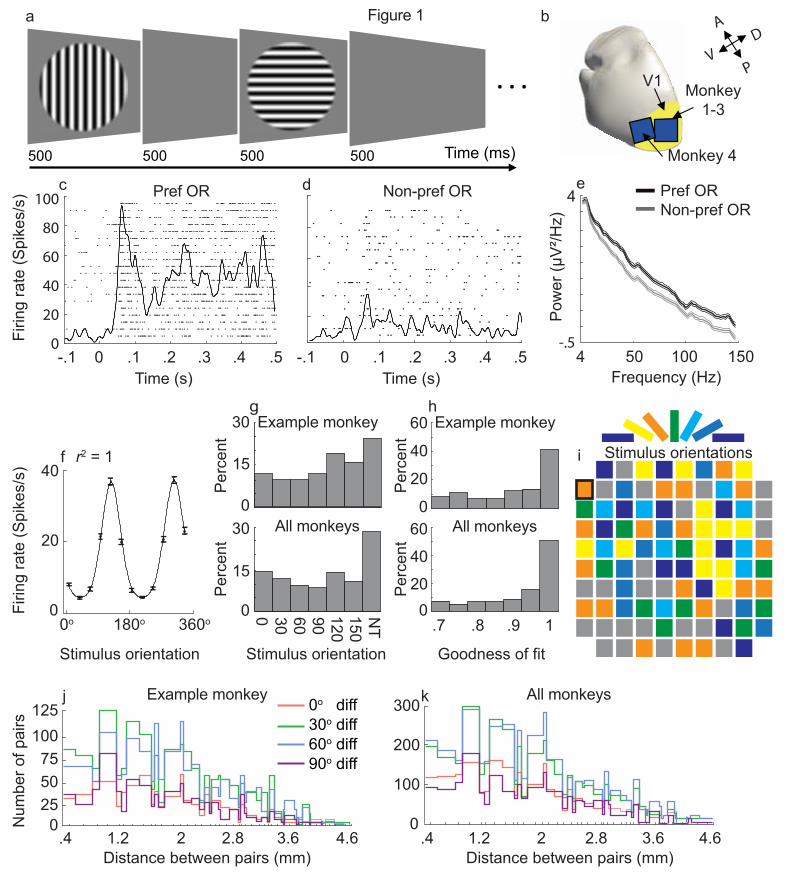
Spiking activity and local LFP potentials (LFPs) in response to visually presented oriented gratings
(Fig 1a) were simultaneously recorded from 96-electrode Utah arrays implanted in the primary
visual cortex (V1) of four anaesthetized marmoset monkeys (Fig. 1b). Neurons showed a brief
Spike-field coherency across marmoset V1
Page 9 of 25
(50-100 ms) transient surge in their firing rate, which was followed by a sustained response for the
duration of the stimulus presentation (Fig 1c,d for preferred and non-preferred orientations,
respectively). The stimulus orientation resulting in a maximum spiking response was selected as
the preferred orientation. An example neural response to the preferred orientation for twenty trials
are represented as a raster plot in Figure 1c for the preferred orientation and Figure 1d for its
perpendicular (non-preferred) orientation. LFP spectral power was also modulated by changes in
stimulus orientation (Fig. 1e; same site as c, d and f).
We recorded from 280 visually responsive sites (< 0.05, t-test, pre- vs post-stimulus onset firing
rates) with 221 (79%) of these showing significant orientation tuning (61, 53, 66 and 41 sites from
animals 1- 4, respectively). Figure 1f illustrates an example of a tuning curve from one recording
site with significant (r2= 1, p = 1.8e-09, F-test) orientation tuning. Only sites with significant
orientation tuning were included for further analysis. The proportion of tuned sites for each
stimulus orientation was different for each animal, however, there was a minimum of seven tuned
sites for each stimulus orientation in each animal. Pooling data across four animals, we found even
representation across all orientations which made our dataset valid for statistical analysis. (Fig.
1g).
To inspect the quality of our recordings, we measured the distribution of the goodness of fit for
sites with significant orientation tuning (Fig. 1h). The tuning was robust with 111 sites showed
the maximum orientation tuning (r2 = 1). Tuned sites were quasi-randomly distributed across the
Utah array (Fig. 1i for an example monkey, M1).
We then paired recording sites and compared their stimulus orientation preference. We recorded
11,225 pairs of orientation-tuned electrodes across all monkeys (3,012, 2,292, 3,498, and 2,423
for monkeys 1 to 4, respectively). The difference in preferred orientation for each electrode pair
was determined (0, 30, 60 or 90-degree preferred orientation difference) as well as the cortical
distance between each electrode pair. Distances between electrodes across the array ranged from
0.4 mm (adjacent electrodes) to 5.1 mm with large numbers of pairs for all preferred orientation
differences across animals (Fig. 1j, example monkey; Fig. 1k, all monkeys).
Spike-LFP pairs with the same preferred stimulus orientation exhibit stronger coherency
Spike-field coherency across marmoset V1
Page 10 of 25
Neural synchronization is a proposed mechanism of enhancing communication between remote
neuronal populations. We hypothesized that columns with the same orientation preference should,
therefore, exhibit robust synchronization and, consequently, highest communication as spikes sent
by one cluster arrive in the other neural cluster during the time window of their maximal
sensitivity. To test whether the strength of synchronization between clusters of neurons was
dependent on stimulus orientation preference (Fig 2a), we measured synchronization across
cortical columns, by calculating spike-LFP coherence between pairs of electrodes using the spiking
activity on one electrode (spike sites) and the LFP on the other electrode (LFP sites), averaged
across all stimuli and all trials.
Spike-LFP pairs were grouped based on the difference in preferred orientation between the spiking
activities on each electrode (0, 30, 60 or 90-degree). We labeled the orientation preference of a
channel using the tuning curve from spiking on that channel and not the preference of the LFPs
themselves as similar with previous studies (Lashgari et al., 2012), we found the same orientation
tuning for LFP and spiking activity in the gamma range (40 -100Hz) in 88.6 % of sites.
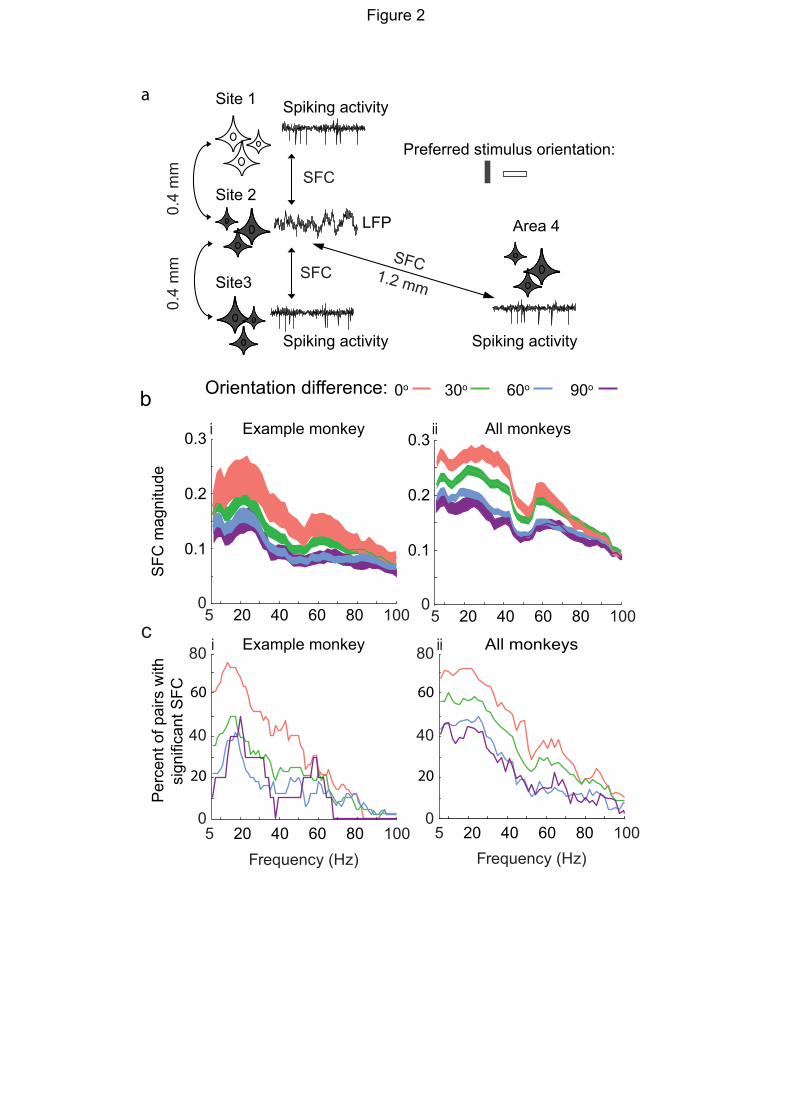
We first quantified the spike-LFP coherence (SFC) of neighboring electrode sites (400 µm
distance) with the same orientation preference. Spike-LFP coherence peaked in the beta-band in
all pairing groups (20-30 Hz Fig. 2bi, example monkey, Monkey 2, n = 358 electrode pairs; Fig
2bii all monkeys, n = 1,091 electrode pairs). It should be noted that electrode pairs are double-
counted (e.g. spike-LFP and LFP-spike).
SFC magnitude decreased when LFP and spike sites had different preferred stimulus orientation.
The amount of attenuation depended on the difference in preferred orientation so that pairs with
the same preferred orientation (0-degree difference) showed the highest SFC, followed by pairs
with 30-degree preferred orientation difference, and then pairs with 60- and 90-degree preferred
orientation difference.
We fit a linear mixed-effects model and corrected p-values for multiple comparisons to study the
main effect of orientation difference on SFC at 22 Hz (peak of the SFC). We found that orientation
difference significantly affects SFC at 22 Hz (F (2.703, 500.9) = 16.65, p < 0.0001). Spike-LFP
pairs with the same orientation preference had significantly higher SFC magnitudes than pairs with
Spike-field coherency across marmoset V1
Page 11 of 25
30 degree (22 Hz, p = 0.0017,), 60 degree (p < 0.001) and 90 degree (p < 0.001) difference in
preferred orientation. Pairs with 30 and 60 degree difference in preferred orientation had also
significantly higher SFC magnitudes than pairs with 90 degree difference (p < 0.001 and p < 0.018,
respectively).
To show the prevalence of the observed significant SFC effect, we also quantified the percentage
of pairs showing significant SFC in each frequency band. The percentage of pairs showing
significant SFC was higher for pairs with the same preferred orientation than pairs with different
preferred orientations (Fig. 2ci and 2cii for example and all monkeys, respectively). The
percentage of significant SFC pairs peaked in the beta-band (Fig. 2cii, 72% at 22 Hz for all
monkeys), and gradually decreased at higher frequencies, similar to the decrease in SFC magnitude
across frequency.
Previous studies have noted SFC peaks in the gamma-band range in primary visual cortex (Siegel
and König, 2003; Burns et al., 2010; Lashgari et al., 2012). These studies often calculate SFC from
spikes and LFPs on the same electrode. Our peaks in the beta-band may be due to the minimum
distance between electrodes (400um). To test this, we repeated the spike-LFP coherence analysis
in all animals by taking spikes and the LFP from the same electrode. On a subset of sites (30/96,
31%) the peak of the SFC magnitude appeared in the gamma range (> 30 Hz), compared to ten
sites when the LFP and spikes were obtained from neighboring electrodes (10/96 sites, 10 %).
Therefore, the peak of SFC can be affected by the method by which it is computed.
Distant orientation columns exhibit functional connectivity
Previous neuronal tracing studies have shown that distant orientation columns with the same
orientation preference are preferentially connected (Gilbert and Wiesel, 1989; Malach et al., 1993;
Bosking et al., 1997; Stettler et al., 2002). To test whether columns are functionally connected and
whether functional connectivity across cortical distance changed as a function of orientation
preference, SFC was calculated for all electrode pairs across the array (n = 11,225 pairs for four
monkeys).
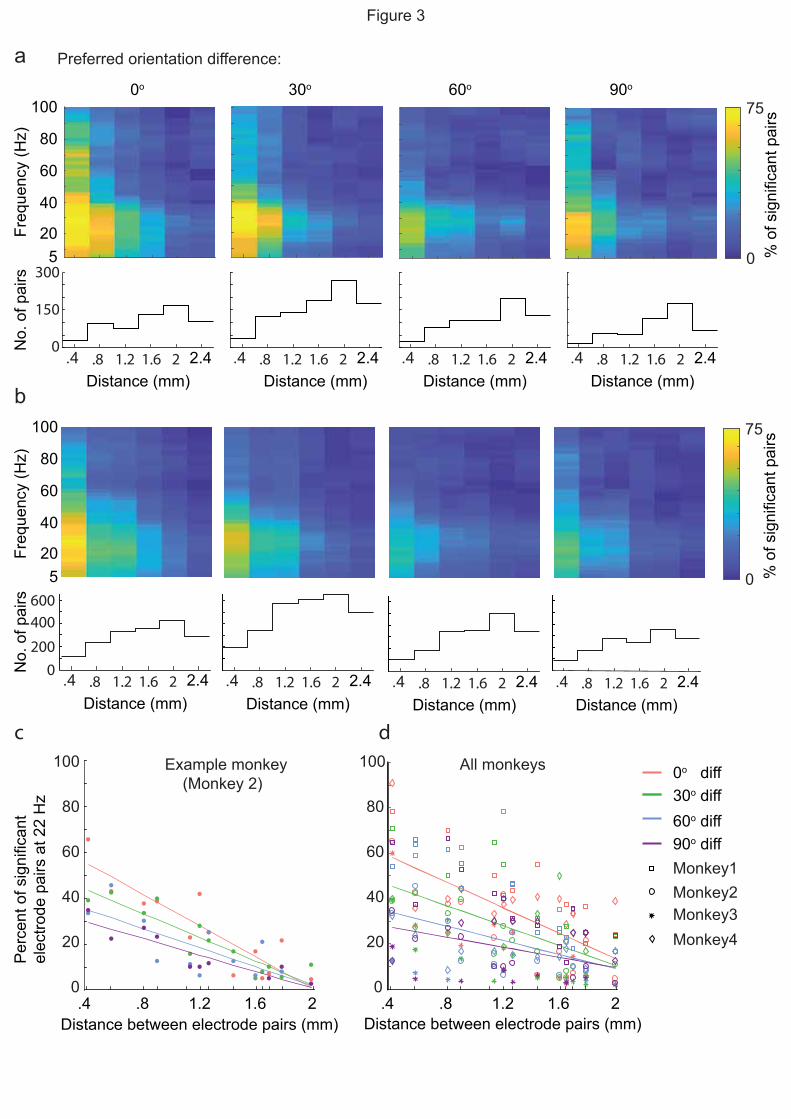
At each distance within each of the four preferred orientation difference groups, the percentage of
pairs that showed significant SFC (p < 0.05, permutation test) was quantified. Although the
Spike-field coherency across marmoset V1
Page 12 of 25
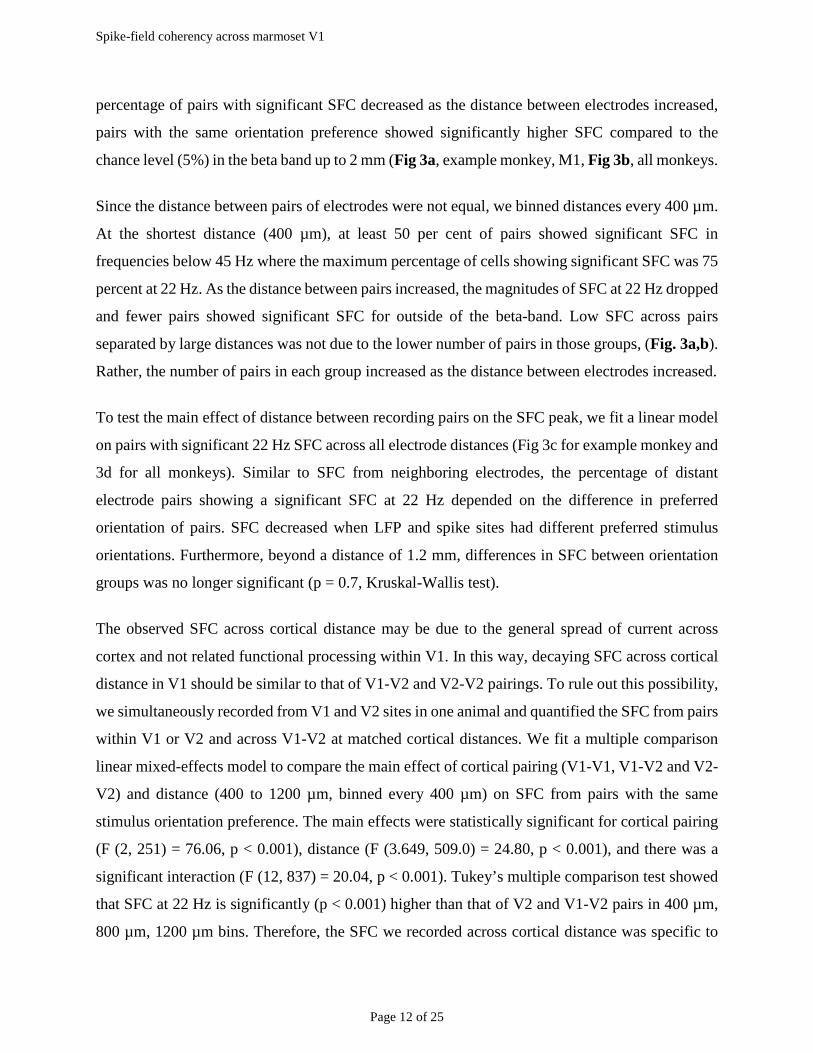
percentage of pairs with significant SFC decreased as the distance between electrodes increased,
pairs with the same orientation preference showed significantly higher SFC compared to the
chance level (5%) in the beta band up to 2 mm (Fig 3a, example monkey, M1, Fig 3b, all monkeys.
Since the distance between pairs of electrodes were not equal, we binned distances every 400 µm.
At the shortest distance (400 µm), at least 50 per cent of pairs showed significant SFC in
frequencies below 45 Hz where the maximum percentage of cells showing significant SFC was 75
percent at 22 Hz. As the distance between pairs increased, the magnitudes of SFC at 22 Hz dropped
and fewer pairs showed significant SFC for outside of the beta-band. Low SFC across pairs
separated by large distances was not due to the lower number of pairs in those groups, (Fig. 3a,b).
Rather, the number of pairs in each group increased as the distance between electrodes increased.
To test the main effect of distance between recording pairs on the SFC peak, we fit a linear model
on pairs with significant 22 Hz SFC across all electrode distances (Fig 3c for example monkey and
3d for all monkeys). Similar to SFC from neighboring electrodes, the percentage of distant
electrode pairs showing a significant SFC at 22 Hz depended on the difference in preferred
orientation of pairs. SFC decreased when LFP and spike sites had different preferred stimulus
orientations. Furthermore, beyond a distance of 1.2 mm, differences in SFC between orientation
groups was no longer significant (p = 0.7, Kruskal-Wallis test).
The observed SFC across cortical distance may be due to the general spread of current across
cortex and not related functional processing within V1. In this way, decaying SFC across cortical
distance in V1 should be similar to that of V1-V2 and V2-V2 pairings. To rule out this possibility,
we simultaneously recorded from V1 and V2 sites in one animal and quantified the SFC from pairs
within V1 or V2 and across V1-V2 at matched cortical distances. We fit a multiple comparison
linear mixed-effects model to compare the main effect of cortical pairing (V1-V1, V1-V2 and V2-
V2) and distance (400 to 1200 µm, binned every 400 µm) on SFC from pairs with the same
stimulus orientation preference. The main effects were statistically significant for cortical pairing
(F (2, 251) = 76.06, p < 0.001), distance (F (3.649, 509.0) = 24.80, p < 0.001), and there was a
significant interaction (F (12, 837) = 20.04, p < 0.001). Tukey’s multiple comparison test showed
that SFC at 22 Hz is significantly (p < 0.001) higher than that of V2 and V1-V2 pairs in 400 µm,
800 µm, 1200 µm bins. Therefore, the SFC we recorded across cortical distance was specific to
Spike-field coherency across marmoset V1
Page 13 of 25
processing within V1 where the decay in SFC across cortical distances is perhaps due to decrease
in horizontal connections and not a general effect of cortical distance.
An earlier study (Jia et al., 2013) found a greater phase difference between V1 and V2 gamma
rhythms compared to pairs of V1 sites. We repeated this analysis and measured the phase
difference between V1 and V2 at 22 Hz. The circular mean phase difference for V1 (210 pairs)
and V1-V2 (114) pairings were 28.1 ± 0.1 and 40.1 ± 0.3 degrees, respectively. This further
suggests that our measures of functional connectivity are not simply due to cortical distance.
Differences in spike-LFP coherence cannot be explained by firing rate alone
Differences in the spike-LFP coherency may be influenced by the spike rate. By definition, firing
rates are higher at the preferred orientation. This means that a higher SFC magnitude in pairs with
the same preferred orientation in Figure 2 could be due in part to a higher spike rate of pairs in this
group.
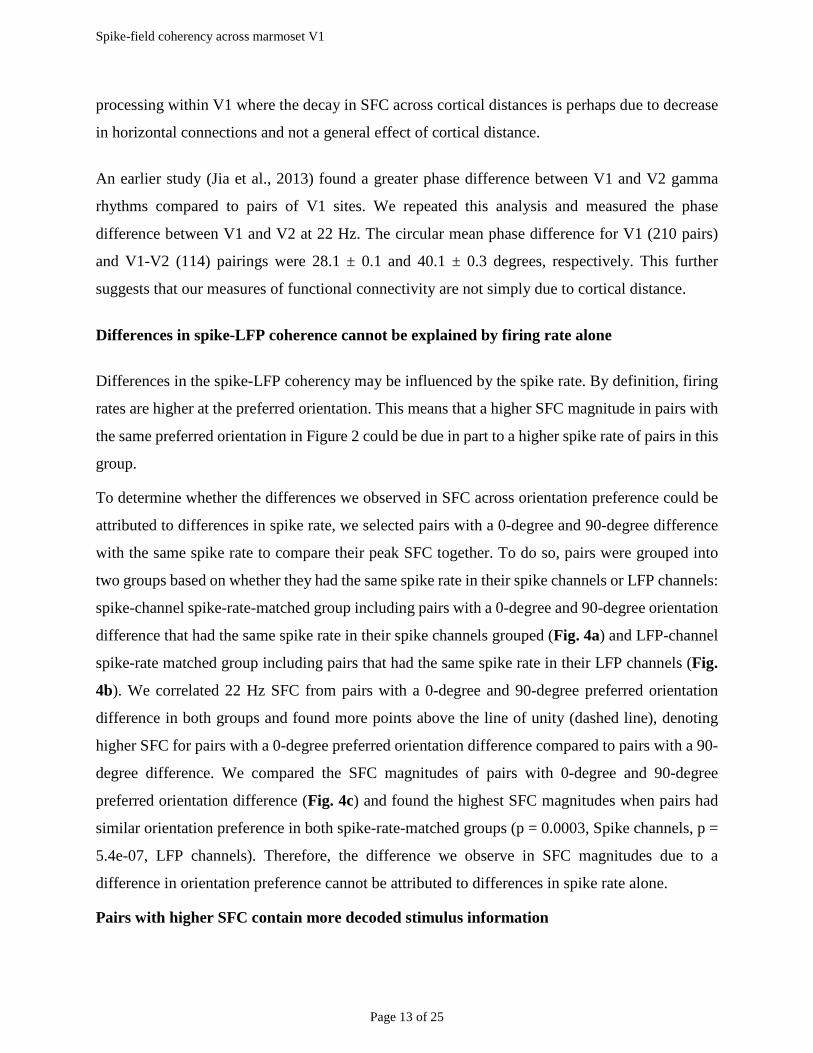
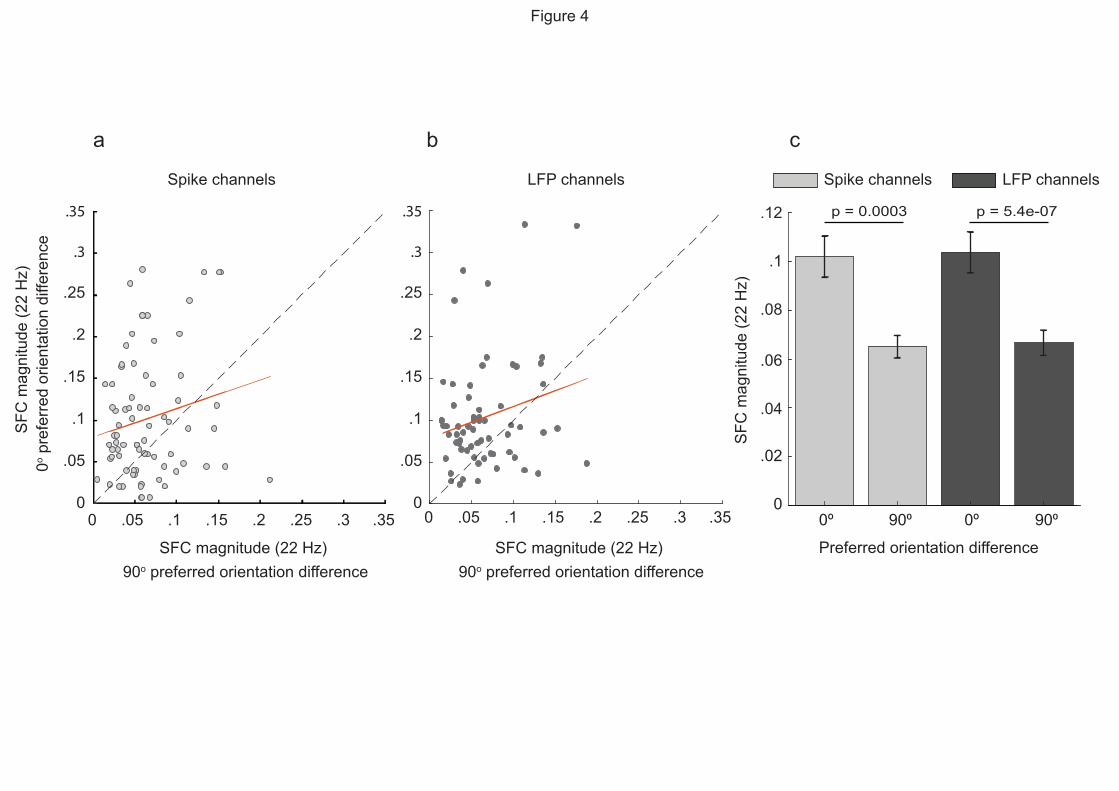
To determine whether the differences we observed in SFC across orientation preference could be
attributed to differences in spike rate, we selected pairs with a 0-degree and 90-degree difference
with the same spike rate to compare their peak SFC together. To do so, pairs were grouped into
two groups based on whether they had the same spike rate in their spike channels or LFP channels:
spike-channel spike-rate-matched group including pairs with a 0-degree and 90-degree orientation
difference that had the same spike rate in their spike channels grouped (Fig. 4a) and LFP-channel
spike-rate matched group including pairs that had the same spike rate in their LFP channels (Fig.
4b). We correlated 22 Hz SFC from pairs with a 0-degree and 90-degree preferred orientation
difference in both groups and found more points above the line of unity (dashed line), denoting
higher SFC for pairs with a 0-degree preferred orientation difference compared to pairs with a 90-
degree difference. We compared the SFC magnitudes of pairs with 0-degree and 90-degree
preferred orientation difference (Fig. 4c) and found the highest SFC magnitudes when pairs had
similar orientation preference in both spike-rate-matched groups (p = 0.0003, Spike channels, p =
5.4e-07, LFP channels). Therefore, the difference we observe in SFC magnitudes due to a
difference in orientation preference cannot be attributed to differences in spike rate alone.
Pairs with higher SFC contain more decoded stimulus information
Spike-field coherency across marmoset V1
Page 14 of 25
More information can be decoded from a neuron’s responses to a preferred stimulus compared to
that of non-preferred stimuli (Kang, 2004). To determine whether the functional connectivity
correlates with the amount of decoded information about the stimulus, we used an information-
theoretic method to quantify how much information about the stimulus is shared between pairs of
sites.
We grouped neurons’ spike count for all stimulus orientations (12 orientations, 900 trials) for each
site and then measured the mutual information for each possible electrode pair. Next, we grouped
the pairs based on their difference in preferred orientation difference. We found significantly
higher mutual information from pairs with the same preferred orientation preference (0.61 ± 0.01
bits) than pairs with different preference (0.5 ± 0.015, 0.46 ± 0.012 and 0.42 ± 0.018 for 30 degree,
60 degree and 90 degree difference, respectively).
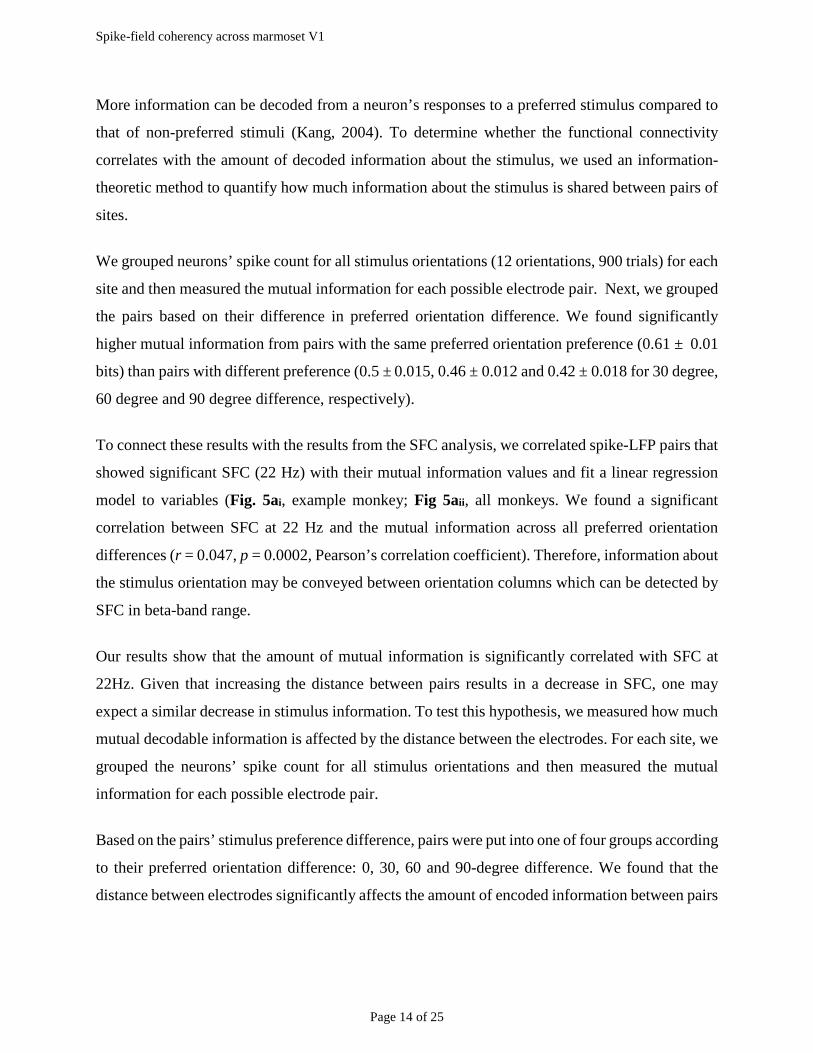
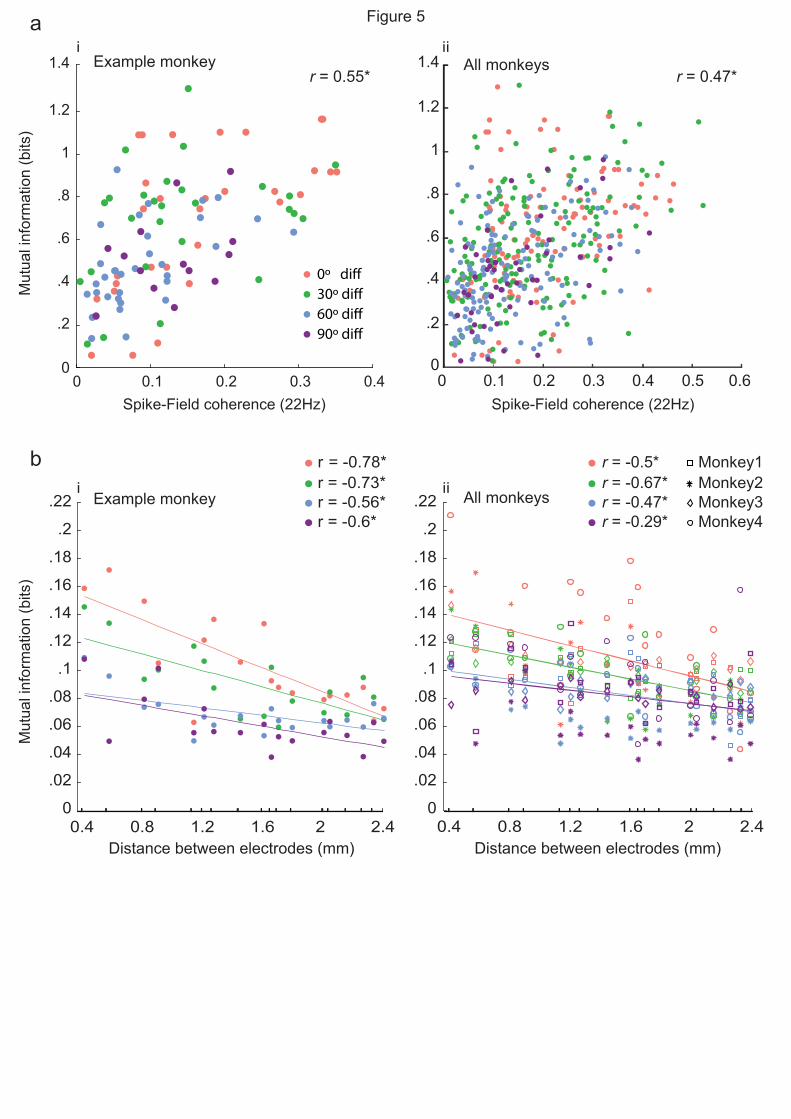
To connect these results with the results from the SFC analysis, we correlated spike-LFP pairs that
showed significant SFC (22 Hz) with their mutual information values and fit a linear regression
model to variables (Fig. 5ai, example monkey; Fig 5aii, all monkeys. We found a significant
correlation between SFC at 22 Hz and the mutual information across all preferred orientation
differences (r = 0.047, p = 0.0002, Pearson’s correlation coefficient). Therefore, information about
the stimulus orientation may be conveyed between orientation columns which can be detected by
SFC in beta-band range.
Our results show that the amount of mutual information is significantly correlated with SFC at
22Hz. Given that increasing the distance between pairs results in a decrease in SFC, one may
expect a similar decrease in stimulus information. To test this hypothesis, we measured how much
mutual decodable information is affected by the distance between the electrodes. For each site, we
grouped the neurons’ spike count for all stimulus orientations and then measured the mutual
information for each possible electrode pair.
Based on the pairs’ stimulus preference difference, pairs were put into one of four groups according
to their preferred orientation difference: 0, 30, 60 and 90-degree difference. We found that the
distance between electrodes significantly affects the amount of encoded information between pairs
Spike-field coherency across marmoset V1
Page 15 of 25
of sites in all groups (p < 0.05). As the distance between the recordings sites increases, the mutual
information decreases (Fig. 5bi, example monkey; Fig 5bii, all monkeys).
The mutual information that we measure is akin to correlating the neurons tuning curves and
significant correlation between SFC and MI denotes higher coherence between neurons with
similar tuning curves. To make sure that the measured mutual information is mainly influenced by
the similarity between pairings’ tuning cures and not by stimulus-induced variations in the spike
rates, we calculated rsc for each pair and measured Pearson correlation between rsc and MI. We
found significant positive correlation for sample monkey (r = 0.47, p = 0.01) and all monkeys (r =
0.5, p = 0.02)
Discussion
We use a spike-LFP approach in this paper to study how neurons in orientation columns of V1
temporarily coordinate their activity patterns in response to a visual stimulus.
We quantified the SFC between neighboring (400 µm) and distant sites (up to 5.6 mm) in V1 and
found that the magnitude of the SFC in pairs where both sites have the same preferred orientation
preference is higher than that of pairs with different orientation preference. Higher SFC in spike-
LFP pairs whose stimulus preferences were similar was not due to higher spike rates. Therefore,
our results indicate that neurons in distant orientation columns can synchronize their activities
where the level of synchronization depends on how much their stimulus preference is similar. To
test whether synchronization between orientation columns can improve stimulus encoding, we
used information-theoretic methods and found that more stimulus information can be decoded
from spike-LFP pairs with the same preferred stimulus orientation than pairs with different
preferred stimulus orientation where decoded information significantly correlated with SFC in the
beta-band.
Spike-LFP Coherence in V1
In the primary visual cortex, even neurons which are highly tuned for stimulus orientation have a
broad tuning. Therefore, to bind the responses to the preferred stimulus together, neurons need to
detect and distinguish responses to the preferred orientation from responses to the orientations
Spike-field coherency across marmoset V1
Page 16 of 25
close to the preferred orientation. Synchronization between neurons with the same stimulus
responses has been proposed as a mechanism for selection of related responses. Our results support
this notion by showing that when neurons whose receptive fields have a similar orientation
preference are presented with a preferred visual stimulus, the coherence between their spike trains
and the LFP increase. The increased SFC may indicate an increase in the strength of synaptic
activity at one orientation column caused by spiking at another orientation column. Stronger
synaptic connections may help the integration of synaptic inputs from neurons with the same
orientation preference at postsynaptic neurons. It should be noted that peak SFC we report is lower
(22 Hz) than that of previous studies which have shown an increase in the SFC in the gamma range
(above 30 Hz) following visual stimulation of V1 in cats and monkeys (Siegel and König, 2003;
Burns et al., 2010; Lashgari et al., 2012). This discrepancy can be explained by the difference in
the SFC quantification in our experiments compared to the above studies where a single electrode
was used to record spikes and LFPs simultaneously.
Although the LFP signal is dominated by summed synaptic activity in a cortical space surrounding
the recording electrode (Mitzdorf, 1985; Buzsáki et al., 2012; Einevoll et al., 2013), there is a
longstanding debate on the spurious effects of spikes on fast components of LFPs (Gold et al.,
2006; Lepage et al., 2011). That means the magnitude of high-frequency SFC may be inflated if
spikes and LFPs are recorded on the same electrode or from closely implanted electrodes. In our
study, we quantified the SFC by taking spikes and the LFP from two adjacent electrodes which
are at least 400 µm apart. When we repeated the spike-LFP coherence analysis by using spikes
and the LFP from the same electrode in two monkeys, we found the peak of the SFC magnitude in
the gamma range (> 30 Hz) in 31 % of sites as opposed to 10 % when SFC was quantified by
taking spikes and the LFP from two adjacent electrodes. Based on our results, we suggest that SFC
in gamma is, to some extent, due to the interference of spikes in the LFP and propose more caution
while interpreting the gamma band SFC results. Our result also in line with the previous study
(Lashgari et al., 2012) that reported two types of neurons being involved in SFC at high- and low-
frequency bands which might be involved in different processing mechanisms (i.e. local vs long-
range computation).
Inter-columnar synchronization of neural responses
Spike-field coherency across marmoset V1
Page 17 of 25
Although orientation columns with the same stimulus orientation preference are preferentially
connected, lateral connections also connect sites with a wide range of preferred orientations
(Kisvarday et al., 1989; Bosking et al., 1997; Stettler et al., 2002). Synchronization is a proposed
way of enhancing communication between distant neuronal populations (Singer and Gray, 1995,
1995; Fries, 2005). Synchronization, however, needs to take place between the right neural
populations, i.e. orientation columns with the similar orientation preference as synchronization
between columns with different orientation preference may reduce the response binding efficacy
in V1 (Singer, 1993; Singer and Gray, 1995). Central to this hypothesis is the premise that if spikes
and the LFP of two neural clusters have the same rhythmicity, the maximum communication can
be achieved when spikes sent by one neural cluster arrive when the other cluster is in its maximum
sensitivity (Fries, 2005, 2015; Womelsdorf et al., 2007). Our data support this hypothesis by
showing that the spike-LFP coherence depends on the orientation preference of recording pairs,
highest SFC for pairs of sites with the same orientation preference and the least SFC for pairs with
the maximum orientation difference, 90-degrees. Previous studies of neural synchronization have
shown significant correlated oscillatory firing between remote orientation columns with the same
orientation preference (Gray et al., 1989). Our results extend this observation in several important
ways. Firstly, Grey et al. (1989) used single electrodes, which imposed a limited spatial resolution
due to the number of electrodes they could implant simultaneously (4-6 electrodes). In our study,
we used 96 equally distributed recording electrodes which significantly increases the spatial
resolutions of recordings. Secondly, since the LFP measures accumulate synaptic activity of large
pools of neurons (Mitzdorf, 1985; Okun et al., 2010), our measure – the spike-LFP coherence – is
more sensitive for quantifying a phase synchronization than measures based on spike-spike
synchronization. The higher sensitivity of the SFC method is particularly advantageous when
studying long-range neuronal interactions. Finally, the synchronization between orientation
columns reported in our study is supported by the results of an information theoretic (mutual
information) and the interareal (V1-V2) functional connectivity methods.
The mutual information metric quantifies the amount of stimulus information obtained from one
site through observing the information coded in another site (Quiroga and Panzeri, 2009).
Therefore, the mutual information should not be affected by the distance between two sites if they
encode the same stimulus and are totally independent. Our results showed decay in the mutual
Spike-field coherency across marmoset V1
Page 18 of 25
information when the distance between electrodes increases. This can potentially be explained by
the horizontal connections between columns. Each orientation column receives extensive inputs
from distant orientation columns with the same preferred orientation and some inputs from
neighboring columns with different orientation preference, however, the horizontal connection
probability decrease when the distance increases (Bosking et al., 1997; Stettler et al., 2002).
Therefore, pairs of columns with a large distance may receive more inputs from their non-iso-
oriented columns arriving from close neighboring columns which eventually reduce the mutual
coding of visual stimuli.
Our results show that synchronization between V1 neuron’s spikes and the LFP from a neural
cluster up to 2mm apart happens when both neural clusters have the same stimulus orientation
preference. These results can be explained by the physiology of horizontal connections which
preferentially link remote clusters of neurons with similar orientation preference (Burkhalter,
1989; Gilbert and Wiesel, 1989; Kisvarday et al., 1989; Schwarz and Bolz, 1991, 1991; Kisvárday
and Eysel, 1992; Malach et al., 1993, 1993; Bosking et al., 1997). The synchronization between
columns as separate as 2mm apart may help the flow of information to the downstream as several
studies have shown that temporarily correlated activity of large pools of neurons can help the
control of the flow of information across cortical areas (Salinas and Sejnowski, 2001; Rubino et
al., 2006).
Orientation columns in V1 are also connected through local/short-range horizontal connections
which are shorter than 500 um in macaques (Stettler et al., 2002) and are less specific as they
connect neurons with different orientation preference. This means the SFC magnitude up to 500
µm in the macaque’s brain should not be affected by the stimulus preference of orientation column
pairs which seems to be in contrast with our results. However, it should be noted that functional
columns in marmoset V1 are much smaller than the macaque brain, so as the horizontal
connections (Roe et al., 2005; McLoughlin and Schiessl, 2006). Therefore, the neighboring
columns in our study with 400 µm separation are most likely connected mainly through long-range
horizontal connections.
Finally, we investigated synchronization between orientation columns with similar stimulus
orientation preference within V1, within V2 and between V1 and V2. We found a larger SFC at
Spike-field coherency across marmoset V1
Page 19 of 25
22 Hz between V1-V1 pairings compared to V1-V2 and V2-V2 pairings. These results are in line
with the notion that corticocortical connections within V1 are higher than within V2 and between
V1 and V2 (Jia et al., 2013). Therefore, higher SFC magnitudes for V1 pairings are expected
compared to other pairings. The larger SFC between pairs of V1 neurons also implies that our
results are related to functional connectivity between orientation columns and not merely an effect
of signals propagating across the cortical surface. Our results, however, are different from previous
interareal studies showing the strongest synchronization between V1 and V2 cells whose their
receptive fields overlap and the orientation preferences are similar (Nowak et al., 1999; Jia et al.,
2013). By measuring cross-correlation between cells with overlapped receptive fields, the purpose
of the above studies was to show how synchronization between areas can alter the efficacy of drive
from V1 to V2. We did not match the receptive fields of pairs as the purpose of our study was to
understand how distributed groups of neurons within V1 synchronization their activities following
simultaneously being visually stimulated.
Spike-field coherency across marmoset V1
Page 20 of 25
References
Anon (2013) Distinct Roles of the Cortical Layers of Area V1 in Figure-Ground Segregation. Current Biology 23:2121–2129.
Azouz R, Gray CM (2003) Adaptive Coincidence Detection and Dynamic Gain Control in Visual Cortical Neurons In Vivo. Neuron 37:513–523.
Bokil H, Andrews P, Kulkarni JE, Mehta S, Mitra PP (2010) Chronux: A platform for analyzing neural signals. Journal of Neuroscience Methods 192:146–151.
Bosking WH, Zhang Y, Schofield B, Fitzpatrick D (1997) Orientation Selectivity and the Arrangement of Horizontal Connections in Tree Shrew Striate Cortex. J Neurosci 17:2112–2127.
Buffalo EA, Fries P, Landman R, Buschman TJ, Desimone R (2011) Laminar differences in gamma and alpha coherence in the ventral stream. PNAS 108:11262–11267.
Burkhalter A (1989) Intrinsic connections of rat primary visual cortex: Laminar organization of axonal projections. Journal of Comparative Neurology 279:171–186.
Burns SP, Xing D, Shapley RM (2010) Comparisons of the Dynamics of Local Field Potential and Multiunit Activity Signals in Macaque Visual Cortex. J Neurosci 30:13739–13749.
Buzsáki G, Anastassiou CA, Koch C (2012) The origin of extracellular fields and currents — EEG, ECoG, LFP and spikes. Nat Rev Neurosci 13:407–420.
Buzsáki G, Draguhn A (2004) Neuronal Oscillations in Cortical Networks. Science 304:1926–1929.
Buzsaki G, Schomburg EW (2015) What does gamma coherence tell us about inter-regional neural communication? Nature Neuroscience Available at: http://link.galegroup.com/apps/doc/A408784487/AONE?sid=lms [Accessed October 30, 2019].
Dean HL, Hagan MA, Pesaran B (2012) Only Coherent Spiking in Posterior Parietal Cortex Coordinates Looking and Reaching. Neuron 73:829–841.
Einevoll GT, Kayser C, Logothetis NK, Panzeri S (2013) Modelling and analysis of local field potentials for studying the function of cortical circuits. Nature Reviews Neuroscience 14:770–785.
Fries P (2005) A mechanism for cognitive dynamics: neuronal communication through neuronal coherence. Trends in Cognitive Sciences 9:474–480.
Fries P (2015) Rhythms for Cognition: Communication through Coherence. Neuron 88:220–235.
Fries P, Roelfsema PR, Engel AK, König P, Singer W (1997) Synchronization of oscillatory responses in visual cortex correlates with perception in interocular rivalry. Proc Natl Acad Sci U S A 94:12699–12704.
Fries P, Womelsdorf T, Oostenveld R, Desimone R (2008) The Effects of Visual Stimulation and Selective Visual Attention on Rhythmic Neuronal Synchronization in Macaque Area V4. J Neurosci 28:4823–4835.
Gilbert CD, Wiesel TN (1989) Columnar specificity of intrinsic horizontal and corticocortical connections in cat visual cortex. J Neurosci 9:2432–2442.
Gold C, Henze DA, Koch C, Buzsáki G (2006) On the Origin of the Extracellular Action Potential Waveform: A Modeling Study. Journal of Neurophysiology 95:3113–3128.

Spike-field coherency across marmoset V1
Page 21 of 25
Gray CM, König P, Engel AK, Singer W (1989) Oscillatory responses in cat visual cortex exhibit inter-columnar synchronization which reflects global stimulus properties. Nature 338:334–337.
Gregoriou GG, Gotts SJ, Zhou H, Desimone R (2009) High-Frequency, Long-Range Coupling between Prefrontal and Visual Cortex during Attention. Science 324:1207–1210.
Hawellek DJ, Wong YT, Pesaran B (2016) Temporal coding of reward-guided choice in the posterior parietal cortex. Proceedings of the National Academy of Sciences of the United States of America 113:13492–13497.
Jia X, Tanabe S, Kohn A (2013) Gamma and the Coordination of Spiking Activity in Early Visual Cortex. Neuron 77:762–774.
Kang K (2004) Information Tuning of Populations of Neurons in Primary Visual Cortex. Journal of Neuroscience 24:3726–3735.
Kisvarday ZF, Cowey A, Smith AD, Somogyi P (1989) Interlaminar and lateral excitatory amino acid connections in the striate cortex of monkey. J Neurosci 9:667–682.
Kisvárday ZF, Eysel UT (1992) Cellular organization of reciprocal patchy networks in layer III of cat visual cortex (area 17). Neuroscience 46:275–286.
Lashgari R, Li X, Chen Y, Kremkow J, Bereshpolova Y, Swadlow HA, Alonso J-M (2012) Response Properties of Local Field Potentials and Neighboring Single Neurons in Awake Primary Visual Cortex. J Neurosci 32:11396–11413.
Lepage KQ, Kramer MA, Eden UT (2011) The Dependence of Spike Field Coherence on Expected Intensity. Neural Computation 23:2209–2241.
Liang H, Gong X, Chen M, Yan Y, Li W, Gilbert CD (2017) Interactions between feedback and lateral connections in the primary visual cortex. Proc Natl Acad Sci USA 114:8637–8642.
Malach R, Amir Y, Harel M, Grinvald A (1993) Relationship Between Intrinsic Connections and Functional Architecture Revealed by Optical Imaging and in vivo Targeted Biocytin Injections in Primate Striate Cortex. Proceedings of the National Academy of Sciences of the United States of America 90:10469–10473.
Maris E, Oostenveld R (2007) Nonparametric statistical testing of EEG- and MEG-data. Journal of Neuroscience Methods 164:177–190.
McLoughlin N, Schiessl I (2006) Orientation selectivity in the common marmoset (Callithrix jacchus): The periodicity of orientation columns in V1 and V2. NeuroImage 31:76–85.
Mitra PP, Pesaran B (1999) Analysis of Dynamic Brain Imaging Data. Biophysical Journal 76:691–708.
Mitzdorf U (1985) Current source-density method and application in cat cerebral cortex: investigation of evoked potentials and EEG phenomena. Physiological Reviews 65:37–100.
Mountcastle VB (1997) The columnar organization of the neocortex. Brain 120:701–722.
Nowak LG, Munk M h. j., James AC, Girard P, Bullier J (1999) Cross-Correlation Study of the Temporal Interactions Between Areas V1 and V2 of the Macaque Monkey. Journal of Neurophysiology 81:1057–1074.

Spike-field coherency across marmoset V1
Page 22 of 25
Okun M, Naim A, Lampl I (2010) The Subthreshold Relation between Cortical Local Field Potential and Neuronal Firing Unveiled by Intracellular Recordings in Awake Rats. J Neurosci 30:4440–4448.
Panzeri S, Senatore R, Montemurro MA, Petersen RS (2007) Correcting for the Sampling Bias Problem in Spike Train Information Measures. Journal of Neurophysiology 98:1064–1072.
Quiroga RQ, Nadasdy Z, Ben-Shaul Y (2004) Unsupervised Spike Detection and Sorting with Wavelets and Superparamagnetic Clustering. Neural Computation 16:1661–1687.
Quiroga RQ, Panzeri S (2009) Extracting information from neuronal populations: information theory and decoding approaches. Nat Rev Neurosci 10:173–185.
Roe AW, Fritsches K, Pettigrew JD (2005) Optical imaging of functional organization of V1 and V2 in marmoset visual cortex. The Anatomical Record Part A: Discoveries in Molecular, Cellular, and Evolutionary Biology 287A:1213–1225.
Rubino D, Robbins KA, Hatsopoulos NG (2006) Propagating waves mediate information transfer in the motor cortex. Nature Neuroscience 9:1549–1557.
Salinas E, Sejnowski TJ (2001) CORRELATED NEURONAL ACTIVITY AND THE FLOW OF NEURAL INFORMATION. Nat Rev Neurosci 2:539–550.
Schwarz C, Bolz J (1991) Functional specificity of a long-range horizontal connection in cat visual cortex: a cross-correlation study. J Neurosci 11:2995–3007.
Shannon CE (1948) A Mathematical Theory of Communication. Bell System Technical Journal 27:379–423.
Siegel M, König P (2003) A Functional Gamma-Band Defined by Stimulus-Dependent Synchronization in Area 18 of Awake Behaving Cats. J Neurosci 23:4251–4260.
Singer W (1993) Synchronization of Cortical Activity and its Putative Role in Information Processing and Learning. Annu Rev Physiol 55:349–374.
Singer W, Gray CM (1995) Visual Feature Integration and the Temporal Correlation Hypothesis. Annu Rev Neurosci 18:555–586.
Stettler DD, Das A, Bennett J, Gilbert CD (2002) Lateral Connectivity and Contextual Interactions in Macaque Primary Visual Cortex. Neuron 36:739–750.
Swindale NV, Grinvald A, Shmuel A (2003) The Spatial Pattern of Response Magnitude and Selectivity for Orientation and Direction in Cat Visual Cortex. Cereb Cortex 13:225–238.
Thomson DJ (1982) Spectrum estimation and harmonic analysis. Proceedings of the IEEE 70:1055–1096.
Timme NM, Lapish C (2018) A Tutorial for Information Theory in Neuroscience. eNeuro 5 Available at: https://www.ncbi.nlm.nih.gov/pmc/articles/PMC6131830/ [Accessed June 9, 2020].
Trautmann EM, Stavisky SD, Lahiri S, Ames KC, Kaufman MT, O’Shea DJ, Vyas S, Sun X, Ryu SI, Ganguli S, Shenoy KV (2019) Accurate Estimation of Neural Population Dynamics without Spike Sorting. Neuron 103:292-308.e4.
Womelsdorf T, Fries P, Mitra PP, Desimone R (2006) Gamma-band synchronization in visual cortex predicts speed of change detection. Nature 439:733–736.

Spike-field coherency across marmoset V1
Page 23 of 25
Womelsdorf T, Schoffelen J-M, Oostenveld R, Singer W, Desimone R, Engel AK, Fries P (2007) Modulation of Neuronal Interactions through Neuronal Synchronization. Science 316:1609–1612.
Wong YT, Fabiszak MM, Novikov Y, Daw ND, Pesaran B (2016) Coherent neuronal ensembles are rapidly recruited when making a look-reach decision. Nature Neuroscience 19:327–334.
Zavitz E, Yu H-H, Rowe EG, Rosa MGP, Price NSC (2016) Rapid Adaptation Induces Persistent Biases in Population Codes for Visual Motion. J Neurosci 36:4579–4590.
Spike-field coherency across marmoset V1
Page 24 of 25
Figure Legends
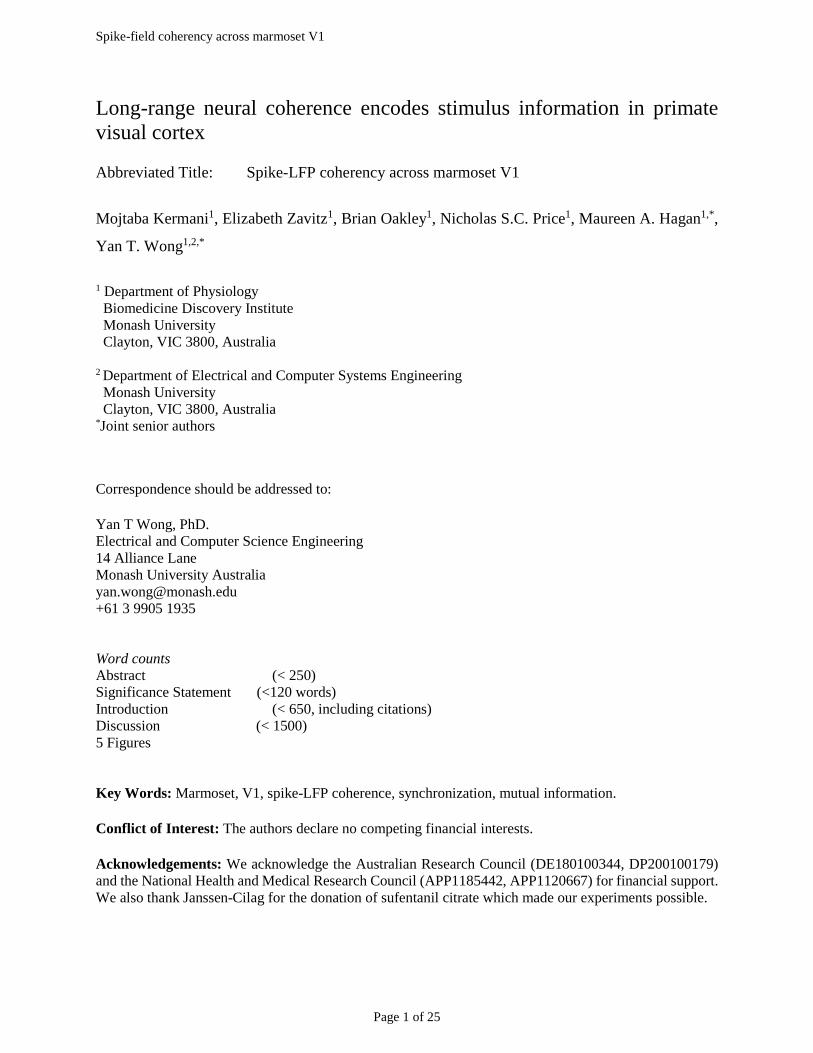
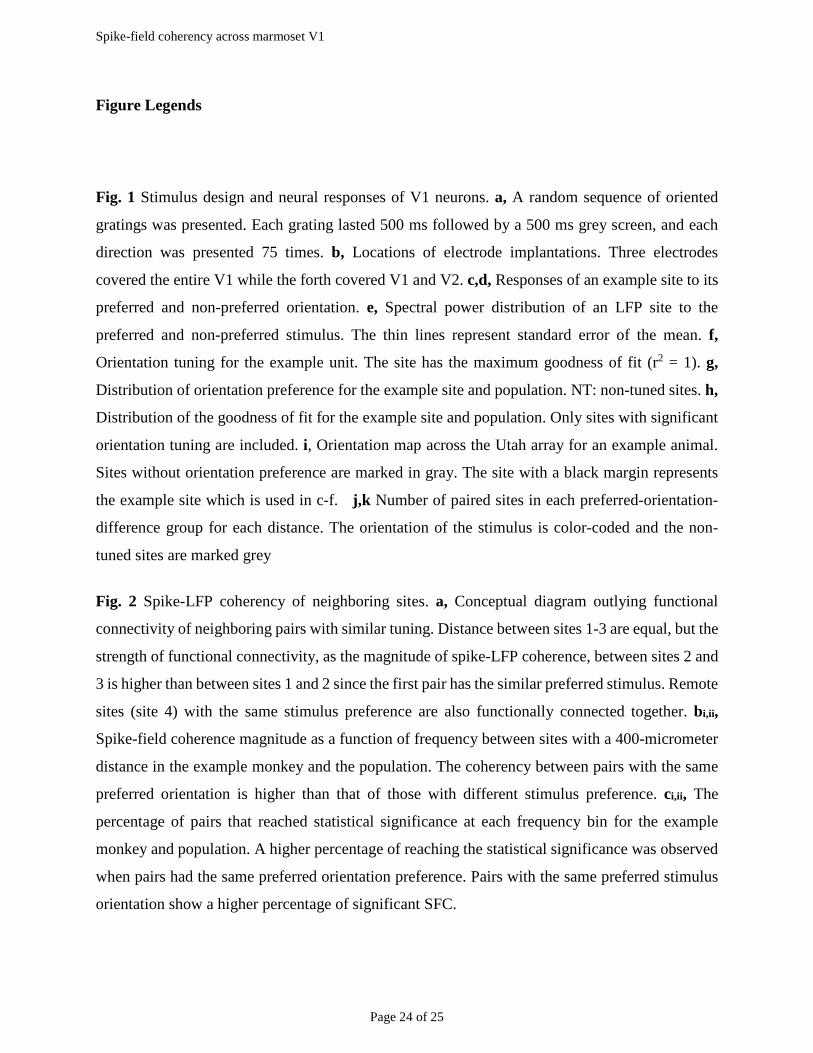
Fig. 1 Stimulus design and neural responses of V1 neurons. a, A random sequence of oriented
gratings was presented. Each grating lasted 500 ms followed by a 500 ms grey screen, and each
direction was presented 75 times. b, Locations of electrode implantations. Three electrodes
covered the entire V1 while the forth covered V1 and V2. c,d, Responses of an example site to its
preferred and non-preferred orientation. e, Spectral power distribution of an LFP site to the
preferred and non-preferred stimulus. The thin lines represent standard error of the mean. f,
Orientation tuning for the example unit. The site has the maximum goodness of fit (r2 = 1). g,
Distribution of orientation preference for the example site and population. NT: non-tuned sites. h,
Distribution of the goodness of fit for the example site and population. Only sites with significant
orientation tuning are included. i, Orientation map across the Utah array for an example animal.
Sites without orientation preference are marked in gray. The site with a black margin represents
the example site which is used in c-f. j,k Number of paired sites in each preferred-orientation-
difference group for each distance. The orientation of the stimulus is color-coded and the non-
tuned sites are marked grey
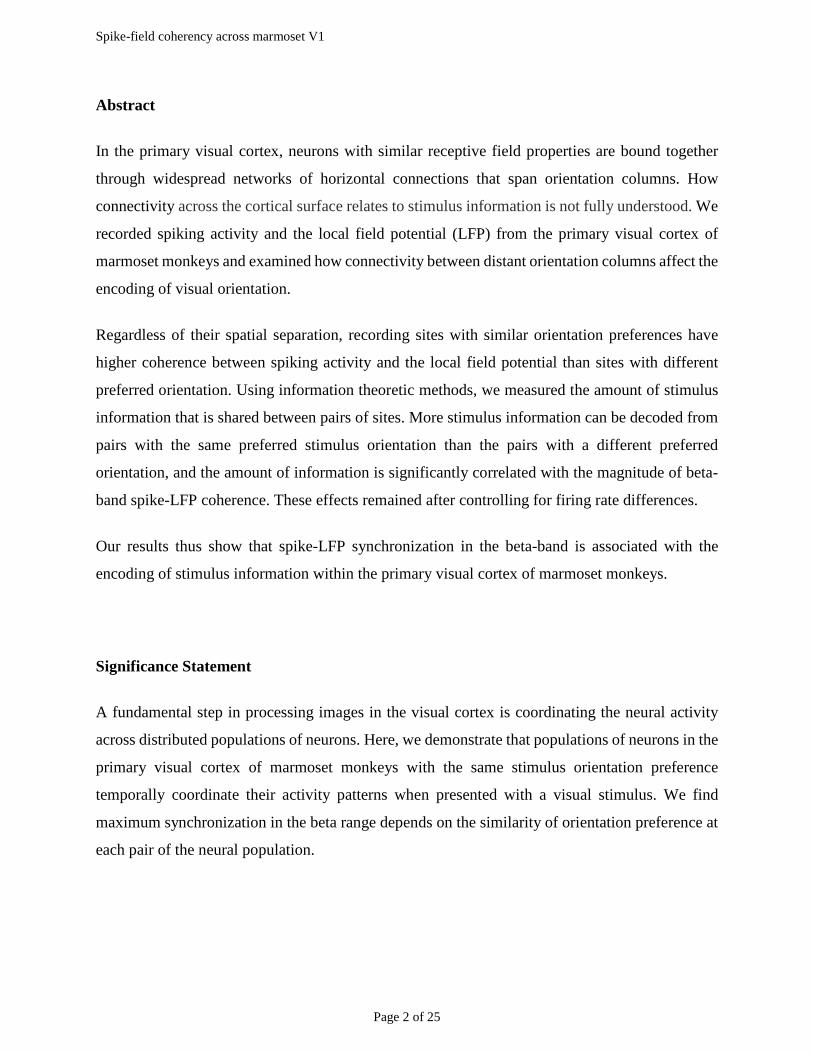
Fig. 2 Spike-LFP coherency of neighboring sites. a, Conceptual diagram outlying functional
connectivity of neighboring pairs with similar tuning. Distance between sites 1-3 are equal, but the
strength of functional connectivity, as the magnitude of spike-LFP coherence, between sites 2 and
3 is higher than between sites 1 and 2 since the first pair has the similar preferred stimulus. Remote
sites (site 4) with the same stimulus preference are also functionally connected together. bi,ii,
Spike-field coherence magnitude as a function of frequency between sites with a 400-micrometer
distance in the example monkey and the population. The coherency between pairs with the same
preferred orientation is higher than that of those with different stimulus preference. ci,ii, The
percentage of pairs that reached statistical significance at each frequency bin for the example
monkey and population. A higher percentage of reaching the statistical significance was observed
when pairs had the same preferred orientation preference. Pairs with the same preferred stimulus
orientation show a higher percentage of significant SFC.
Spike-field coherency across marmoset V1
Page 25 of 25
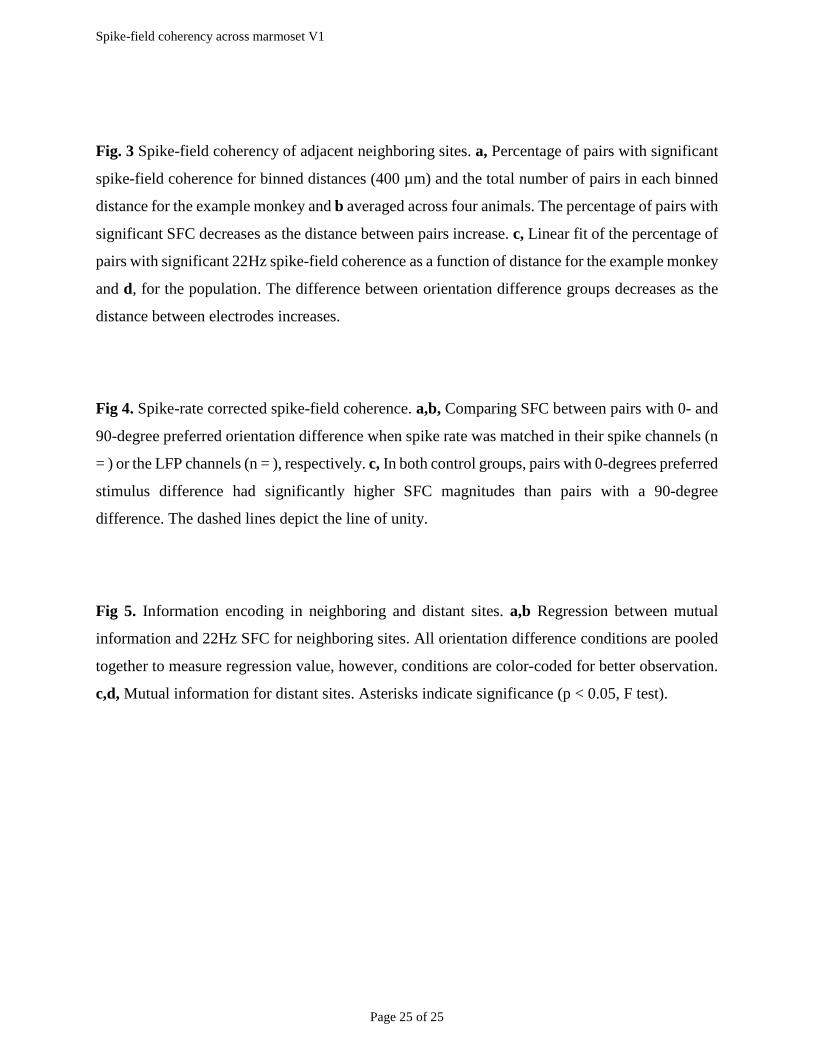
Fig. 3 Spike-field coherency of adjacent neighboring sites. a, Percentage of pairs with significant
spike-field coherence for binned distances (400 µm) and the total number of pairs in each binned
distance for the example monkey and b averaged across four animals. The percentage of pairs with
significant SFC decreases as the distance between pairs increase. c, Linear fit of the percentage of
pairs with significant 22Hz spike-field coherence as a function of distance for the example monkey
and d, for the population. The difference between orientation difference groups decreases as the
distance between electrodes increases.
Fig 4. Spike-rate corrected spike-field coherence. a,b, Comparing SFC between pairs with 0- and
90-degree preferred orientation difference when spike rate was matched in their spike channels (n
= ) or the LFP channels (n = ), respectively. c, In both control groups, pairs with 0-degrees preferred
stimulus difference had significantly higher SFC magnitudes than pairs with a 90-degree
difference. The dashed lines depict the line of unity.
Fig 5. Information encoding in neighboring and distant sites. a,b Regression between mutual
information and 22Hz SFC for neighboring sites. All orientation difference conditions are pooled
together to measure regression value, however, conditions are color-coded for better observation.
c,d, Mutual information for distant sites. Asterisks indicate significance (p < 0.05, F test).
1.2 2 2.8 3.6 4.60
125
Num
ber o
f pai
rs
Distance between pairs (mm)1.2 2 2.8 3.6 4.6Distance between pairs (mm)
.4 .4
j k0o diff30o diff60o diff90o diff
All monkeysExample monkey
255075
100
0
100
200
300
Stimulus orientationsi
Goodness of fit
Perc
ent
Perc
ent
.7 .8 .9 10
600
60h
20
40
20
40
Example monkey
All monkeys300 60 90 120150N
T
Perc
ent
Perc
ent
0
30
0
30
Stimulus orientation
g
15
15
Example monkey
All monkeys
0o 180o 360o0
20
40
Stimulus orientation
r2 = 1
Firin
g ra
te (S
pike
s/s)
f
-.5
4
Pow
er (µ
V²/H
z)
4 50 150100Frequency (Hz)
Pref ORNon-pref OR
e
-.1 0 .1 .2 .3 .4 .5Time (s)
Firin
g ra
te (S
pike
s/s)
-.1 0 .1 .2 .3 .4 .5Time (s)
c dPref OR Non-pref OR100
20
40
60
80
0
500 500 500 500 Time (ms)
a b
. . .
Monkey 4
Monkey1-3
V1
A
P
DV
Figure 1
60
20
Frequency (Hz)100
40
05
c80
40
Perc
ent o
f pai
rs w
ith
sig
nific
ant S
FC
Example monkey
Frequency (Hz)20 60 80 1005 4020 60 80
All monkeysi ii
60
20
40
0
80
All monkeys
b
1005 4020 60 80
ii
0.1
0.3
0
0.2
0.1
0.3 Example monkey
0
0.2
1005 4020 60 80
i
SFC
mag
nitu
de
Site 1
Site 2
Site3
Spiking activity
LFP
Spiking activity
0.4
mm
0.4
mm 1.2 mm
Area 4
SFCSFC
SFC
Spiking activity
Preferred stimulus orientation:
a
0o 30o 60o 90o Orientation difference:
Figure 2
0
20
40
60
80
100
Distance between electrode pairs (mm).4 .8 1.2 1.6 2
0
20
40
60
80
100
.4 .8 1.2 1.6 2
0o diff30o diff60o diff90o diffMonkey1Monkey2Monkey3Monkey4
Perc
ent o
f sig
nific
ant
elec
trode
pai
rs a
t 22
Hz
Example monkey (Monkey 2)
All monkeys
Distance between electrode pairs (mm)
c dDistance (mm)
.4 2.4.8 1.2 1.6 2Distance (mm)
.4 2.4.8 1.2 1.6 2Distance (mm)
.4 2.4.8 1.2 1.6 2Distance (mm)
.4 2.4.8 1.2 1.6 20
200
400600
No.
of p
airs
75
0 % o
f sig
nific
ant p
airs
100
5
Freq
uenc
y (H
z)
20
40
60
80
b
No.
of p
airs
Distance (mm).4 2.4
0
300
150
Distance (mm) Distance (mm) Distance (mm).8 1.2 1.6 2 .4 2.4.8 1.2 1.6 2 .4 2.4.8 1.2 1.6 2 .4 2.4.8 1.2 1.6 2
1000o 30o 60o 90o
5
Freq
uenc
y (H
z)
20
40
60
80
a Preferred orientation difference:
75
0 % o
f sig
nific
ant p
airs
Figure 3
Spike channels LFP channels
0
.04
.08
.12
0º 90⁰ 0º 90⁰
Preferred orientation difference
.02
.06
.1
p = 0.0003 p = 5.4e-07
c
SFC
mag
nitu
de (2
2 H
z)
0 .05 .1 .15 .2 .25 .3 .35
LFP channels
b
0
.05
.1
.15
.2
.25
.3
.35
90o preferred orientation differenceSFC magnitude (22 Hz)
90o preferred orientation difference
0 .05 .1 .15 .2 .25 .3 .350
.05
.1
.15
.2
.25
.3
.35
Spike channels
0o pre
ferre
d or
ient
atio
n di
ffere
nce
a
SFC
mag
nitu
de (2
2 H
z)
SFC magnitude (22 Hz)
Figure 4
0o di�30o di�60o di�90o di�
0
.02
.04
.06
.08
.1
.12
.14
.16
.18
.2
.22
0.4 0.8 1.2 1.6 2 2.4
Monkey1Monkey2Monkey3Monkey4
Distance between electrodes (mm)
All monkeys
Example monkey All monkeys
r = -0.29*
r = -0.5*
r = -0.47*r = -0.67*
0.4 0.8 1.2 1.6 2 2.4Distance between electrodes (mm)
r = -0.78* r = -0.73*r = -0.56*r = -0.6*
b
Example monkey
0
.02
.04
.06
.08
.1
.12
.14
.16
.18
.2
.22
r = 0.47*
0 0.1 0.2 0.3 0.4 0.5 0.60
.2
.4
.6
.8
1
1.2
1.4
Spike-Field coherence (22Hz)
ii
0 0.1 0.2 0.3 0.40
.2
.4
.6
.8
1
1.2
1.4r = 0.55*
Mut
ual i
nfor
mat
ion
(bits
)
Spike-Field coherence (22Hz)
aM
utua
l inf
orm
atio
n (b
its)
i
iii
Figure 5


![arXiv:1412.0772v2 [cond-mat.mes-hall] 13 Feb 20152School of Physics, Monash University, Melbourne, Victoria 3800, Australia 3Institute for Quantum Matter, ... MnSi in a narrow window](https://img.pdfslide.us/doc/110x75/5ec485c1d4142e5bde0dd5f4/arxiv14120772v2-cond-matmes-hall-13-feb-2015-2school-of-physics-monash-university.jpg)