Embed Size (px)
Citation preview

Long Range FACILITIES PLANNING
School District No. 8
Public Presentation #2
November 26, 2014
Salmo
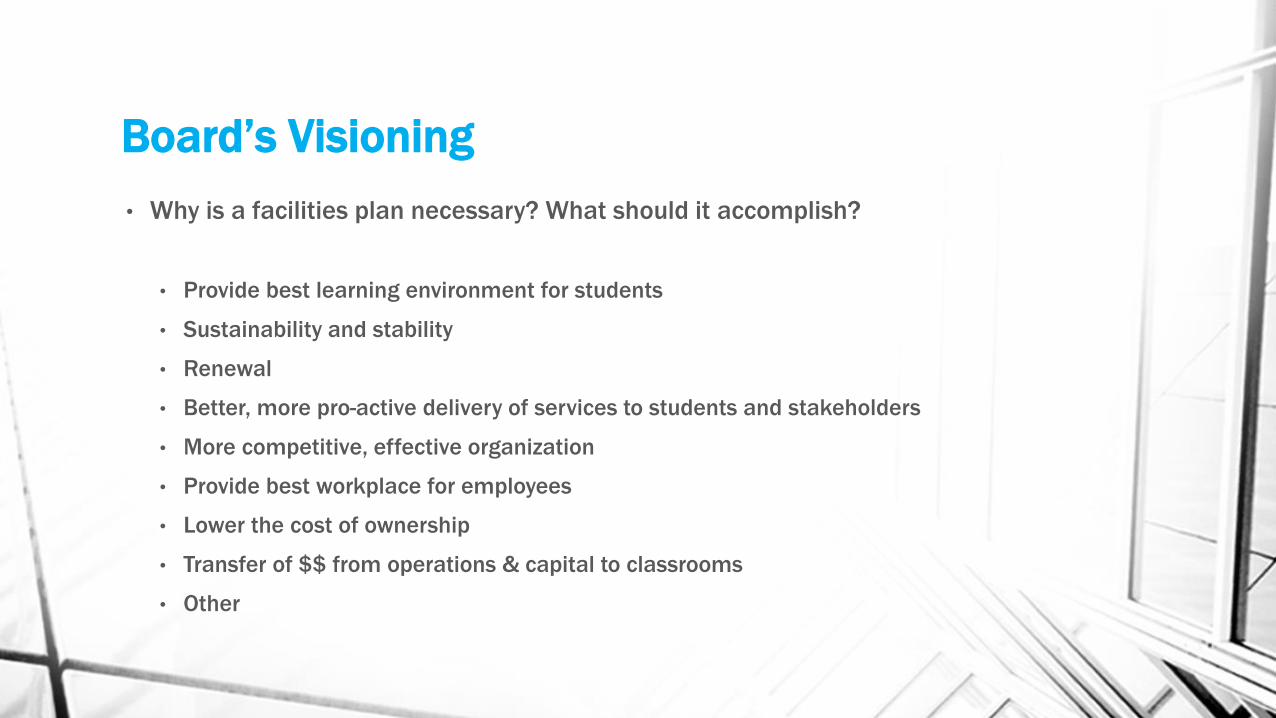
Board’s Visioning
• Why is a facilities plan necessary? What should it accomplish?
• Provide best learning environment for students
• Sustainability and stability
• Renewal
• Better, more pro-active delivery of services to students and stakeholders
• More competitive, effective organization
• Provide best workplace for employees
• Lower the cost of ownership
• Transfer of $$ from operations & capital to classrooms
• Other
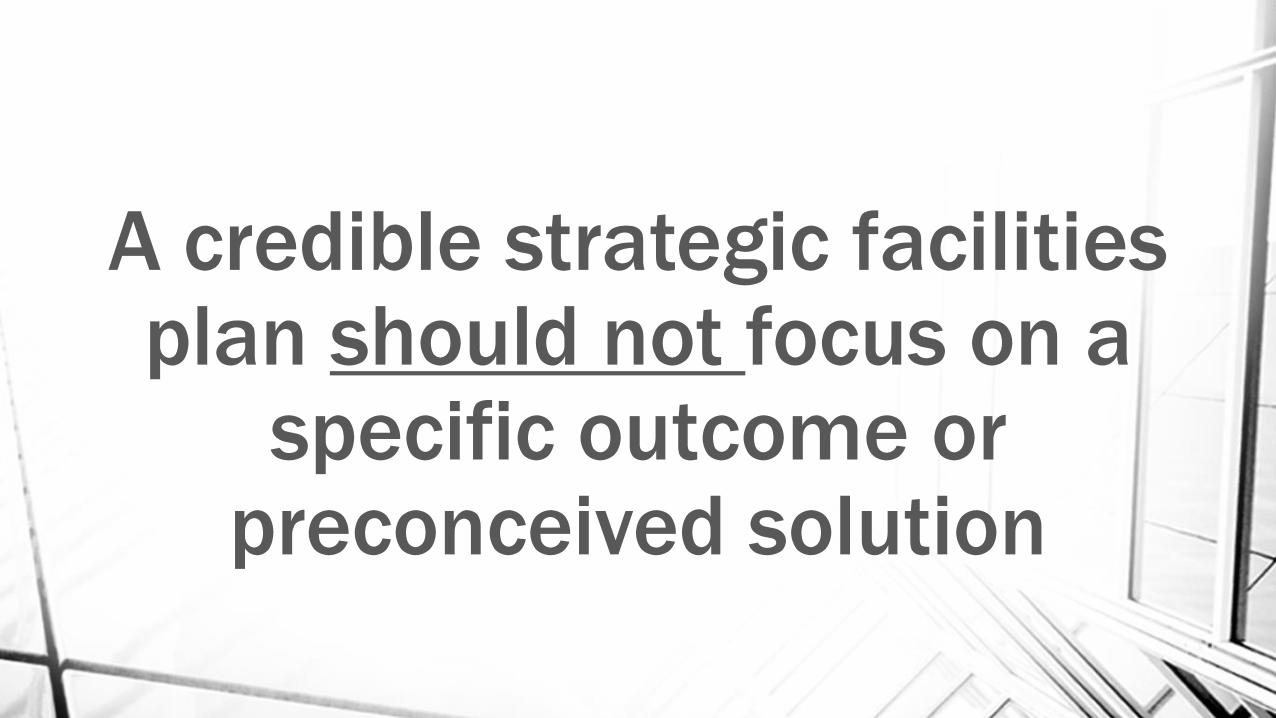
A credible strategic facilities plan should not focus on a
specific outcome or preconceived solution
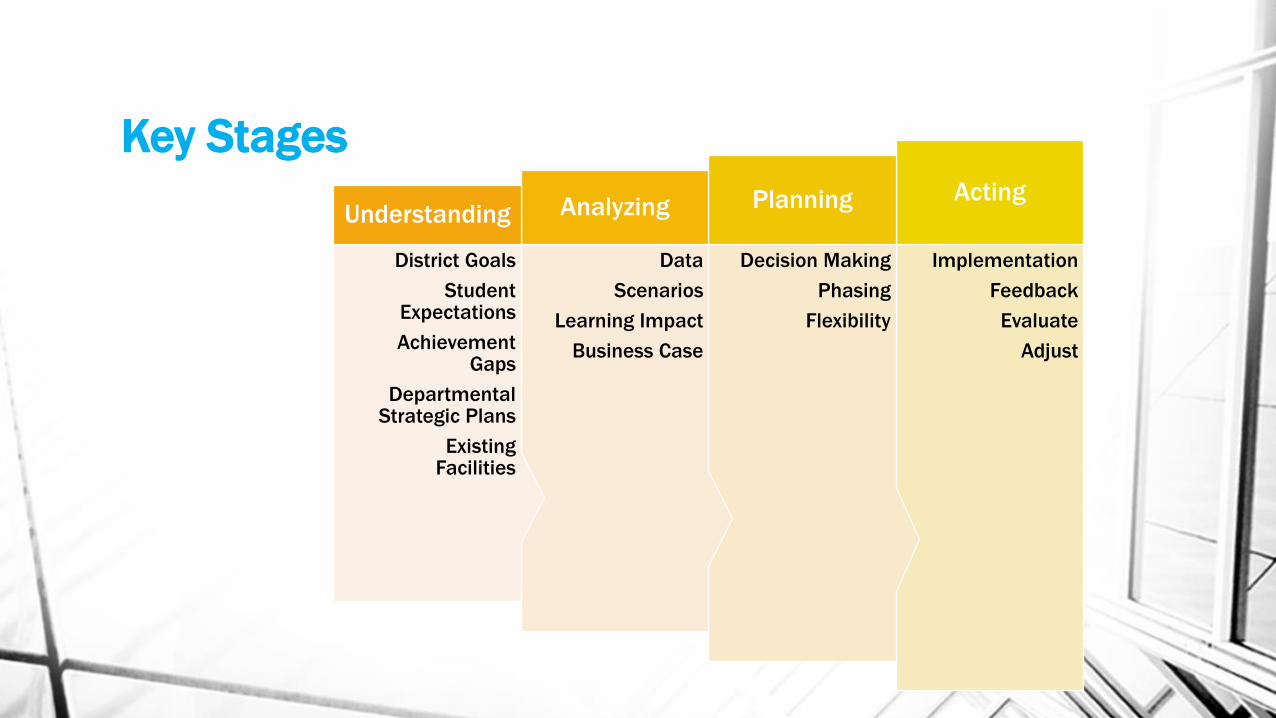
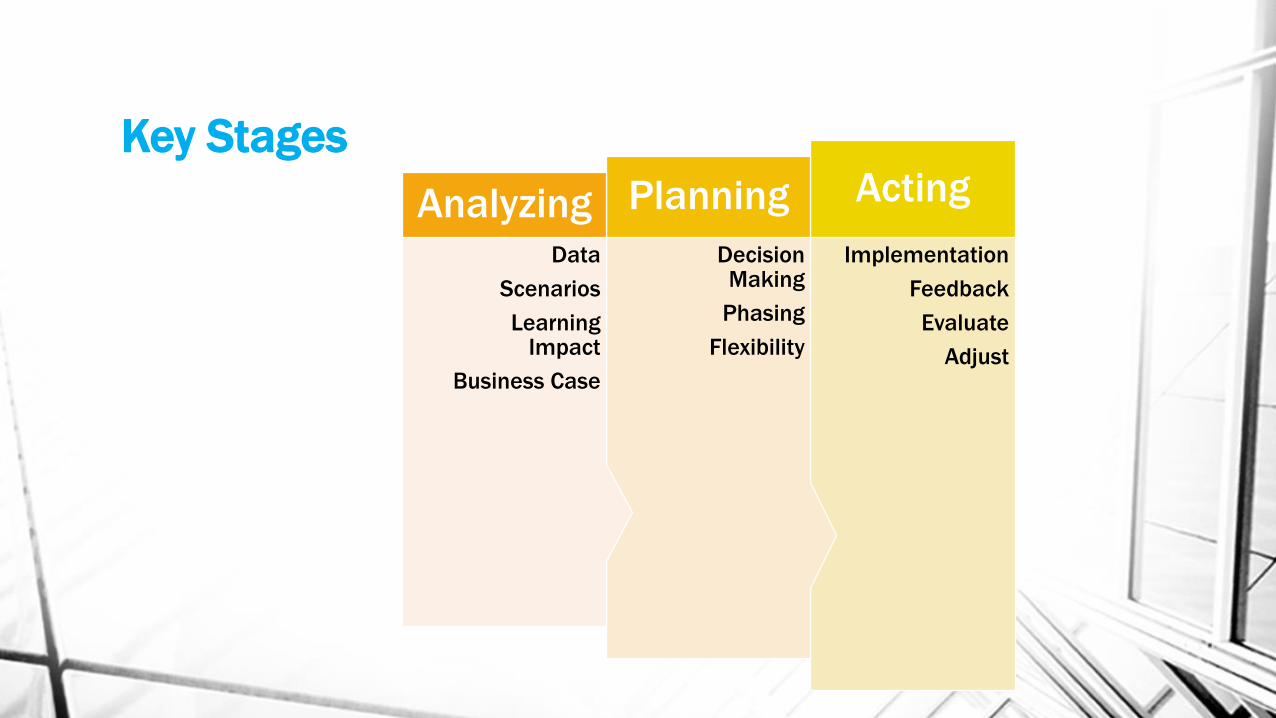
Key Stages
Implementation
Feedback
Evaluate
Adjust
Acting
Decision Making
Phasing
Flexibility
Planning
Data
Scenarios
Learning Impact
Business Case
Analyzing
District Goals
Student Expectations
Achievement Gaps
Departmental Strategic Plans
Existing Facilities
Understanding
Data – What do we know about SD8?
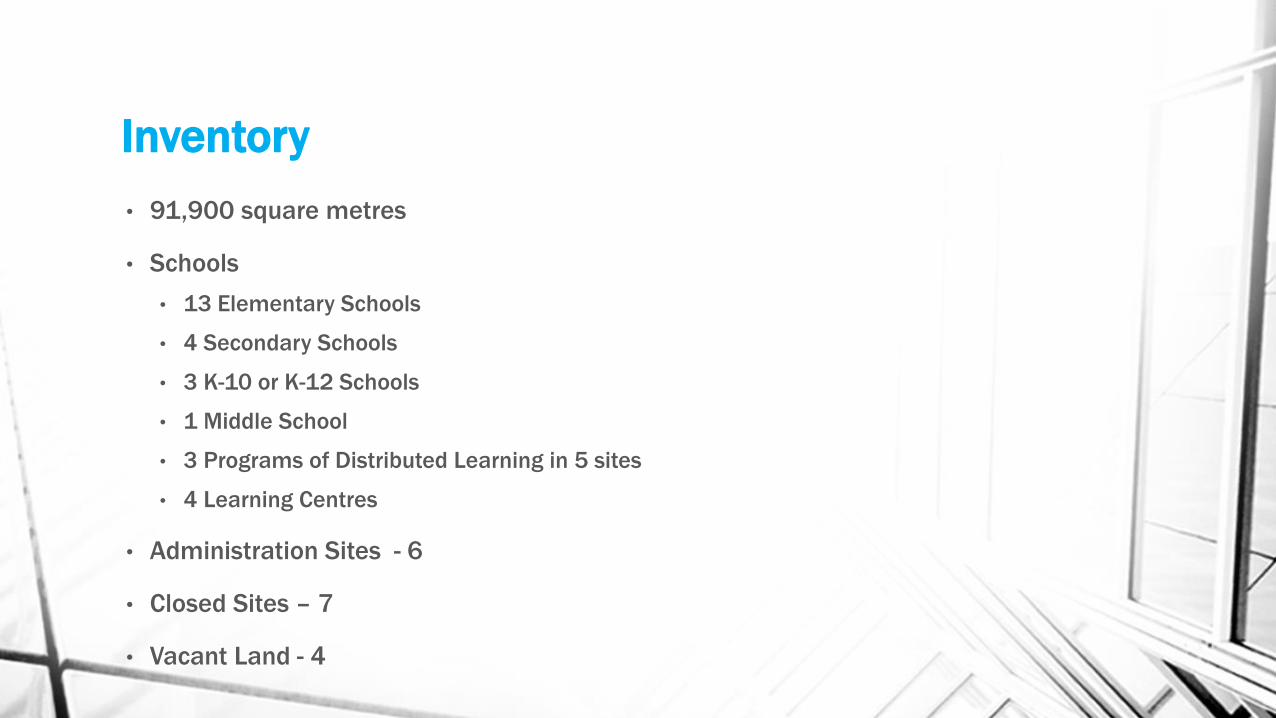
Inventory
• 91,900 square metres
• Schools
• 13 Elementary Schools
• 4 Secondary Schools
• 3 K-10 or K-12 Schools
• 1 Middle School
• 3 Programs of Distributed Learning in 5 sites
• 4 Learning Centres
• Administration Sites - 6
• Closed Sites – 7
• Vacant Land - 4
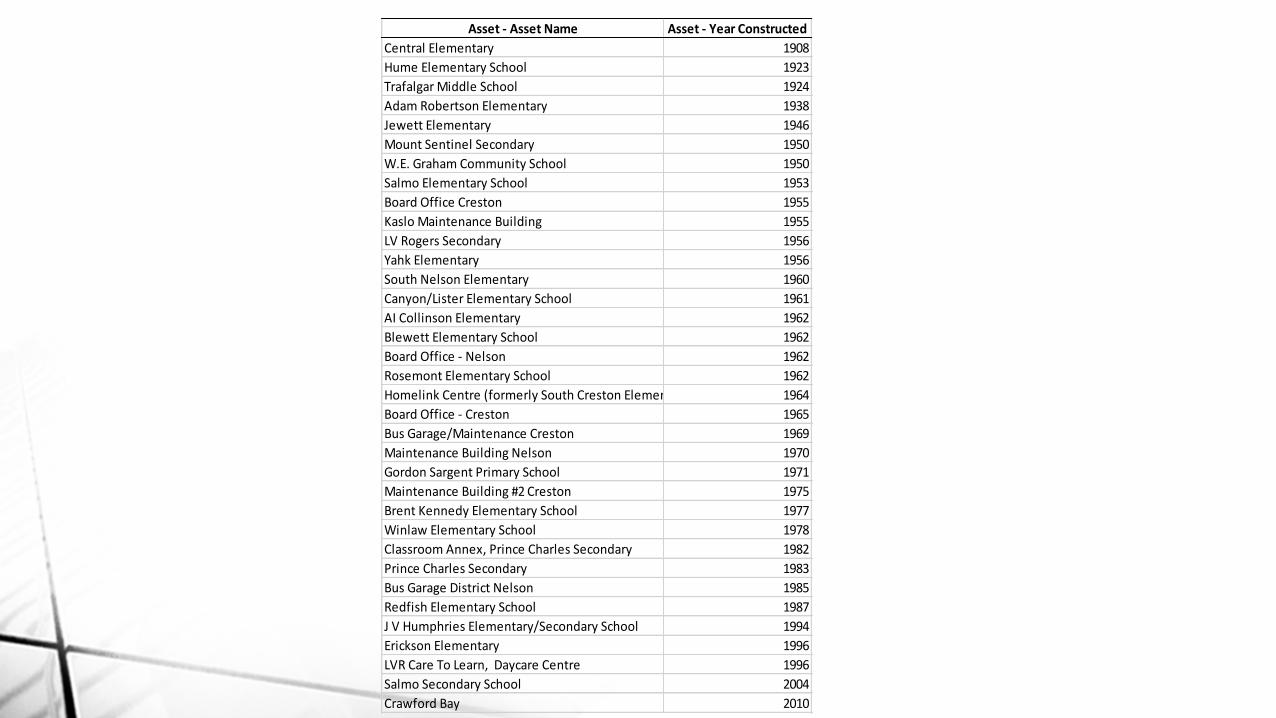
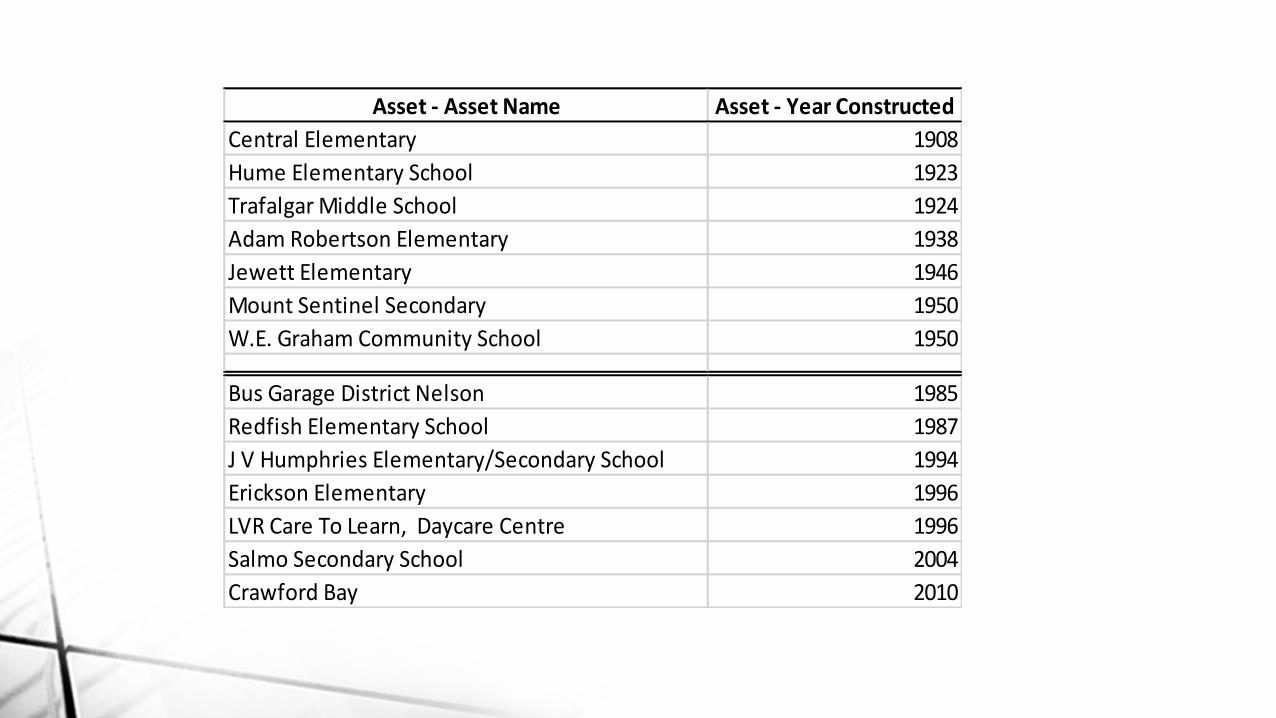
Asset - Asset Name Asset - Year Constructed
Central Elementary 1908
Hume Elementary School 1923
Trafalgar Middle School 1924
Adam Robertson Elementary 1938
Jewett Elementary 1946
Mount Sentinel Secondary 1950
W.E. Graham Community School 1950
Salmo Elementary School 1953
Board Office Creston 1955
Kaslo Maintenance Building 1955
LV Rogers Secondary 1956
Yahk Elementary 1956
South Nelson Elementary 1960
Canyon/Lister Elementary School 1961
AI Collinson Elementary 1962
Blewett Elementary School 1962
Board Office - Nelson 1962
Rosemont Elementary School 1962
Homelink Centre (formerly South Creston Elementary) 1964
Board Office - Creston 1965
Bus Garage/Maintenance Creston 1969
Maintenance Building Nelson 1970
Gordon Sargent Primary School 1971
Maintenance Building #2 Creston 1975
Brent Kennedy Elementary School 1977
Winlaw Elementary School 1978
Classroom Annex, Prince Charles Secondary 1982
Prince Charles Secondary 1983
Bus Garage District Nelson 1985
Redfish Elementary School 1987
J V Humphries Elementary/Secondary School 1994
Erickson Elementary 1996
LVR Care To Learn, Daycare Centre 1996
Salmo Secondary School 2004
Crawford Bay 2010
Asset - Asset Name Asset - Year Constructed
Central Elementary 1908
Hume Elementary School 1923
Trafalgar Middle School 1924
Adam Robertson Elementary 1938
Jewett Elementary 1946
Mount Sentinel Secondary 1950
W.E. Graham Community School 1950
Bus Garage District Nelson 1985
Redfish Elementary School 1987
J V Humphries Elementary/Secondary School 1994
Erickson Elementary 1996
LVR Care To Learn, Daycare Centre 1996
Salmo Secondary School 2004
Crawford Bay 2010
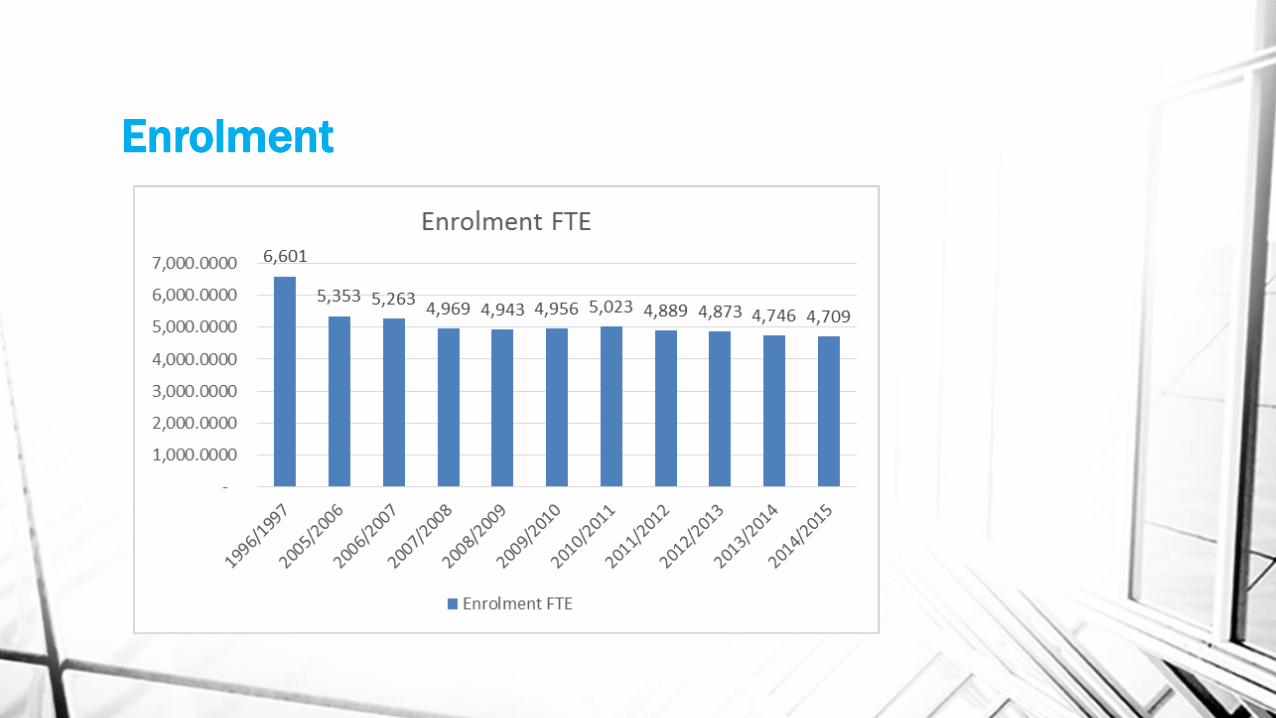
Enrolment
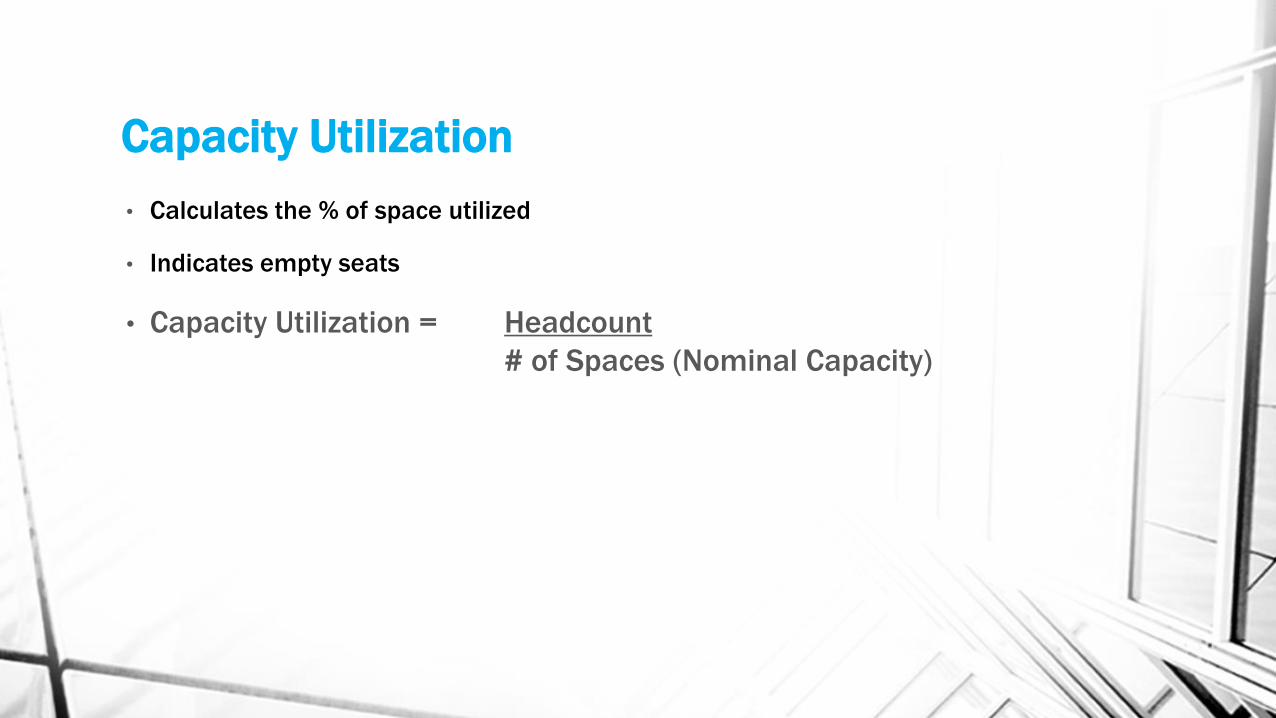
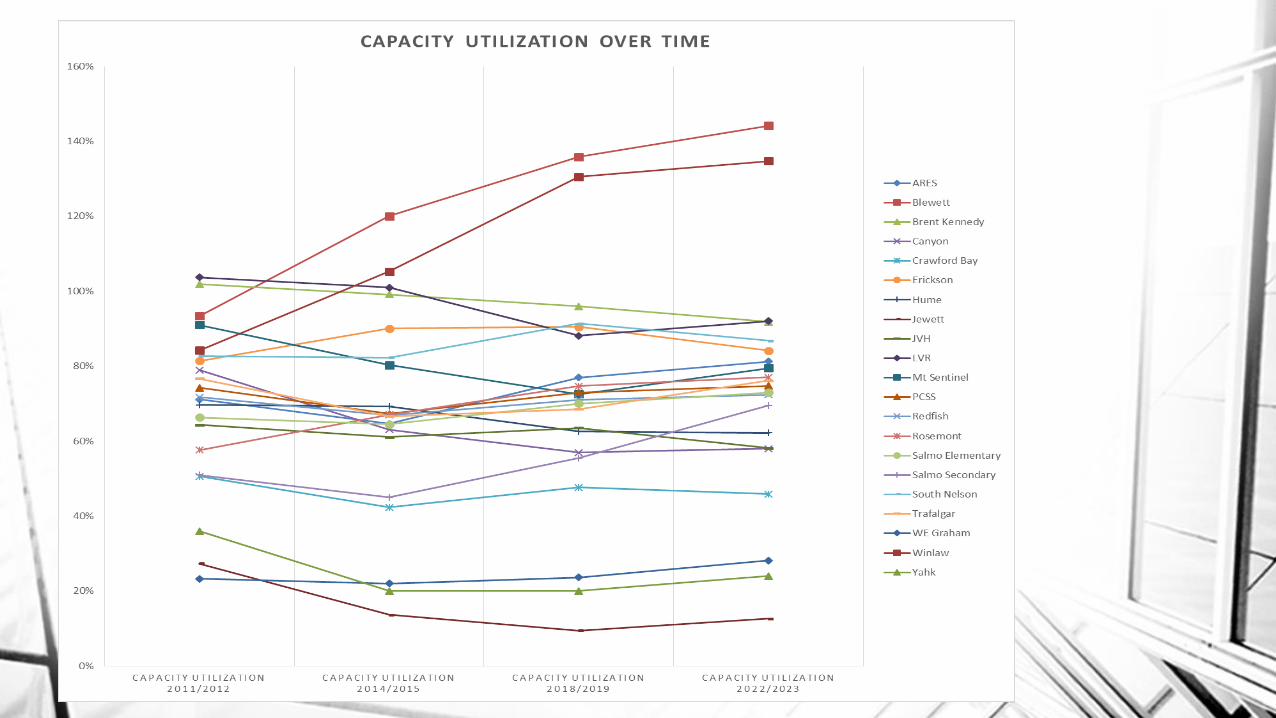
Capacity Utilization
• Calculates the % of space utilized
• Indicates empty seats
• Capacity Utilization = Headcount
# of Spaces (Nominal Capacity)
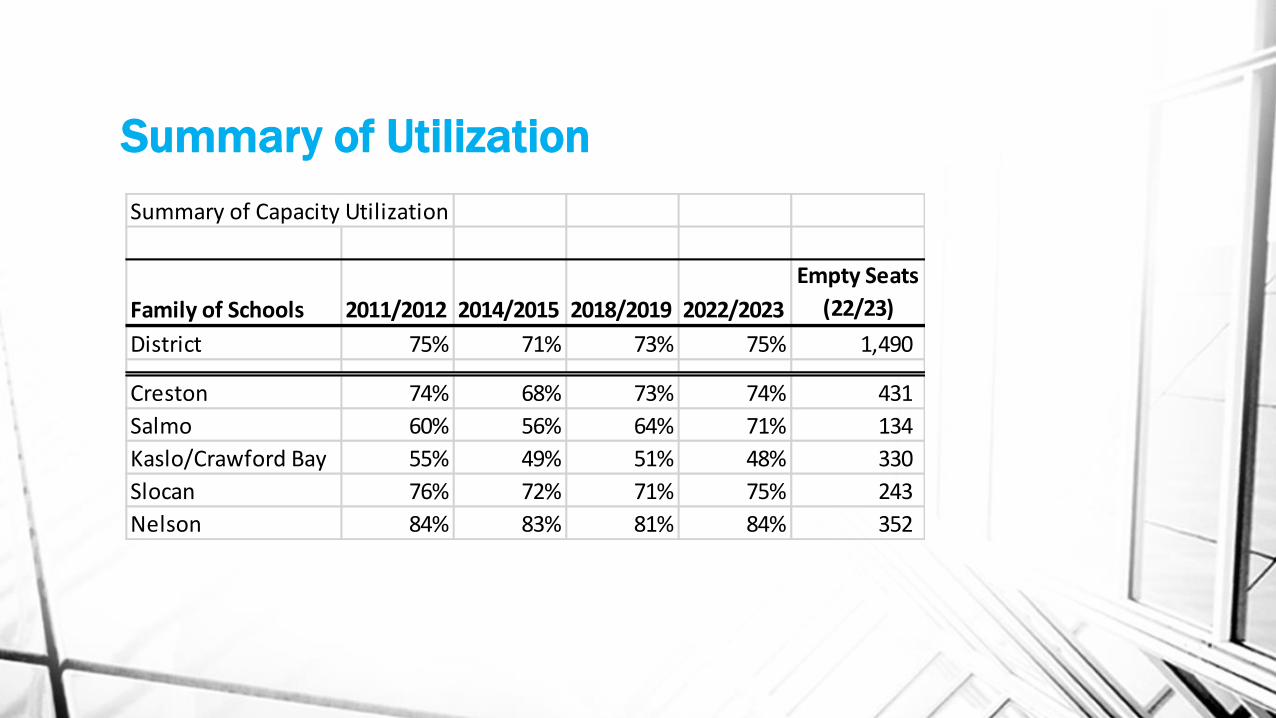
Summary of Utilization
Summary of Capacity Utilization
Family of Schools 2011/2012 2014/2015 2018/2019 2022/2023
Empty Seats
(22/23)
District 75% 71% 73% 75% 1,490
Creston 74% 68% 73% 74% 431
Salmo 60% 56% 64% 71% 134
Kaslo/Crawford Bay 55% 49% 51% 48% 330
Slocan 76% 72% 71% 75% 243
Nelson 84% 83% 81% 84% 352
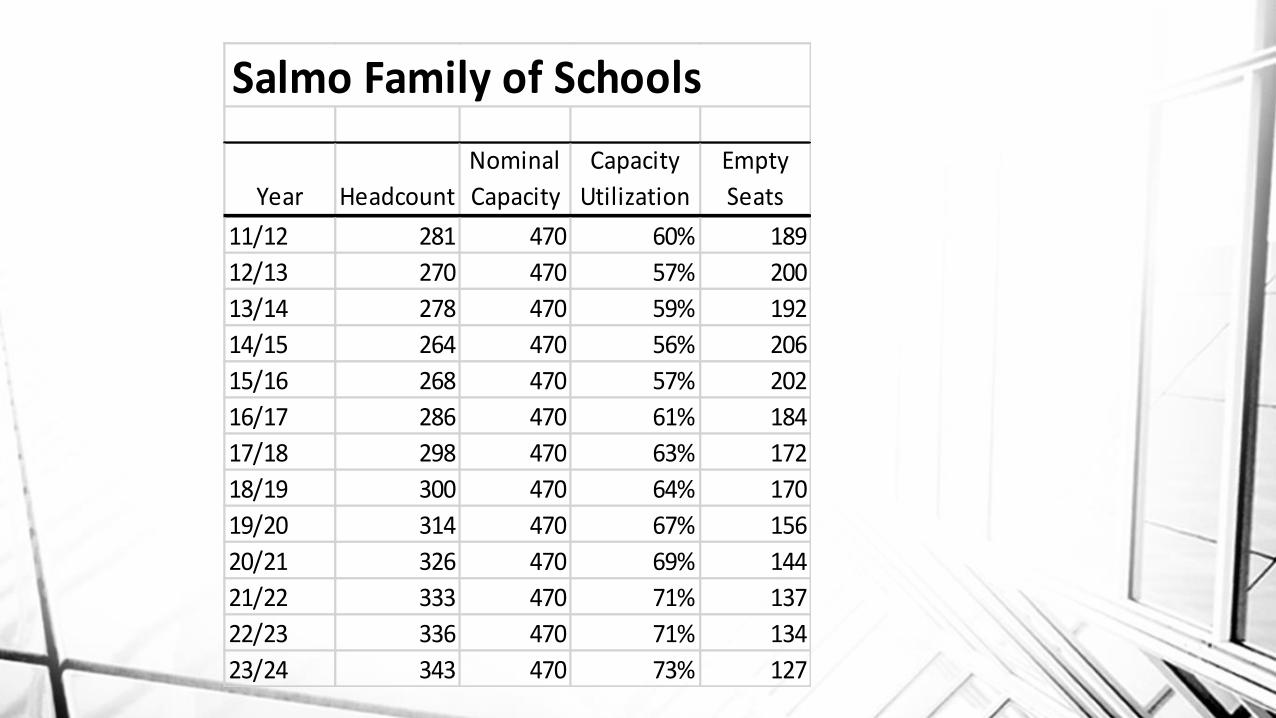
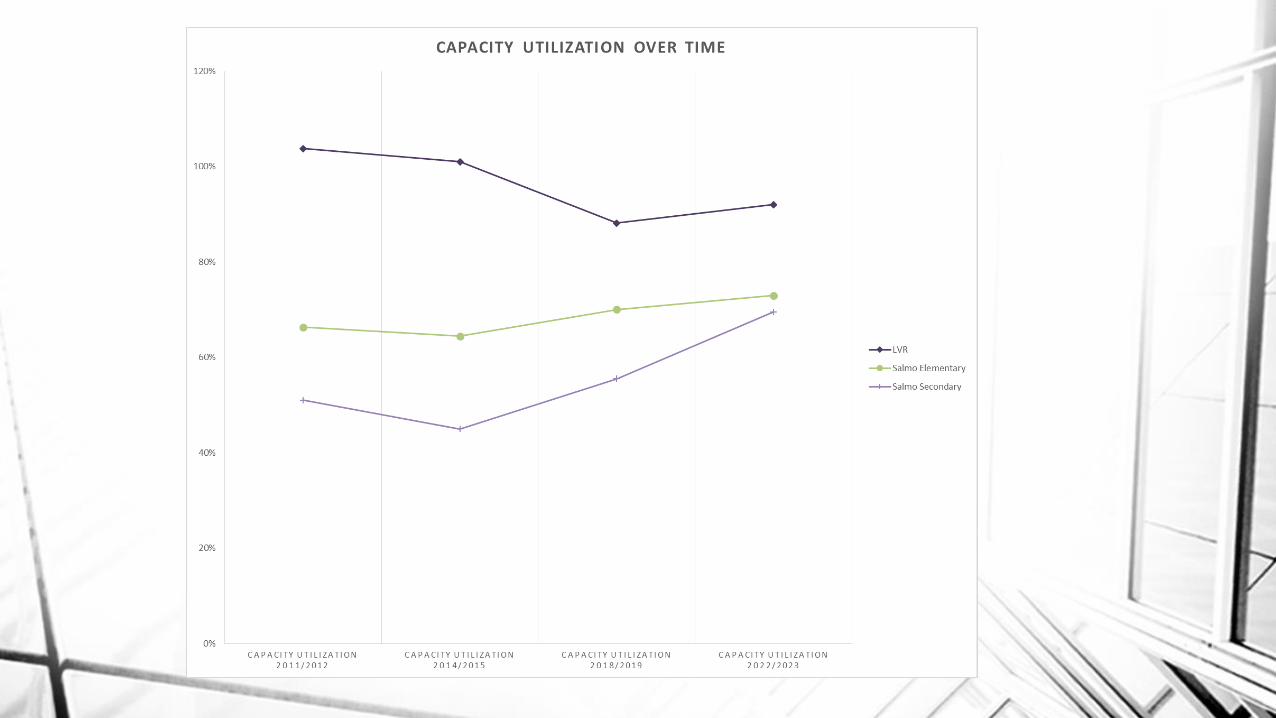
Salmo Family of Schools
Year Headcount
Nominal
Capacity
Capacity
Utilization
Empty
Seats
11/12 281 470 60% 189
12/13 270 470 57% 200
13/14 278 470 59% 192
14/15 264 470 56% 206
15/16 268 470 57% 202
16/17 286 470 61% 184
17/18 298 470 63% 172
18/19 300 470 64% 170
19/20 314 470 67% 156
20/21 326 470 69% 144
21/22 333 470 71% 137
22/23 336 470 71% 134
23/24 343 470 73% 127
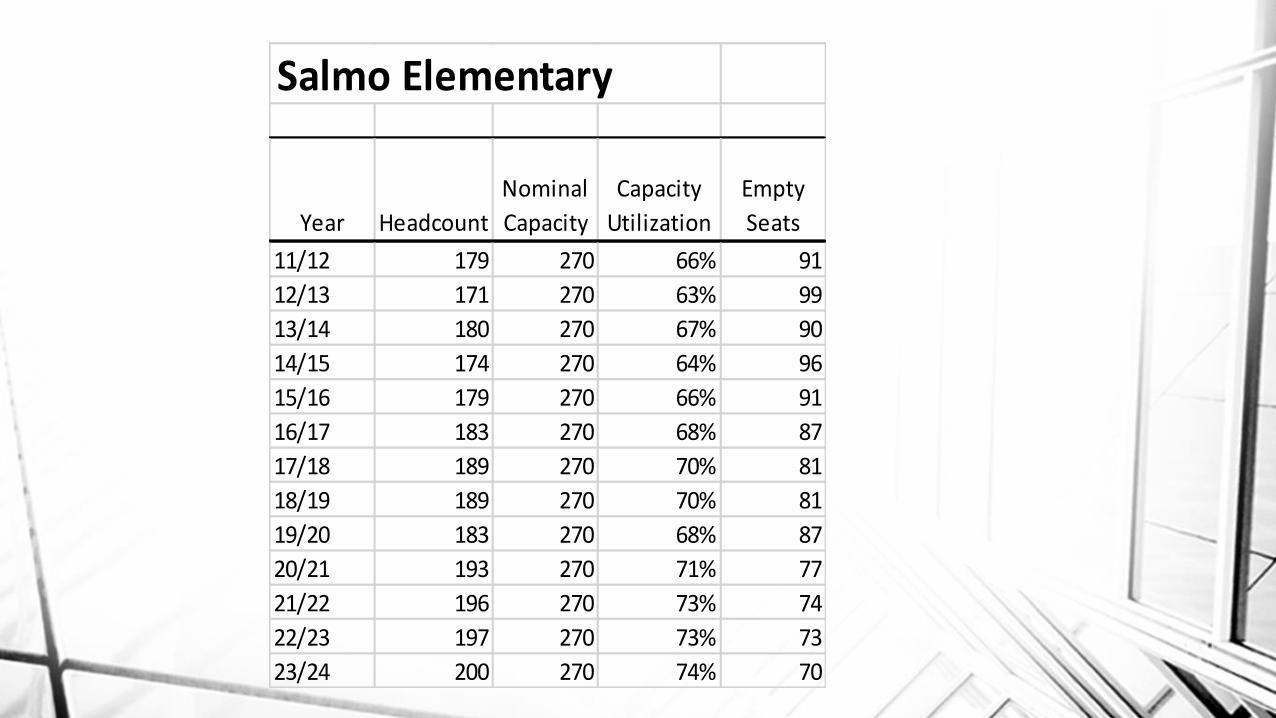
Salmo Elementary
Year Headcount
Nominal
Capacity
Capacity
Utilization
Empty
Seats
11/12 179 270 66% 91
12/13 171 270 63% 99
13/14 180 270 67% 90
14/15 174 270 64% 96
15/16 179 270 66% 91
16/17 183 270 68% 87
17/18 189 270 70% 81
18/19 189 270 70% 81
19/20 183 270 68% 87
20/21 193 270 71% 77
21/22 196 270 73% 74
22/23 197 270 73% 73
23/24 200 270 74% 70
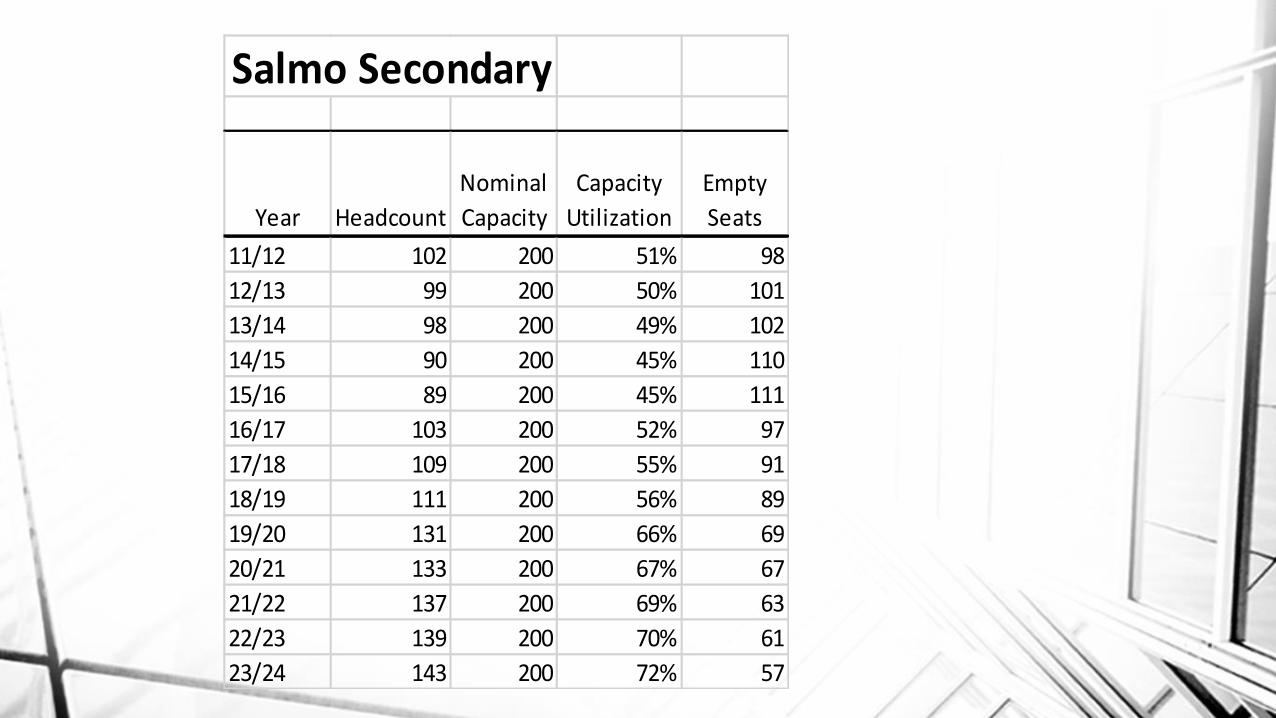
Salmo Secondary
Year Headcount
Nominal
Capacity
Capacity
Utilization
Empty
Seats
11/12 102 200 51% 98
12/13 99 200 50% 101
13/14 98 200 49% 102
14/15 90 200 45% 110
15/16 89 200 45% 111
16/17 103 200 52% 97
17/18 109 200 55% 91
18/19 111 200 56% 89
19/20 131 200 66% 69
20/21 133 200 67% 67
21/22 137 200 69% 63
22/23 139 200 70% 61
23/24 143 200 72% 57
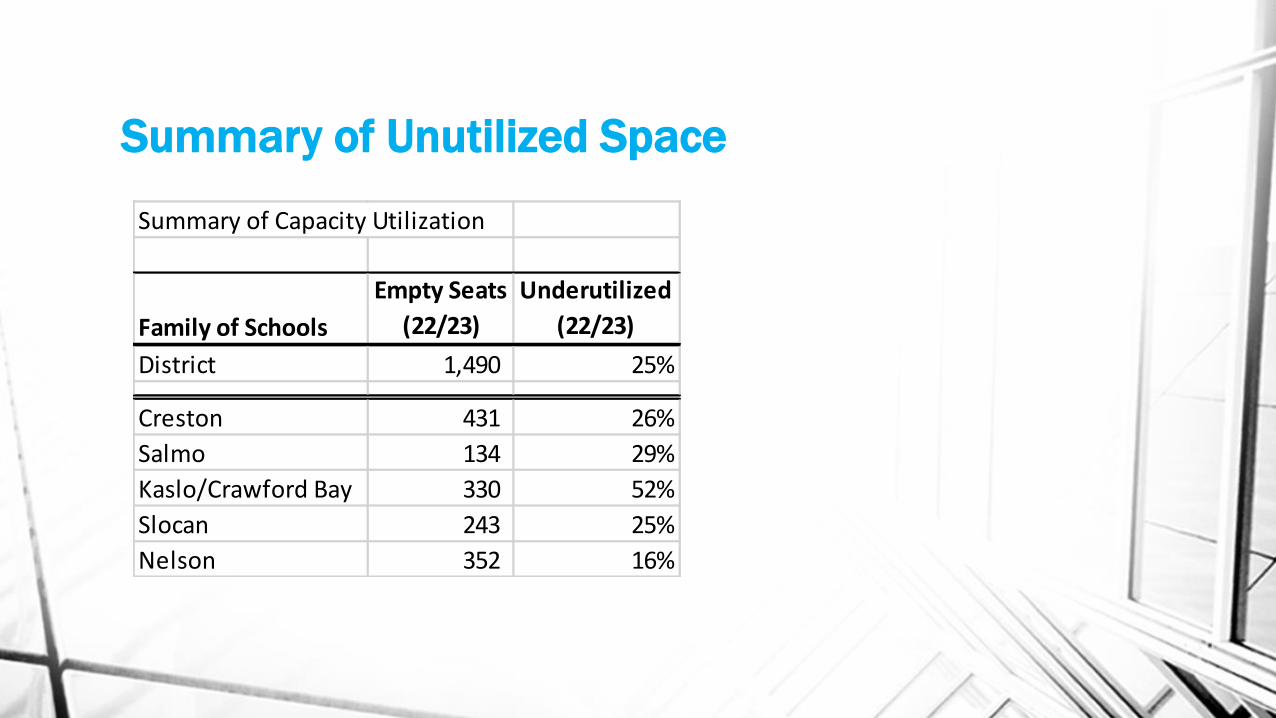
Summary of Unutilized Space
Summary of Capacity Utilization
Family of Schools
Empty Seats
(22/23)
Underutilized
(22/23)
District 1,490 25%
Creston 431 26%
Salmo 134 29%
Kaslo/Crawford Bay 330 52%
Slocan 243 25%
Nelson 352 16%
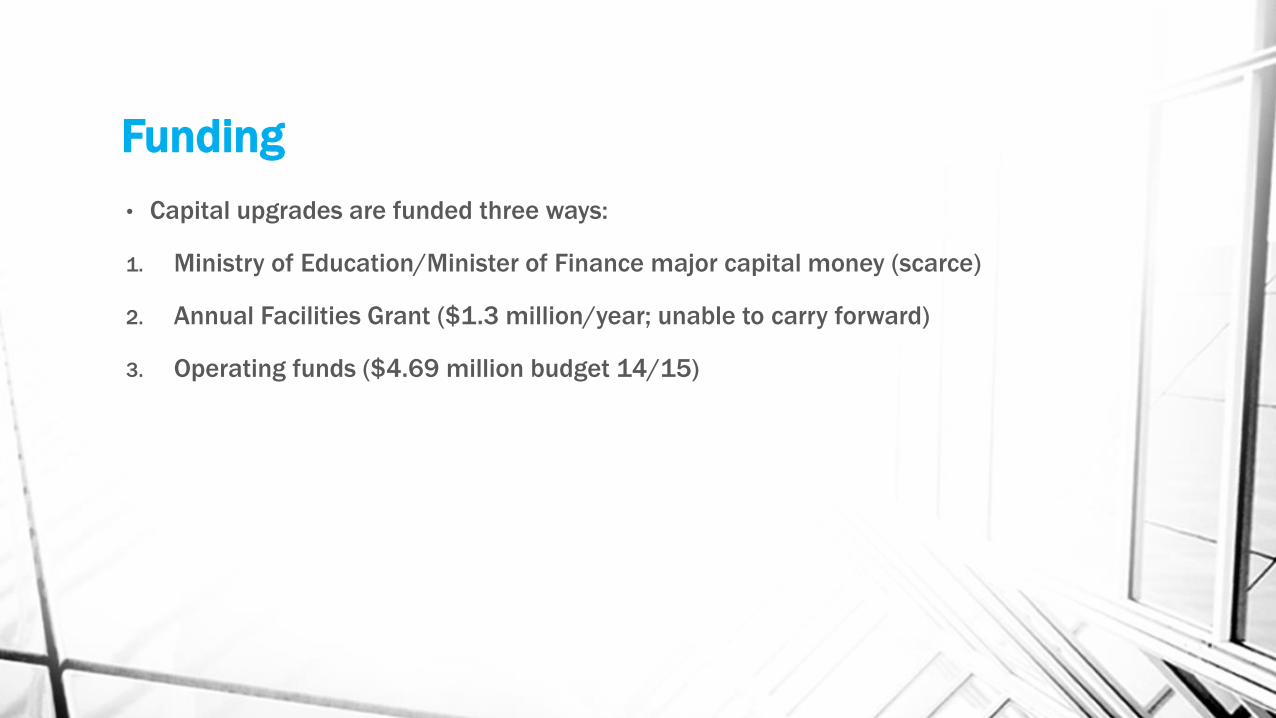
Funding
• Capital upgrades are funded three ways:
1. Ministry of Education/Minister of Finance major capital money (scarce)
2. Annual Facilities Grant ($1.3 million/year; unable to carry forward)
3. Operating funds ($4.69 million budget 14/15)
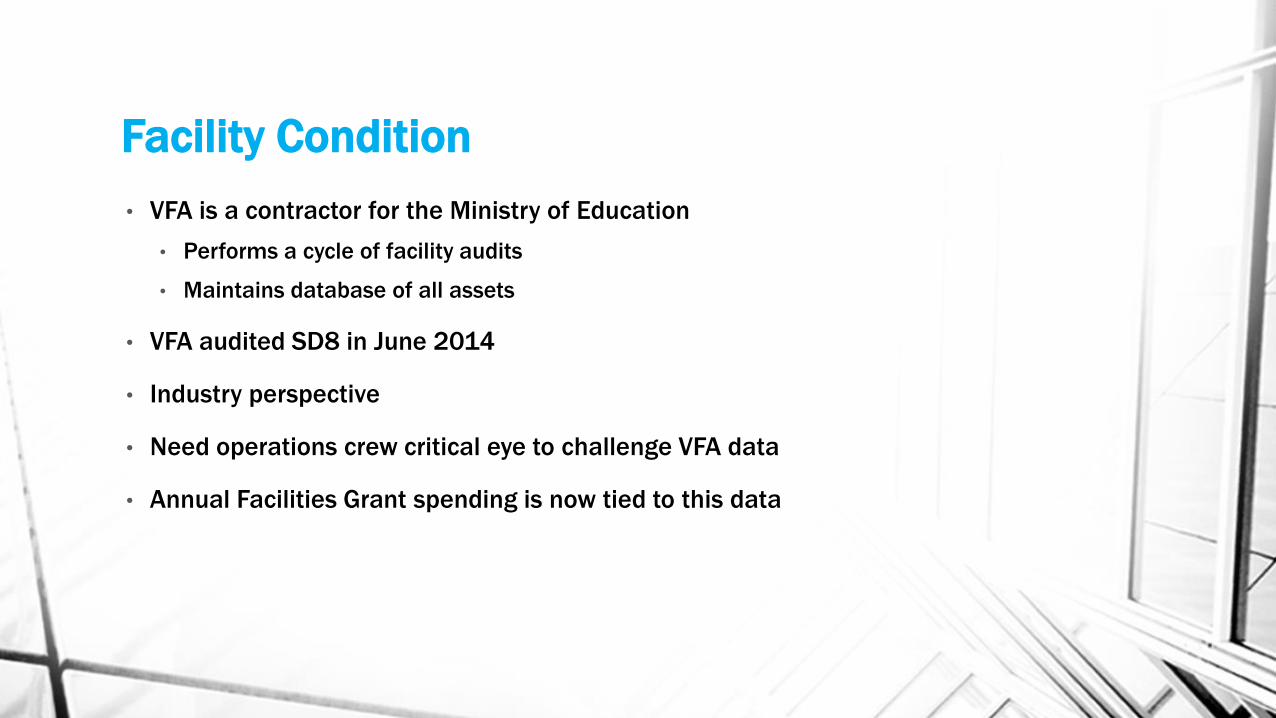
Facility Condition
• VFA is a contractor for the Ministry of Education
• Performs a cycle of facility audits
• Maintains database of all assets
• VFA audited SD8 in June 2014
• Industry perspective
• Need operations crew critical eye to challenge VFA data
• Annual Facilities Grant spending is now tied to this data
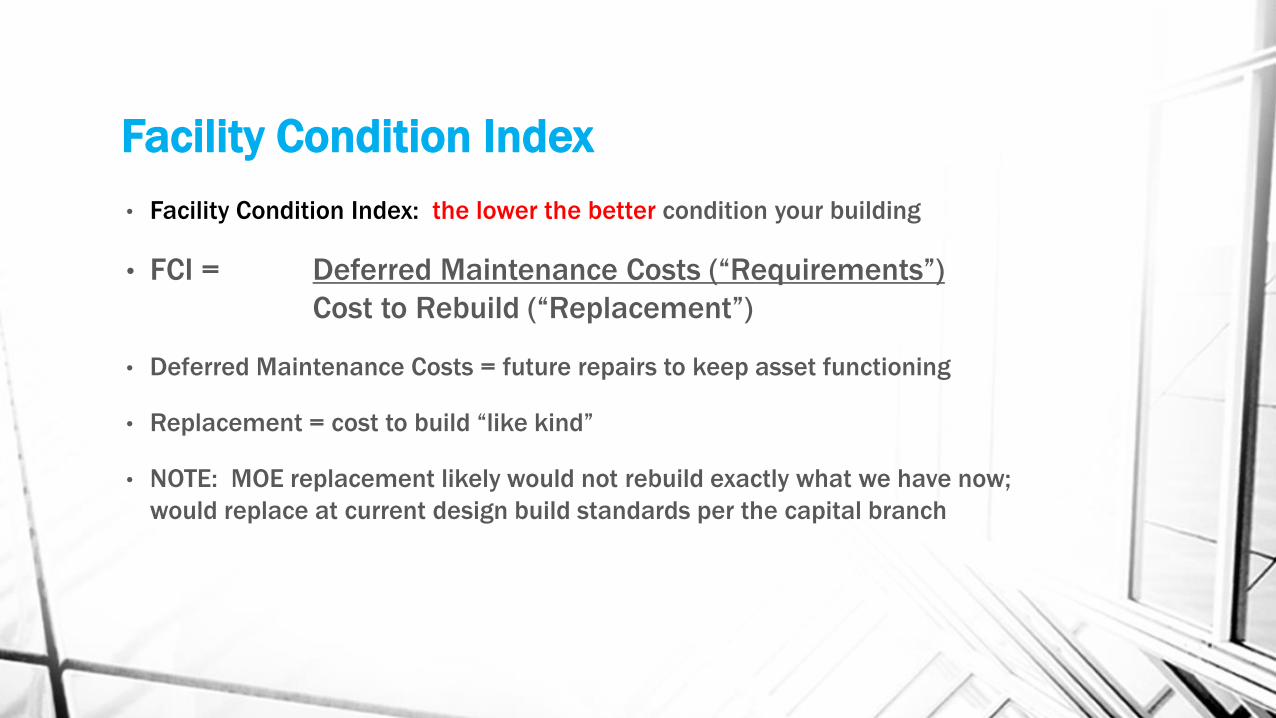
Facility Condition Index
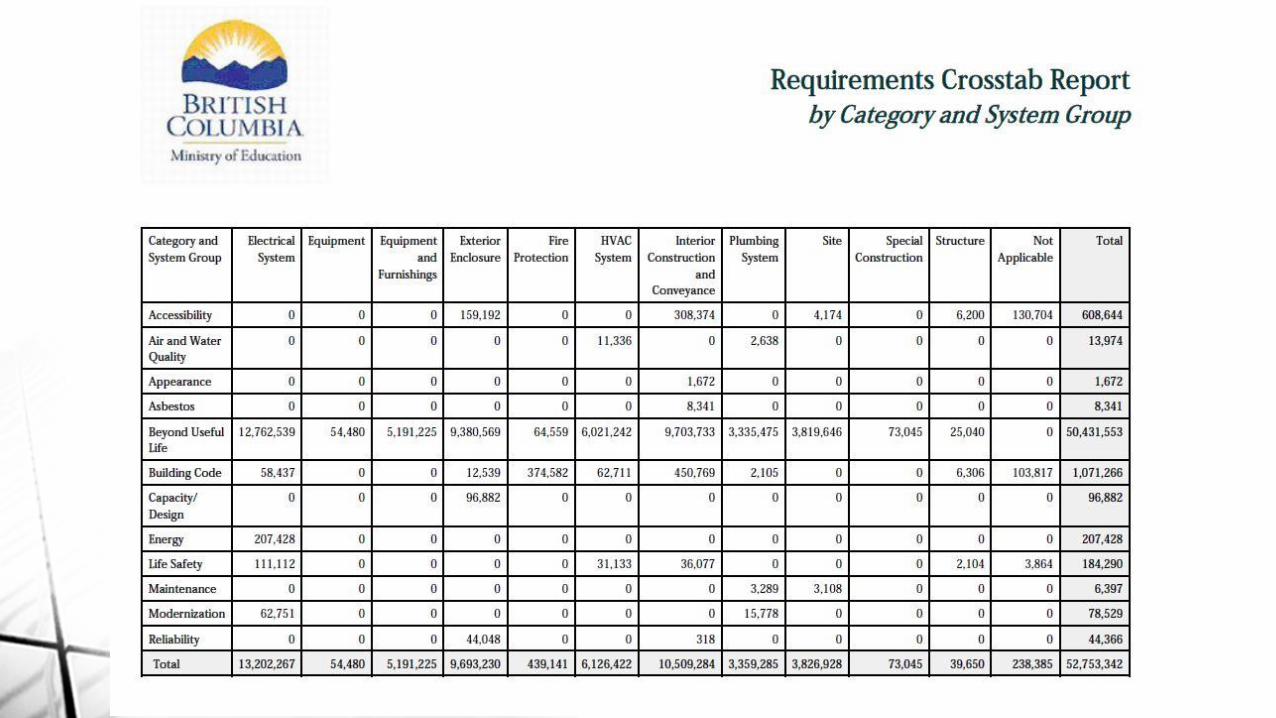
• Facility Condition Index: the lower the better condition your building
• FCI = Deferred Maintenance Costs (“Requirements”)
Cost to Rebuild (“Replacement”)
• Deferred Maintenance Costs = future repairs to keep asset functioning
• Replacement = cost to build “like kind”
• NOTE: MOE replacement likely would not rebuild exactly what we have now;
would replace at current design build standards per the capital branch
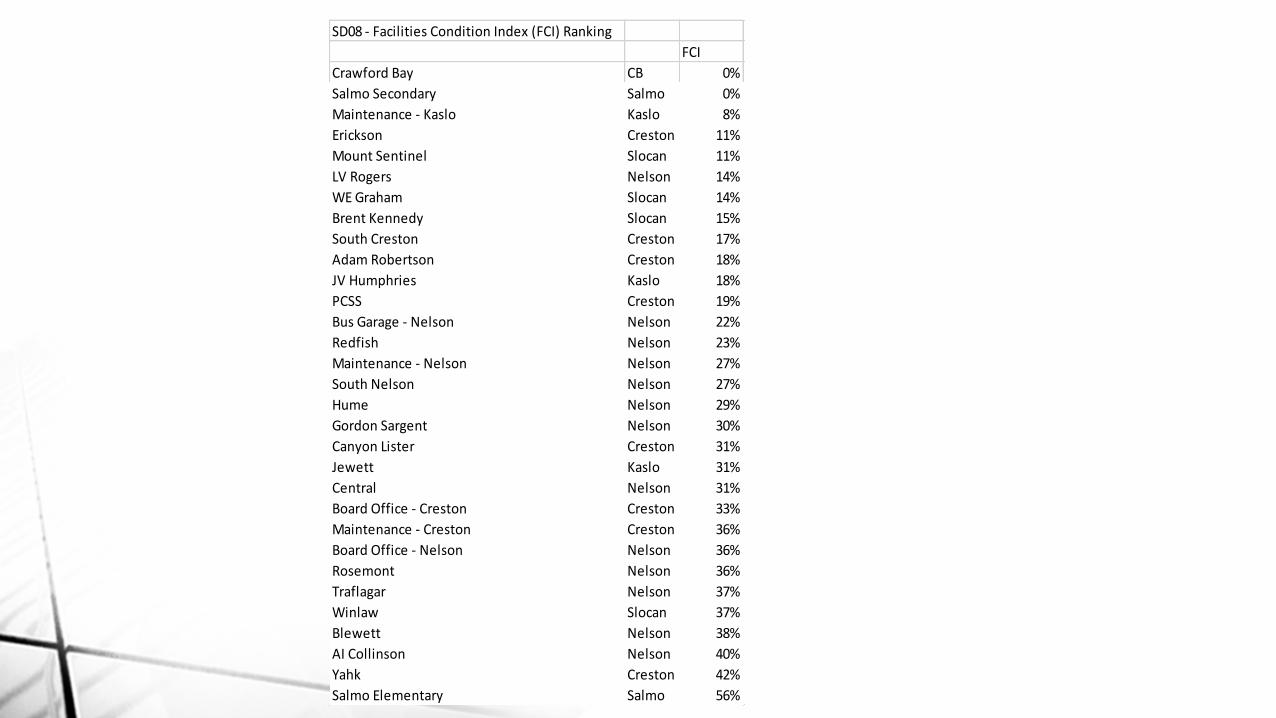
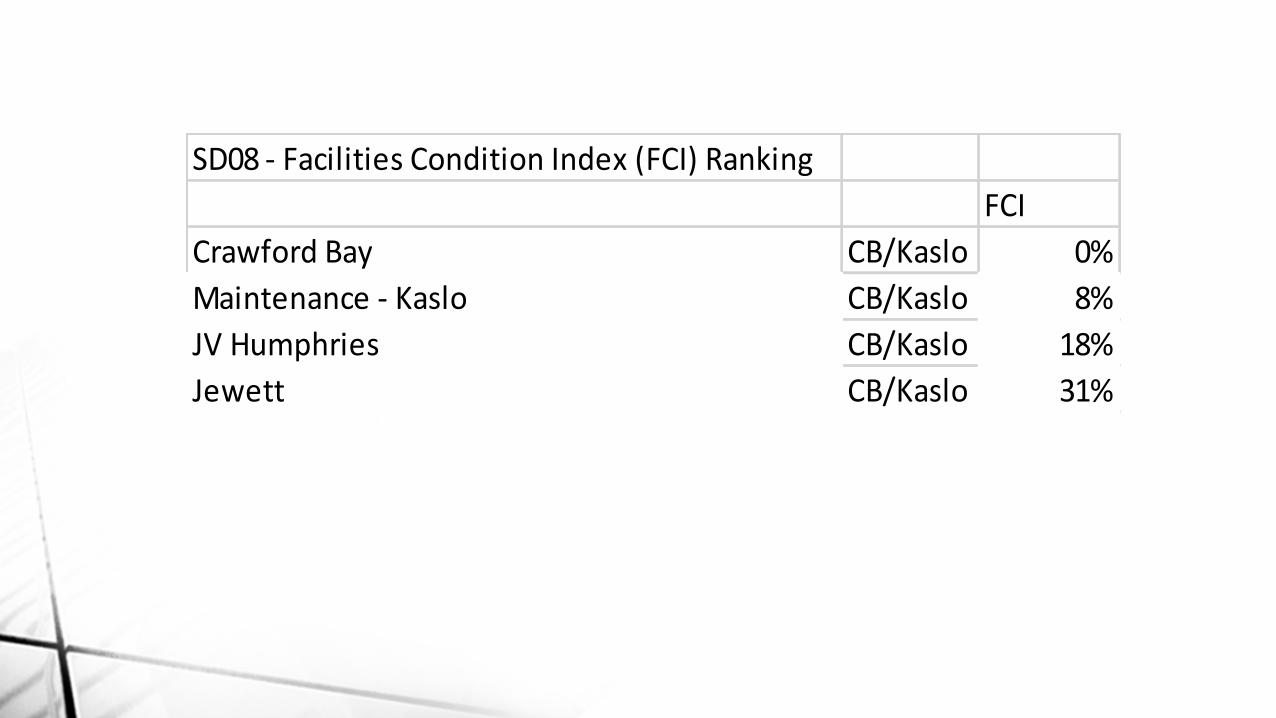
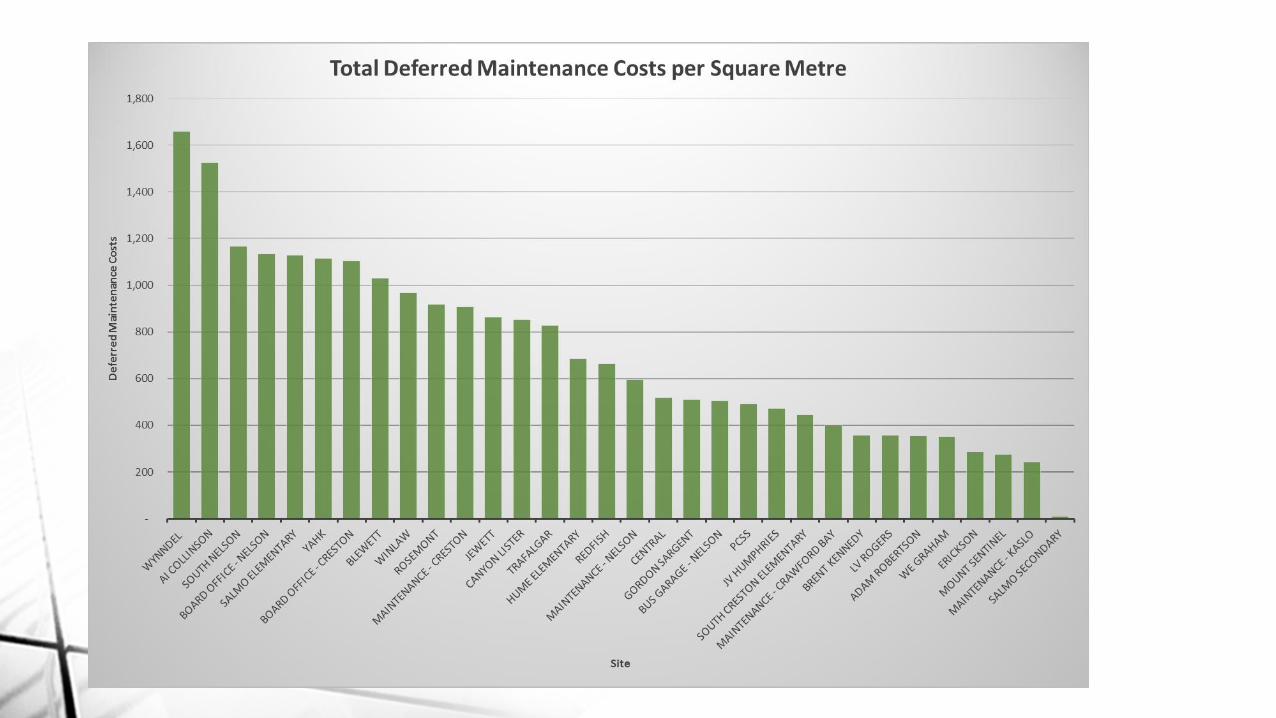
SD08 - Facilities Condition Index (FCI) Ranking
FCI
Crawford Bay CB 0%
Salmo Secondary Salmo 0%
Maintenance - Kaslo Kaslo 8%
Erickson Creston 11%
Mount Sentinel Slocan 11%
LV Rogers Nelson 14%
WE Graham Slocan 14%
Brent Kennedy Slocan 15%
South Creston Creston 17%
Adam Robertson Creston 18%
JV Humphries Kaslo 18%
PCSS Creston 19%
Bus Garage - Nelson Nelson 22%
Redfish Nelson 23%
Maintenance - Nelson Nelson 27%
South Nelson Nelson 27%
Hume Nelson 29%
Gordon Sargent Nelson 30%
Canyon Lister Creston 31%
Jewett Kaslo 31%
Central Nelson 31%
Board Office - Creston Creston 33%
Maintenance - Creston Creston 36%
Board Office - Nelson Nelson 36%
Rosemont Nelson 36%
Traflagar Nelson 37%
Winlaw Slocan 37%
Blewett Nelson 38%
AI Collinson Nelson 40%
Yahk Creston 42%
Salmo Elementary Salmo 56%
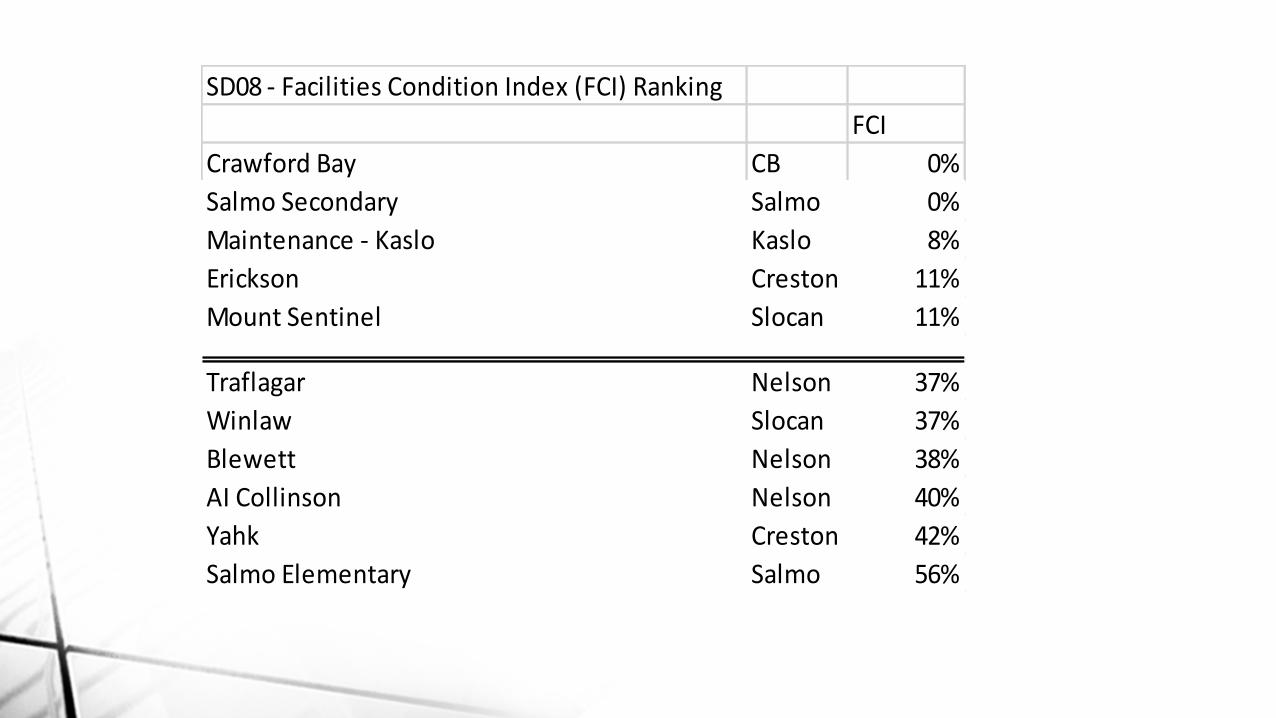
SD08 - Facilities Condition Index (FCI) Ranking
FCI
Crawford Bay CB 0%
Salmo Secondary Salmo 0%
Maintenance - Kaslo Kaslo 8%
Erickson Creston 11%
Mount Sentinel Slocan 11%
Traflagar Nelson 37%
Winlaw Slocan 37%
Blewett Nelson 38%
AI Collinson Nelson 40%
Yahk Creston 42%
Salmo Elementary Salmo 56%
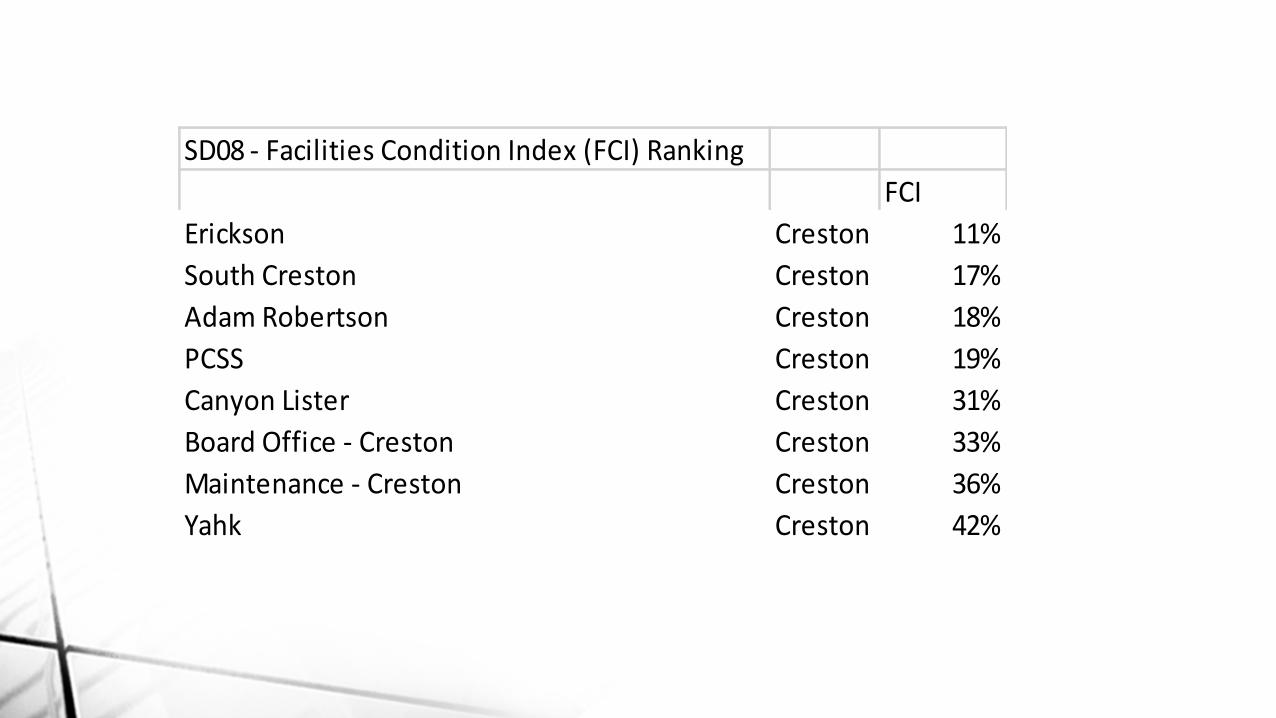
SD08 - Facilities Condition Index (FCI) Ranking
FCI
Erickson Creston 11%
South Creston Creston 17%
Adam Robertson Creston 18%
PCSS Creston 19%
Canyon Lister Creston 31%
Board Office - Creston Creston 33%
Maintenance - Creston Creston 36%
Yahk Creston 42%
SD08 - Facilities Condition Index (FCI) Ranking
FCI
Crawford Bay CB/Kaslo 0%
Maintenance - Kaslo CB/Kaslo 8%
JV Humphries CB/Kaslo 18%
Jewett CB/Kaslo 31%
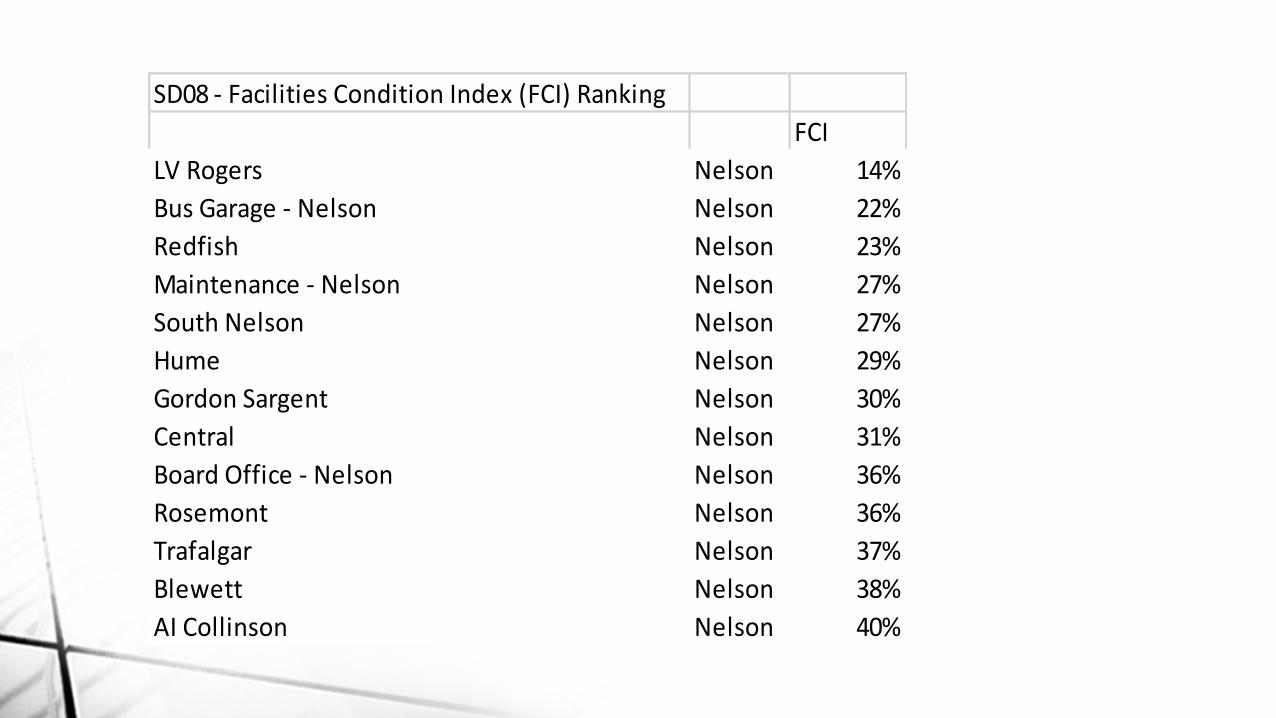
SD08 - Facilities Condition Index (FCI) Ranking
FCI
LV Rogers Nelson 14%
Bus Garage - Nelson Nelson 22%
Redfish Nelson 23%
Maintenance - Nelson Nelson 27%
South Nelson Nelson 27%
Hume Nelson 29%
Gordon Sargent Nelson 30%
Central Nelson 31%
Board Office - Nelson Nelson 36%
Rosemont Nelson 36%
Trafalgar Nelson 37%
Blewett Nelson 38%
AI Collinson Nelson 40%
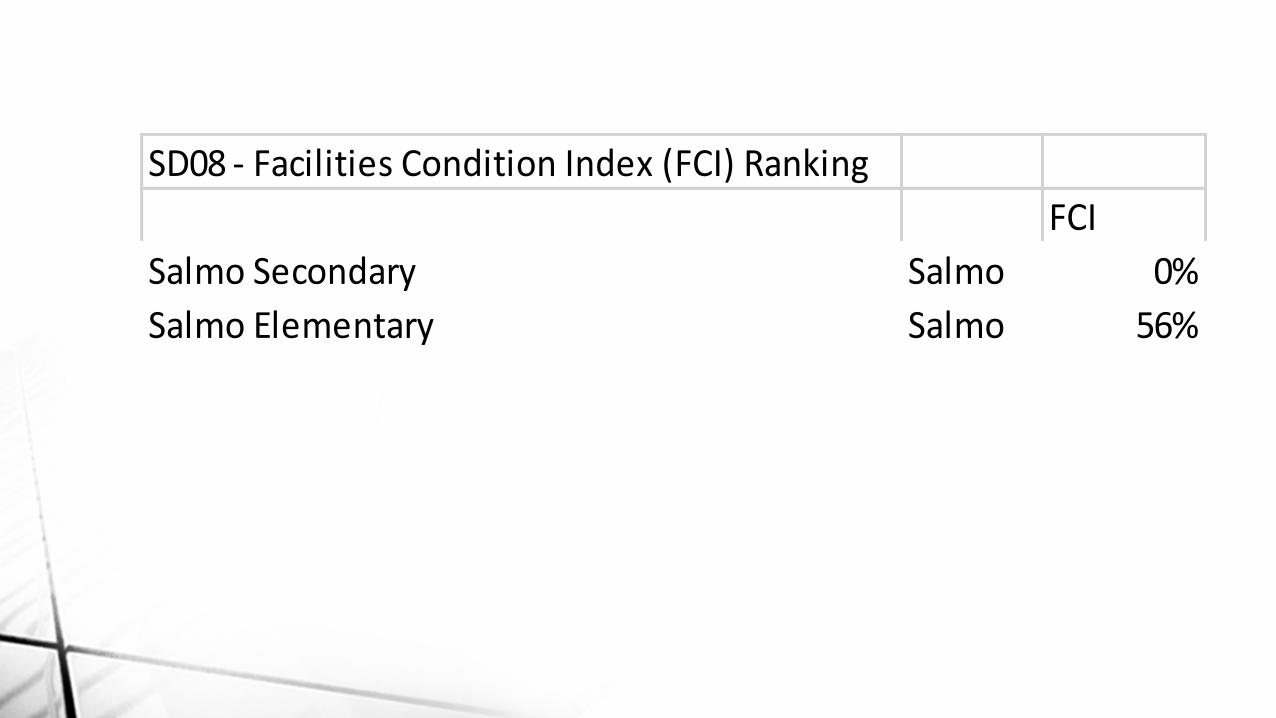
SD08 - Facilities Condition Index (FCI) Ranking
FCI
Salmo Secondary Salmo 0%
Salmo Elementary Salmo 56%
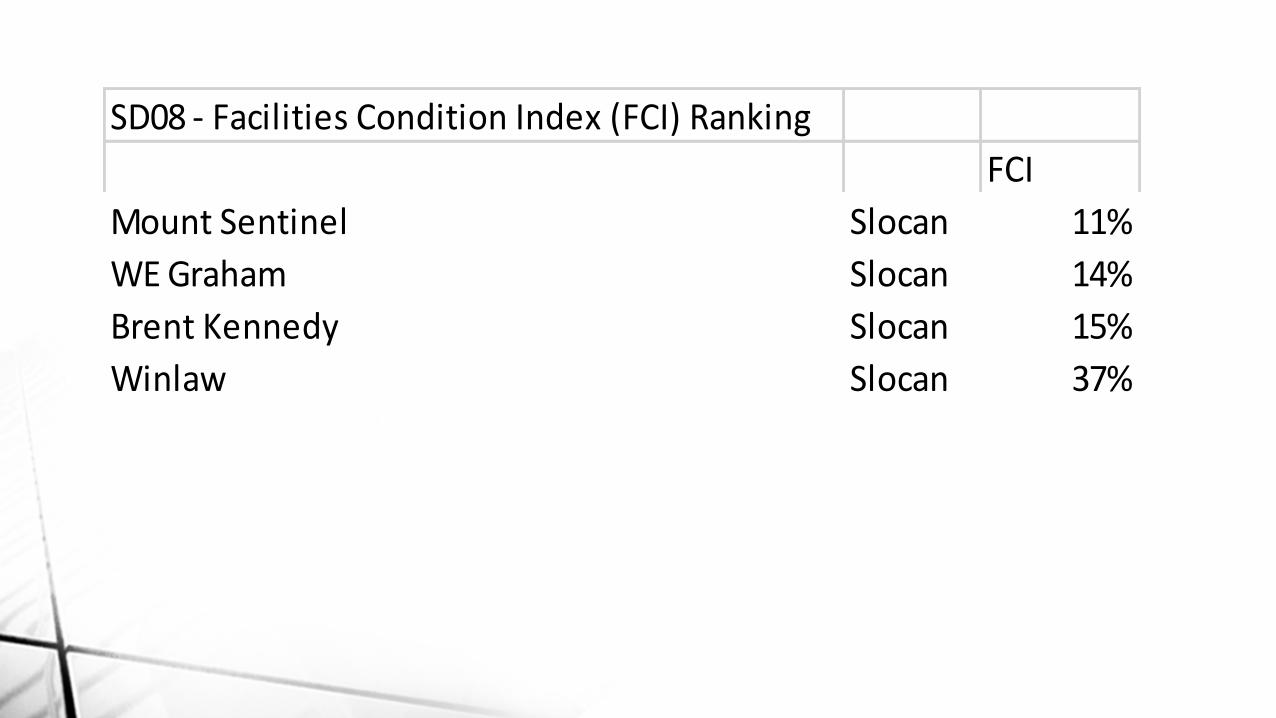
SD08 - Facilities Condition Index (FCI) Ranking
FCI
Mount Sentinel Slocan 11%
WE Graham Slocan 14%
Brent Kennedy Slocan 15%
Winlaw Slocan 37%
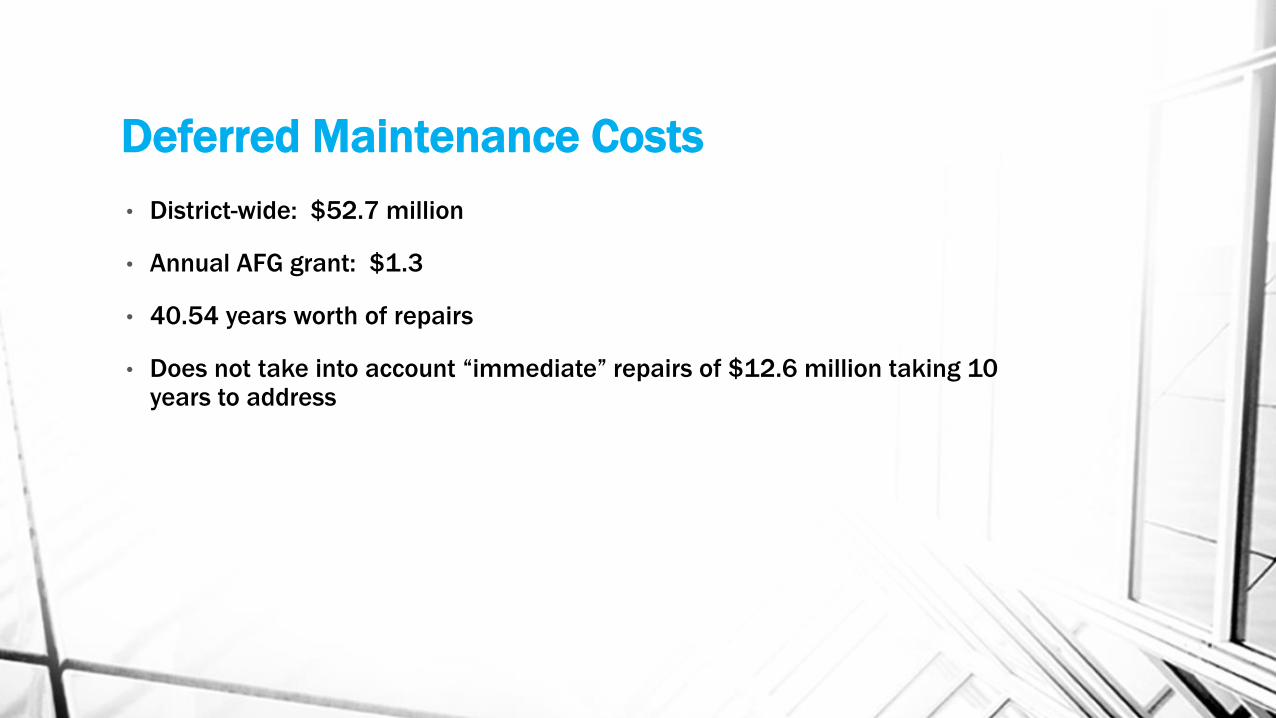
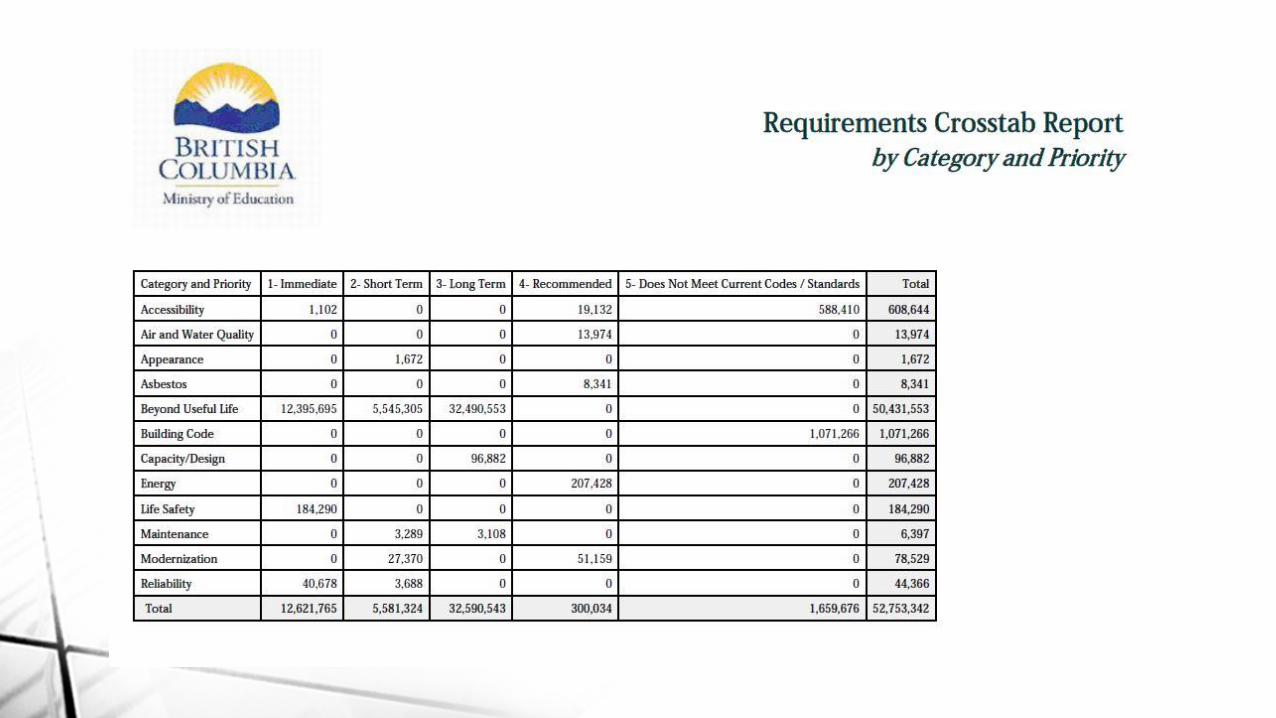
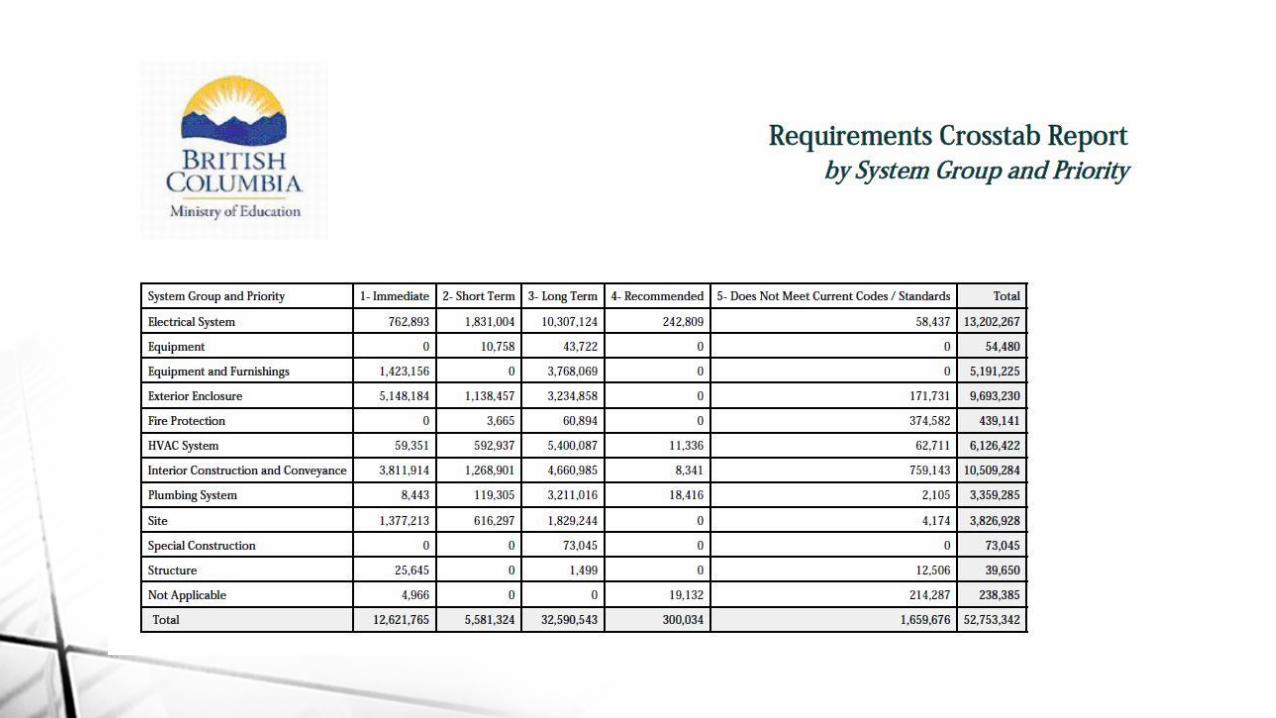
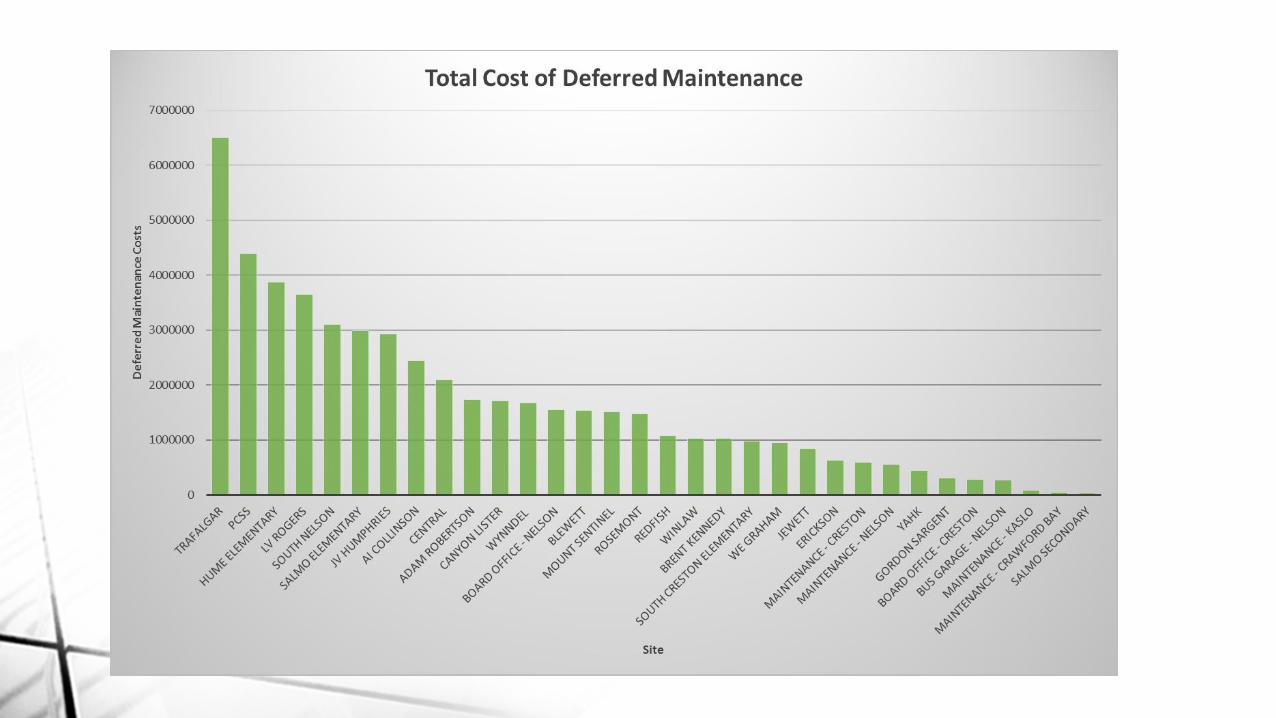
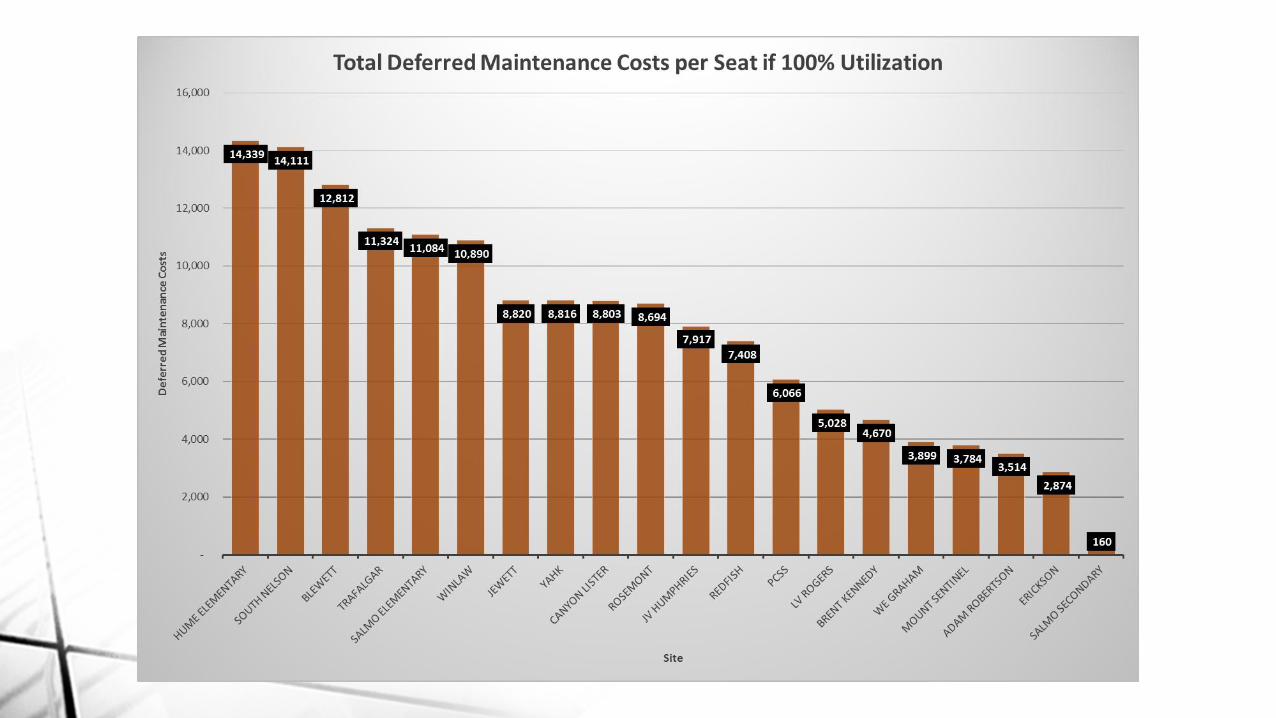
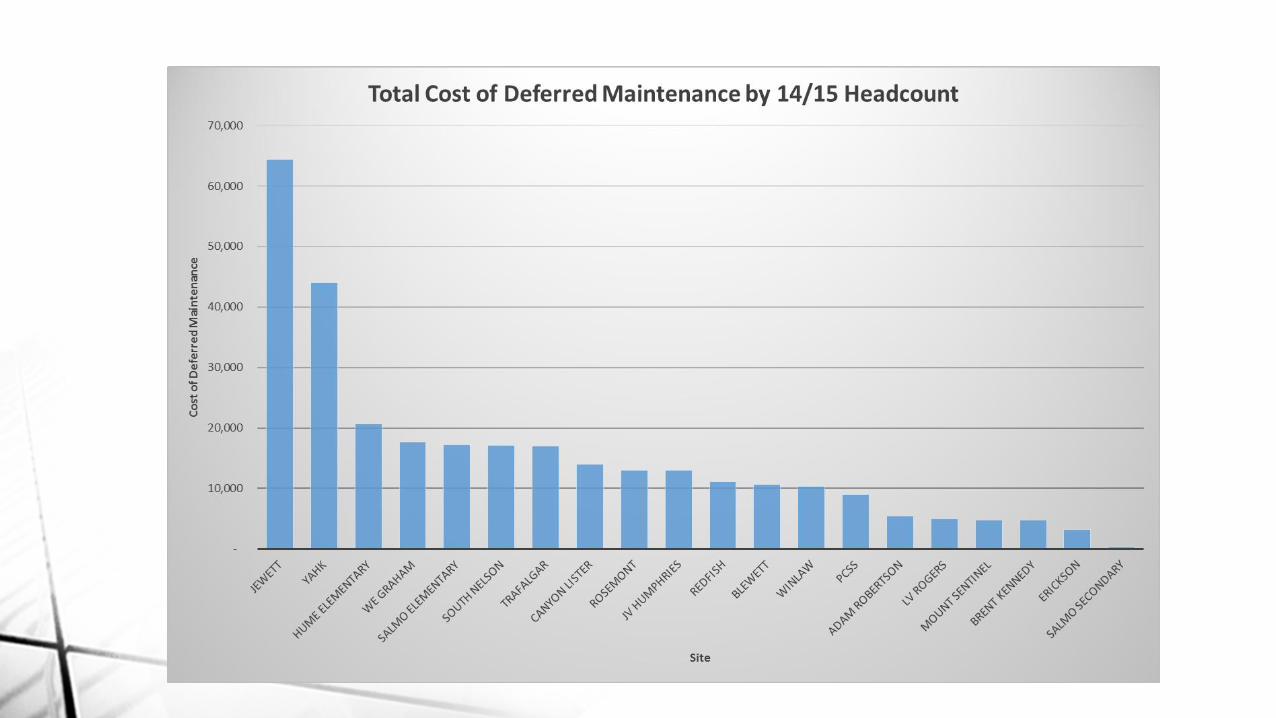
Deferred Maintenance Costs
• District-wide: $52.7 million
• Annual AFG grant: $1.3
• 40.54 years worth of repairs
• Does not take into account “immediate” repairs of $12.6 million taking 10 years to address
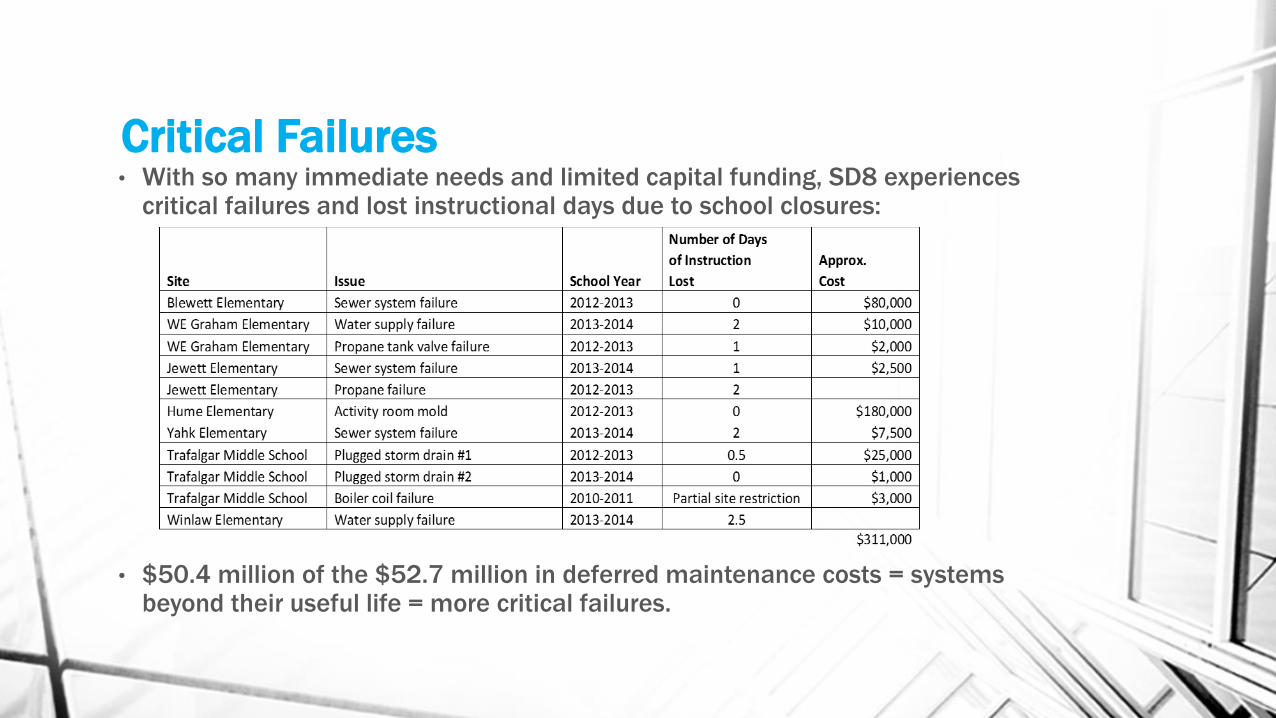
Critical Failures• With so many immediate needs and limited capital funding, SD8 experiences
critical failures and lost instructional days due to school closures:
• $50.4 million of the $52.7 million in deferred maintenance costs = systems beyond their useful life = more critical failures.
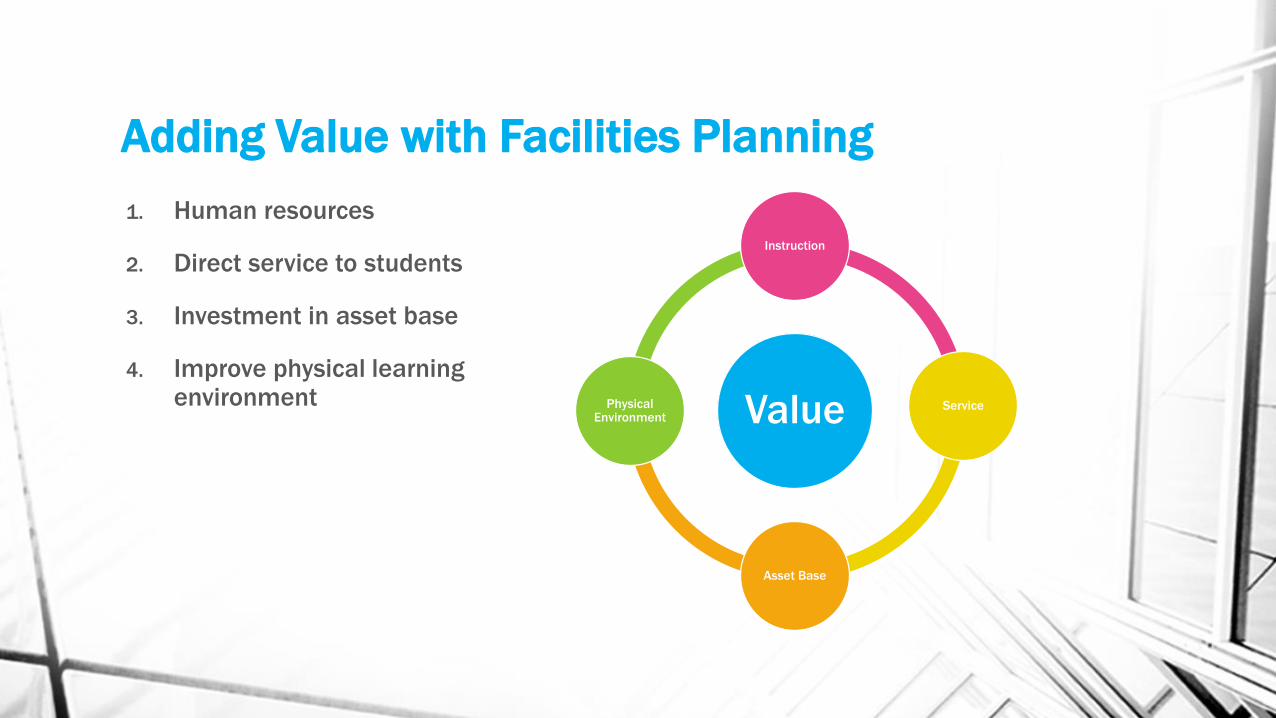
Adding Value with Facilities Planning
1. Human resources
2. Direct service to students
3. Investment in asset base
4. Improve physical learning environment Value
Instruction
Service
Asset Base
Physical Environment
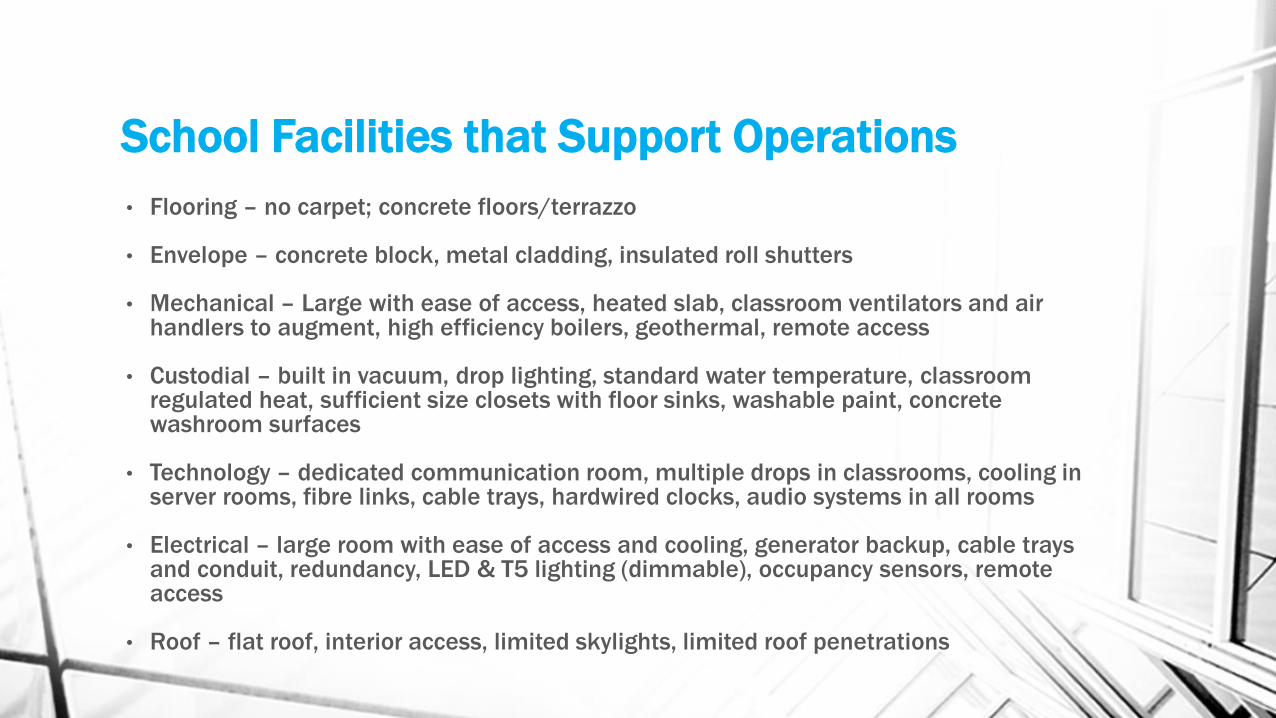
School Facilities that Support Operations
• Flooring – no carpet; concrete floors/terrazzo
• Envelope – concrete block, metal cladding, insulated roll shutters
• Mechanical – Large with ease of access, heated slab, classroom ventilators and air handlers to augment, high efficiency boilers, geothermal, remote access
• Custodial – built in vacuum, drop lighting, standard water temperature, classroom regulated heat, sufficient size closets with floor sinks, washable paint, concrete washroom surfaces
• Technology – dedicated communication room, multiple drops in classrooms, cooling in server rooms, fibre links, cable trays, hardwired clocks, audio systems in all rooms
• Electrical – large room with ease of access and cooling, generator backup, cable trays and conduit, redundancy, LED & T5 lighting (dimmable), occupancy sensors, remote access
• Roof – flat roof, interior access, limited skylights, limited roof penetrations

Ideas for today and tomorrow
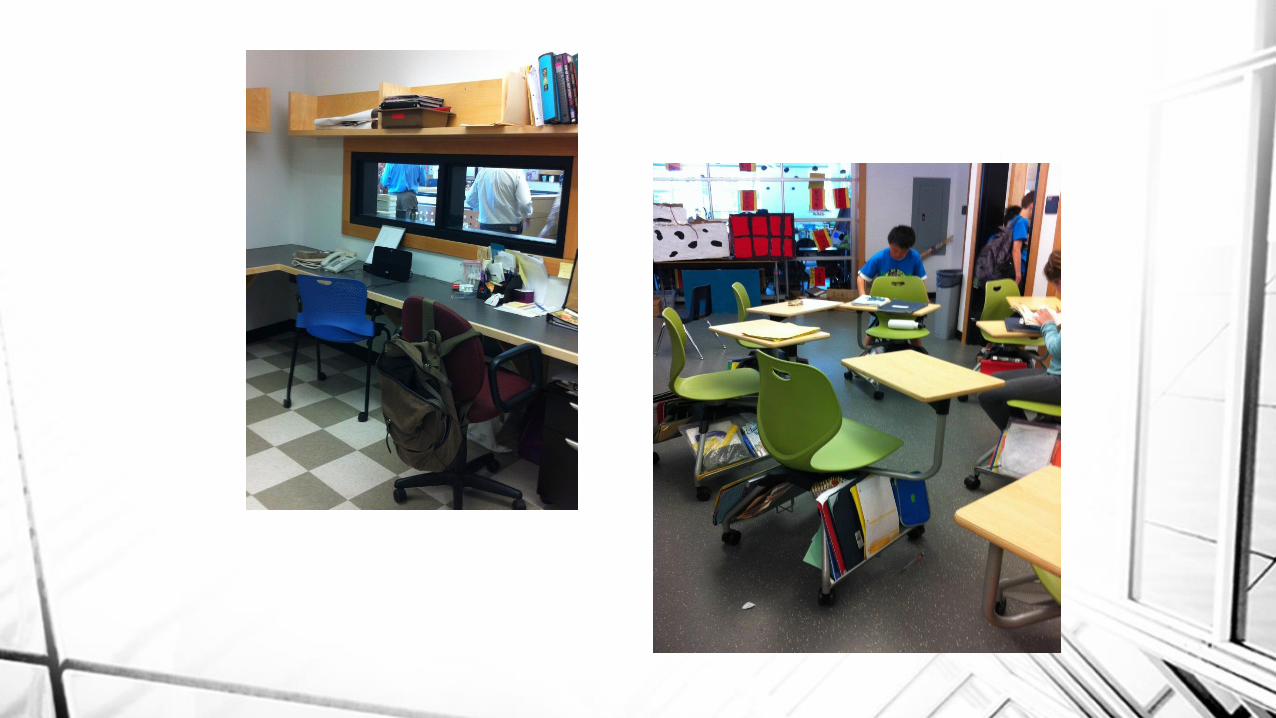
School Facilities that Support Learning
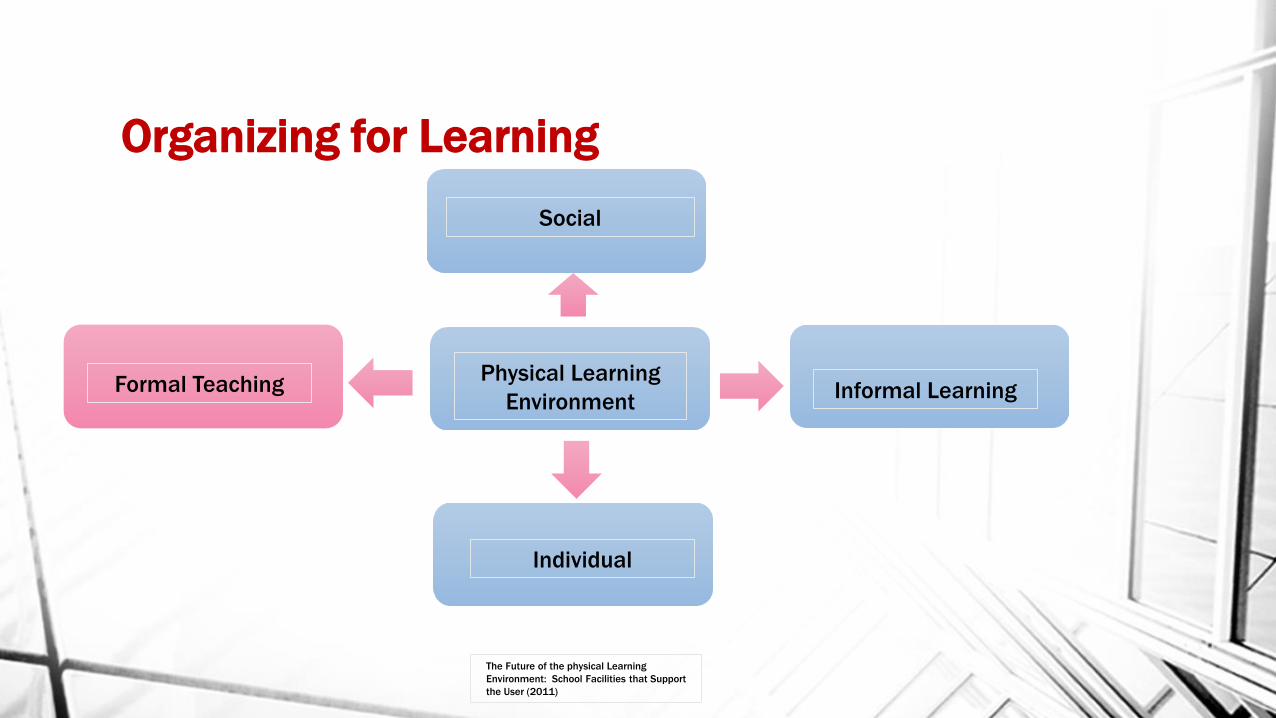
Organizing for Learning
Social
Formal Teaching Informal Learning
Individual
Physical Learning
Environment
The Future of the physical Learning
Environment: School Facilities that Support
the User (2011)
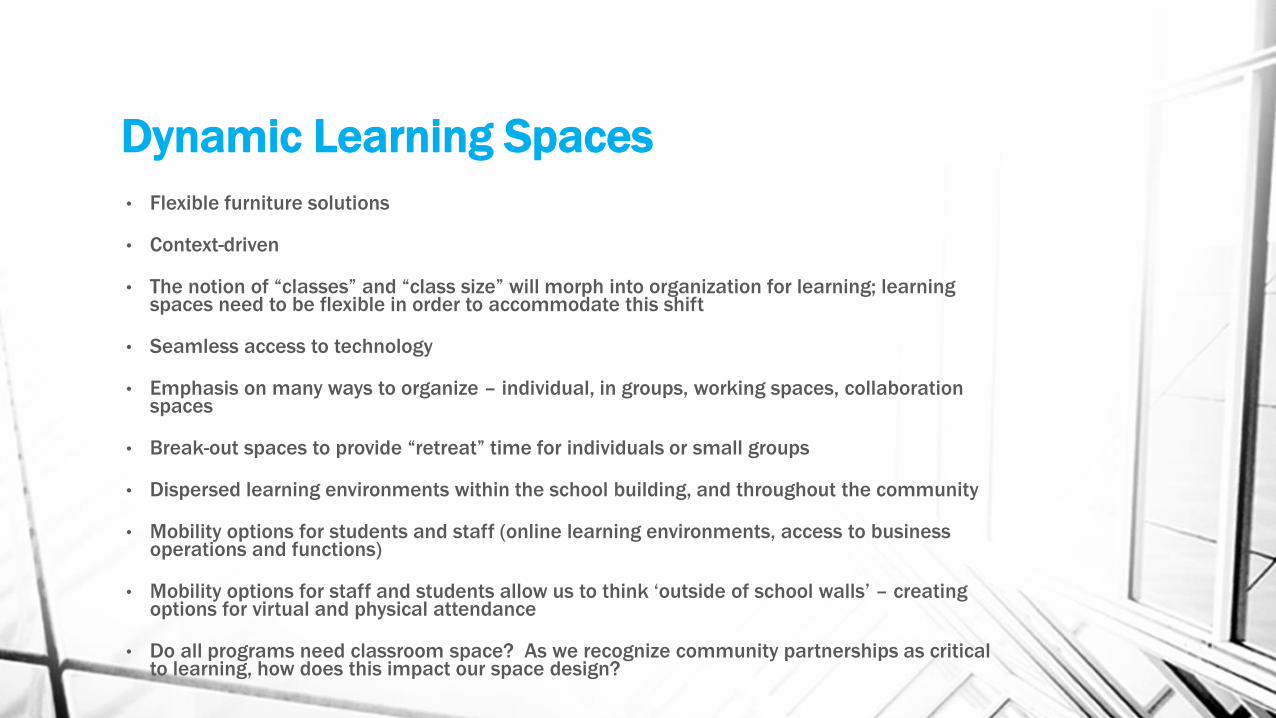
• Flexible furniture solutions
• Context-driven
• The notion of “classes” and “class size” will morph into organization for learning; learning spaces need to be flexible in order to accommodate this shift
• Seamless access to technology
• Emphasis on many ways to organize – individual, in groups, working spaces, collaboration spaces
• Break-out spaces to provide “retreat” time for individuals or small groups
• Dispersed learning environments within the school building, and throughout the community
• Mobility options for students and staff (online learning environments, access to business operations and functions)
• Mobility options for staff and students allow us to think ‘outside of school walls’ – creating options for virtual and physical attendance
• Do all programs need classroom space? As we recognize community partnerships as critical to learning, how does this impact our space design?
Dynamic Learning Spaces
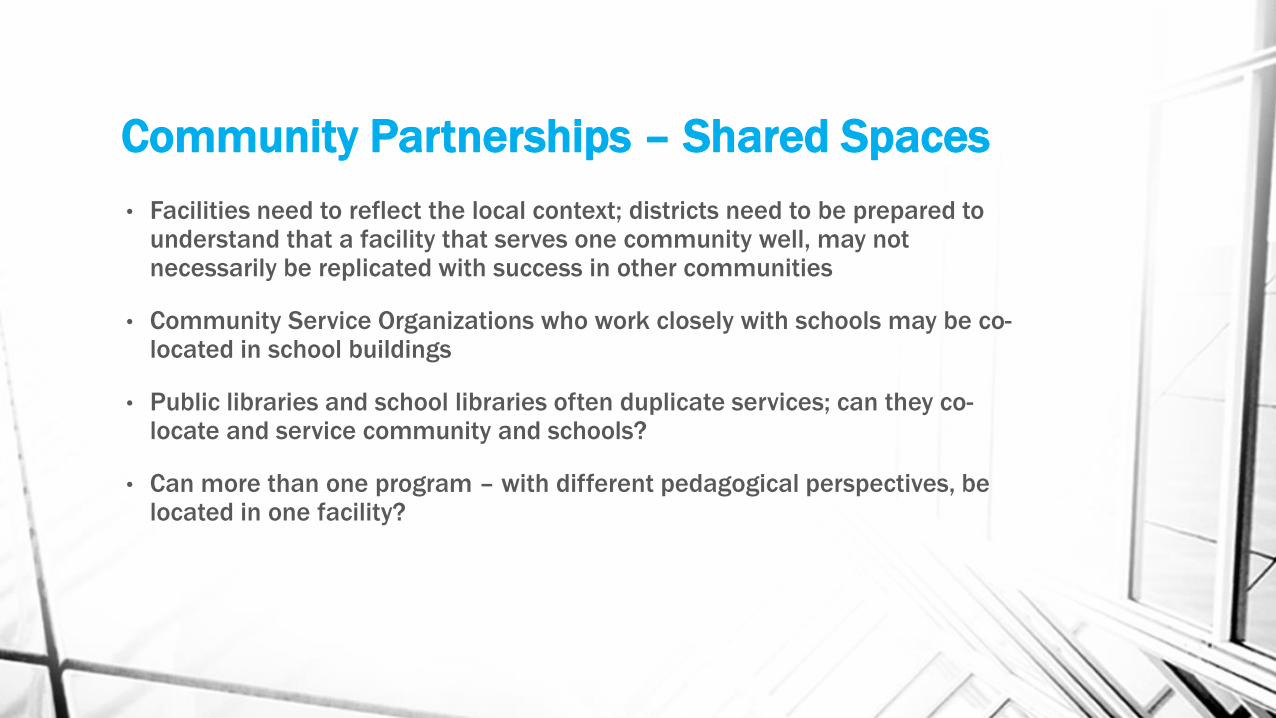
• Facilities need to reflect the local context; districts need to be prepared to understand that a facility that serves one community well, may not necessarily be replicated with success in other communities
• Community Service Organizations who work closely with schools may be co-located in school buildings
• Public libraries and school libraries often duplicate services; can they co-locate and service community and schools?
• Can more than one program – with different pedagogical perspectives, be located in one facility?
Community Partnerships – Shared Spaces
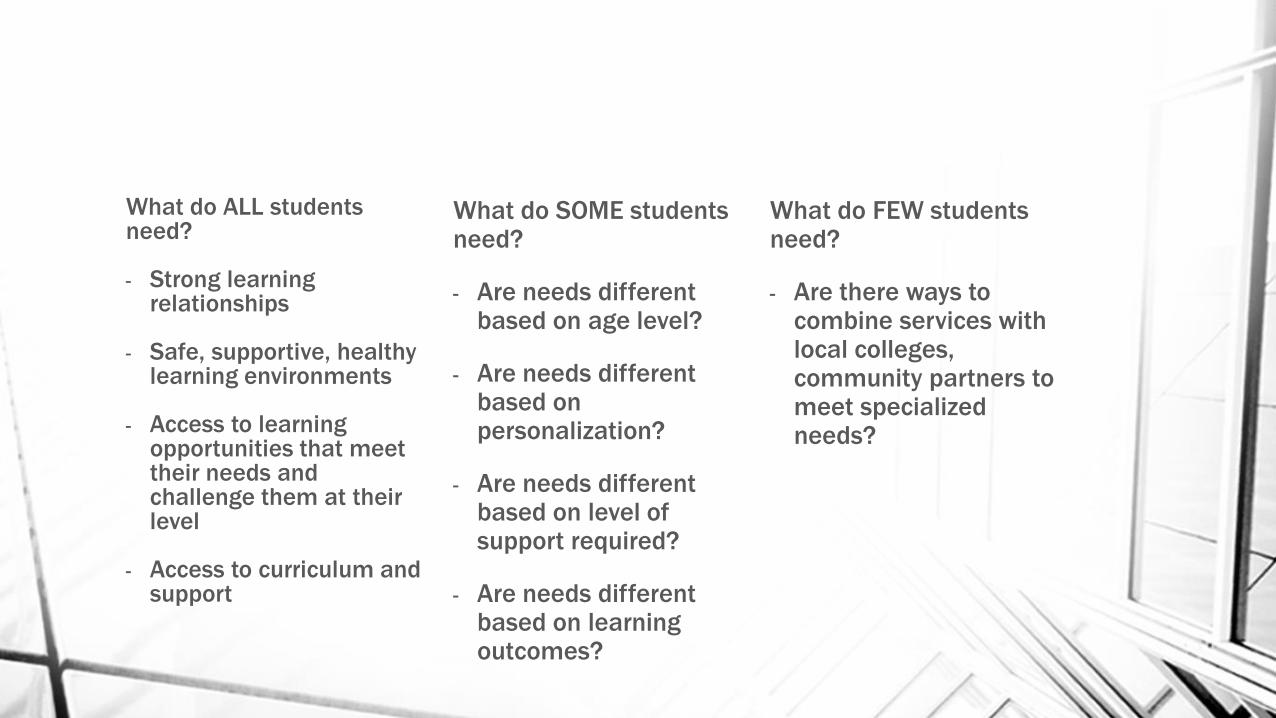
What do ALL students need?
- Strong learning relationships
- Safe, supportive, healthy learning environments
- Access to learning opportunities that meet their needs and challenge them at their level
- Access to curriculum and support
What do SOME students need?
- Are needs different based on age level?
- Are needs different based on personalization?
- Are needs different based on level of support required?
- Are needs different based on learning outcomes?
What do FEW students need?
- Are there ways to combine services with local colleges, community partners to meet specialized needs?
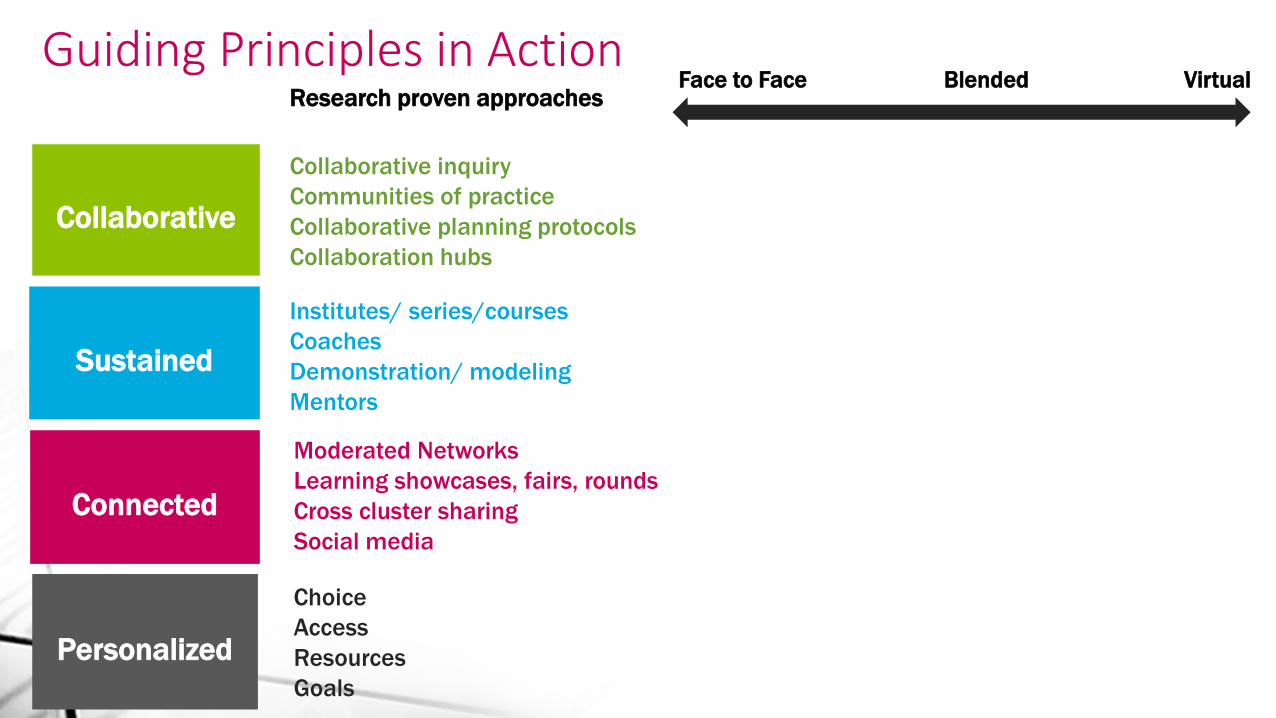
Connected
Collaborative
Sustained
Personalized
Face to Face Blended Virtual
Institutes/ series/courses
Coaches
Demonstration/ modeling
Mentors
Collaborative inquiry
Communities of practice
Collaborative planning protocols
Collaboration hubs
Moderated Networks
Learning showcases, fairs, rounds
Cross cluster sharing
Social media
Choice
Access
Resources
Goals
Guiding Principles in ActionResearch proven approaches
Research
Based
Pedagogical Practices
Emerging Innovative
Practices
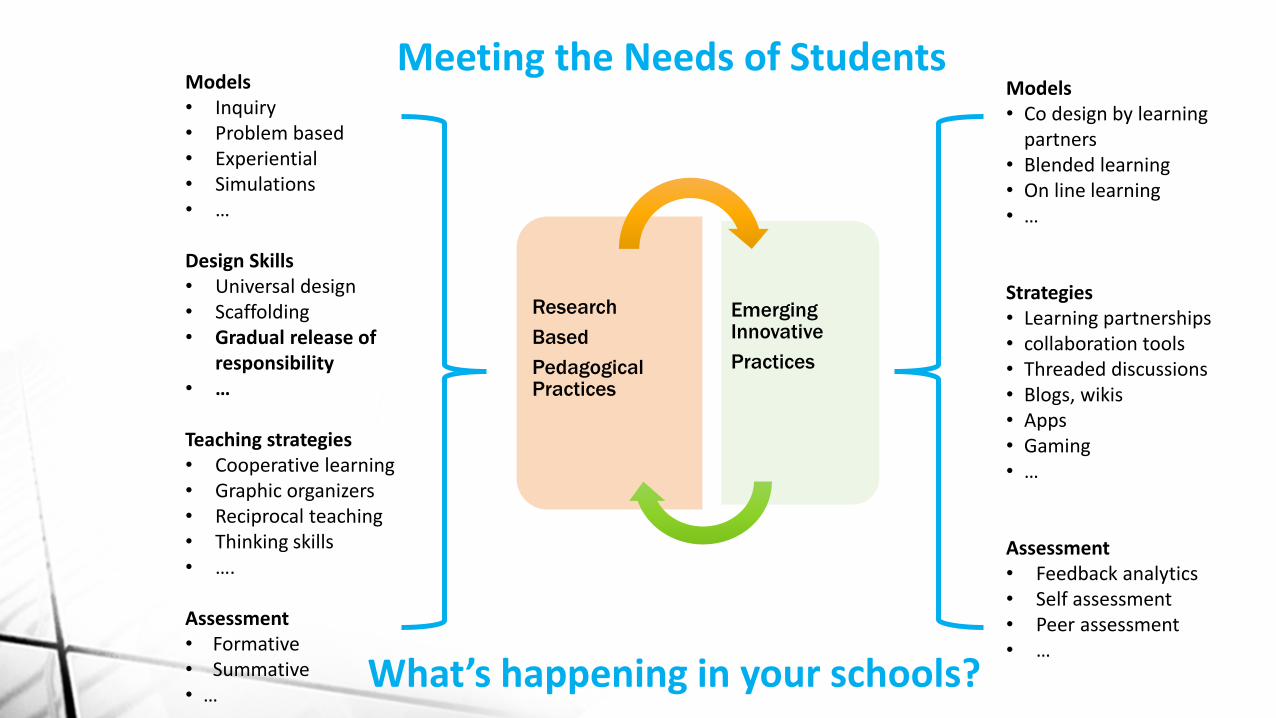
Models • Inquiry• Problem based• Experiential• Simulations • …
Design Skills• Universal design• Scaffolding• Gradual release of
responsibility• …
Teaching strategies• Cooperative learning• Graphic organizers• Reciprocal teaching• Thinking skills• ….
Assessment• Formative • Summative• …
Models• Co design by learning
partners• Blended learning• On line learning • …
Strategies • Learning partnerships• collaboration tools• Threaded discussions• Blogs, wikis• Apps• Gaming• …
Assessment • Feedback analytics• Self assessment• Peer assessment• …
Meeting the Needs of Students
What’s happening in your schools?
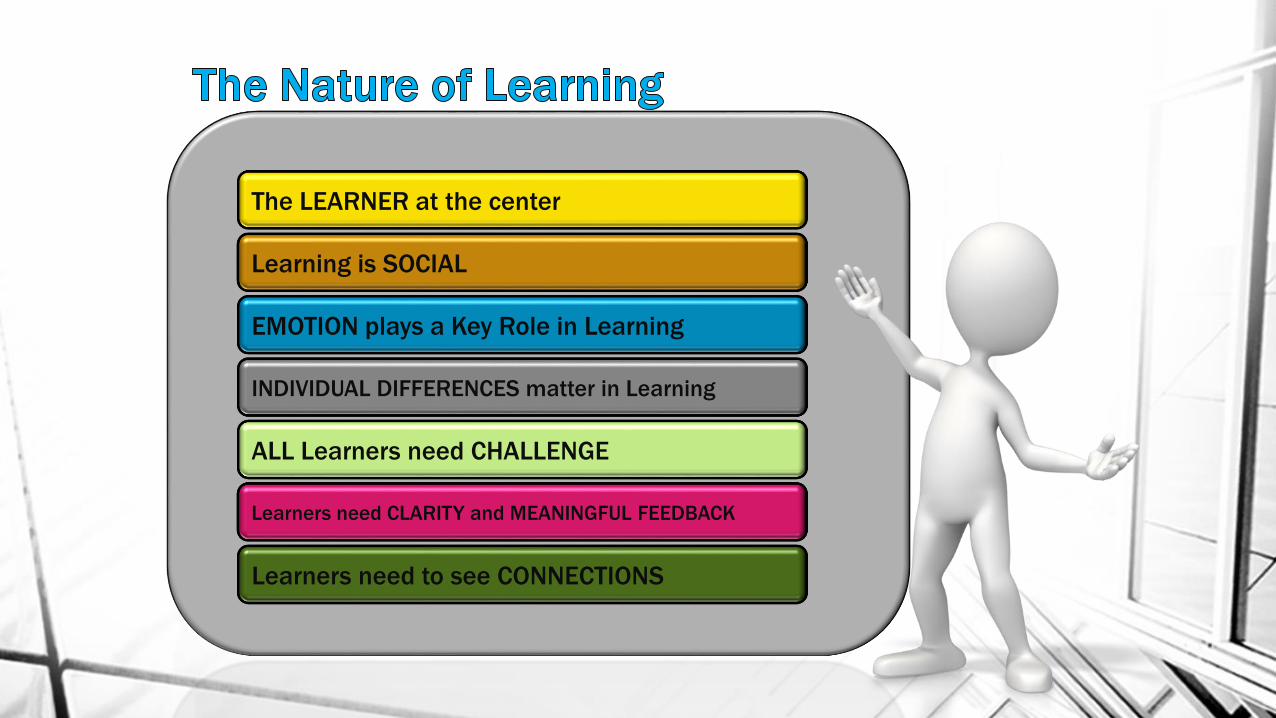
The LEARNER at the center
Learning is SOCIAL
EMOTION plays a Key Role in Learning
INDIVIDUAL DIFFERENCES matter in Learning
ALL Learners need CHALLENGE
Learners need CLARITY and MEANINGFUL FEEDBACK
Learners need to see CONNECTIONS
Susanne Maguire
Teacher
School District 8
November, 2014
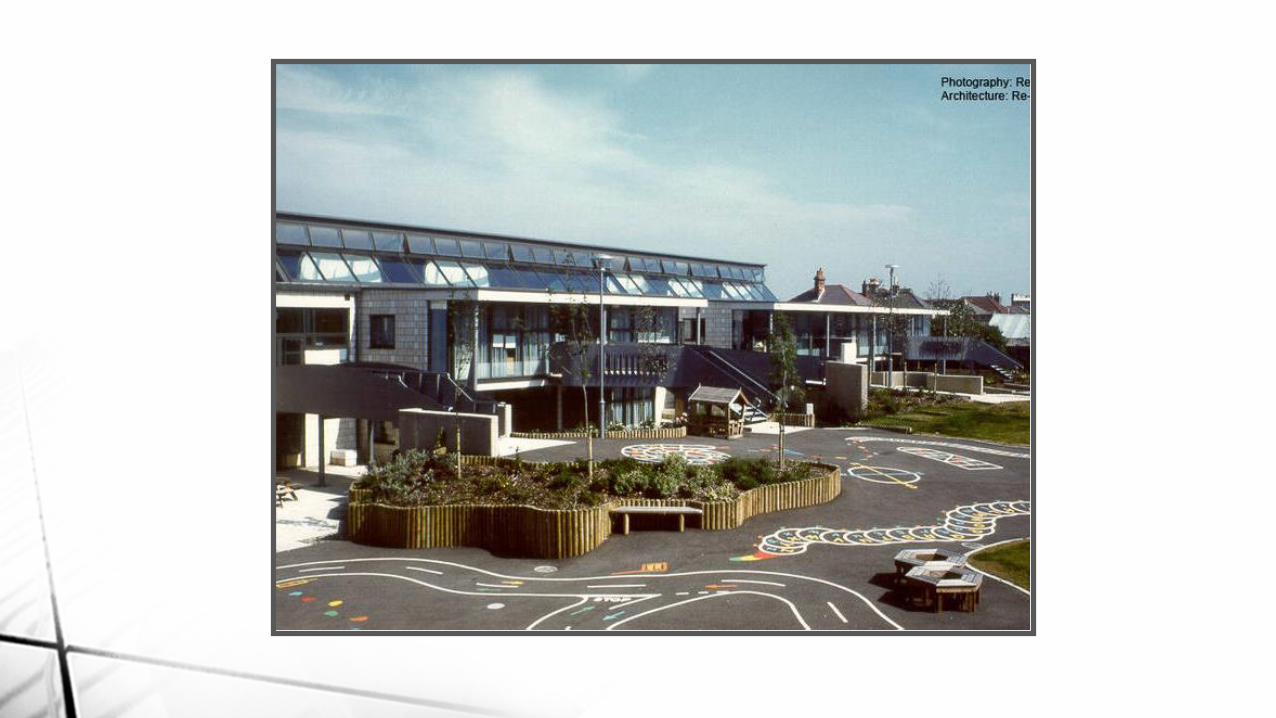
SD8 Kootenay Lake:Refresh, Repurpose, Reinvent?
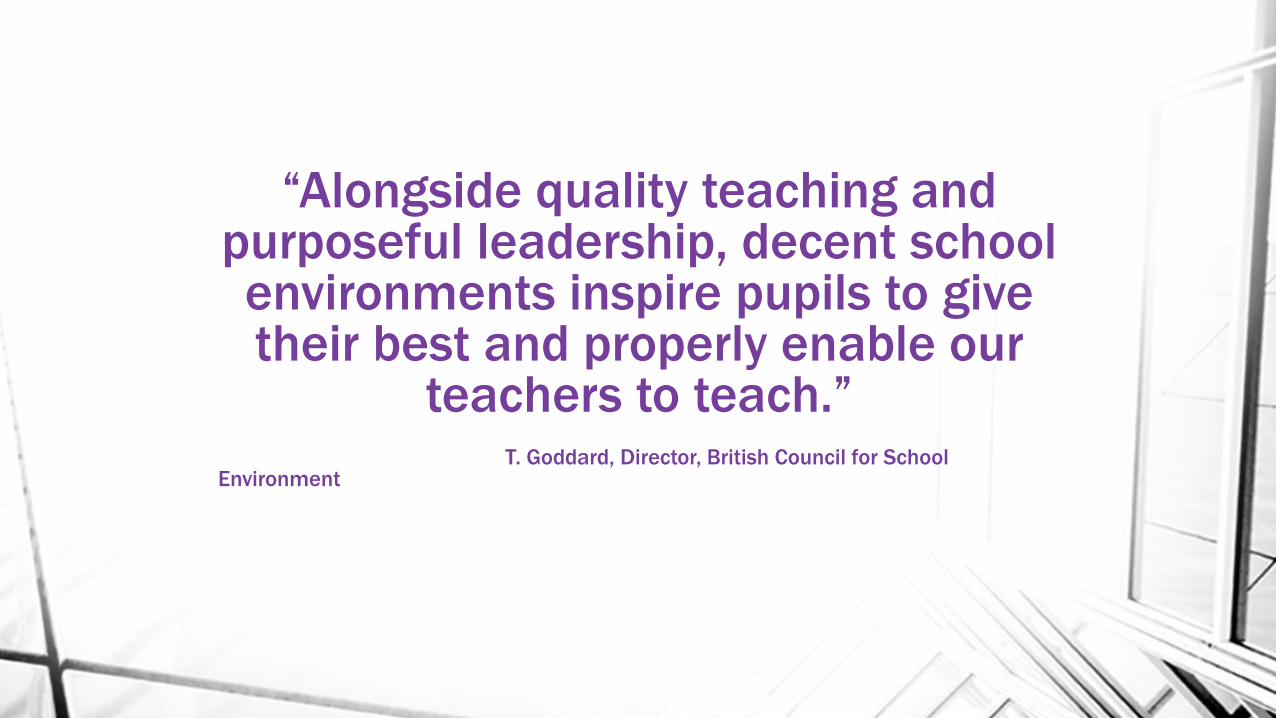
“Alongside quality teaching and purposeful leadership, decent school environments inspire pupils to give their best and properly enable our
teachers to teach.” T. Goddard, Director, British Council for School
Environment

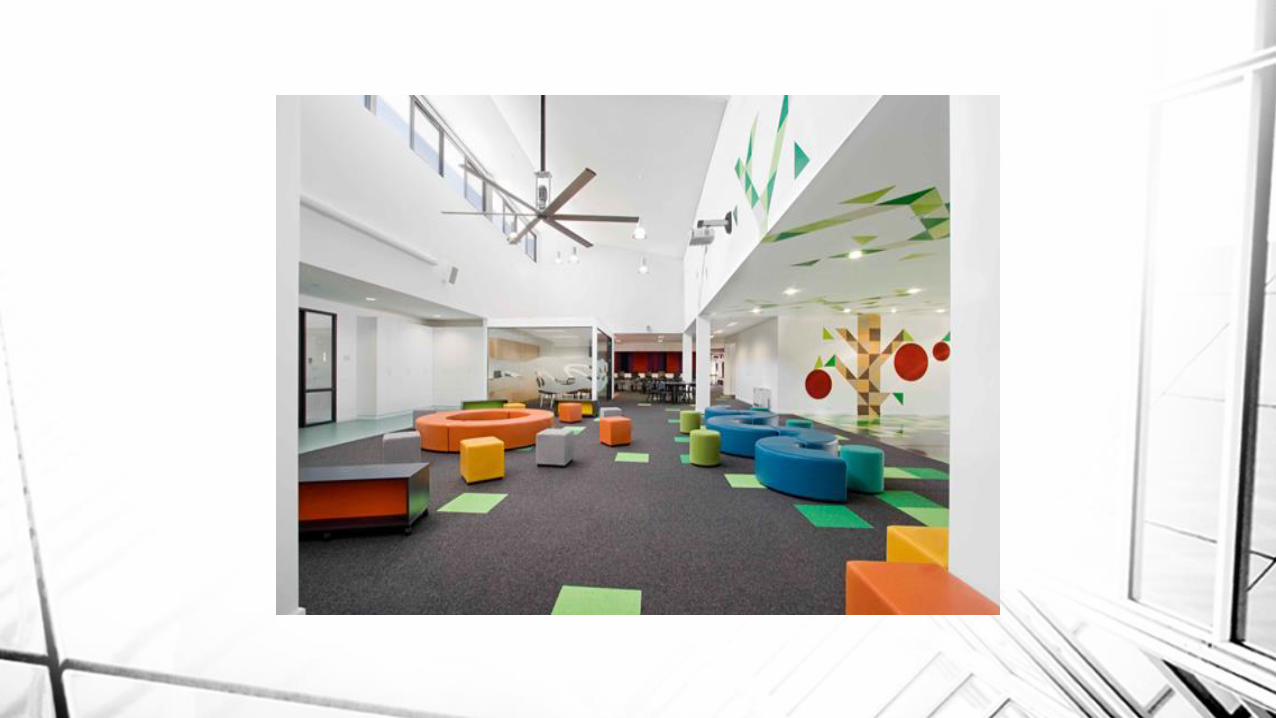
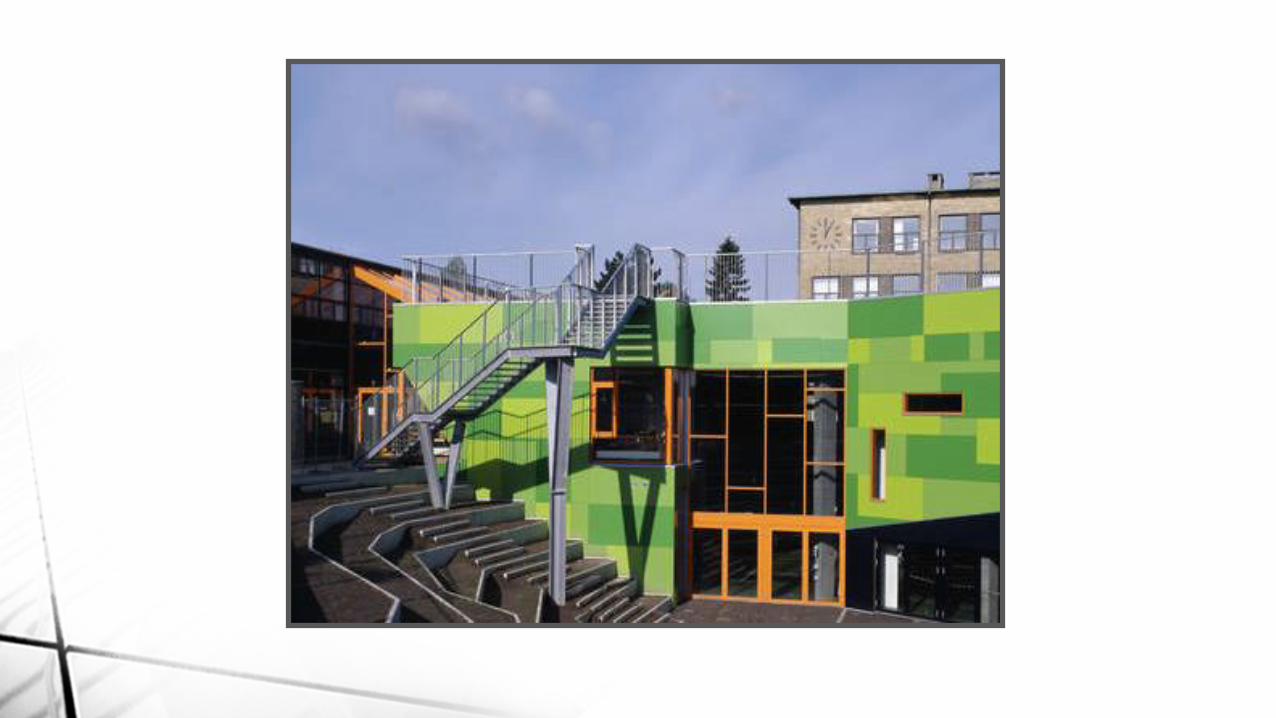
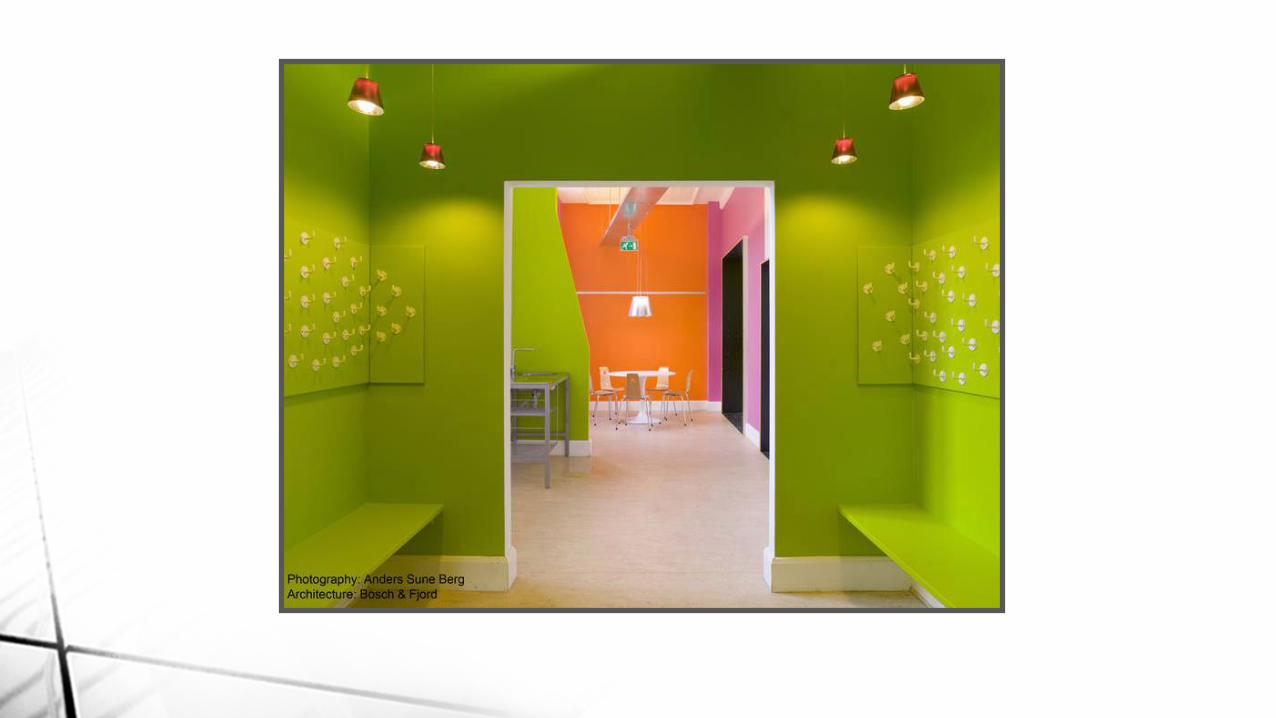
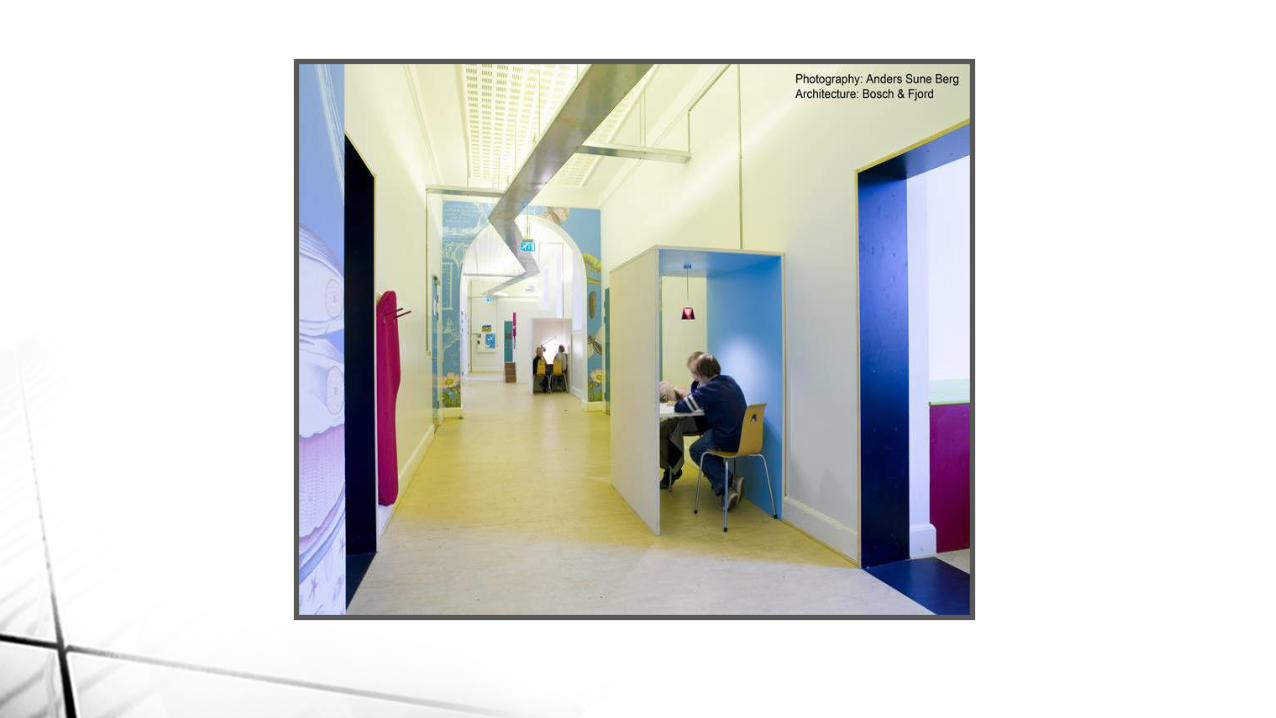
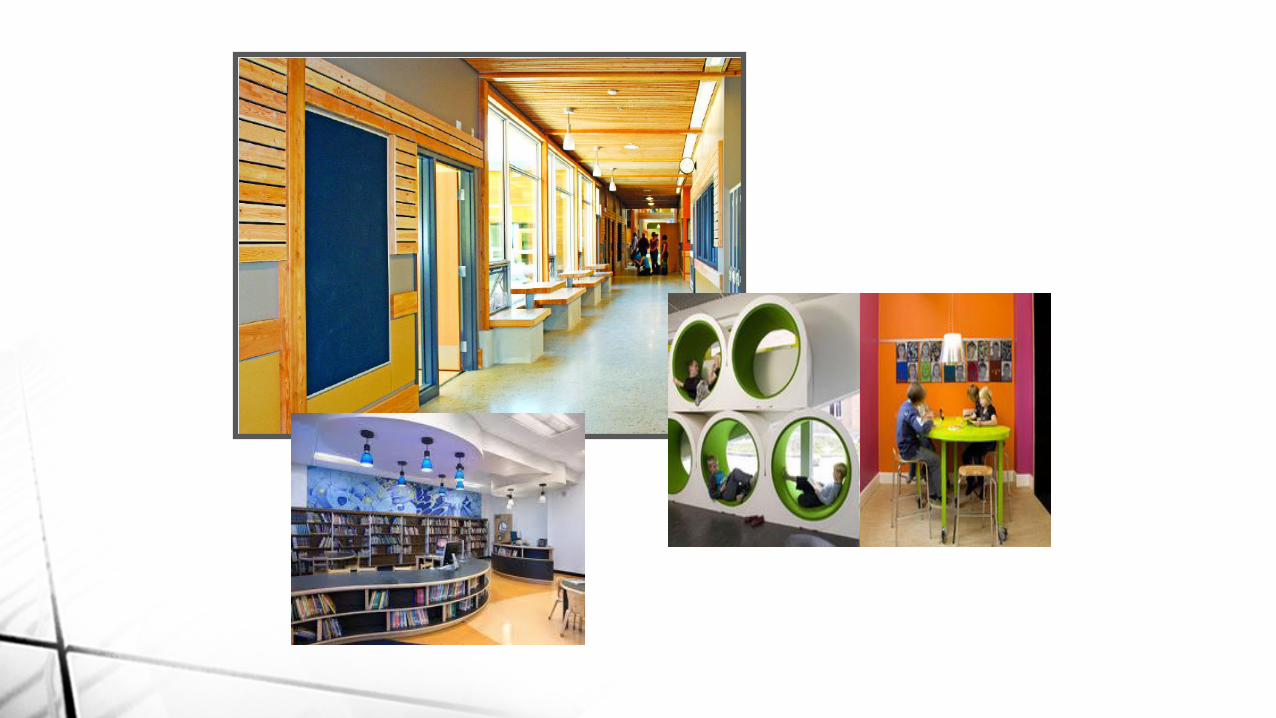
Some images and information to
inspire…
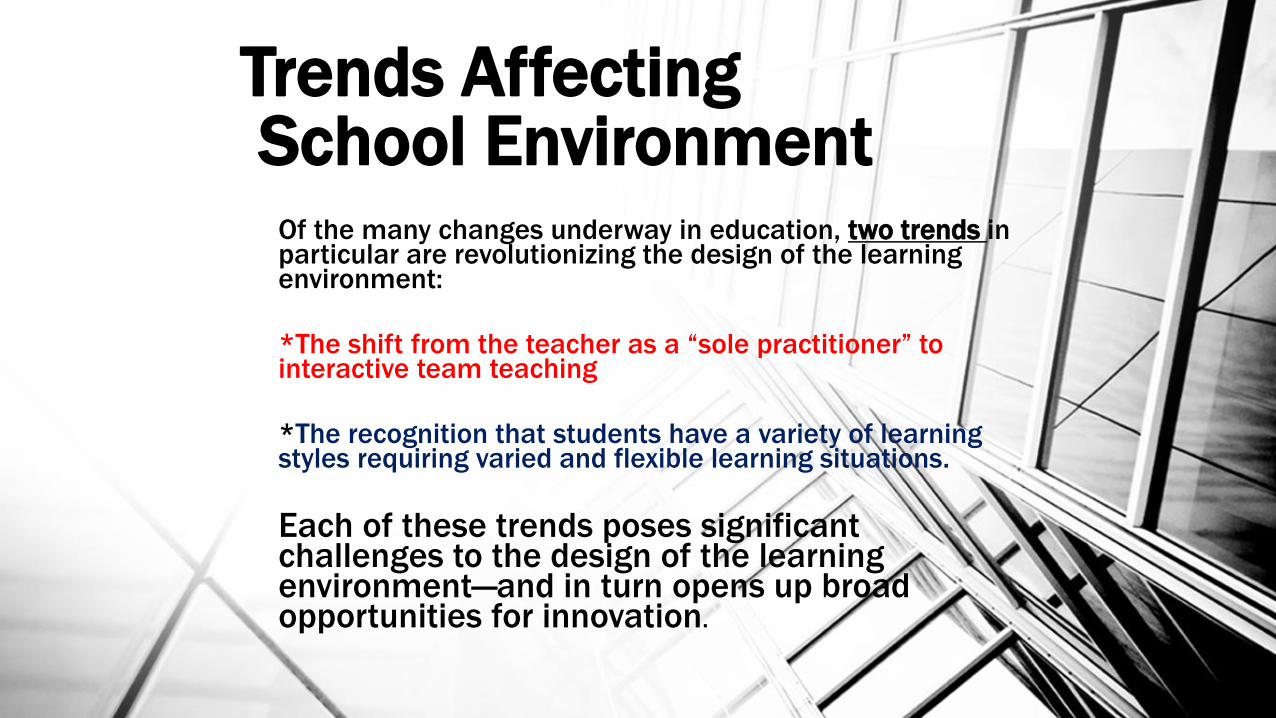
Trends AffectingSchool Environment
Of the many changes underway in education, two trends in particular are revolutionizing the design of the learning environment:
*The shift from the teacher as a “sole practitioner” to interactive team teaching
*The recognition that students have a variety of learning styles requiring varied and flexible learning situations.
Each of these trends poses significant challenges to the design of the learning environment—and in turn opens up broad opportunities for innovation.
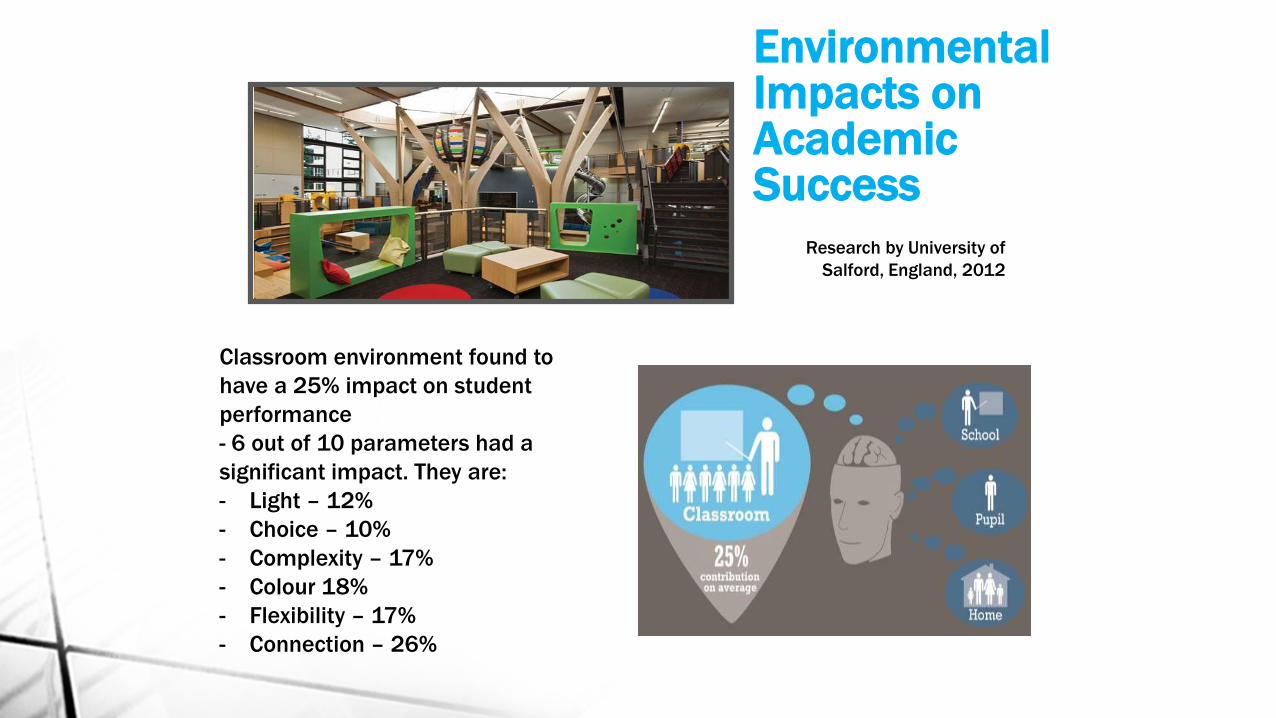
Environmental Impacts on Academic Success
Classroom environment found to
have a 25% impact on student
performance
- 6 out of 10 parameters had a
significant impact. They are:
- Light – 12%
- Choice – 10%
- Complexity – 17%
- Colour 18%
- Flexibility – 17%
- Connection – 26%
Research by University of
Salford, England, 2012
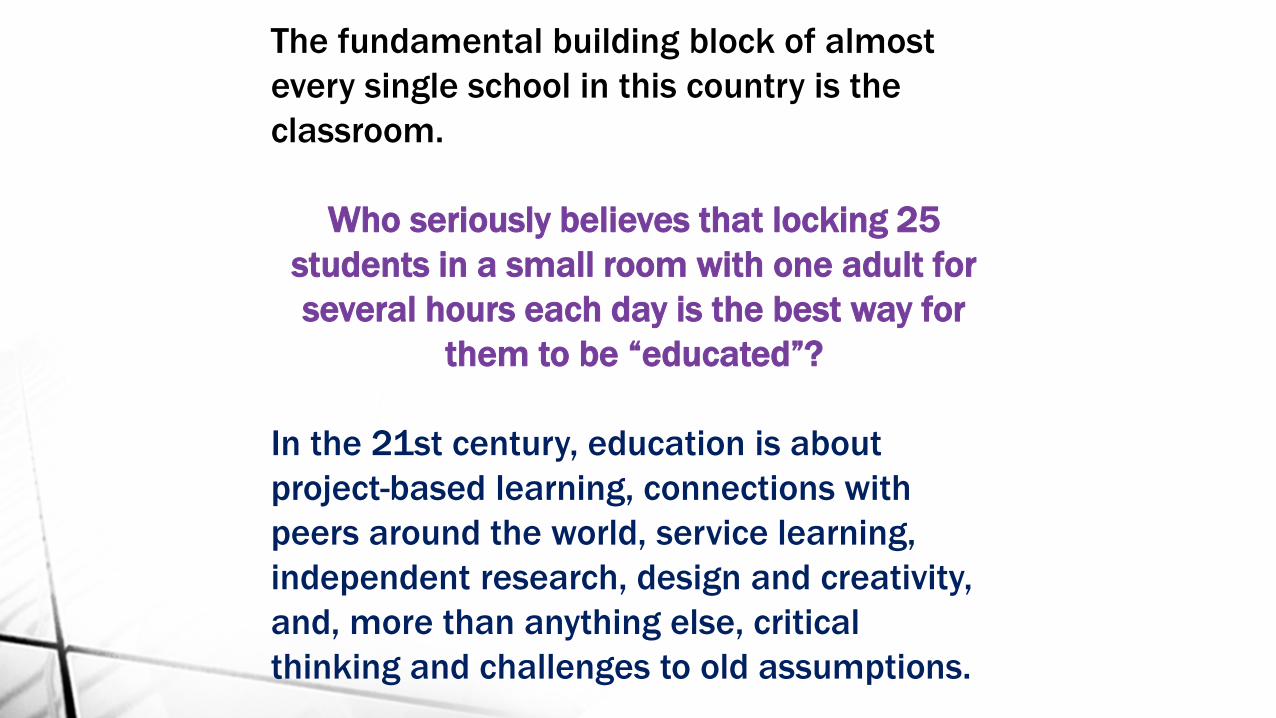
The fundamental building block of almost
every single school in this country is the
classroom.
Who seriously believes that locking 25
students in a small room with one adult for
several hours each day is the best way for
them to be “educated”?
In the 21st century, education is about
project-based learning, connections with
peers around the world, service learning,
independent research, design and creativity,
and, more than anything else, critical
thinking and challenges to old assumptions.
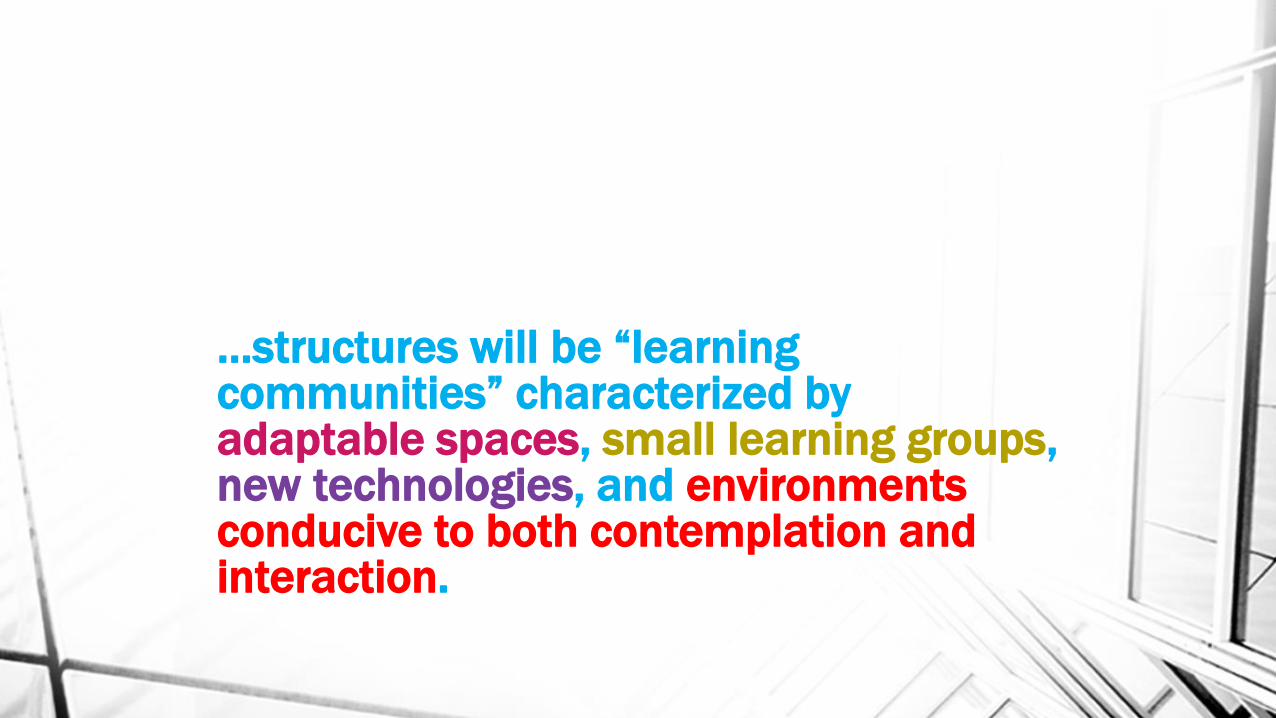
…structures will be “learning communities” characterized by adaptable spaces, small learning groups, new technologies, and environments conducive to both contemplation and interaction.
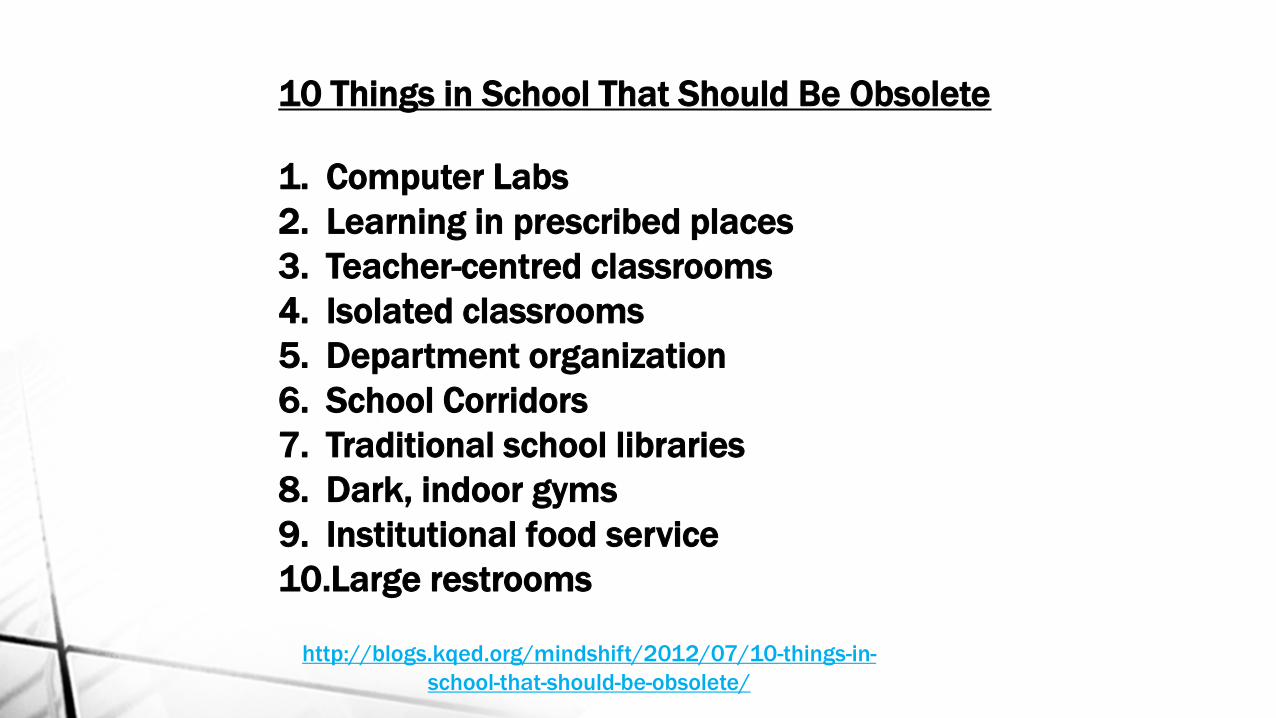
http://blogs.kqed.org/mindshift/2012/07/10-things-in-
school-that-should-be-obsolete/
10 Things in School That Should Be Obsolete
1. Computer Labs
2. Learning in prescribed places
3. Teacher-centred classrooms
4. Isolated classrooms
5. Department organization
6. School Corridors
7. Traditional school libraries
8. Dark, indoor gyms
9. Institutional food service
10.Large restrooms
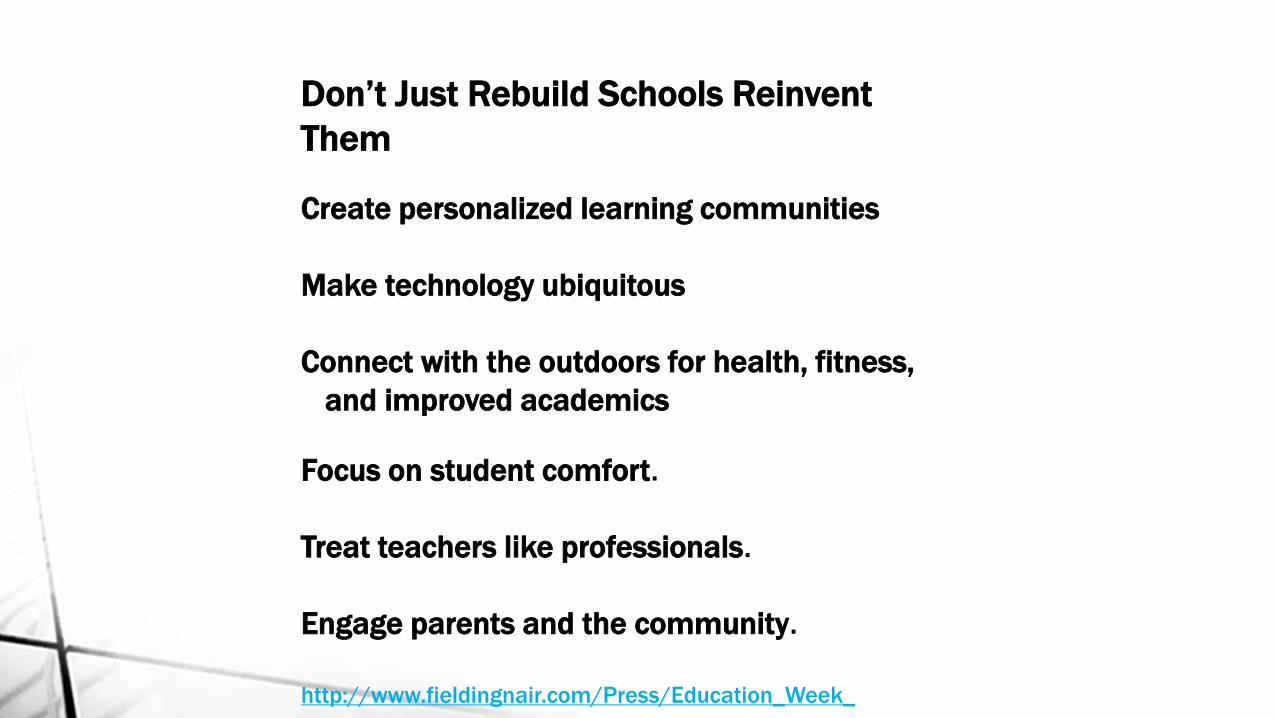
Don’t Just Rebuild Schools Reinvent
Them
Create personalized learning communities
Make technology ubiquitous
Connect with the outdoors for health, fitness,
and improved academics
Focus on student comfort.
Treat teachers like professionals.
Engage parents and the community.
http://www.fieldingnair.com/Press/Education_Week_
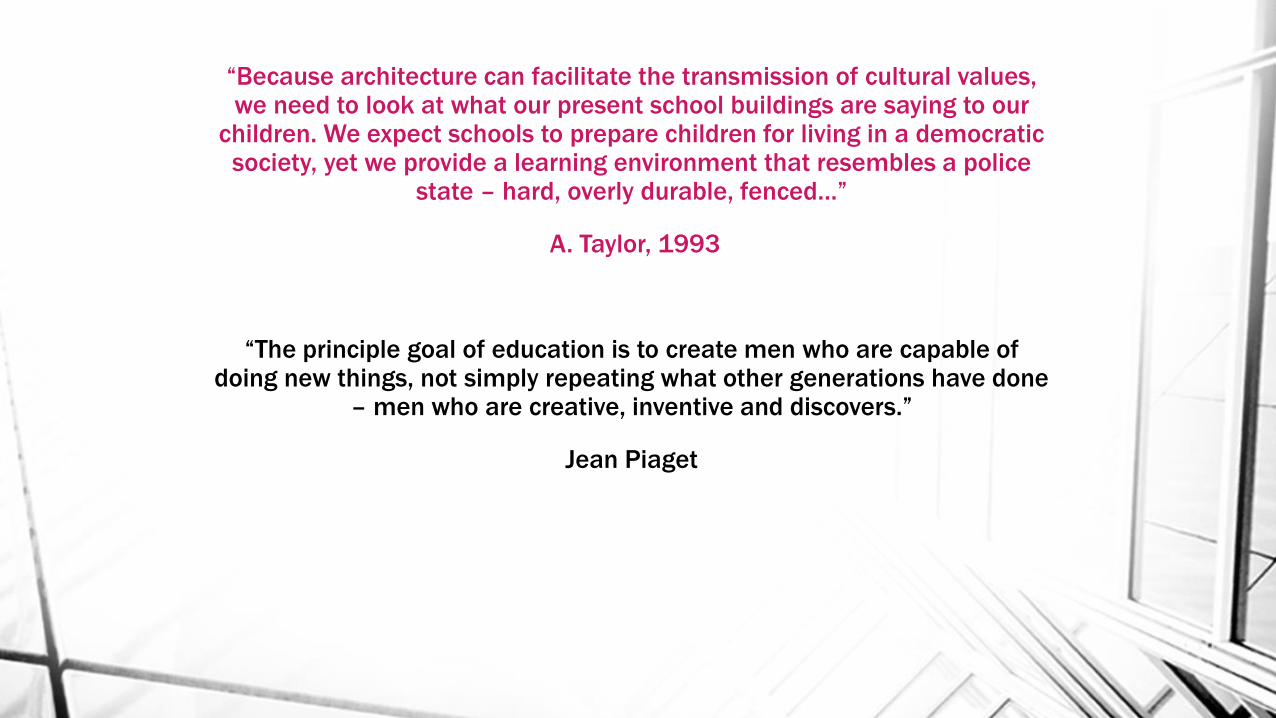
“Because architecture can facilitate the transmission of cultural values, we need to look at what our present school buildings are saying to our
children. We expect schools to prepare children for living in a democratic society, yet we provide a learning environment that resembles a police
state – hard, overly durable, fenced…”
A. Taylor, 1993
“The principle goal of education is to create men who are capable of doing new things, not simply repeating what other generations have done
– men who are creative, inventive and discovers.”
Jean Piaget
Key Stages
Implementation
Feedback
Evaluate
Adjust
Acting
Decision Making
Phasing
Flexibility
Planning
Data
Scenarios
Learning Impact
Business Case
Analyzing
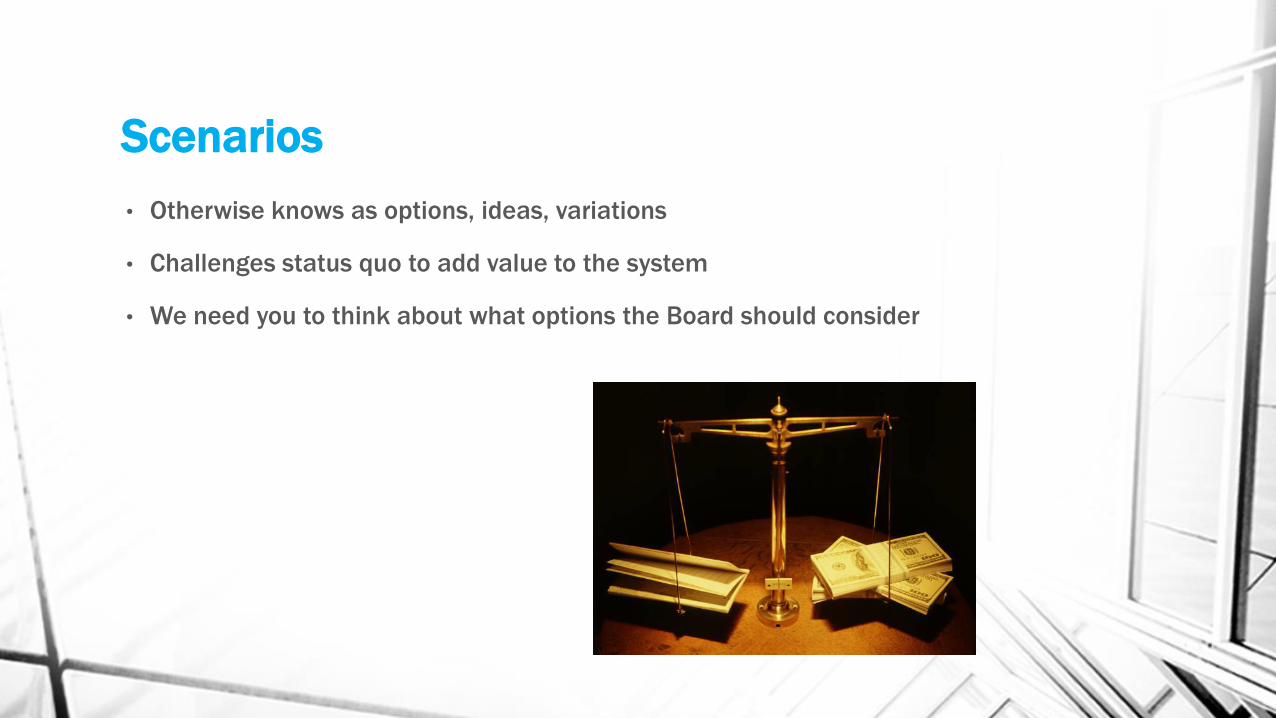
Scenarios
• Otherwise knows as options, ideas, variations
• Challenges status quo to add value to the system
• We need you to think about what options the Board should consider
Scenarios
Re-Configuration
• Addresses areas of growth pressure (Winlaw/Blewett)
• May not involve closure
• May better meet learner needs
• If no closure, may or may not save money to add value to student learning
Closure – School or Space
• Involves closure of a building or space within a building
• Saves money (staffing, utilities, deferred maintenance costs) to add value to learning environment and direct service to students
• Unloads future liability by unloading capital costs
Scorecard
• Way by which to measure one scenario against another
• Business case approach, not merely cost driven
• Long term view
• Linked to student expectations and goals
• Optimizes asset use
• Organizational performance
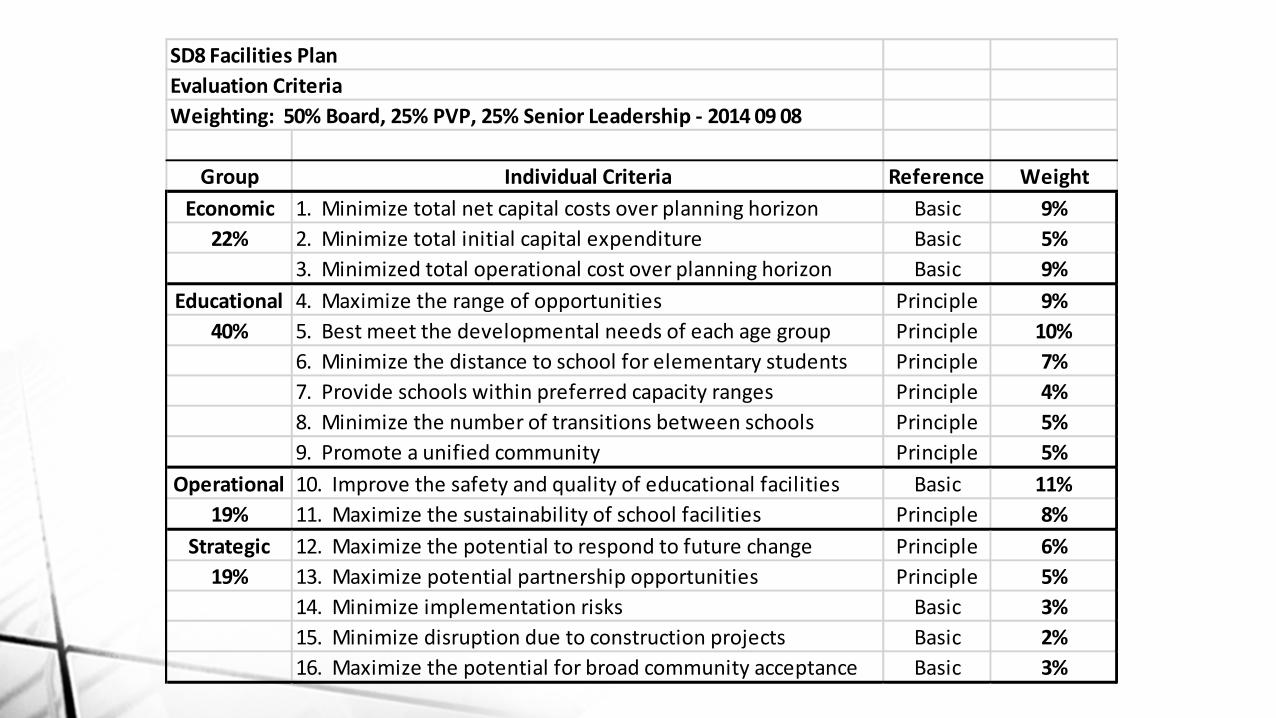
SD8 Facilities Plan
Evaluation Criteria
Weighting: 50% Board, 25% PVP, 25% Senior Leadership - 2014 09 08
Group Individual Criteria Reference Weight
Economic 1. Minimize total net capital costs over planning horizon Basic 9%
22% 2. Minimize total initial capital expenditure Basic 5%
3. Minimized total operational cost over planning horizon Basic 9%
Educational 4. Maximize the range of opportunities Principle 9%
40% 5. Best meet the developmental needs of each age group Principle 10%
6. Minimize the distance to school for elementary students Principle 7%
7. Provide schools within preferred capacity ranges Principle 4%
8. Minimize the number of transitions between schools Principle 5%
9. Promote a unified community Principle 5%
Operational 10. Improve the safety and quality of educational facilities Basic 11%
19% 11. Maximize the sustainability of school facilities Principle 8%
Strategic 12. Maximize the potential to respond to future change Principle 6%
19% 13. Maximize potential partnership opportunities Principle 5%
14. Minimize implementation risks Basic 3%
15. Minimize disruption due to construction projects Basic 2%
16. Maximize the potential for broad community acceptance Basic 3%
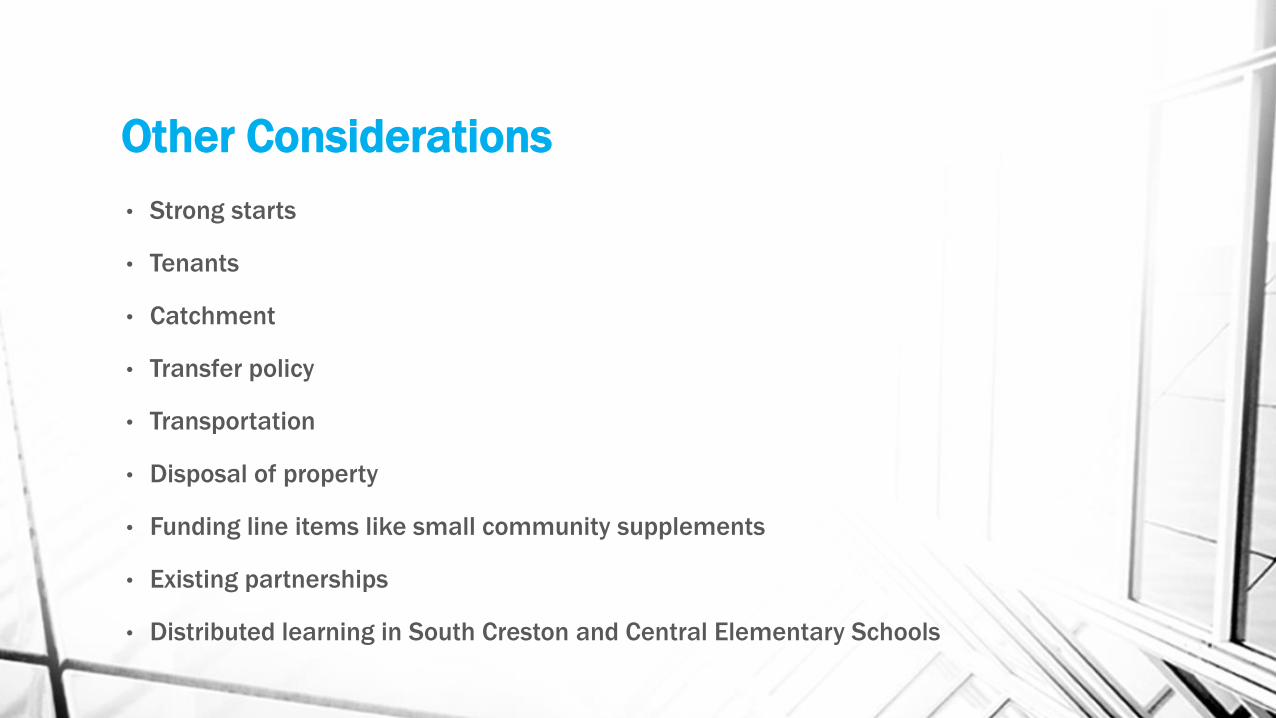
Other Considerations
• Strong starts
• Tenants
• Catchment
• Transfer policy
• Transportation
• Disposal of property
• Funding line items like small community supplements
• Existing partnerships
• Distributed learning in South Creston and Central Elementary Schools

Next Steps
• Give us feedback on the data – is there more you need to know?
• Give us your ideas for scenarios by January 5, 2015
• How to submit?
• Email [email protected]
• Fax 250-352-6686
• Mail 570 Johnstone Road, Nelson BC, V1L 6J2

Thank you!