Embed Size (px)
Citation preview
LONG LIVE THE HUMBLE HANDPUMP Richard C Carter International Association of Hydrogeologists Rome Congress September 2015
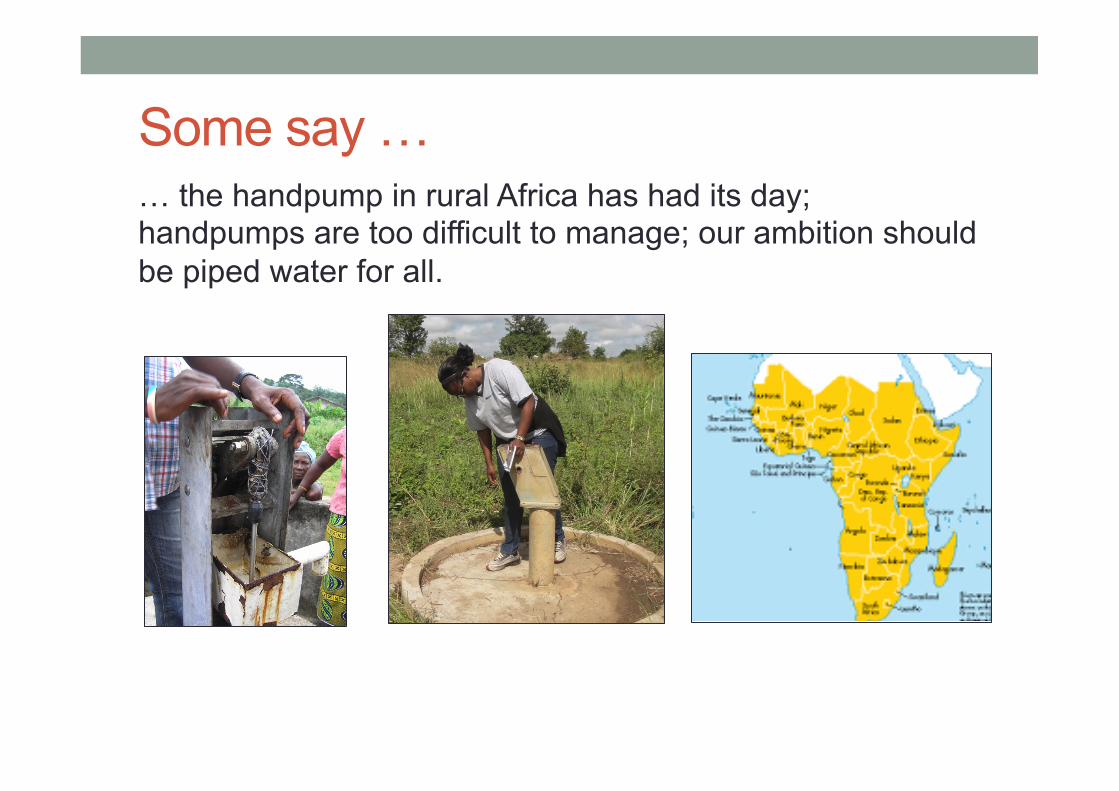
Some say … … the handpump in rural Africa has had its day; handpumps are too difficult to manage; our ambition should be piped water for all.
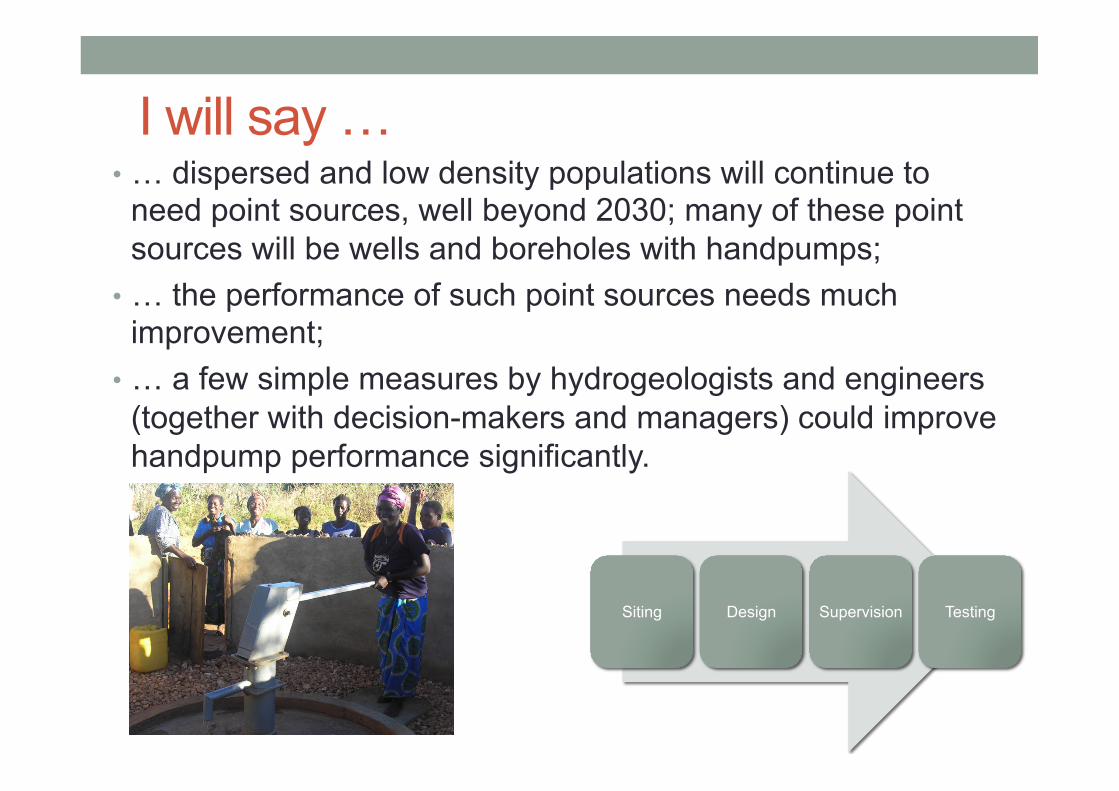
I will say … • … dispersed and low density populations will continue to
need point sources, well beyond 2030; many of these point sources will be wells and boreholes with handpumps;
• … the performance of such point sources needs much improvement;
• … a few simple measures by hydrogeologists and engineers (together with decision-makers and managers) could improve handpump performance significantly.
Siting Design Supervision Testing
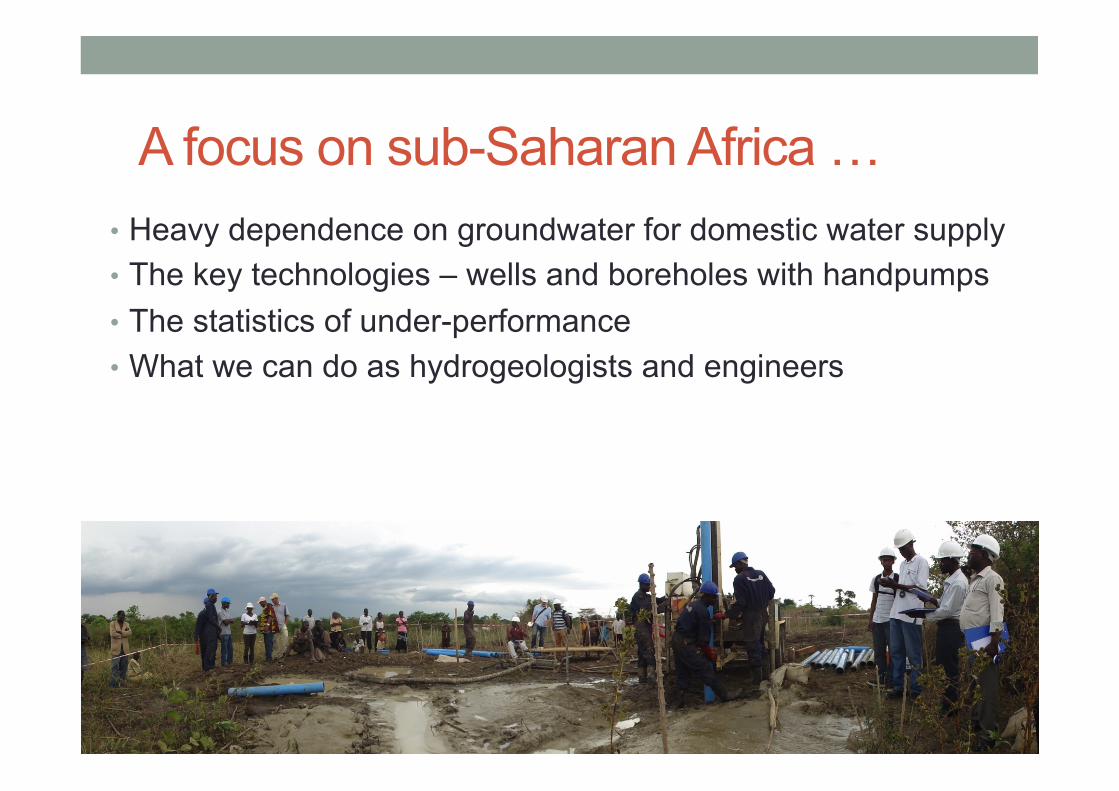
A focus on sub-Saharan Africa … • Heavy dependence on groundwater for domestic water supply • The key technologies – wells and boreholes with handpumps • The statistics of under-performance • What we can do as hydrogeologists and engineers
Graph 1a – groundwater dependence, SSA
0%
10%
20%
30%
40%
50%
60%
70%
80%
90%
100%
Ang
ola
Ben
in
Bot
swan
a B
urki
na F
aso
Bur
undi
C
amer
oon
Cap
e Ve
rde
CA
R
Cha
d C
omor
os
Con
go
Cot
e d'
Ivoi
re
DR
C
Djib
outi
Equ
ator
ial G
uine
a E
ritre
a E
thio
pia
Gab
on
Gam
bia
Gha
na
Gui
nea
Gui
nea-
Bis
sau
Ken
ya
Leso
tho
Libe
ria
Mad
agas
car
Mal
awi
Mal
i M
aurit
ania
M
aurit
ius
May
otte
M
ozam
biqu
e N
amib
ia
Nig
er
Nig
eria
R
euni
on
Rw
anda
S
ao T
ome
and
Prin
cipe
S
eneg
al
Sey
chel
les
Sie
rra
Leon
e S
omal
ia
Sou
th A
frica
S
udan
and
Sou
th S
udan
S
waz
iland
To
go
Uga
nda
UR
T W
este
rn S
ahar
a Za
mbi
a Zi
mba
bwe
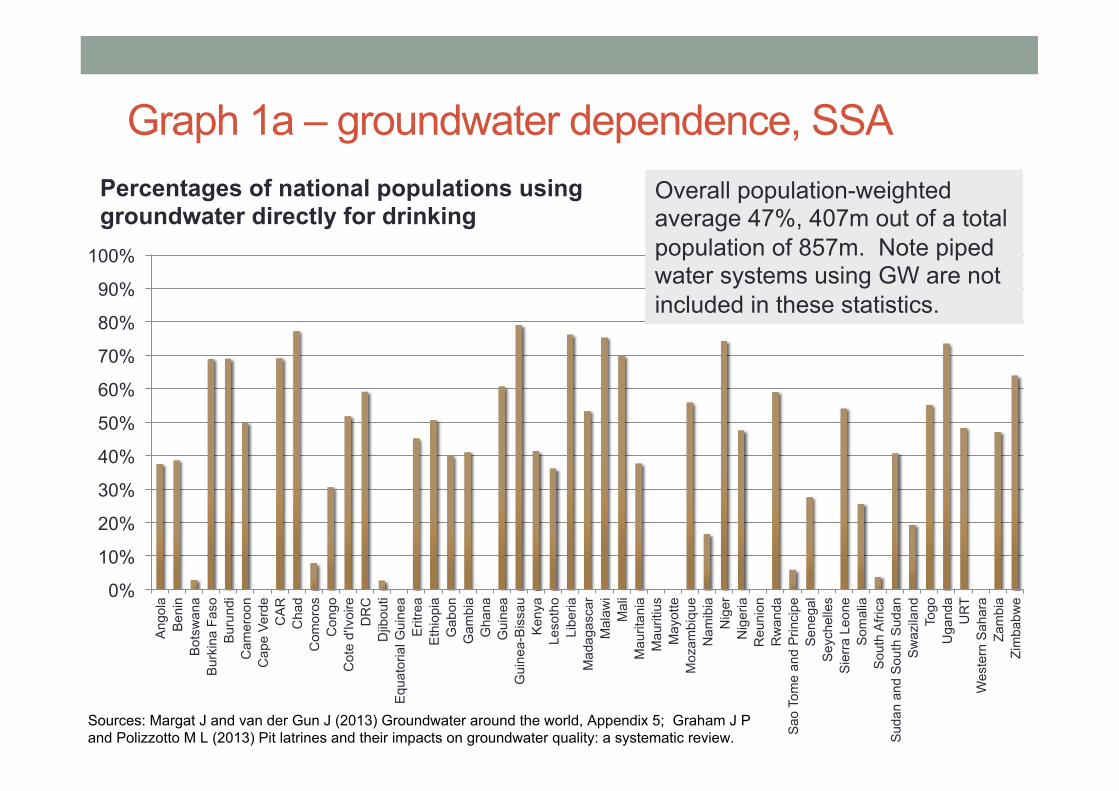
Percentages of national populations using groundwater directly for drinking
Sources: Margat J and van der Gun J (2013) Groundwater around the world, Appendix 5; Graham J P and Polizzotto M L (2013) Pit latrines and their impacts on groundwater quality: a systematic review.
Overall population-weighted average 47%, 407m out of a total population of 857m. Note piped water systems using GW are not included in these statistics.
47% of the population of the region use groundwater directly from springs, wells and boreholes, the vast majority of these using handpumps. An unknown additional number use groundwater supplied via piped systems. Overall it is likely that around two-thirds of the population of sub-Saharan Africa depend on groundwater.
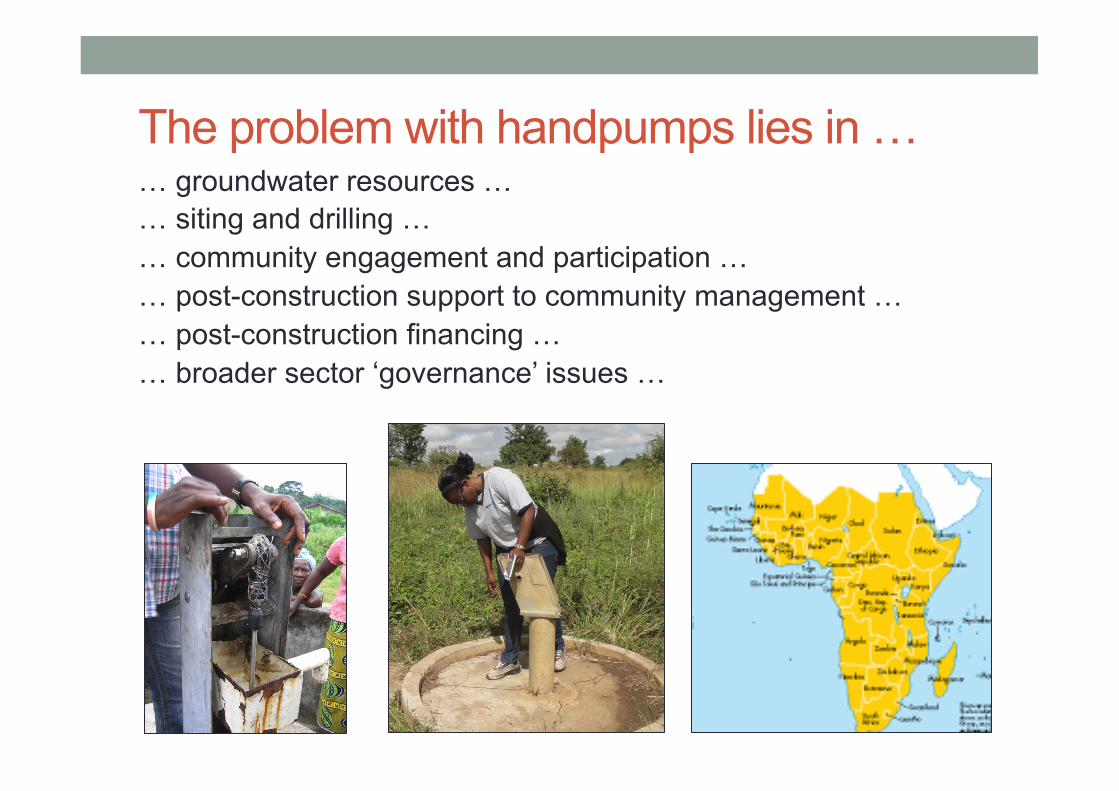
The problem with handpumps lies in … … groundwater resources … … siting and drilling … … community engagement and participation … … post-construction support to community management … … post-construction financing … … broader sector ‘governance’ issues …
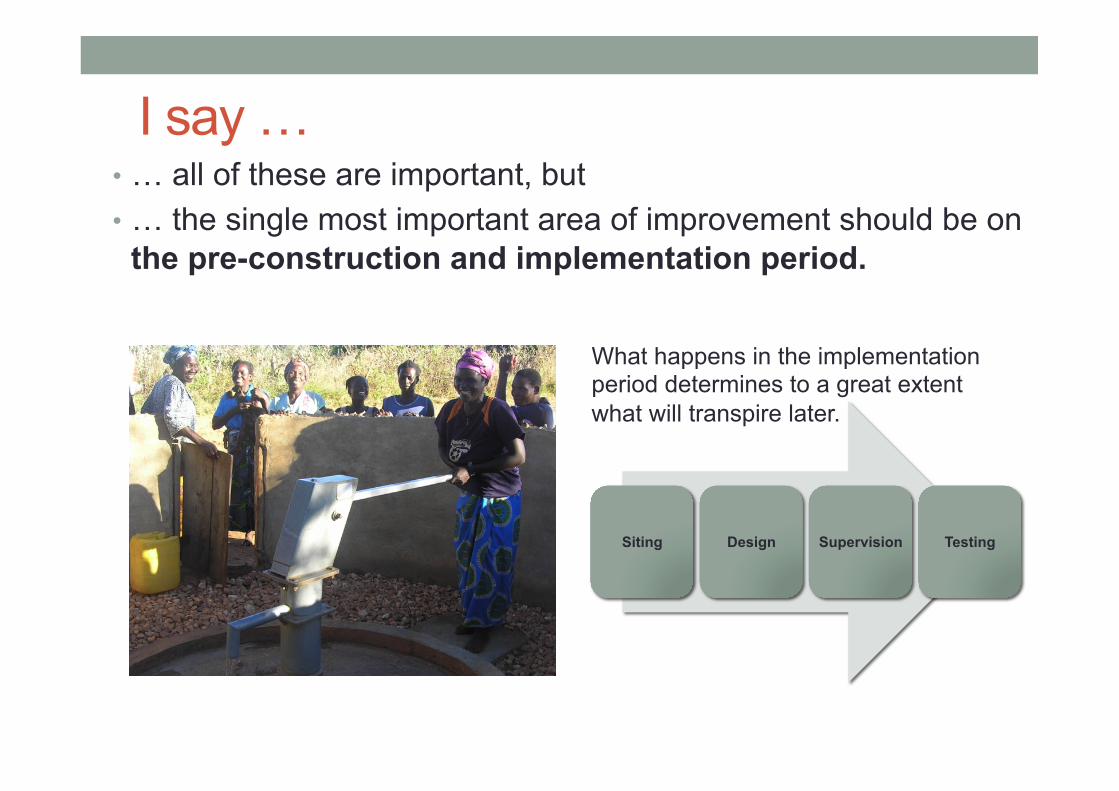
I say … • … all of these are important, but • … the single most important area of improvement should be on
the pre-construction and implementation period.
Siting Design Supervision Testing
What happens in the implementation period determines to a great extent what will transpire later.
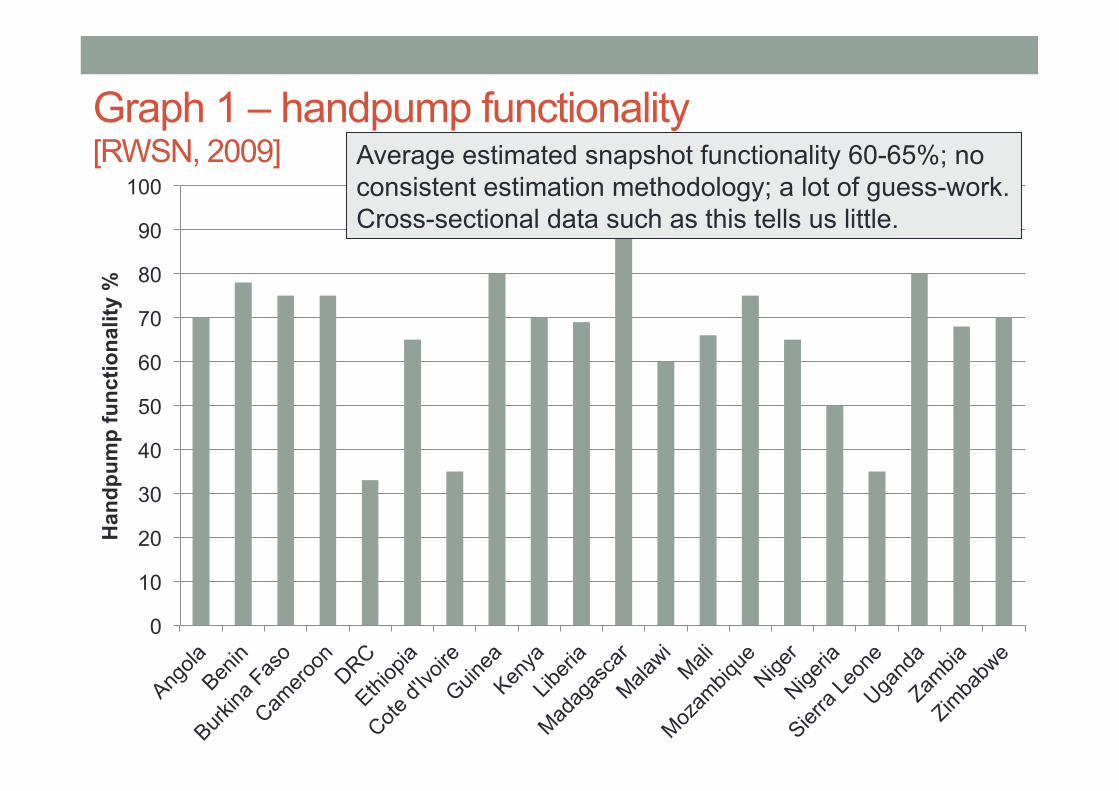
Graph 1 – handpump functionality [RWSN, 2009]
0
10
20
30
40
50
60
70
80
90
100
Han
dpum
p fu
nctio
nalit
y %
Average estimated snapshot functionality 60-65%; no consistent estimation methodology; a lot of guess-work. Cross-sectional data such as this tells us little.
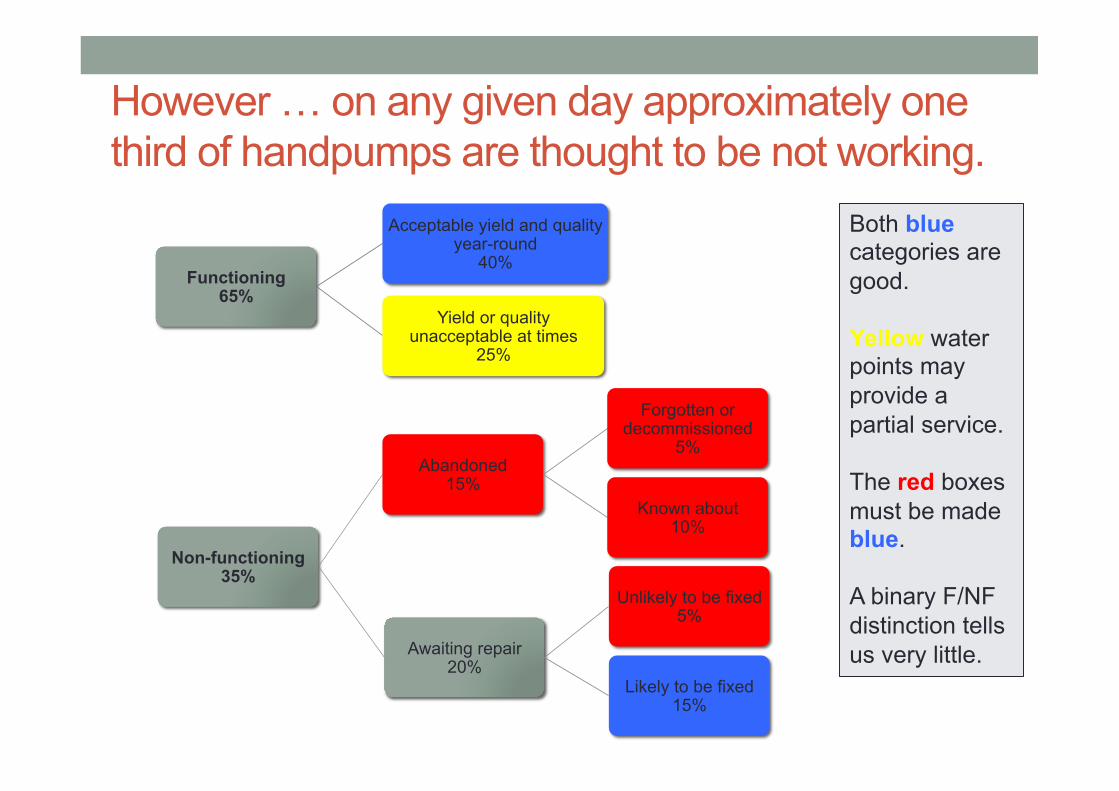
However … on any given day approximately one third of handpumps are thought to be not working.
Functioning 65%
Acceptable yield and quality year-round
40%
Yield or quality unacceptable at times
25%
Non-functioning 35%
Abandoned 15%
Forgotten or decommissioned
5%
Known about 10%
Awaiting repair 20%
Likely to be fixed 15%
Unlikely to be fixed 5%
Both blue categories are good. Yellow water points may provide a partial service. The red boxes must be made blue. A binary F/NF distinction tells us very little.
0
1,000
2,000
3,000
4,000
5,000
6,000
7,000
8,000
9,000
10,000
0%
10%
20%
30%
40%
50%
60%
70%
80%
90%
100%
1 2 3 4 5 6 7 8 9 10 11 12 13 14 15 16 17 18 19 20 21 22 23 24 25
Num
ber o
f wat
er p
oint
s ob
serv
ed o
f a g
iven
age
% o
f wat
er p
oint
s fu
nctio
nal a
t tim
e of
mon
itorin
g
Water point age (year of inspection minus year of construction)
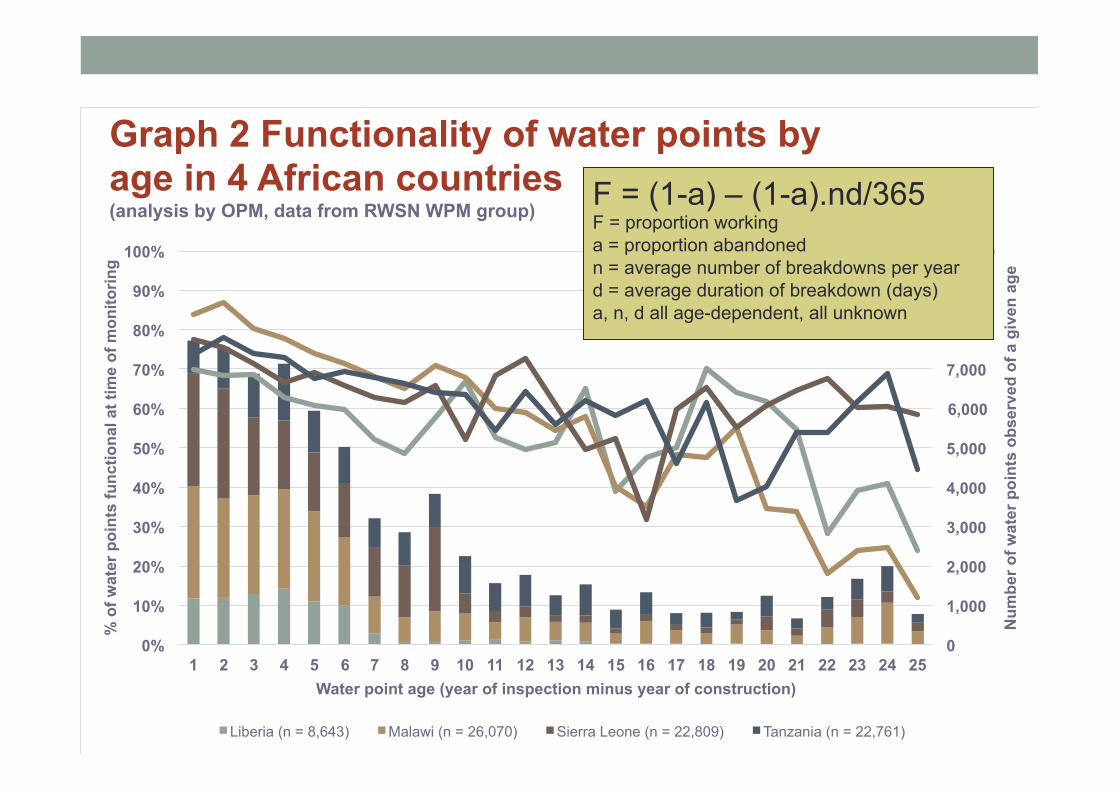
Graph 2 Functionality of water points by age in 4 African countries (analysis by OPM, data from RWSN WPM group)
Liberia (n = 8,643) Malawi (n = 26,070) Sierra Leone (n = 22,809) Tanzania (n = 22,761)
F = (1-a) – (1-a).nd/365 F = proportion working a = proportion abandoned n = average number of breakdowns per year d = average duration of breakdown (days) a, n, d all age-dependent, all unknown
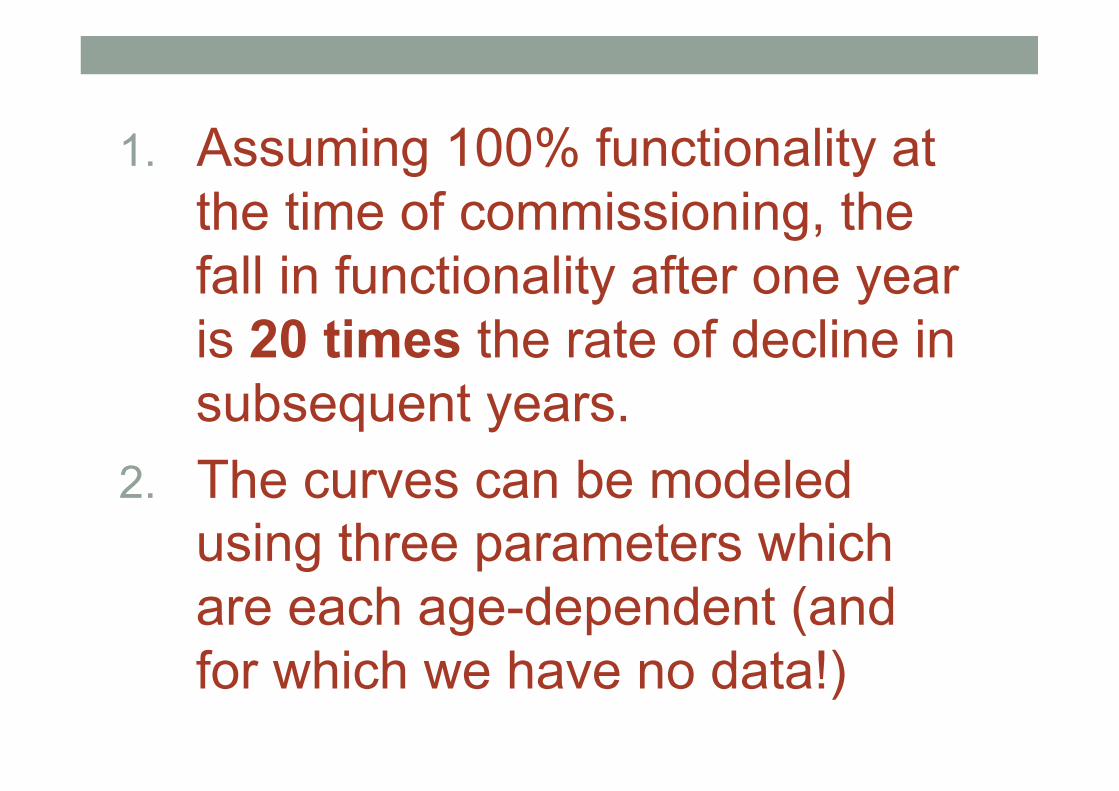
1. Assuming 100% functionality at the time of commissioning, the fall in functionality after one year is 20 times the rate of decline in subsequent years.
2. The curves can be modeled using three parameters which are each age-dependent (and for which we have no data!)
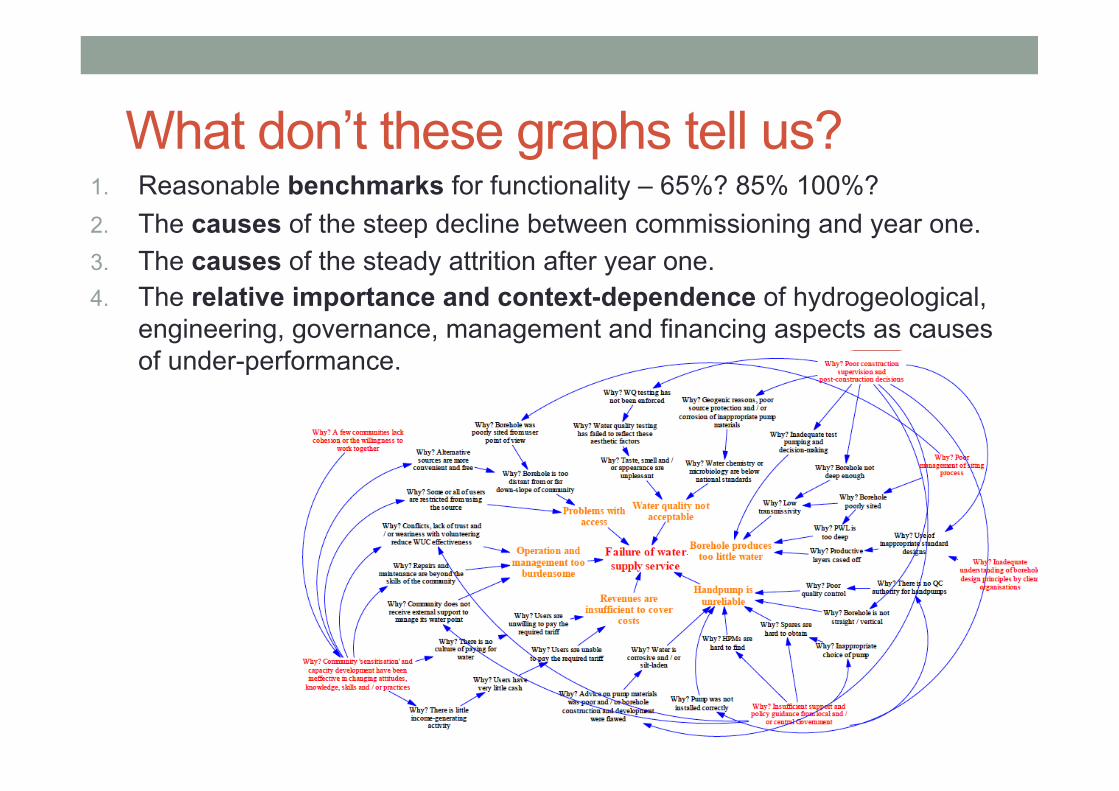
What don’t these graphs tell us? 1. Reasonable benchmarks for functionality – 65%? 85% 100%? 2. The causes of the steep decline between commissioning and year one. 3. The causes of the steady attrition after year one. 4. The relative importance and context-dependence of hydrogeological,
engineering, governance, management and financing aspects as causes of under-performance.
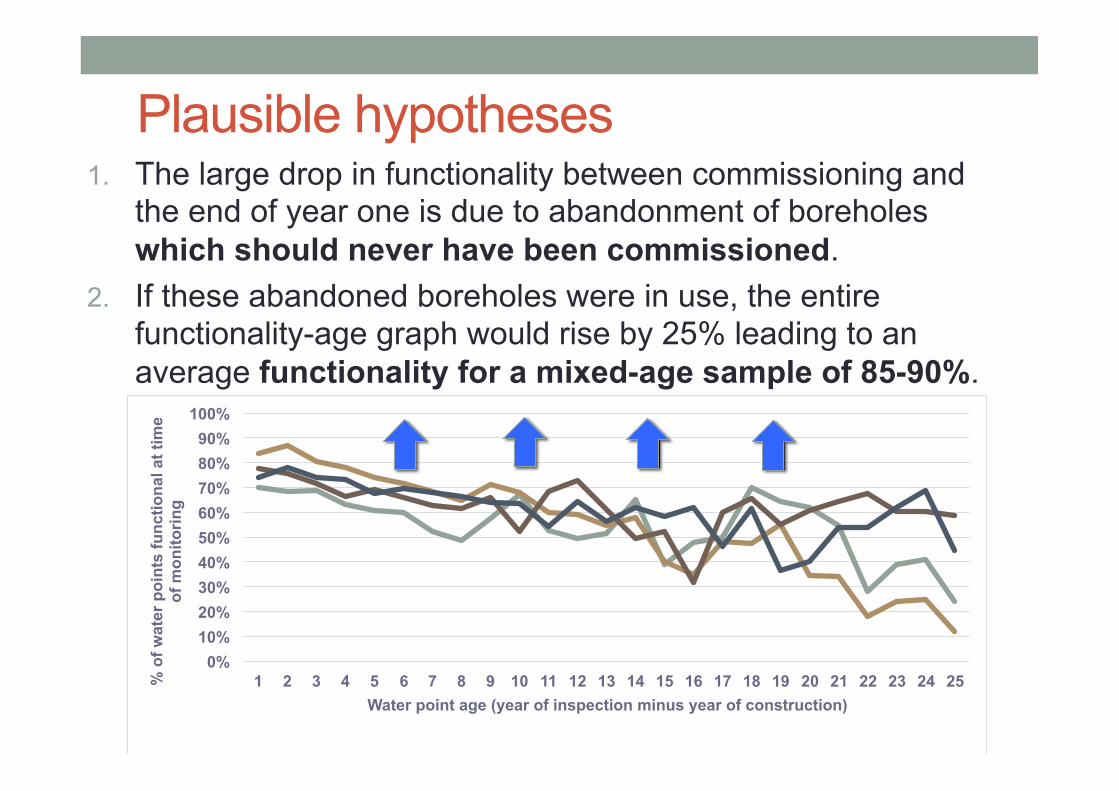
Plausible hypotheses 1. The large drop in functionality between commissioning and
the end of year one is due to abandonment of boreholes which should never have been commissioned.
2. If these abandoned boreholes were in use, the entire functionality-age graph would rise by 25% leading to an average functionality for a mixed-age sample of 85-90%.
0% 10% 20% 30% 40% 50% 60% 70% 80% 90%
100%
1 2 3 4 5 6 7 8 9 10 11 12 13 14 15 16 17 18 19 20 21 22 23 24 25 % o
f wat
er p
oint
s fu
nctio
nal a
t tim
e of
mon
itorin
g
Water point age (year of inspection minus year of construction)
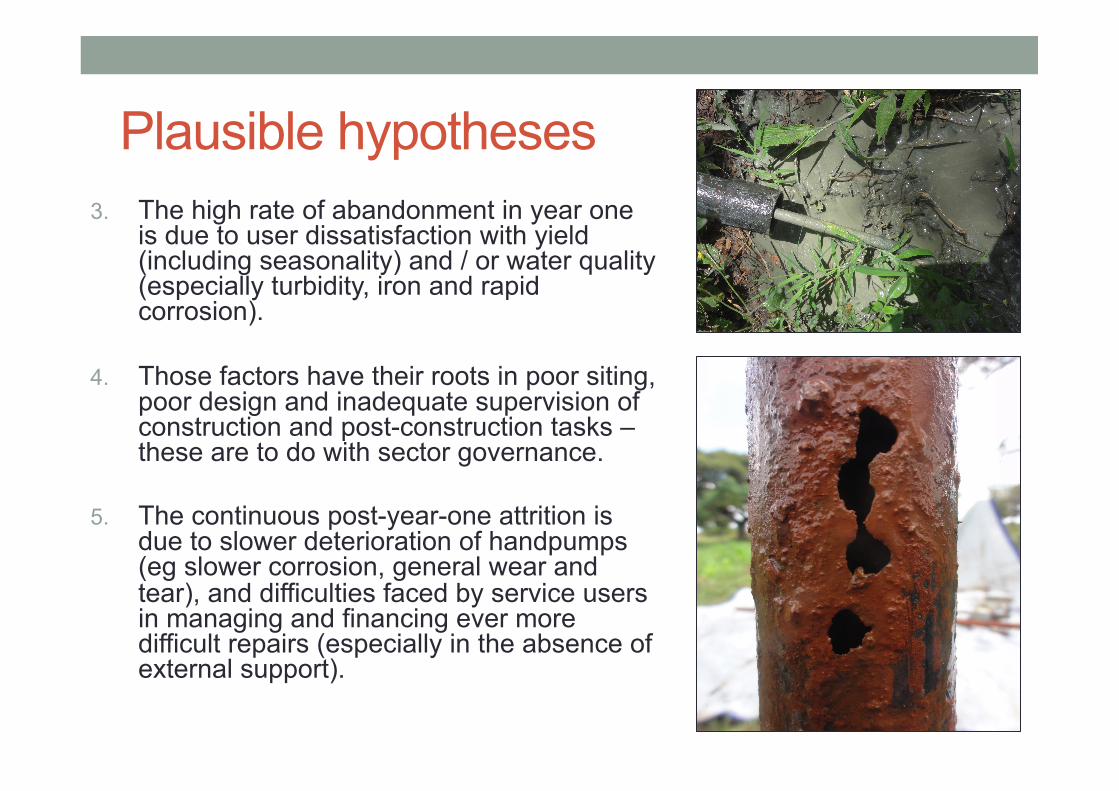
Plausible hypotheses 3. The high rate of abandonment in year one
is due to user dissatisfaction with yield (including seasonality) and / or water quality (especially turbidity, iron and rapid corrosion).
4. Those factors have their roots in poor siting, poor design and inadequate supervision of construction and post-construction tasks –these are to do with sector governance.
5. The continuous post-year-one attrition is due to slower deterioration of handpumps (eg slower corrosion, general wear and tear), and difficulties faced by service users in managing and financing ever more difficult repairs (especially in the absence of external support).
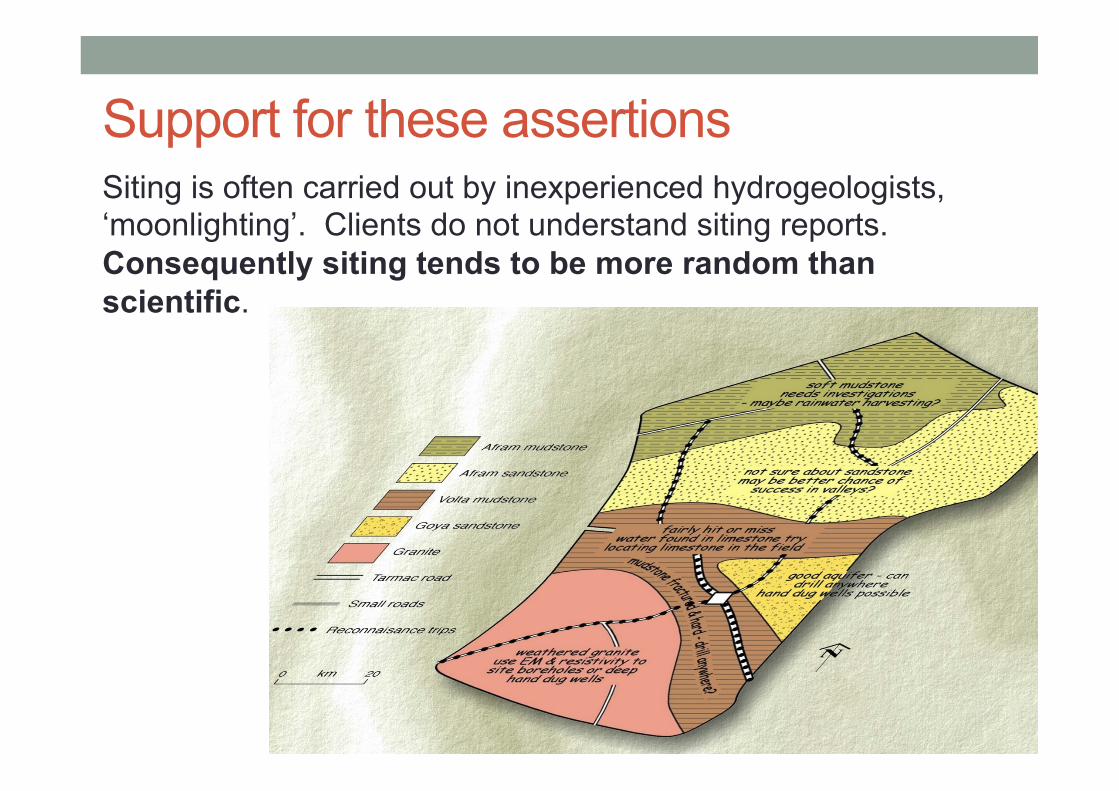
Support for these assertions Siting is often carried out by inexperienced hydrogeologists, ‘moonlighting’. Clients do not understand siting reports. Consequently siting tends to be more random than scientific.
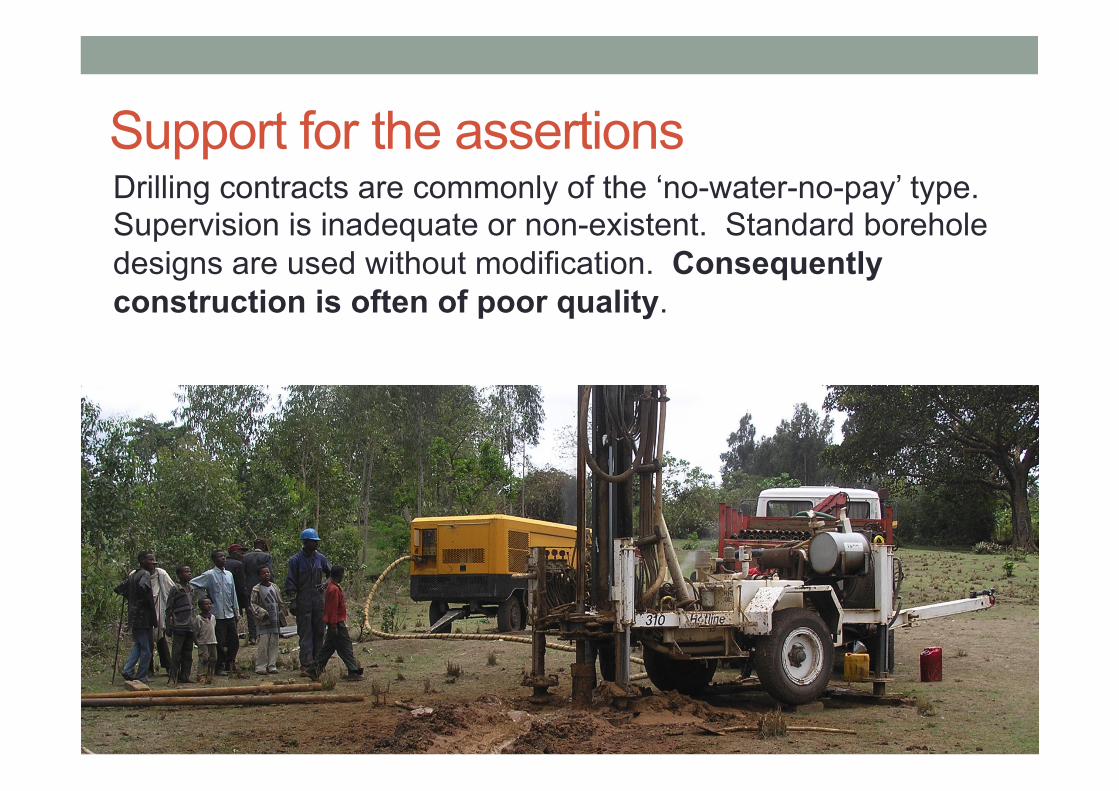
Support for the assertions Drilling contracts are commonly of the ‘no-water-no-pay’ type. Supervision is inadequate or non-existent. Standard borehole designs are used without modification. Consequently construction is often of poor quality.
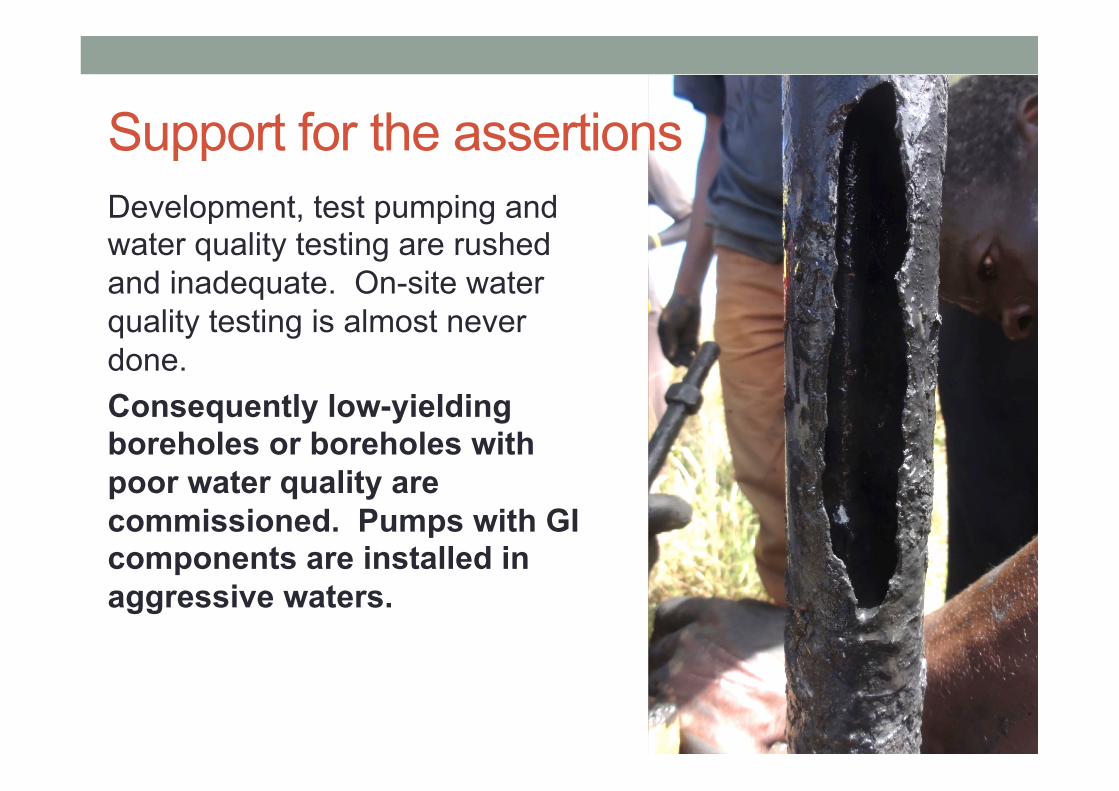
Development, test pumping and water quality testing are rushed and inadequate. On-site water quality testing is almost never done. Consequently low-yielding boreholes or boreholes with poor water quality are commissioned. Pumps with GI components are installed in aggressive waters.
Support for the assertions
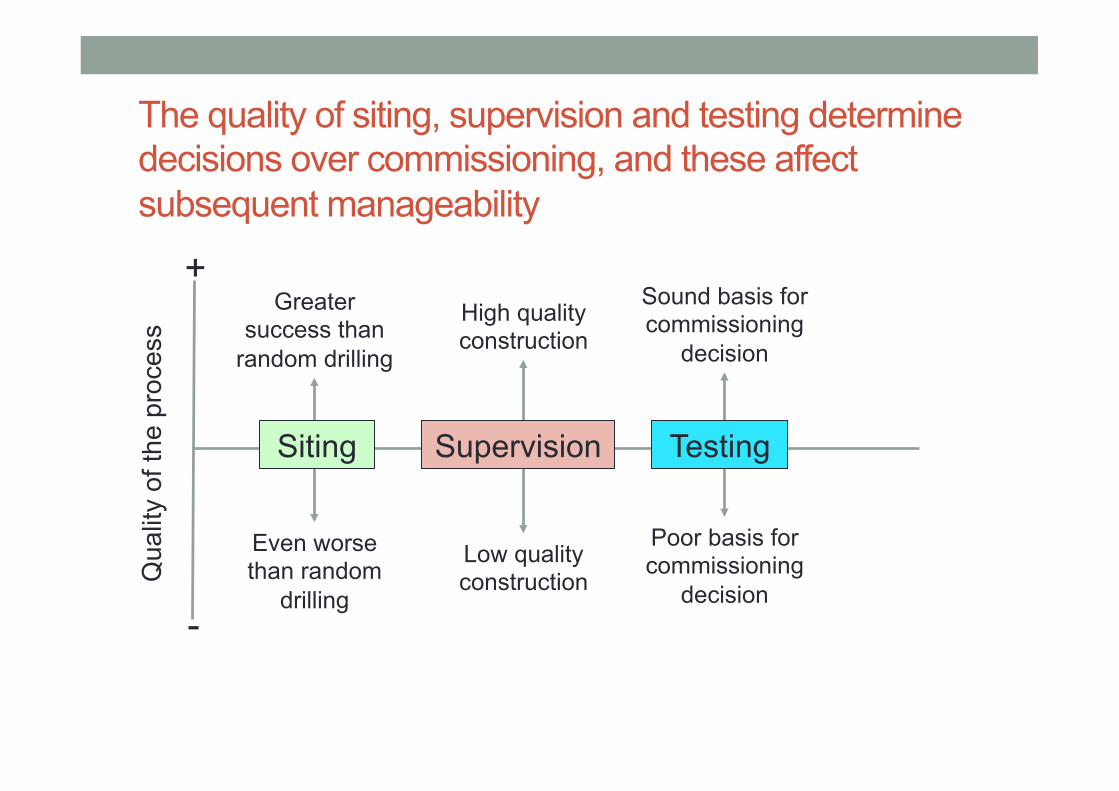
The quality of siting, supervision and testing determine decisions over commissioning, and these affect subsequent manageability
Sound basis for commissioning
decision
Poor basis for commissioning
decision
High quality construction
Low quality construction
Greater success than
random drilling
Even worse than random
drilling
Qua
lity
of th
e pr
oces
s
Siting
+
-
Testing Supervision
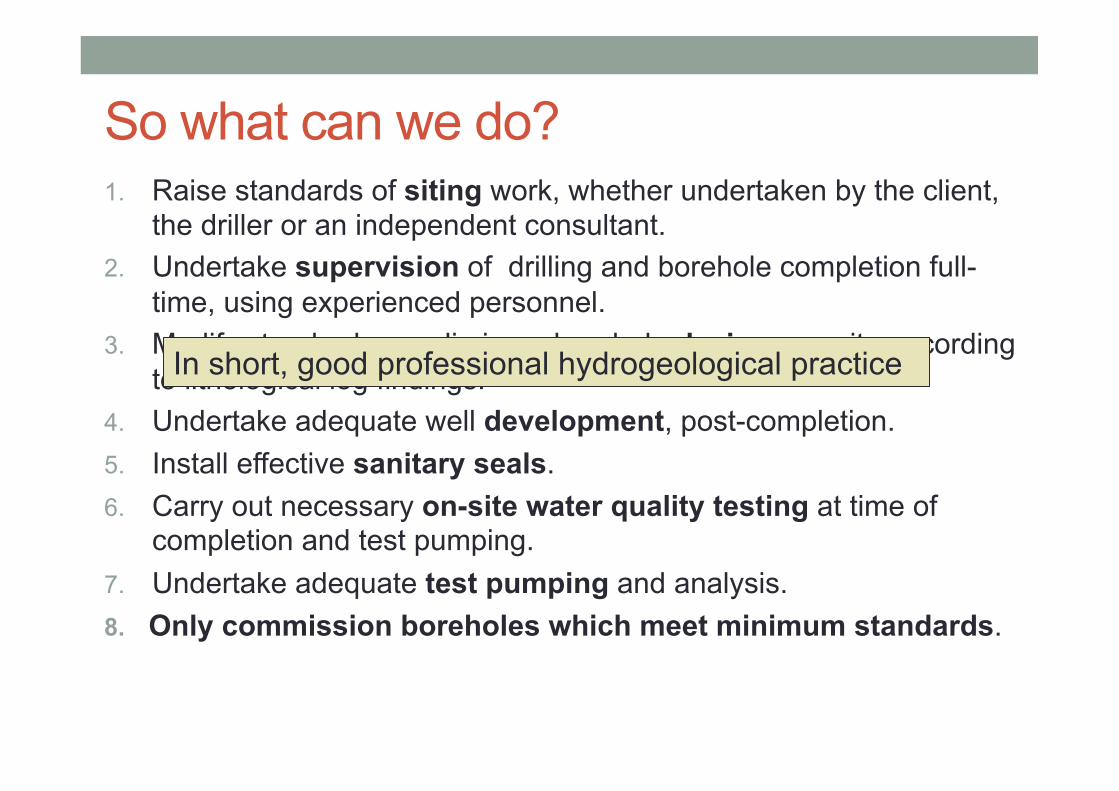
So what can we do? 1. Raise standards of siting work, whether undertaken by the client,
the driller or an independent consultant. 2. Undertake supervision of drilling and borehole completion full-
time, using experienced personnel. 3. Modify standard or preliminary borehole designs on site according
to lithological log findings. 4. Undertake adequate well development, post-completion. 5. Install effective sanitary seals. 6. Carry out necessary on-site water quality testing at time of
completion and test pumping. 7. Undertake adequate test pumping and analysis. 8. Only commission boreholes which meet minimum standards.
In short, good professional hydrogeological practice
Not rocket science, but a need for a step-change in hydrogeological practice in low-income countries
Thank you for listening. [email protected]

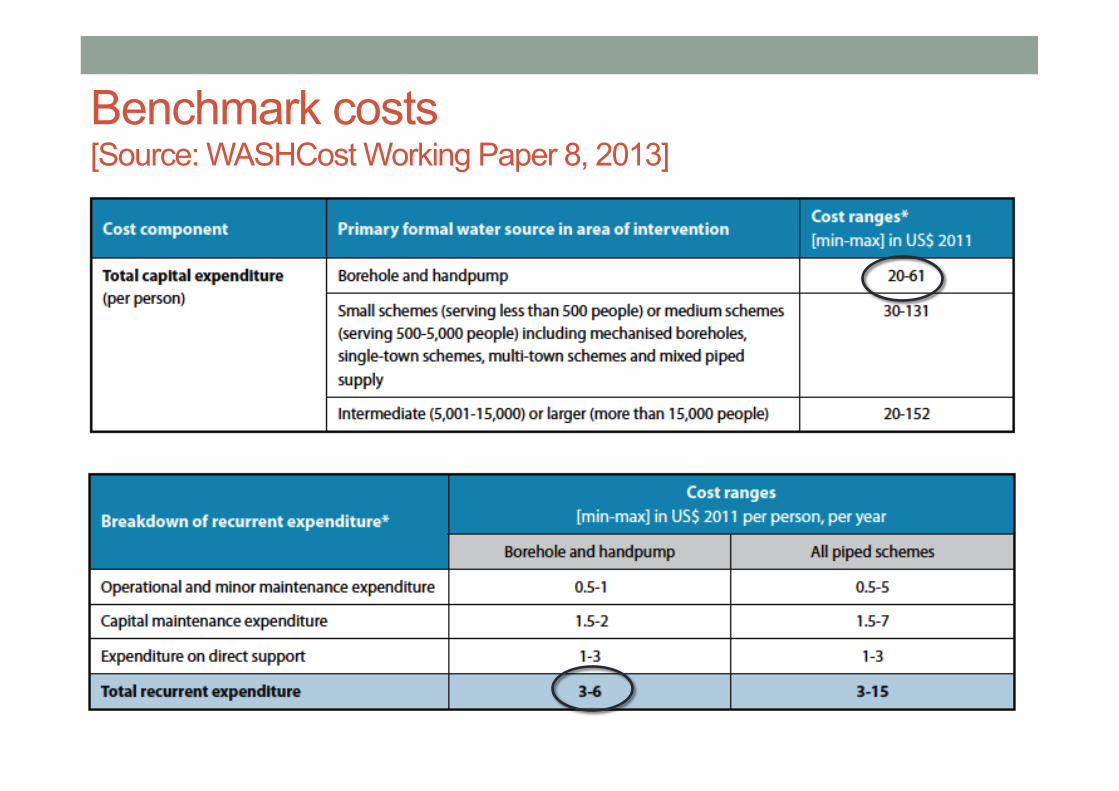
Benchmark costs [Source: WASHCost Working Paper 8, 2013]
In round figures, borehole and handpump capital cost is USD40 per person (say USD1.50 per person per year); recurrent costs are USD4.50 per person per year; total USD6.00