Embed Size (px)
Citation preview
Making Clean Local Energy Accessible Now 10June2016
Long Island Community Microgrid ProjectNew approach for grid design and operations
Craig Lewis Executive Director Clean Coalition 650-796-2353 mobile [email protected]
Making Clean Local Energy Accessible Now
2
Clean Coalition Mission
To accelerate the transition to renewable energy and a modern grid through
technical, policy, and project development expertise
Making Clean Local Energy Accessible Now
3
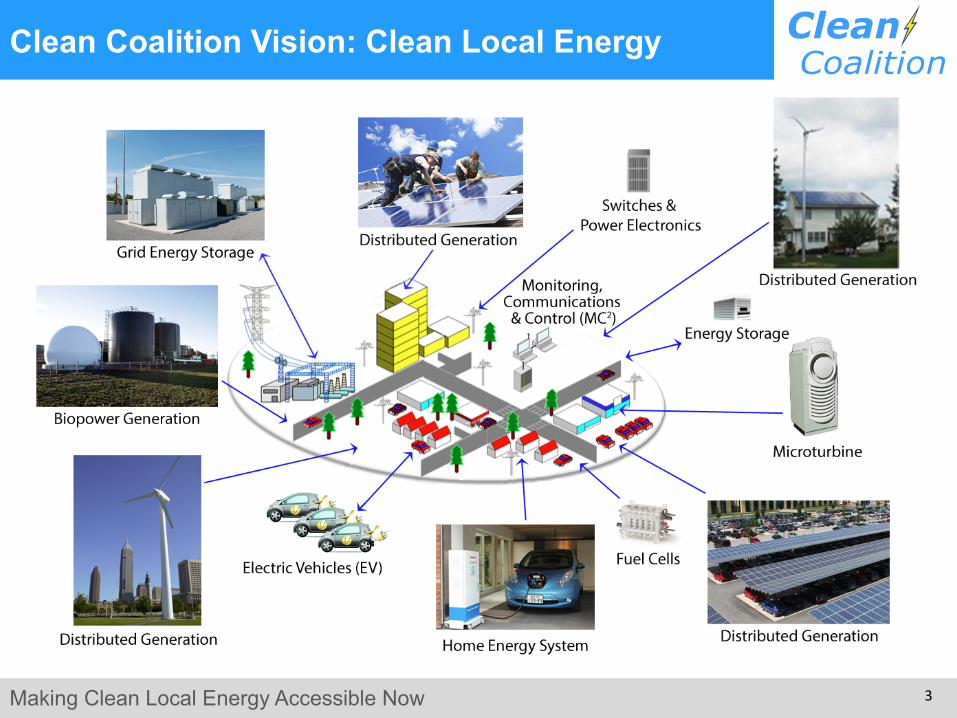
Clean Coalition Vision: Clean Local Energy
Making Clean Local Energy Accessible Now
4
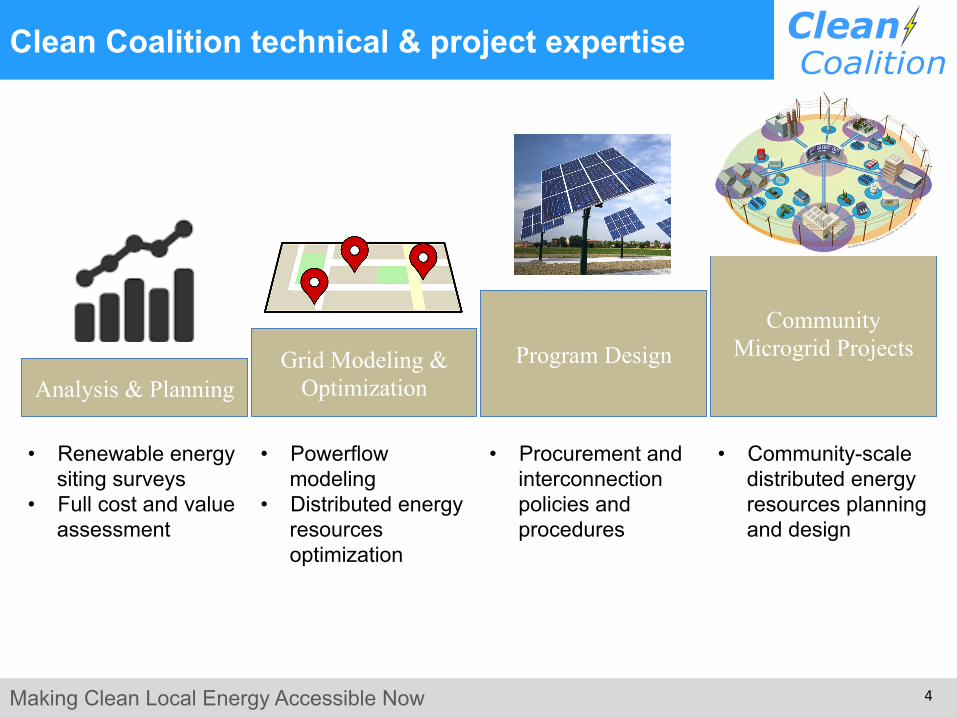
Clean Coalition technical & project expertise
• Powerflow modeling
• Distributed energy resources optimization
• Procurement and interconnection policies and procedures
• Community-scale distributed energy resources planning and design
Analysis & Planning Program Design
Community Microgrid Projects Grid Modeling &
Optimization
• Renewable energy siting surveys
• Full cost and value assessment
Making Clean Local Energy Accessible Now
5
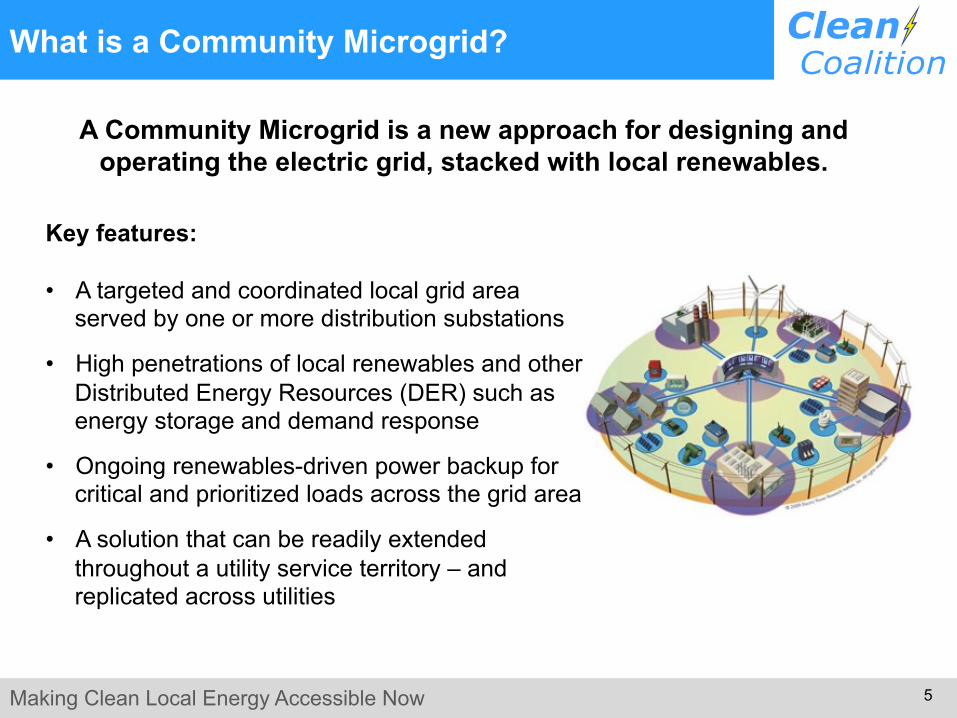
Key features:
• A targeted and coordinated local grid area served by one or more distribution substations
• High penetrations of local renewables and other Distributed Energy Resources (DER) such as energy storage and demand response
• Ongoing renewables-driven power backup for critical and prioritized loads across the grid area
• A solution that can be readily extended throughout a utility service territory – and replicated across utilities
What is a Community Microgrid?
A Community Microgrid is a new approach for designing and operating the electric grid, stacked with local renewables.
Making Clean Local Energy Accessible Now
6
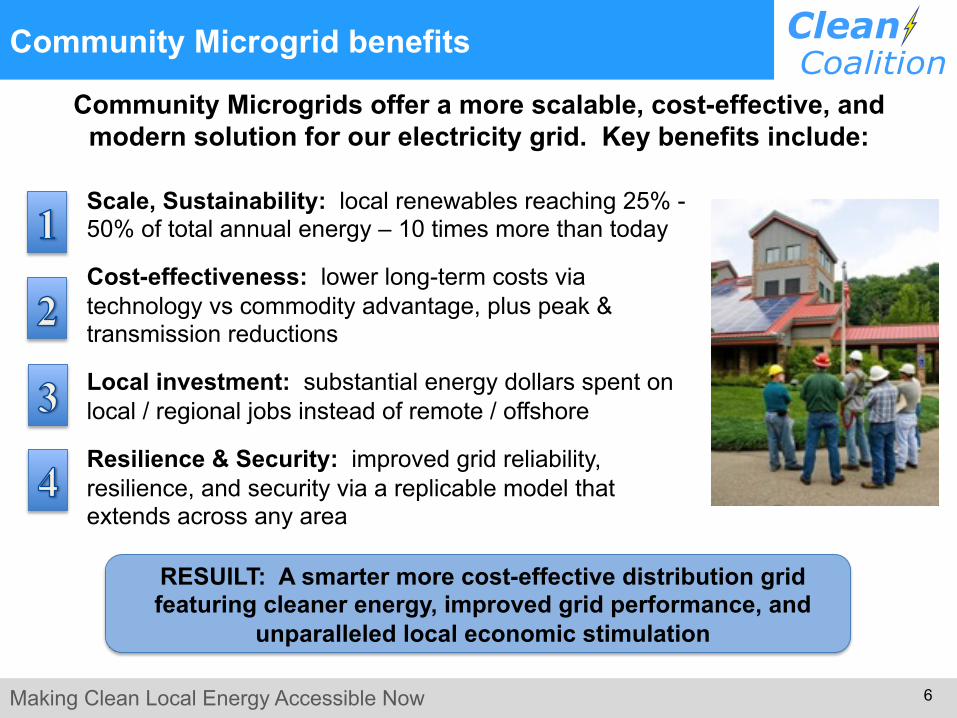
Community Microgrid benefits
Scale, Sustainability: local renewables reaching 25% - 50% of total annual energy – 10 times more than today Cost-effectiveness: lower long-term costs via technology vs commodity advantage, plus peak & transmission reductions Local investment: substantial energy dollars spent on local / regional jobs instead of remote / offshore
Resilience & Security: improved grid reliability, resilience, and security via a replicable model that extends across any area
RESUILT: A smarter more cost-effective distribution grid featuring cleaner energy, improved grid performance, and
unparalleled local economic stimulation
Community Microgrids offer a more scalable, cost-effective, and modern solution for our electricity grid. Key benefits include:
Making Clean Local Energy Accessible Now
7
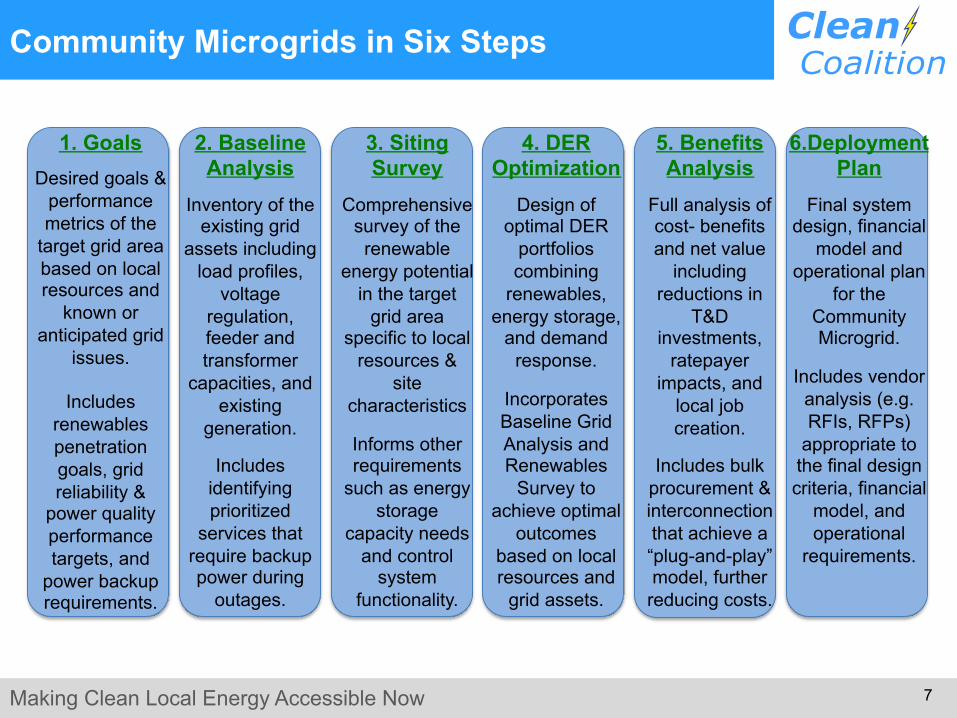
Community Microgrids in Six Steps
1. Goals
Desired goals & performance metrics of the
target grid area based on local resources and
known or anticipated grid
issues.
Includes renewables penetration goals, grid reliability &
power quality performance targets, and
power backup requirements.
2. Baseline Analysis
Inventory of the existing grid
assets including load profiles,
voltage regulation, feeder and transformer
capacities, and existing
generation.
Includes identifying prioritized
services that require backup power during
outages.
3. Siting Survey
Comprehensive survey of the renewable
energy potential in the target
grid area specific to local
resources & site
characteristics
Informs other requirements
such as energy storage
capacity needs and control
system functionality.
4. DER Optimization
Design of optimal DER
portfolios combining
renewables, energy storage,
and demand response.
Incorporates Baseline Grid Analysis and Renewables
Survey to achieve optimal
outcomes based on local resources and
grid assets.
5. Benefits Analysis
Full analysis of cost- benefits and net value
including reductions in
T&D investments,
ratepayer impacts, and
local job creation.
Includes bulk
procurement & interconnection that achieve a “plug-and-play” model, further
reducing costs.
6.Deployment Plan
Final system design, financial
model and operational plan
for the Community Microgrid.
Includes vendor
analysis (e.g. RFIs, RFPs)
appropriate to the final design criteria, financial
model, and operational
requirements.
Making Clean Local Energy Accessible Now
8
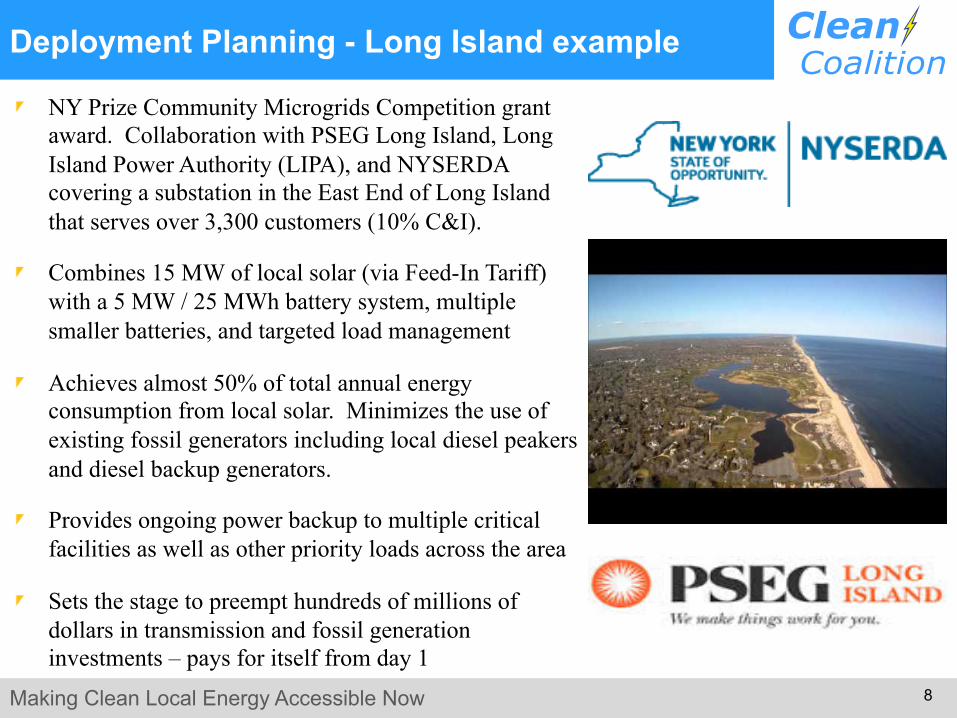
Deployment Planning - Long Island example
NY Prize Community Microgrids Competition grant award. Collaboration with PSEG Long Island, Long Island Power Authority (LIPA), and NYSERDA covering a substation in the East End of Long Island that serves over 3,300 customers (10% C&I).
Combines 15 MW of local solar (via Feed-In Tariff) with a 5 MW / 25 MWh battery system, multiple smaller batteries, and targeted load management
Achieves almost 50% of total annual energy consumption from local solar. Minimizes the use of existing fossil generators including local diesel peakers and diesel backup generators.
Provides ongoing power backup to multiple critical facilities as well as other priority loads across the area
Sets the stage to preempt hundreds of millions of dollars in transmission and fossil generation investments – pays for itself from day 1
Making Clean Local Energy Accessible Now
9
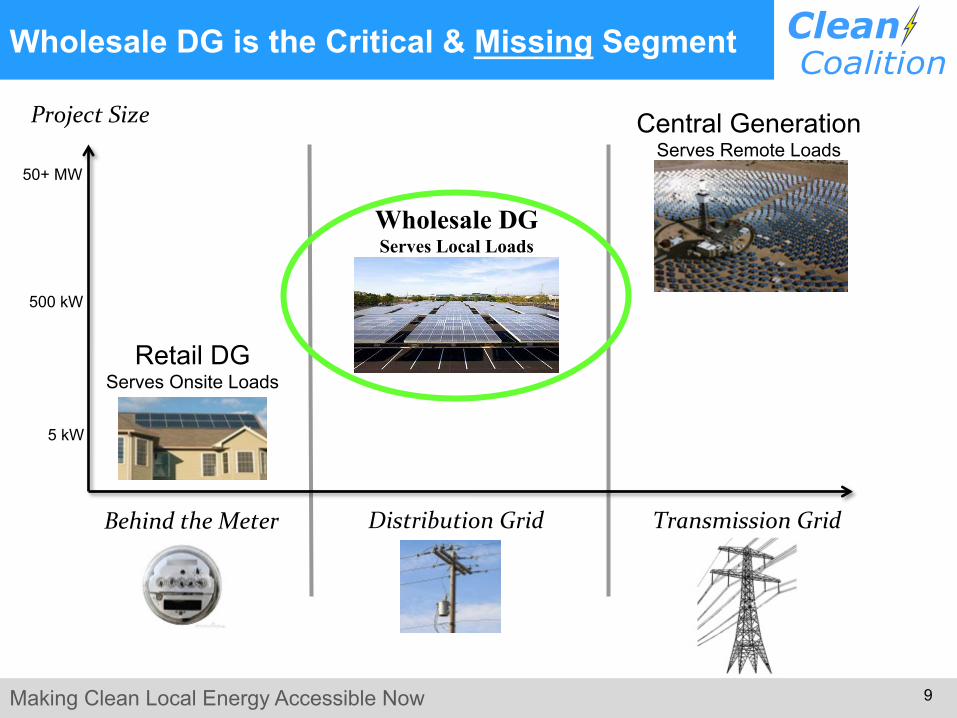
Wholesale DG is the Critical & Missing Segment
DistributionGrid
ProjectSize
BehindtheMeter
Central Generation Serves Remote Loads
Wholesale DG Serves Local Loads
Retail DG Serves Onsite Loads
TransmissionGrid
5 kW
50+ MW
500 kW
Making Clean Local Energy Accessible Now
10
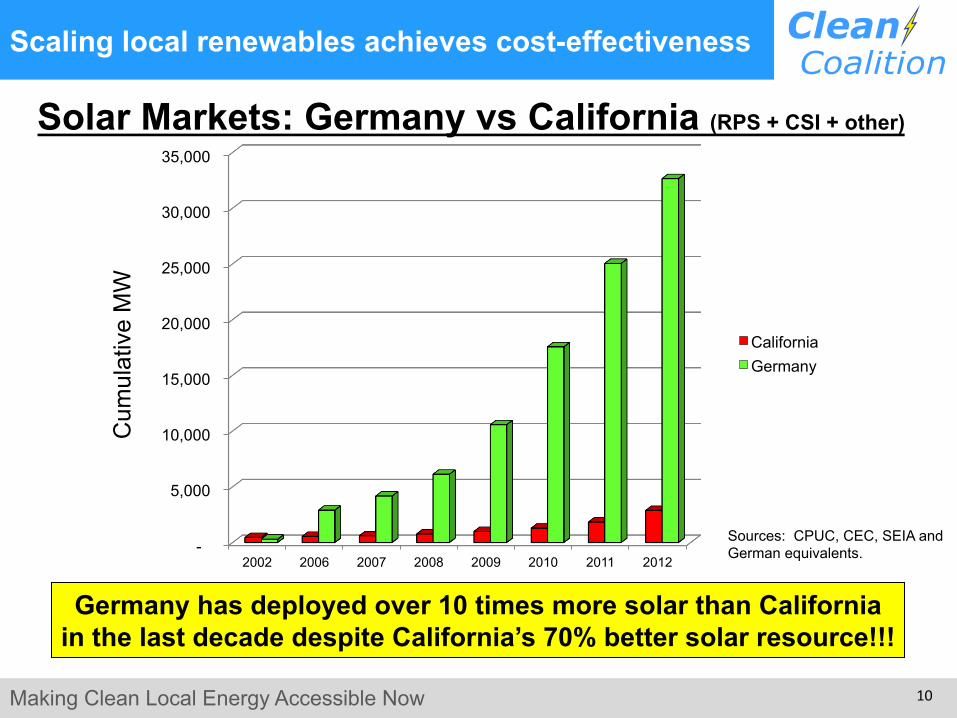
Scaling local renewables achieves cost-effectiveness
Solar Markets: Germany vs California (RPS + CSI + other)
Germany has deployed over 10 times more solar than California in the last decade despite California’s 70% better solar resource!!!
Sources: CPUC, CEC, SEIA and German equivalents.
Cum
ulat
ive
MW
-
5,000
10,000
15,000
20,000
25,000
30,000
35,000
2002 2006 2007 2008 2009 2010 2011 2012
California Germany
Making Clean Local Energy Accessible Now
11
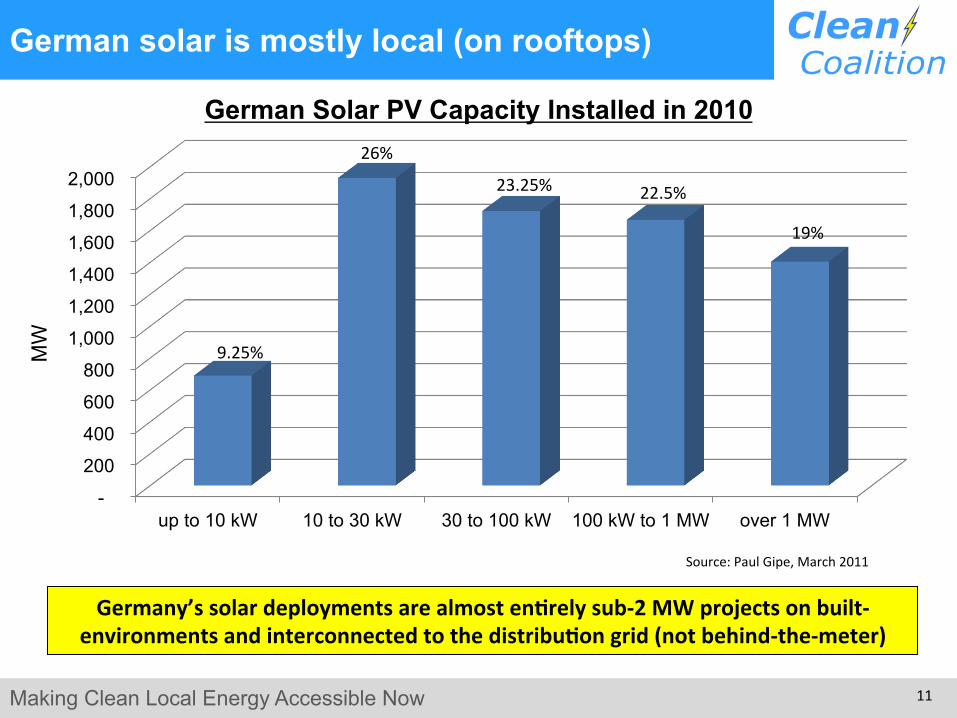
German solar is mostly local (on rooftops)
-
200
400
600
800
1,000
1,200
1,400
1,600
1,800
2,000
up to 10 kW 10 to 30 kW 30 to 100 kW 100 kW to 1 MW over 1 MW
MW
German Solar PV Capacity Installed in 2010
Source:PaulGipe,March2011
Germany’ssolardeploymentsarealmosten0relysub-2MWprojectsonbuilt-environmentsandinterconnectedtothedistribu0ongrid(notbehind-the-meter)
22.5%
26%
23.25%
9.25%
19%
Making Clean Local Energy Accessible Now
12
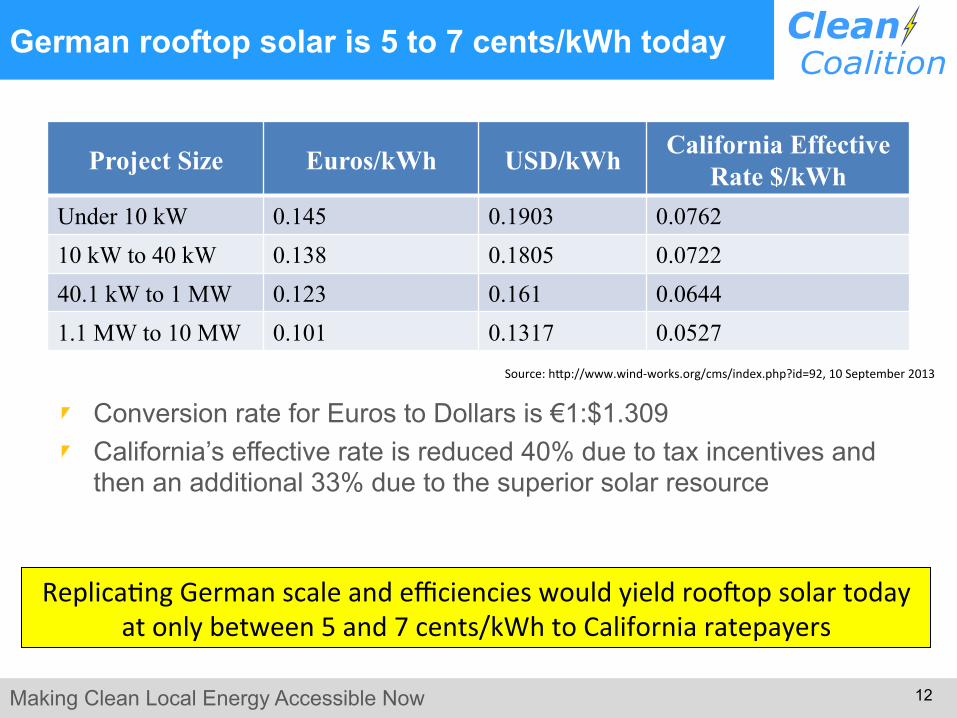
German rooftop solar is 5 to 7 cents/kWh today
Project Size Euros/kWh USD/kWh California Effective Rate $/kWh
Under 10 kW 0.145 0.1903 0.0762 10 kW to 40 kW 0.138 0.1805 0.0722 40.1 kW to 1 MW 0.123 0.161 0.0644 1.1 MW to 10 MW 0.101 0.1317 0.0527
Conversion rate for Euros to Dollars is €1:$1.309 California’s effective rate is reduced 40% due to tax incentives and
then an additional 33% due to the superior solar resource
Source:h>p://www.wind-works.org/cms/index.php?id=92,10September2013
ReplicaMngGermanscaleandefficiencieswouldyieldrooPopsolartodayatonlybetween5and7cents/kWhtoCaliforniaratepayers
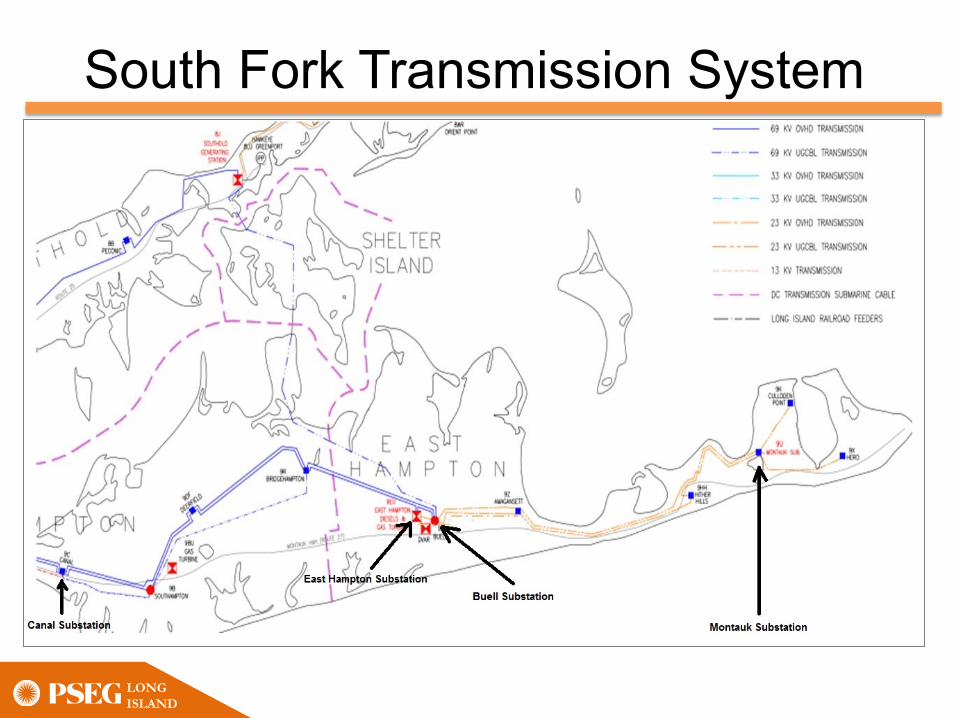
South Fork Transmission System
LONG ISLAND
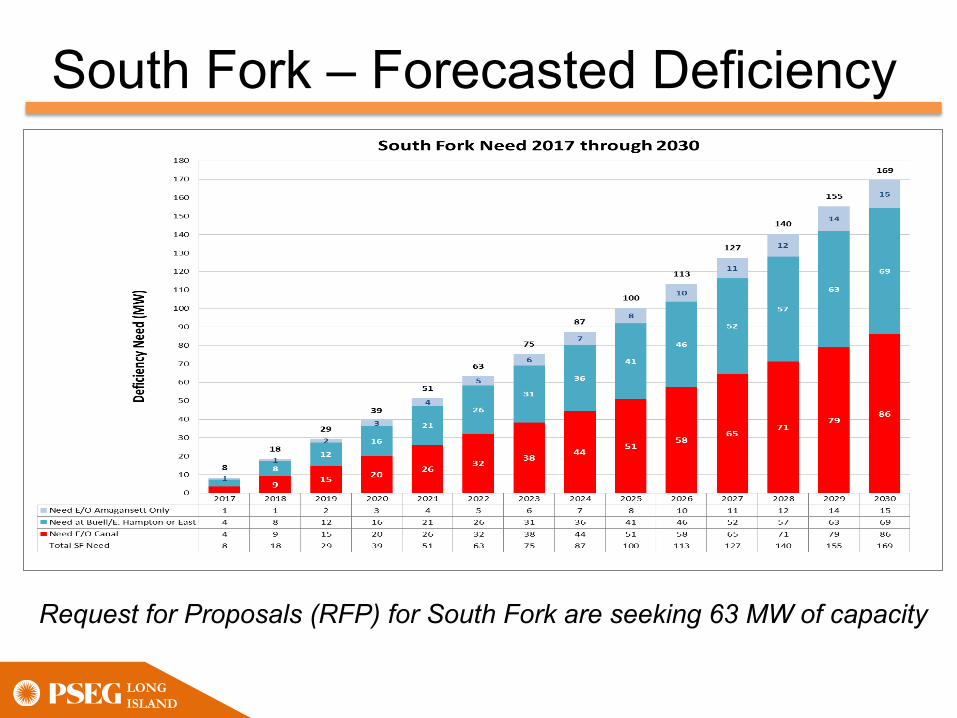
South Fork – Forecasted Deficiency
LONG ISLAND
Request for Proposals (RFP) for South Fork are seeking 63 MW of capacity
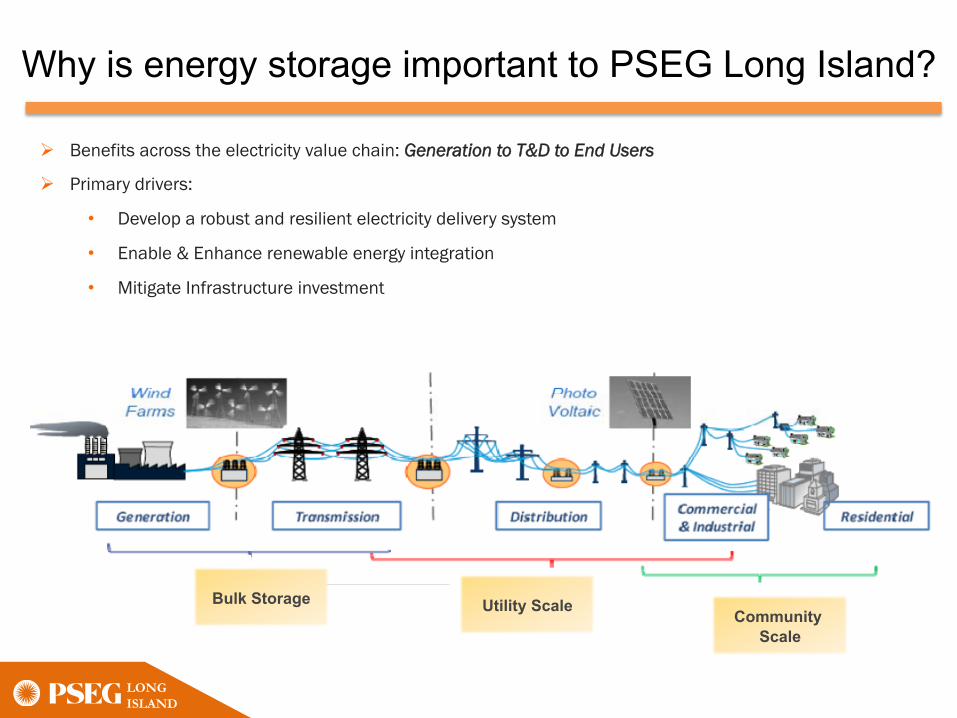
Why is energy storage important to PSEG Long Island?
Utility Scale Community Scale
Bulk Storage
Ø Benefits across the electricity value chain: Generation to T&D to End Users
Ø Primary drivers:
• Develop a robust and resilient electricity delivery system
• Enable & Enhance renewable energy integration
• Mitigate Infrastructure investment
LONG ISLAND
Making Clean Local Energy Accessible Now
16
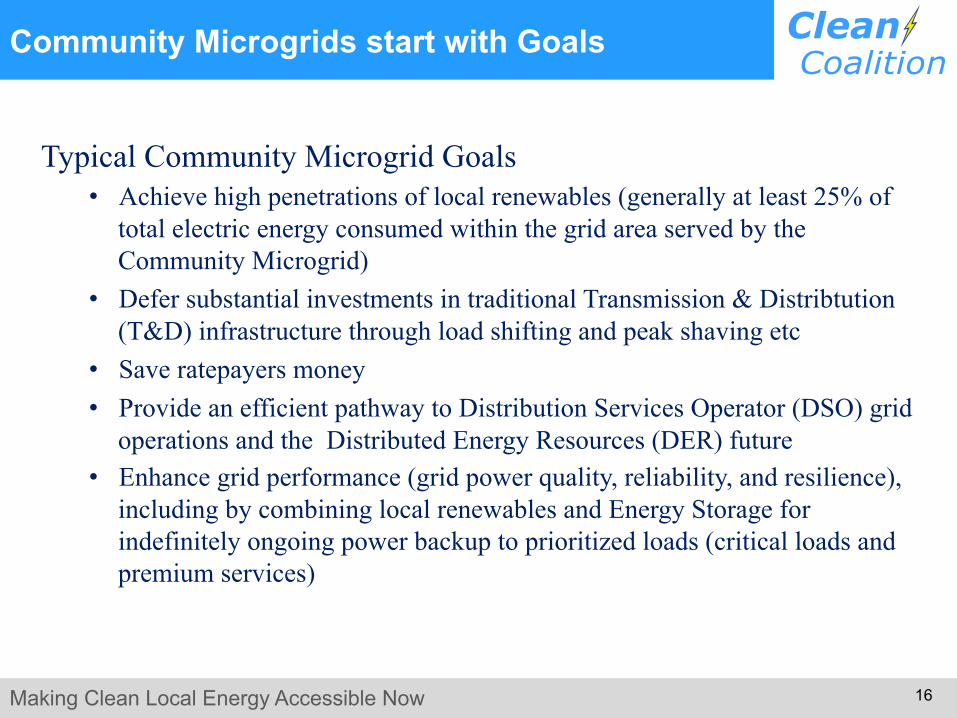
Community Microgrids start with Goals
Typical Community Microgrid Goals • Achieve high penetrations of local renewables (generally at least 25% of
total electric energy consumed within the grid area served by the Community Microgrid)
• Defer substantial investments in traditional Transmission & Distribtution (T&D) infrastructure through load shifting and peak shaving etc
• Save ratepayers money • Provide an efficient pathway to Distribution Services Operator (DSO) grid
operations and the Distributed Energy Resources (DER) future • Enhance grid performance (grid power quality, reliability, and resilience),
including by combining local renewables and Energy Storage for indefinitely ongoing power backup to prioritized loads (critical loads and premium services)
Making Clean Local Energy Accessible Now
17
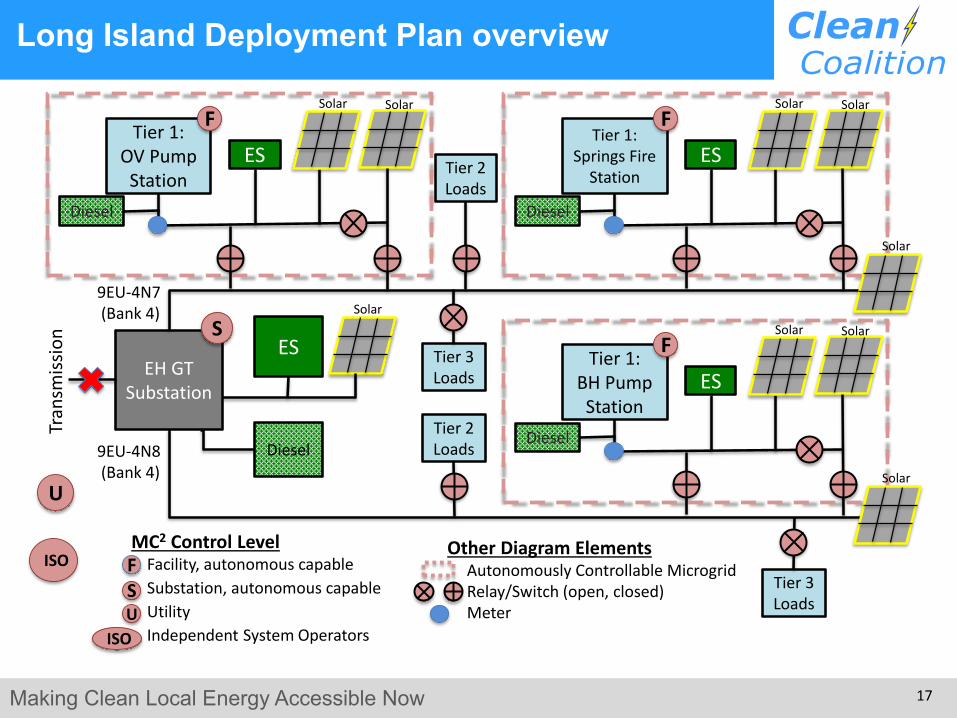
Long Island Deployment Plan overview
EHGTSubstation
ES
Tier2Loads
S
Tier2Loads
Tier3Loads
Tier3Loads
9EU-4N7(Bank4)
Transm
ission
9EU-4N8(Bank4)
Diesel
Solar
Tier1:OVPumpStation
ES
F
Diesel
SolarSolar
U
MC2 ControlLevelFacility,autonomouscapableSubstation,autonomouscapableUtilityIndependentSystemOperators
F
ISO
SU
ISOOtherDiagramElements
AutonomouslyControllableMicrogridRelay/Switch(open,closed)Meter
Tier1:SpringsFireStation
ES
F
Diesel
SolarSolar
Tier1:BHPumpStation
ES
F
Diesel
SolarSolar
Solar
Solar
Making Clean Local Energy Accessible Now
18
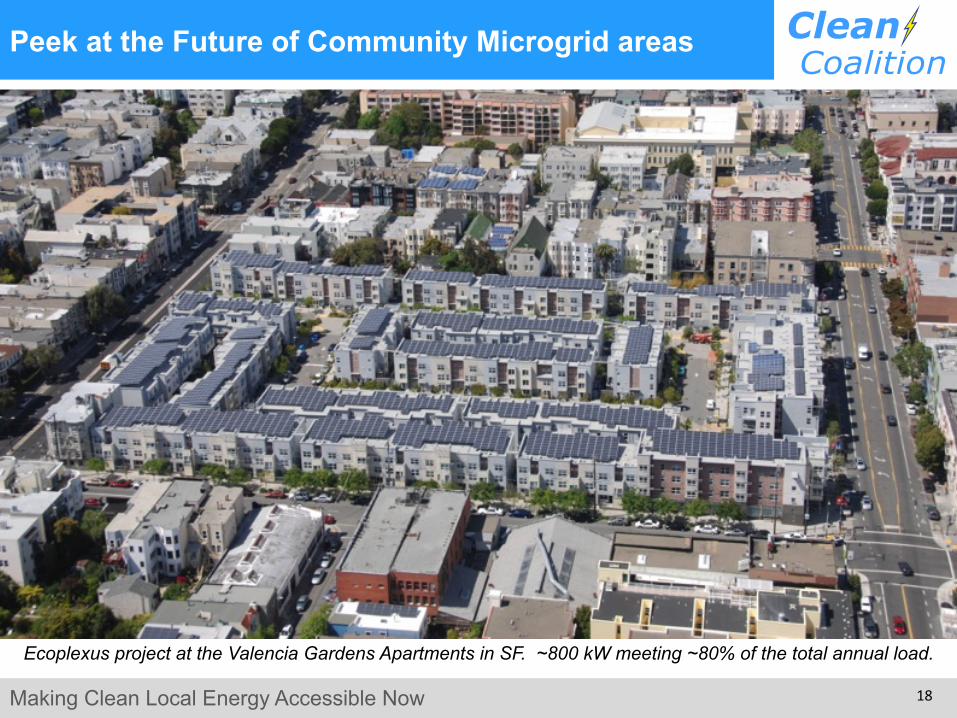
Ecoplexus project at the Valencia Gardens Apartments in SF. ~800 kW meeting ~80% of the total annual load.
Peek at the Future of Community Microgrid areas
Making Clean Local Energy Accessible Now
19
Backup
Backup
Making Clean Local Energy Accessible Now
20
Community Microgrids start with Goals
Typical Community Microgrid Goals • Achieve high penetrations of local renewables. • Enhance grid reliability and power quality. • Provide energy resilience to the community. • Defer investments in traditional Transmission & Distribtution (T&D). • Save ratepayers money. • Stage an efficient pathway to Distribution Services Operator (DSO) grid
operations and the Distributed Energy Resources (DER) future. • Meet community expectations etc.
Making Clean Local Energy Accessible Now
21
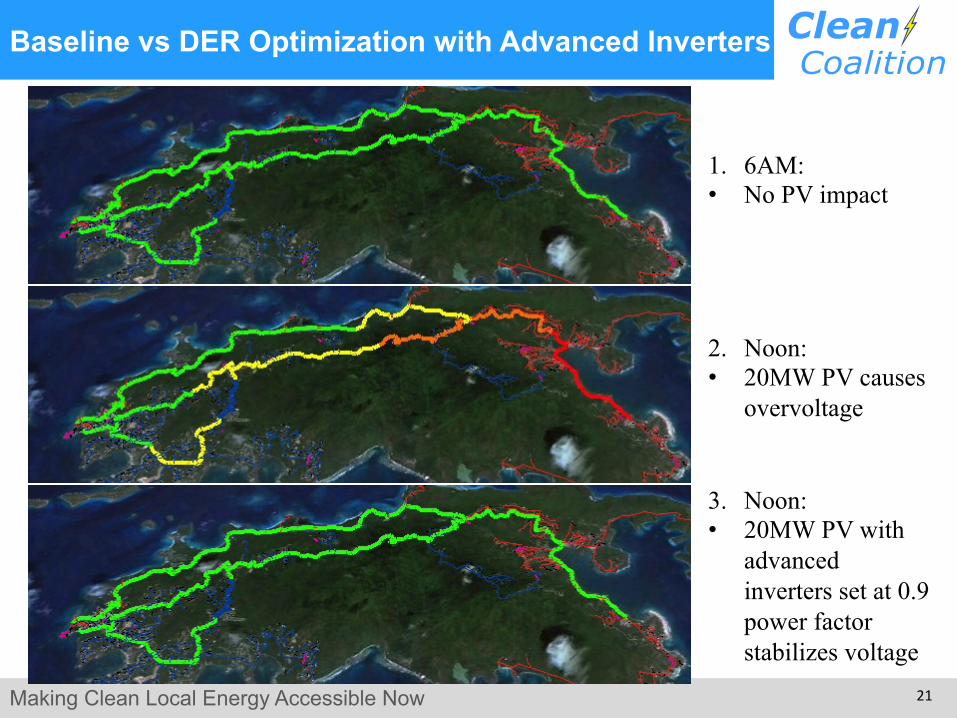
Baseline vs DER Optimization with Advanced Inverters
1. 6AM: • No PV impact
2. Noon: • 20MW PV causes
overvoltage
3. Noon: • 20MW PV with
advanced inverters set at 0.9 power factor stabilizes voltage
Making Clean Local Energy Accessible Now
22
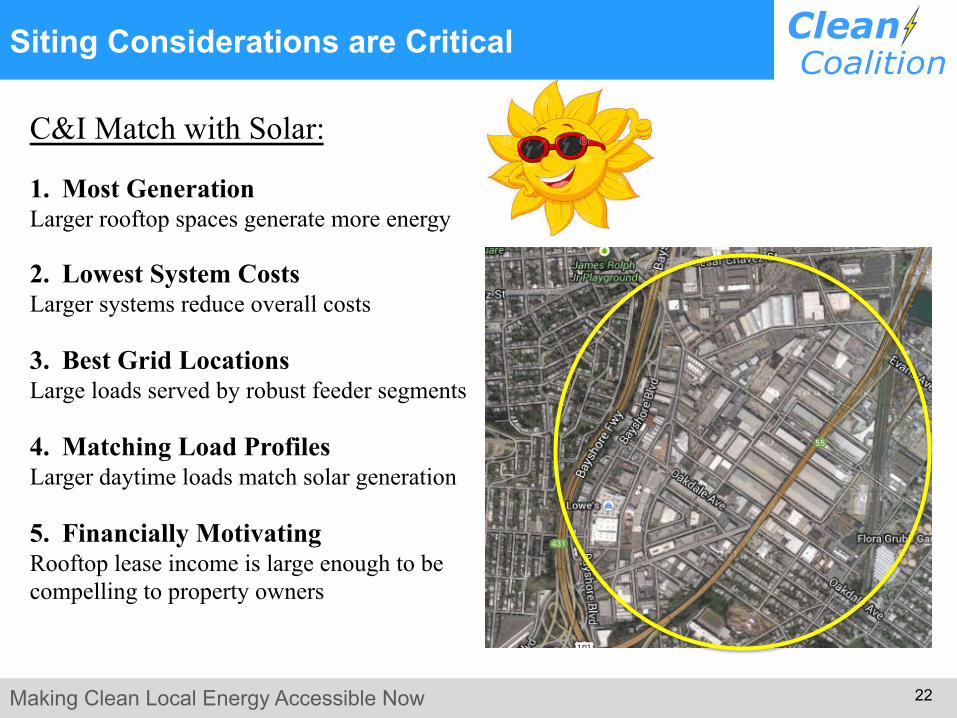
Siting Considerations are Critical
C&I Match with Solar: 1. Most Generation Larger rooftop spaces generate more energy 2. Lowest System Costs Larger systems reduce overall costs 3. Best Grid Locations Large loads served by robust feeder segments 4. Matching Load Profiles Larger daytime loads match solar generation 5. Financially Motivating Rooftop lease income is large enough to be compelling to property owners
Making Clean Local Energy Accessible Now
23
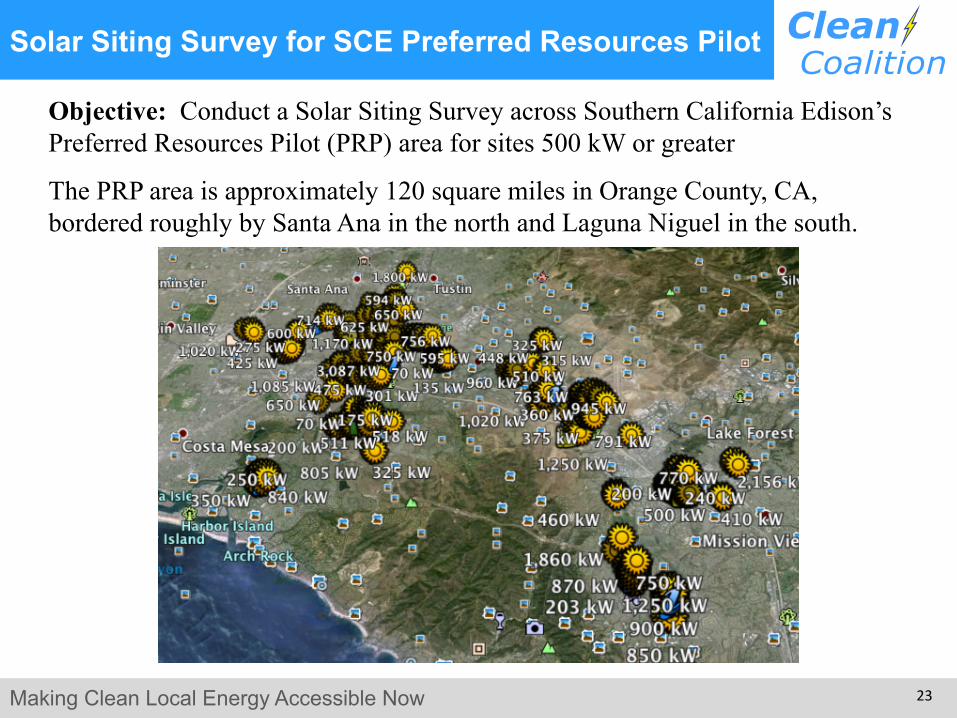
Solar Siting Survey for SCE Preferred Resources Pilot
Objective: Conduct a Solar Siting Survey across Southern California Edison’s Preferred Resources Pilot (PRP) area for sites 500 kW or greater
The PRP area is approximately 120 square miles in Orange County, CA, bordered roughly by Santa Ana in the north and Laguna Niguel in the south.
Making Clean Local Energy Accessible Now
24
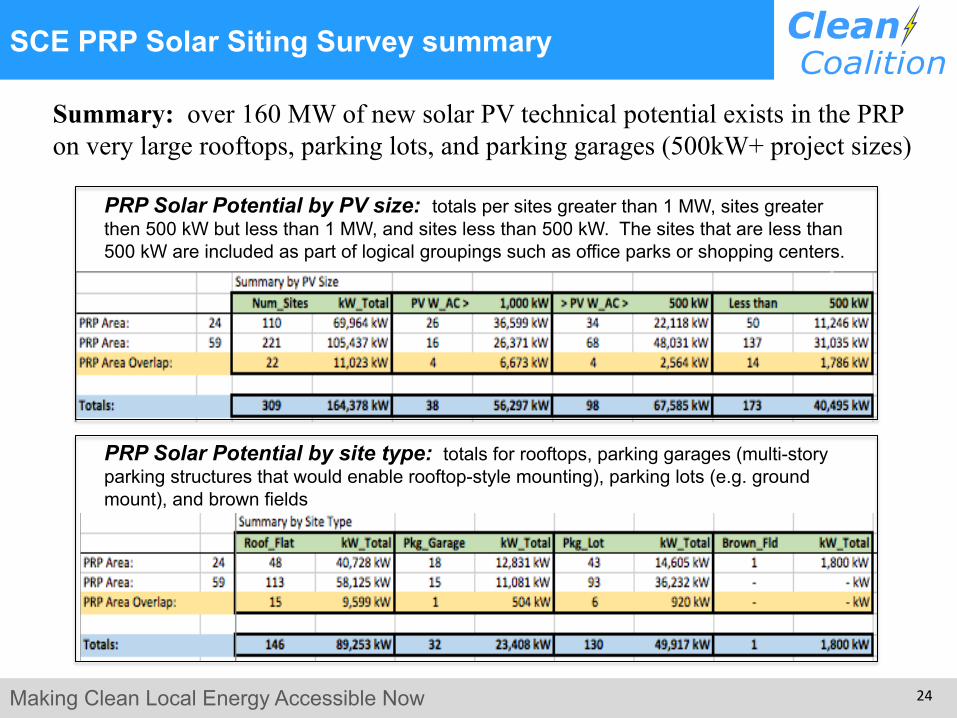
SCE PRP Solar Siting Survey summary
Summary: over 160 MW of new solar PV technical potential exists in the PRP on very large rooftops, parking lots, and parking garages (500kW+ project sizes)
PRP Solar Potential by PV size: totals per sites greater than 1 MW, sites greater then 500 kW but less than 1 MW, and sites less than 500 kW. The sites that are less than 500 kW are included as part of logical groupings such as office parks or shopping centers.
PRP Solar Potential by site type: totals for rooftops, parking garages (multi-story parking structures that would enable rooftop-style mounting), parking lots (e.g. ground mount), and brown fields
Making Clean Local Energy Accessible Now
25
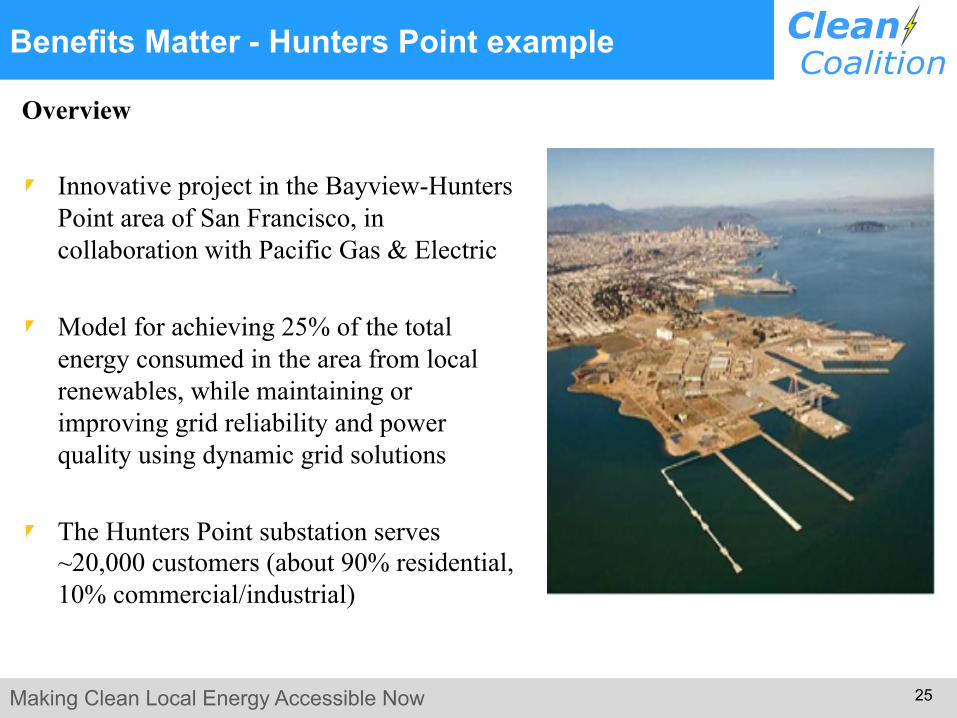
Benefits Matter - Hunters Point example
Overview
Innovative project in the Bayview-Hunters Point area of San Francisco, in collaboration with Pacific Gas & Electric
Model for achieving 25% of the total energy consumed in the area from local renewables, while maintaining or improving grid reliability and power quality using dynamic grid solutions
The Hunters Point substation serves ~20,000 customers (about 90% residential, 10% commercial/industrial)
Making Clean Local Energy Accessible Now
26
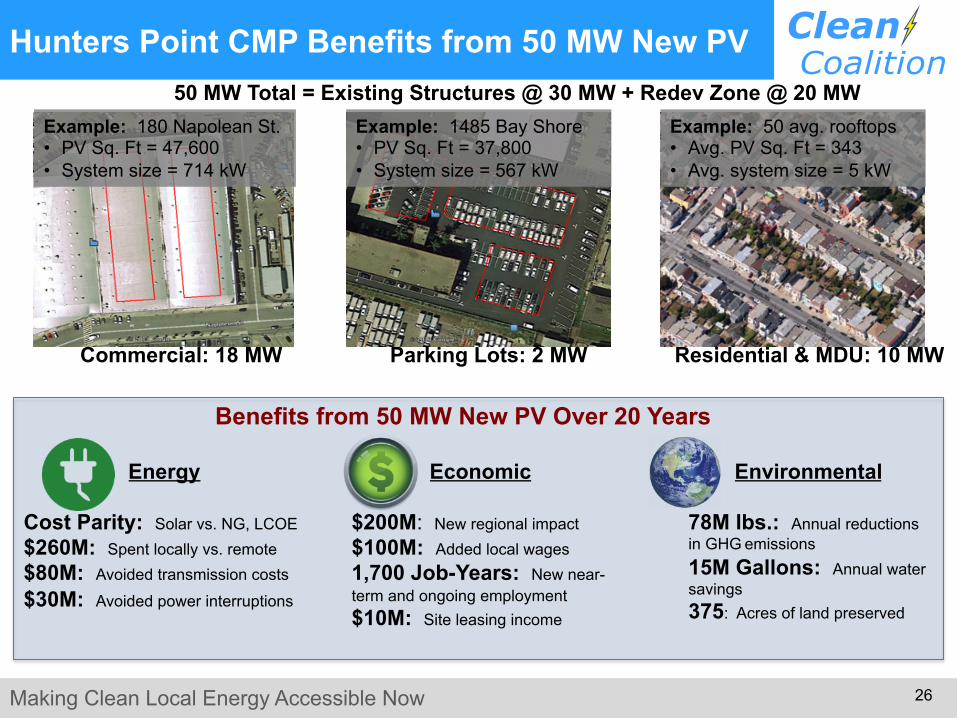
Hunters Point CMP Benefits from 50 MW New PV
Energy Cost Parity: Solar vs. NG, LCOE $260M: Spent locally vs. remote $80M: Avoided transmission costs $30M: Avoided power interruptions
Economic $200M: New regional impact $100M: Added local wages 1,700 Job-Years: New near-term and ongoing employment $10M: Site leasing income
Benefits from 50 MW New PV Over 20 Years
Environmental 78M lbs.: Annual reductions in GHG emissions 15M Gallons: Annual water savings 375: Acres of land preserved
Example: 180 Napolean St. • PV Sq. Ft = 47,600 • System size = 714 kW
Example: 1485 Bay Shore • PV Sq. Ft = 37,800 • System size = 567 kW
Example: 50 avg. rooftops • Avg. PV Sq. Ft = 343 • Avg. system size = 5 kW
Commercial: 18 MW Parking Lots: 2 MW Residential & MDU: 10 MW
50 MW Total = Existing Structures @ 30 MW + Redev Zone @ 20 MW
Making Clean Local Energy Accessible Now
27
Cubberley Solar Emergency Microgrid
Leverage the existing 125 kW solar facility and allow it to continue operating under the existing Net Energy Metering (NEM) agreement and interconnection with the Palo Alto Utilities.
Implement an electrical configuration that allows the Cubberly Solar Emergency Microgrid (SEM) to autonomously isolate (aka “island”) from the Palo Alto Utilities grid without power interruption to the identified critical facilities, including the Offices of Emergency Services (OES) communication facilities and administrative offices; and all facilities associated with Palo Alto’s only emergency shelter.
Implement energy storage to complement the solar and provide indefinite backup power to the critical facilities, which are estimated to require average power of 10kW and peak power of 50kW.
Making Clean Local Energy Accessible Now
28
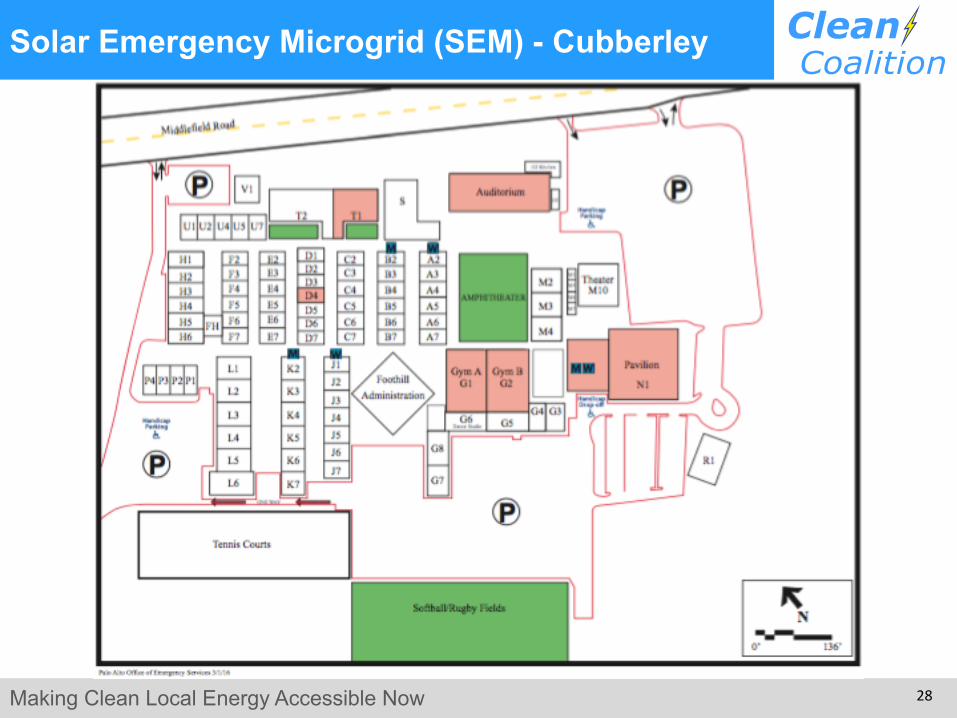
Solar Emergency Microgrid (SEM) - Cubberley
Making Clean Local Energy Accessible Now
29
Peninsula Advance Energy Community (PAEC)
Funding: 20-month, $1.3 million California Energy Commission (CEC) planning & design grant to stage policy and project implementations that facilitate and showcase Advanced Energy Communities (AECs). Policy: Identify best-practice AEC policies associated and stage
to proliferate them policies throughout the PAEC region and beyond. Projects: Identify showcase AEC projects and cross-fertilize them
to projects throughout the PAEC region and beyond.
Making Clean Local Energy Accessible Now
30
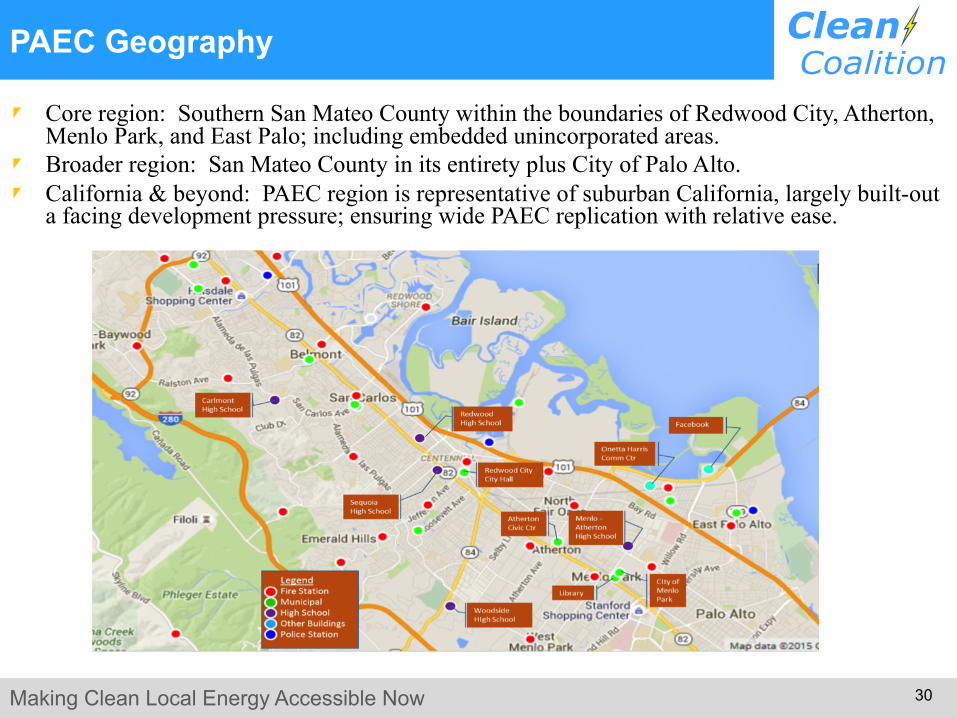
PAEC Geography
Core region: Southern San Mateo County within the boundaries of Redwood City, Atherton, Menlo Park, and East Palo; including embedded unincorporated areas.
Broader region: San Mateo County in its entirety plus City of Palo Alto. California & beyond: PAEC region is representative of suburban California, largely built-out
a facing development pressure; ensuring wide PAEC replication with relative ease.
Making Clean Local Energy Accessible Now
31
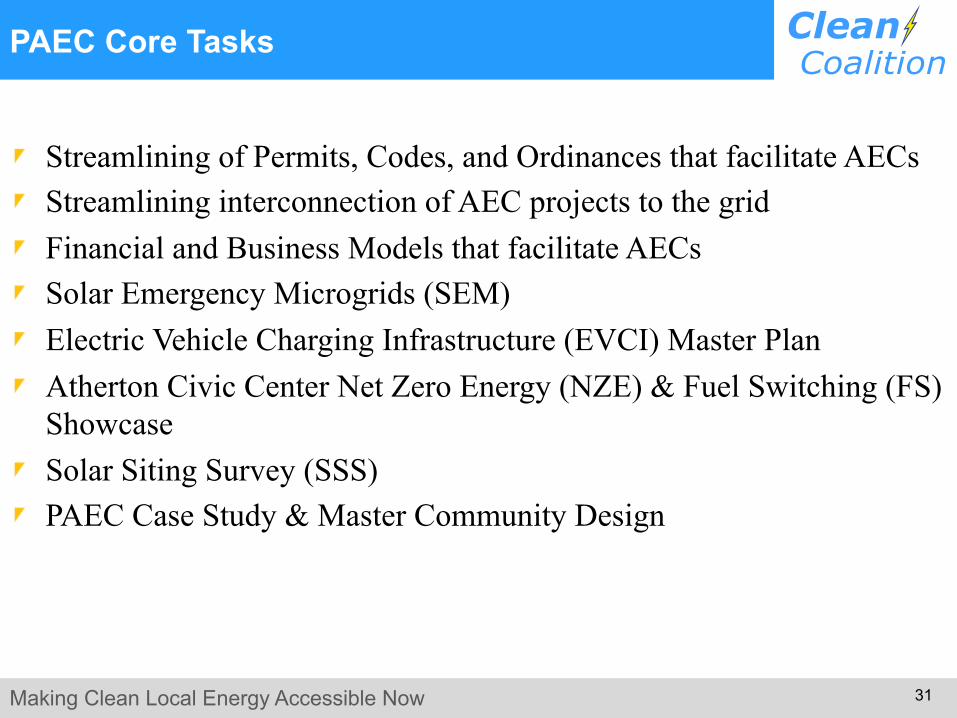
PAEC Core Tasks
Streamlining of Permits, Codes, and Ordinances that facilitate AECs Streamlining interconnection of AEC projects to the grid Financial and Business Models that facilitate AECs Solar Emergency Microgrids (SEM) Electric Vehicle Charging Infrastructure (EVCI) Master Plan Atherton Civic Center Net Zero Energy (NZE) & Fuel Switching (FS)
Showcase Solar Siting Survey (SSS) PAEC Case Study & Master Community Design
Making Clean Local Energy Accessible Now
32
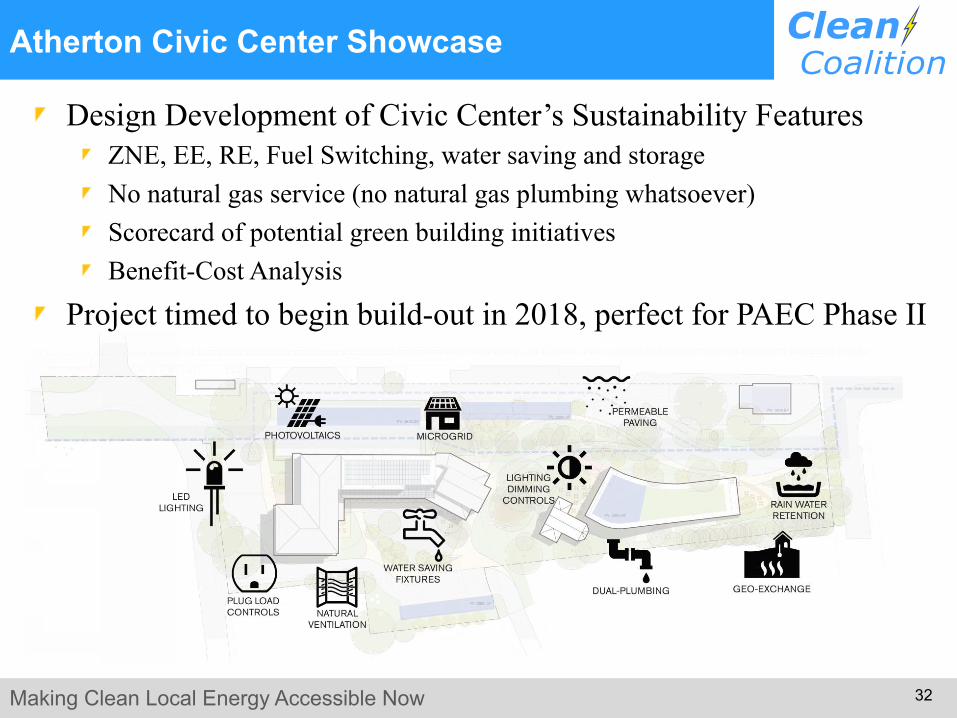
Atherton Civic Center Showcase
19
Design Development of Civic Center’s Sustainability Features ZNE, EE, RE, Fuel Switching, water saving and storage No natural gas service (no natural gas plumbing whatsoever) Scorecard of potential green building initiatives Benefit-Cost Analysis
Project timed to begin build-out in 2018, perfect for PAEC Phase II
Making Clean Local Energy Accessible Now
33
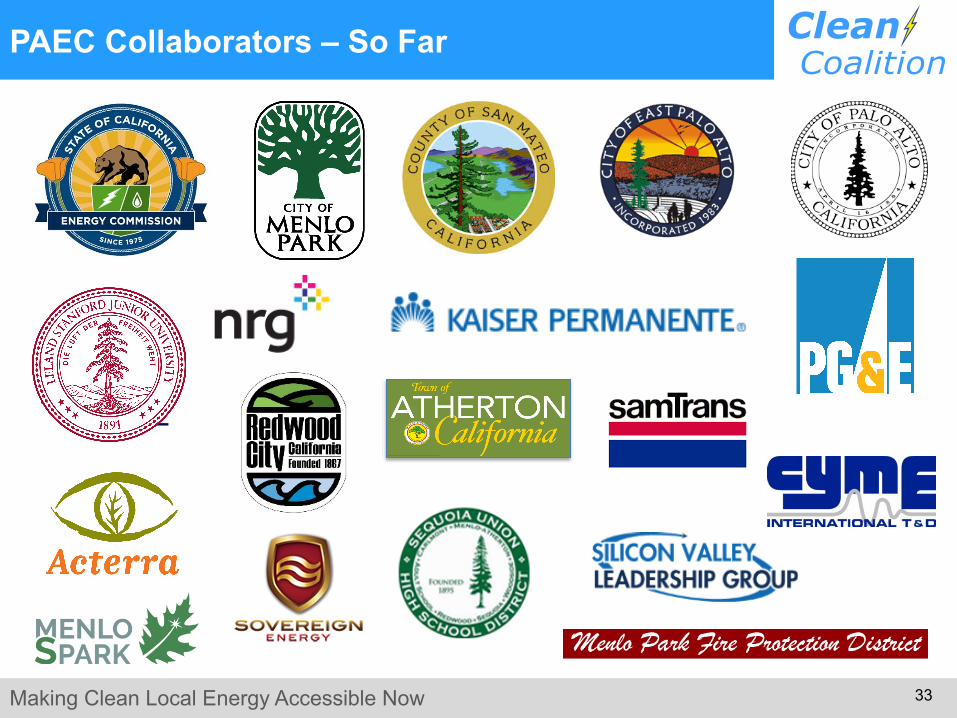
PAEC Collaborators – So Far