Embed Size (px)
Citation preview
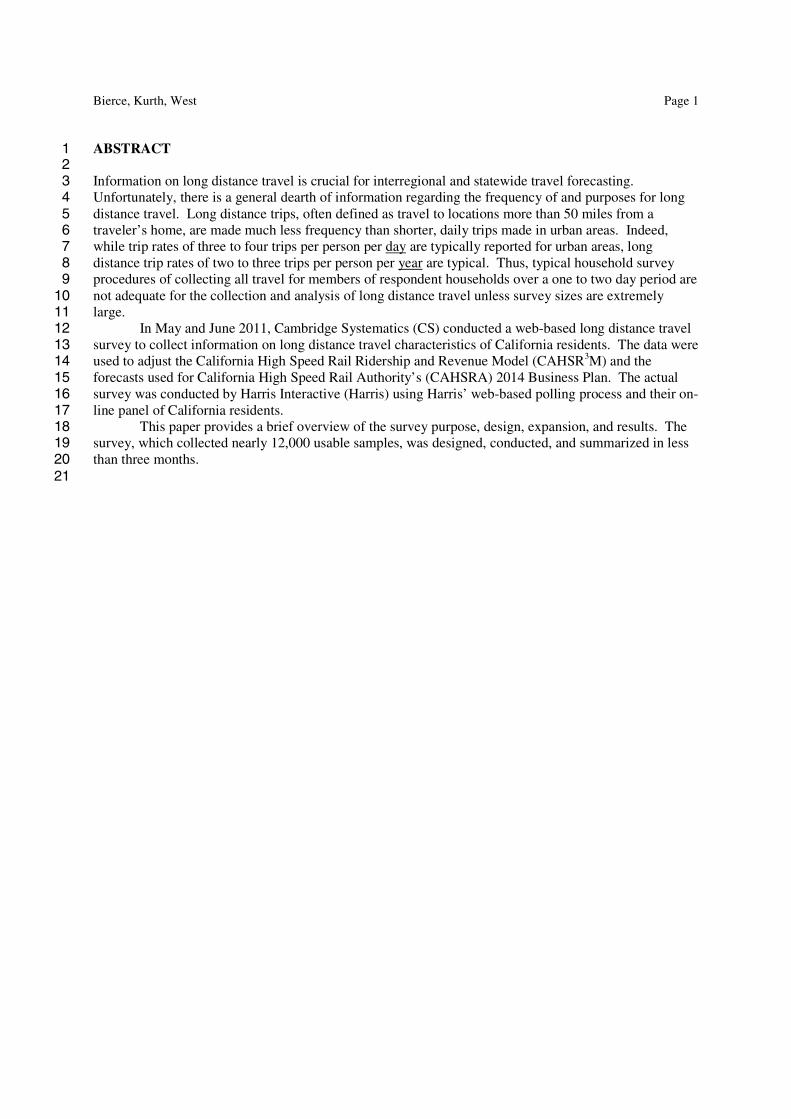
Long Distance Travel – An Update from a 2011 Web-Based Travel Survey for the California High Speed Rail Authority
Eric Bierce* Cambridge Systematics, Inc.
445 S. Figueroa Street, Suite 2600 Los Angeles, CA 90071
P: 213-612-7749 F: 213-612-7758 [email protected]
David Kurth
Cambridge Systematics, Inc. 999 18th Street, Suite 3000
Denver, CO 80202 P: 303-357-4661 F: 303-446-9111
Ronald West Cambridge Systematics, Inc. 555 12th Street, Suite 1600
Oakland, CA 94607 P: 510-873-8700 F: 510-873-8701
[email protected] * Corresponding author
November 15, 2012
Words (including abstract & references): 3,524 Tables: 7 × 250= 1,750 Figures: 3 × 250= 750 Total Equivalent Words 6,024
Submitted for Presentation and Publication – 92nd Annual Meeting of the Transportation Research Board
Washington, D.C., January 13-17, 2013
TRB 2013 Annual Meeting Paper revised from original submittal.
Bierce, Kurth, West Page 1
ABSTRACT 1 2 Information on long distance travel is crucial for interregional and statewide travel forecasting. 3 Unfortunately, there is a general dearth of information regarding the frequency of and purposes for long 4 distance travel. Long distance trips, often defined as travel to locations more than 50 miles from a 5 traveler’s home, are made much less frequency than shorter, daily trips made in urban areas. Indeed, 6 while trip rates of three to four trips per person per day are typically reported for urban areas, long 7 distance trip rates of two to three trips per person per year are typical. Thus, typical household survey 8 procedures of collecting all travel for members of respondent households over a one to two day period are 9 not adequate for the collection and analysis of long distance travel unless survey sizes are extremely 10 large. 11 In May and June 2011, Cambridge Systematics (CS) conducted a web-based long distance travel 12 survey to collect information on long distance travel characteristics of California residents. The data were 13 used to adjust the California High Speed Rail Ridership and Revenue Model (CAHSR3M) and the 14 forecasts used for California High Speed Rail Authority’s (CAHSRA) 2014 Business Plan. The actual 15 survey was conducted by Harris Interactive (Harris) using Harris’ web-based polling process and their on-16 line panel of California residents. 17 This paper provides a brief overview of the survey purpose, design, expansion, and results. The 18 survey, which collected nearly 12,000 usable samples, was designed, conducted, and summarized in less 19 than three months. 20 21
TRB 2013 Annual Meeting Paper revised from original submittal.
Bierce, Kurth, West Page 2
INTRODUCTION 1 In May and June 2011, Cambridge Systematics (CS) conducted a web-based long distance travel survey 2 to collect information on long distance travel characteristics of California residents. The data were used 3 to adjust the California High Speed Rail Ridership and Revenue Model (CAHSR3M) and the forecasts 4 used for California High Speed Rail Authority’s (CAHSRA) 2014 Business Plan. The CS designed 5 survey was conducted by Harris Interactive (Harris) using Harris’ web-based polling process and their on-6 line panel of California residents. 7
While the survey was collected in 2011, the survey was factored to match 2008 socioeconomic 8 characteristics of the California population. The 2008 socioeconomic characteristics were summarized 9 from a synthesis of the California population produced by the University of California – Davis <1> as 10 part of their work on the California Statewide Travel Demand Model (CSTDM) for California 11 Department of Transportation (Caltrans). 12
This paper provides a brief overview of the survey purpose, design, expansion, and results. The 13 survey, which collected nearly 12,000 usable samples, was designed, conducted, and summarized in less 14 than three months. 15 16 SURVEY DESCRIPTION 17 The 2011 long distance travel survey was designed to collect information on intrastate travel made by 18 California residents. Long distance trips were defined as trips made to locations at least 50 miles from the 19 respondent’s home. The survey was restricted to intra-California trips made to or from California 20 residents’ home regions; it did not include interstate and international trips, non-home based trips (trips 21 made between locations outside of the residents’ home regions), nor did it include long distance trips 22 made by non-residents visitors to the state of California. 23
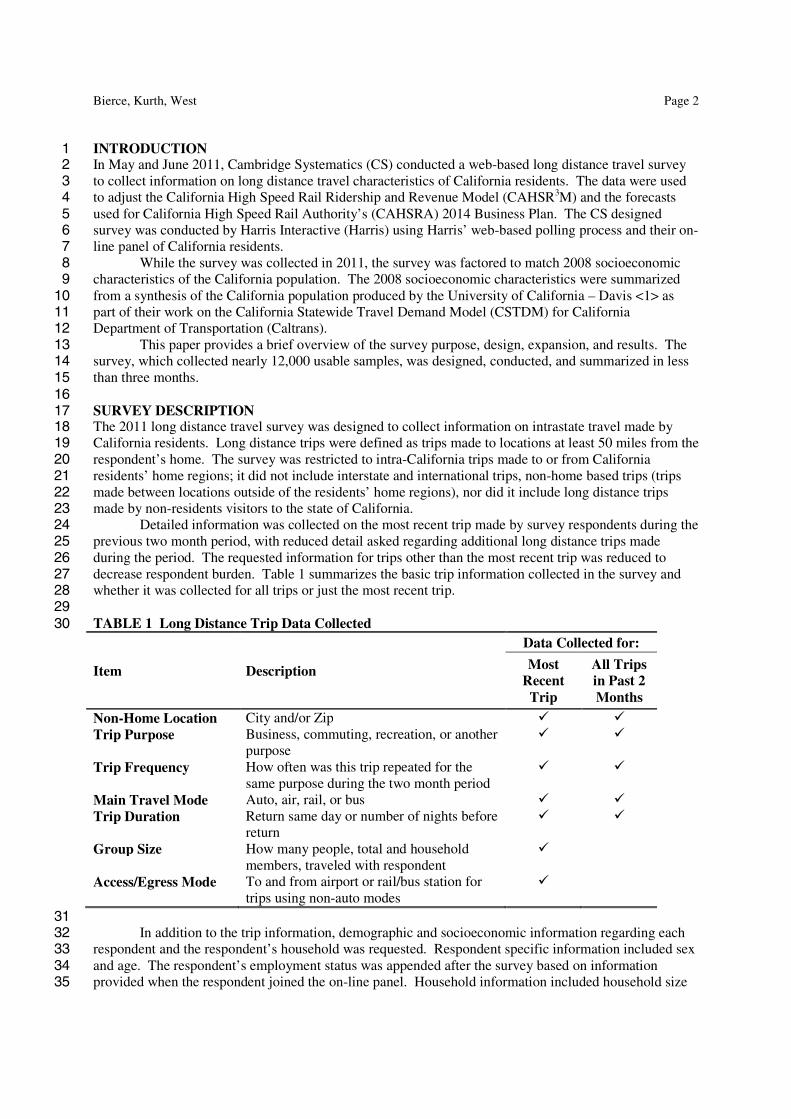
Detailed information was collected on the most recent trip made by survey respondents during the 24 previous two month period, with reduced detail asked regarding additional long distance trips made 25 during the period. The requested information for trips other than the most recent trip was reduced to 26 decrease respondent burden. Table 1 summarizes the basic trip information collected in the survey and 27 whether it was collected for all trips or just the most recent trip. 28
29 TABLE 1 Long Distance Trip Data Collected 30
Item Description
Data Collected for:
Most Recent
Trip
All Trips in Past 2 Months
Non-Home Location City and/or Zip � � Trip Purpose Business, commuting, recreation, or another
purpose � �
Trip Frequency How often was this trip repeated for the same purpose during the two month period
� �
Main Travel Mode Auto, air, rail, or bus � � Trip Duration Return same day or number of nights before
return � �
Group Size How many people, total and household members, traveled with respondent
�
Access/Egress Mode To and from airport or rail/bus station for trips using non-auto modes
�
31 In addition to the trip information, demographic and socioeconomic information regarding each 32
respondent and the respondent’s household was requested. Respondent specific information included sex 33 and age. The respondent’s employment status was appended after the survey based on information 34 provided when the respondent joined the on-line panel. Household information included household size 35
TRB 2013 Annual Meeting Paper revised from original submittal.
Bierce, Kurth, West Page 3
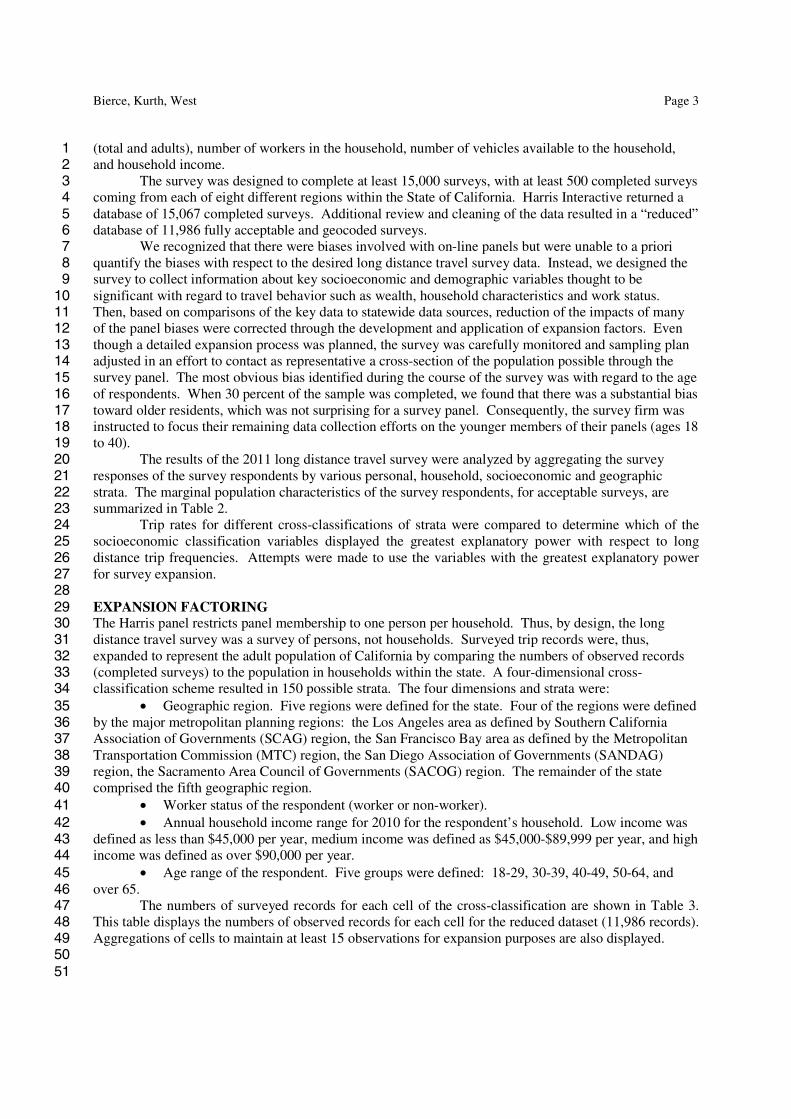
(total and adults), number of workers in the household, number of vehicles available to the household, 1 and household income. 2
The survey was designed to complete at least 15,000 surveys, with at least 500 completed surveys 3 coming from each of eight different regions within the State of California. Harris Interactive returned a 4 database of 15,067 completed surveys. Additional review and cleaning of the data resulted in a “reduced” 5 database of 11,986 fully acceptable and geocoded surveys. 6
We recognized that there were biases involved with on-line panels but were unable to a priori 7 quantify the biases with respect to the desired long distance travel survey data. Instead, we designed the 8 survey to collect information about key socioeconomic and demographic variables thought to be 9 significant with regard to travel behavior such as wealth, household characteristics and work status. 10 Then, based on comparisons of the key data to statewide data sources, reduction of the impacts of many 11 of the panel biases were corrected through the development and application of expansion factors. Even 12 though a detailed expansion process was planned, the survey was carefully monitored and sampling plan 13 adjusted in an effort to contact as representative a cross-section of the population possible through the 14 survey panel. The most obvious bias identified during the course of the survey was with regard to the age 15 of respondents. When 30 percent of the sample was completed, we found that there was a substantial bias 16 toward older residents, which was not surprising for a survey panel. Consequently, the survey firm was 17 instructed to focus their remaining data collection efforts on the younger members of their panels (ages 18 18 to 40). 19
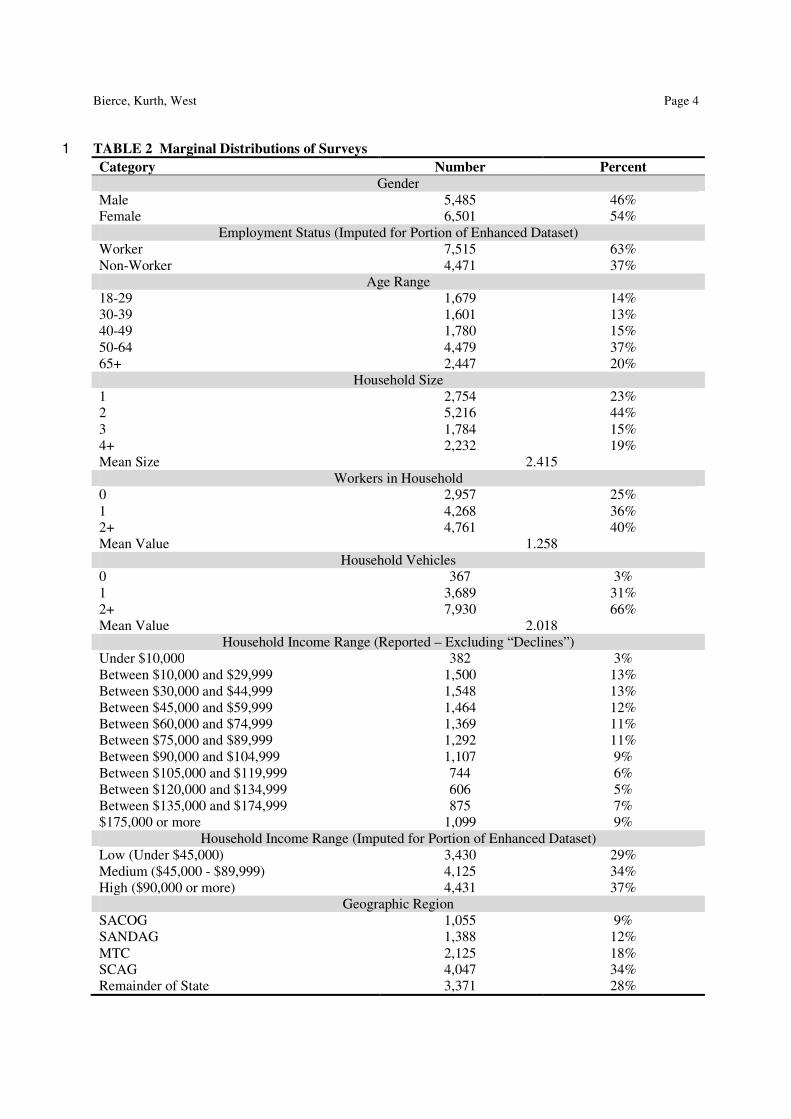
The results of the 2011 long distance travel survey were analyzed by aggregating the survey 20 responses of the survey respondents by various personal, household, socioeconomic and geographic 21 strata. The marginal population characteristics of the survey respondents, for acceptable surveys, are 22 summarized in Table 2. 23
Trip rates for different cross-classifications of strata were compared to determine which of the 24 socioeconomic classification variables displayed the greatest explanatory power with respect to long 25 distance trip frequencies. Attempts were made to use the variables with the greatest explanatory power 26 for survey expansion. 27
28 EXPANSION FACTORING 29 The Harris panel restricts panel membership to one person per household. Thus, by design, the long 30 distance travel survey was a survey of persons, not households. Surveyed trip records were, thus, 31 expanded to represent the adult population of California by comparing the numbers of observed records 32 (completed surveys) to the population in households within the state. A four-dimensional cross-33 classification scheme resulted in 150 possible strata. The four dimensions and strata were: 34
• Geographic region. Five regions were defined for the state. Four of the regions were defined 35 by the major metropolitan planning regions: the Los Angeles area as defined by Southern California 36 Association of Governments (SCAG) region, the San Francisco Bay area as defined by the Metropolitan 37 Transportation Commission (MTC) region, the San Diego Association of Governments (SANDAG) 38 region, the Sacramento Area Council of Governments (SACOG) region. The remainder of the state 39 comprised the fifth geographic region. 40
• Worker status of the respondent (worker or non-worker). 41 • Annual household income range for 2010 for the respondent’s household. Low income was 42
defined as less than $45,000 per year, medium income was defined as $45,000-$89,999 per year, and high 43 income was defined as over $90,000 per year. 44
• Age range of the respondent. Five groups were defined: 18-29, 30-39, 40-49, 50-64, and 45 over 65. 46
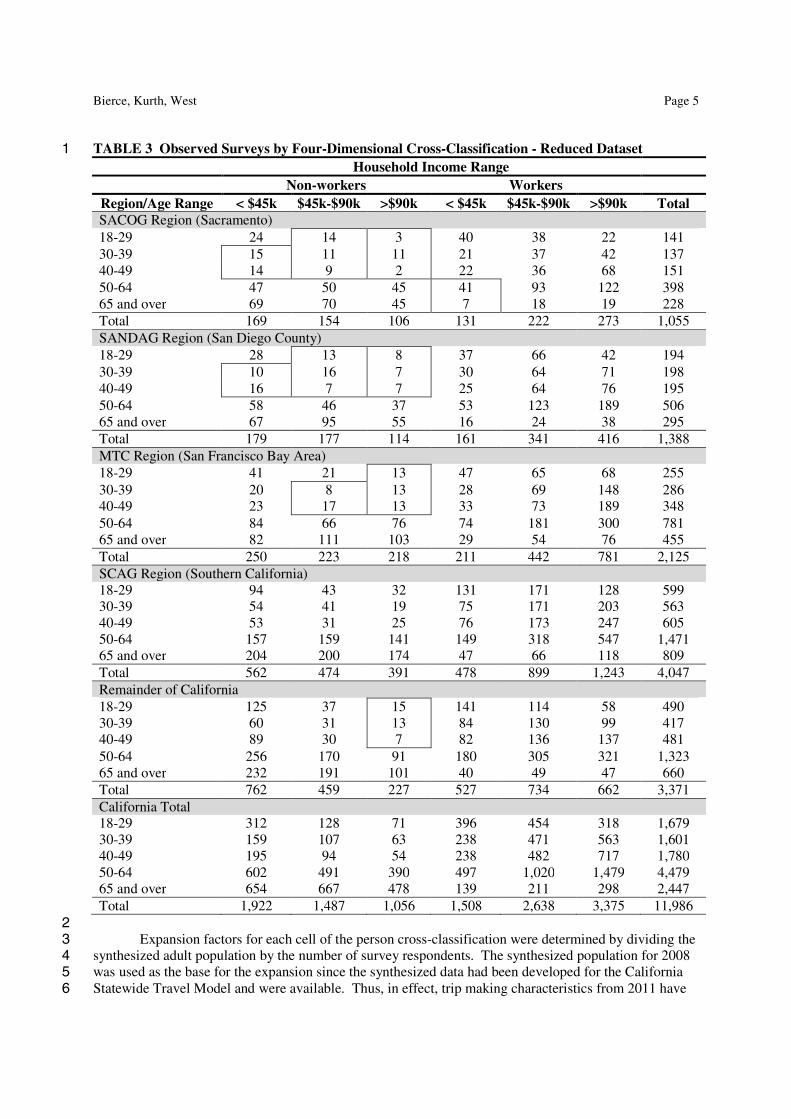
The numbers of surveyed records for each cell of the cross-classification are shown in Table 3. 47 This table displays the numbers of observed records for each cell for the reduced dataset (11,986 records). 48 Aggregations of cells to maintain at least 15 observations for expansion purposes are also displayed. 49
50 51
TRB 2013 Annual Meeting Paper revised from original submittal.
Bierce, Kurth, West Page 4
TABLE 2 Marginal Distributions of Surveys 1 Category Number Percent
Gender Male 5,485 46% Female 6,501 54%
Employment Status (Imputed for Portion of Enhanced Dataset) Worker 7,515 63% Non-Worker 4,471 37%
Age Range 18-29 1,679 14% 30-39 1,601 13% 40-49 1,780 15% 50-64 4,479 37% 65+ 2,447 20%
Household Size 1 2,754 23% 2 5,216 44% 3 1,784 15% 4+ 2,232 19% Mean Size 2.415
Workers in Household 0 2,957 25% 1 4,268 36% 2+ 4,761 40% Mean Value 1.258
Household Vehicles 0 367 3% 1 3,689 31% 2+ 7,930 66% Mean Value 2.018
Household Income Range (Reported – Excluding “Declines”) Under $10,000 382 3% Between $10,000 and $29,999 1,500 13% Between $30,000 and $44,999 1,548 13% Between $45,000 and $59,999 1,464 12% Between $60,000 and $74,999 1,369 11% Between $75,000 and $89,999 1,292 11% Between $90,000 and $104,999 1,107 9% Between $105,000 and $119,999 744 6% Between $120,000 and $134,999 606 5% Between $135,000 and $174,999 875 7% $175,000 or more 1,099 9%
Household Income Range (Imputed for Portion of Enhanced Dataset) Low (Under $45,000) 3,430 29% Medium ($45,000 - $89,999) 4,125 34% High ($90,000 or more) 4,431 37%
Geographic Region SACOG 1,055 9% SANDAG 1,388 12% MTC 2,125 18% SCAG 4,047 34% Remainder of State 3,371 28%
TRB 2013 Annual Meeting Paper revised from original submittal.
Bierce, Kurth, West Page 5
TABLE 3 Observed Surveys by Four-Dimensional Cross-Classification - Reduced Dataset 1 Household Income Range
Non-workers Workers Region/Age Range < $45k $45k-$90k >$90k < $45k $45k-$90k >$90k Total SACOG Region (Sacramento) 18-29 24 14 3 40 38 22 141 30-39 15 11 11 21 37 42 137 40-49 14 9 2 22 36 68 151 50-64 47 50 45 41 93 122 398 65 and over 69 70 45 7 18 19 228 Total 169 154 106 131 222 273 1,055 SANDAG Region (San Diego County) 18-29 28 13 8 37 66 42 194 30-39 10 16 7 30 64 71 198 40-49 16 7 7 25 64 76 195 50-64 58 46 37 53 123 189 506 65 and over 67 95 55 16 24 38 295 Total 179 177 114 161 341 416 1,388 MTC Region (San Francisco Bay Area) 18-29 41 21 13 47 65 68 255 30-39 20 8 13 28 69 148 286 40-49 23 17 13 33 73 189 348 50-64 84 66 76 74 181 300 781 65 and over 82 111 103 29 54 76 455 Total 250 223 218 211 442 781 2,125 SCAG Region (Southern California) 18-29 94 43 32 131 171 128 599 30-39 54 41 19 75 171 203 563 40-49 53 31 25 76 173 247 605 50-64 157 159 141 149 318 547 1,471 65 and over 204 200 174 47 66 118 809 Total 562 474 391 478 899 1,243 4,047 Remainder of California 18-29 125 37 15 141 114 58 490 30-39 60 31 13 84 130 99 417 40-49 89 30 7 82 136 137 481 50-64 256 170 91 180 305 321 1,323 65 and over 232 191 101 40 49 47 660 Total 762 459 227 527 734 662 3,371 California Total 18-29 312 128 71 396 454 318 1,679 30-39 159 107 63 238 471 563 1,601 40-49 195 94 54 238 482 717 1,780 50-64 602 491 390 497 1,020 1,479 4,479 65 and over 654 667 478 139 211 298 2,447 Total 1,922 1,487 1,056 1,508 2,638 3,375 11,986
2 Expansion factors for each cell of the person cross-classification were determined by dividing the 3
synthesized adult population by the number of survey respondents. The synthesized population for 2008 4 was used as the base for the expansion since the synthesized data had been developed for the California 5 Statewide Travel Model and were available. Thus, in effect, trip making characteristics from 2011 have 6
TRB 2013 Annual Meeting Paper revised from original submittal.
Bierce, Kurth, West Page 6
been used to estimate long distance trip making in 2008. For reference purposes, expansion factors varied 1 from 286 to 8,098 with an average expansion factor of 2,308. 2
The wide range for the expansion factor resulted from several factors, including typical 3 characteristics of the survey panelists Harris database and intentional sampling procedures to achieve 4 minimum quotas in geographical regions. The panelists in the Harris database were typically older and 5 wealthier than the population at large due to factors such as access to technology and relative amount of 6 free time available. The intentional oversampling of smaller regions resulted in smaller expansion factors 7 being calculated for those regions, especially in comparison to the two largest regions in the state, the 8 Southern California Association of Governments and Metropolitan Transportation Commission regions. 9
Children under age 18 were not included in the survey database and, thus, were not considered in 10 the estimation of the expansion factors. Rather, their trip-making characteristics were derived using travel 11 group size characteristics reported by adults in households. The survey collected data regarding additional 12 household members who accompanied adult trip-maker reporting in the survey. Those data suggested 13 that the trip frequency for children accompanying adult household members on recreational and other 14 trips was 67 percent of the overall trip rates of adult residents. As would be expected, the data also 15 indicated that children did not accompany adult household members on most commute and business trips. 16 The final adjustment for child travel increased the estimated number of total intrastate long distance trips 17 by about ten percent, from 1,748,000 to 1,925,700. As a reasonableness check, a comparison was made 18 to Highlights of the 2001 National Household Travel Survey <2>, which reported that 25.7 percent of 19 long distance trips were made by persons under 25 years of age. The expanded survey data with the child 20 trip-making adjustment factor resulted in 25.5 percent of total statewide long distance trips being made by 21 persons under the age of 25. 22
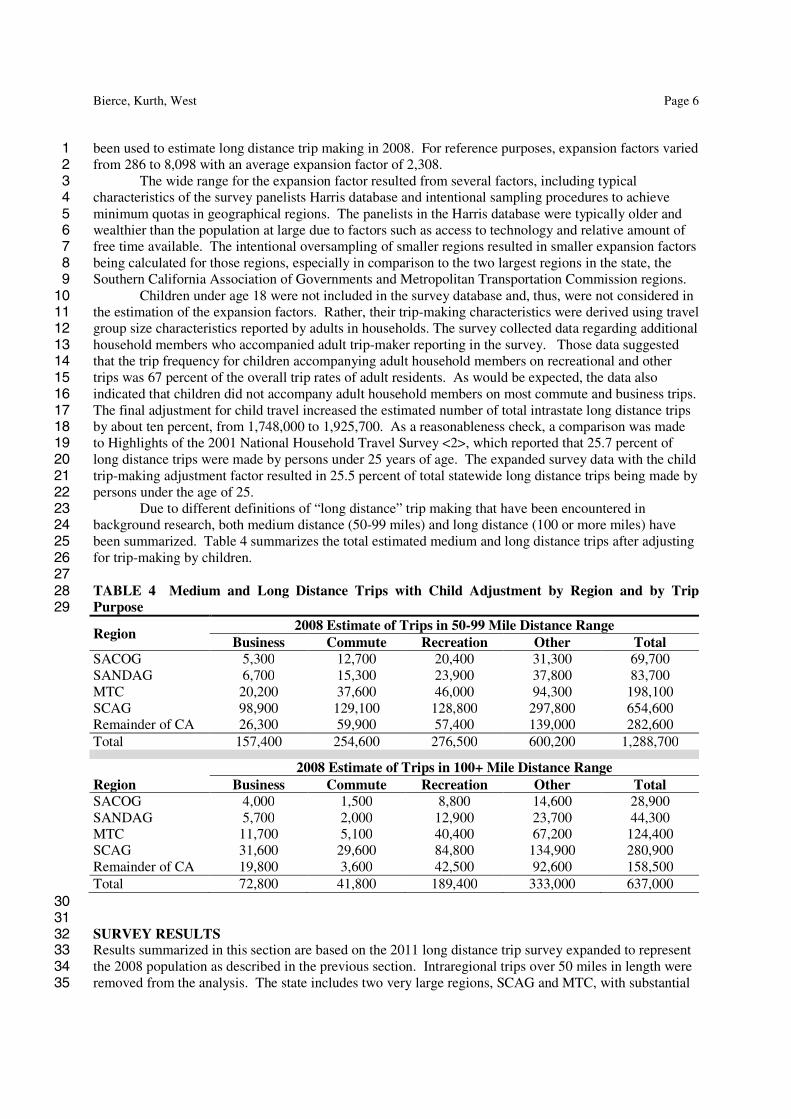
Due to different definitions of “long distance” trip making that have been encountered in 23 background research, both medium distance (50-99 miles) and long distance (100 or more miles) have 24 been summarized. Table 4 summarizes the total estimated medium and long distance trips after adjusting 25 for trip-making by children. 26
27 TABLE 4 Medium and Long Distance Trips with Child Adjustment by Region and by Trip 28 Purpose 29
Region 2008 Estimate of Trips in 50-99 Mile Distance Range
Business Commute Recreation Other Total SACOG 5,300 12,700 20,400 31,300 69,700 SANDAG 6,700 15,300 23,900 37,800 83,700 MTC 20,200 37,600 46,000 94,300 198,100 SCAG 98,900 129,100 128,800 297,800 654,600 Remainder of CA 26,300 59,900 57,400 139,000 282,600 Total 157,400 254,600 276,500 600,200 1,288,700
Region 2008 Estimate of Trips in 100+ Mile Distance Range
Business Commute Recreation Other Total SACOG 4,000 1,500 8,800 14,600 28,900 SANDAG 5,700 2,000 12,900 23,700 44,300 MTC 11,700 5,100 40,400 67,200 124,400 SCAG 31,600 29,600 84,800 134,900 280,900 Remainder of CA 19,800 3,600 42,500 92,600 158,500 Total 72,800 41,800 189,400 333,000 637,000 30 31 SURVEY RESULTS 32 Results summarized in this section are based on the 2011 long distance trip survey expanded to represent 33 the 2008 population as described in the previous section. Intraregional trips over 50 miles in length were 34 removed from the analysis. The state includes two very large regions, SCAG and MTC, with substantial 35
TRB 2013 Annual Meeting Paper revised from original submittal.
Bierce, Kurth, West Page 7
numbers of intraregional trips greater than 50 miles in length. Since the CAHSR3M uses adaptations of 1 the SCAG and MTC regional models to forecast intraregional trips for those regions, the long distance 2 intraregional trips from the survey were removed to avoid double counting. Overall, the expanded survey 3 with adjustment for children identified 1,925,000 long distance trips within the State of California; 4 920,000 of those trips, or 48 percent of the total, were removed, resulting in 1,050,000 long distance 5 interregional trips. 6
Interregional trips were estimated by deleting the intraregional trips from the expanded trip tables. 7 Table 5 summarizes the total medium and long distance interregional trip making for the four major 8 regions in California (MTC, SCAG, Sacramento, and San Diego) and for the rest of California as a whole. 9
10 TABLE 5 Medium and Long Distance Interregional Trips 11
Region
Medium (50-99 Miles) Long (100+ Miles)
All Trips Inter-regional
Proportion of Trips
Removed as Intra-
regional
All Trips Inter-regional
Proportion of Trips
Removed as Intra-
regional SACOG 69,700 49,000 30% 28,900 28,400 2% SANDAG 83,700 59,000 30% 44,300 44,100 0% MTC 198,100 78,200 61% 124,400 96,400 23% SCAG 654,600 119,200 82% 280,900 202,500 28% Remainder of CA 282,600 173,000 39% 158,500 155,200 2% Total 1,288,700 478,400 63% 637,000 526,600 17%
12 Table 5 shows that the removal of intraregional trips resulted in a 63 percent reduction of the 13
medium distance trips from the expanded trip tables and a reduction of 17 percent of the long distance 14 trips from the expanded trip tables. Most of the intraregional trips were removed from the two largest 15 regions, SCAG and MTC. 16
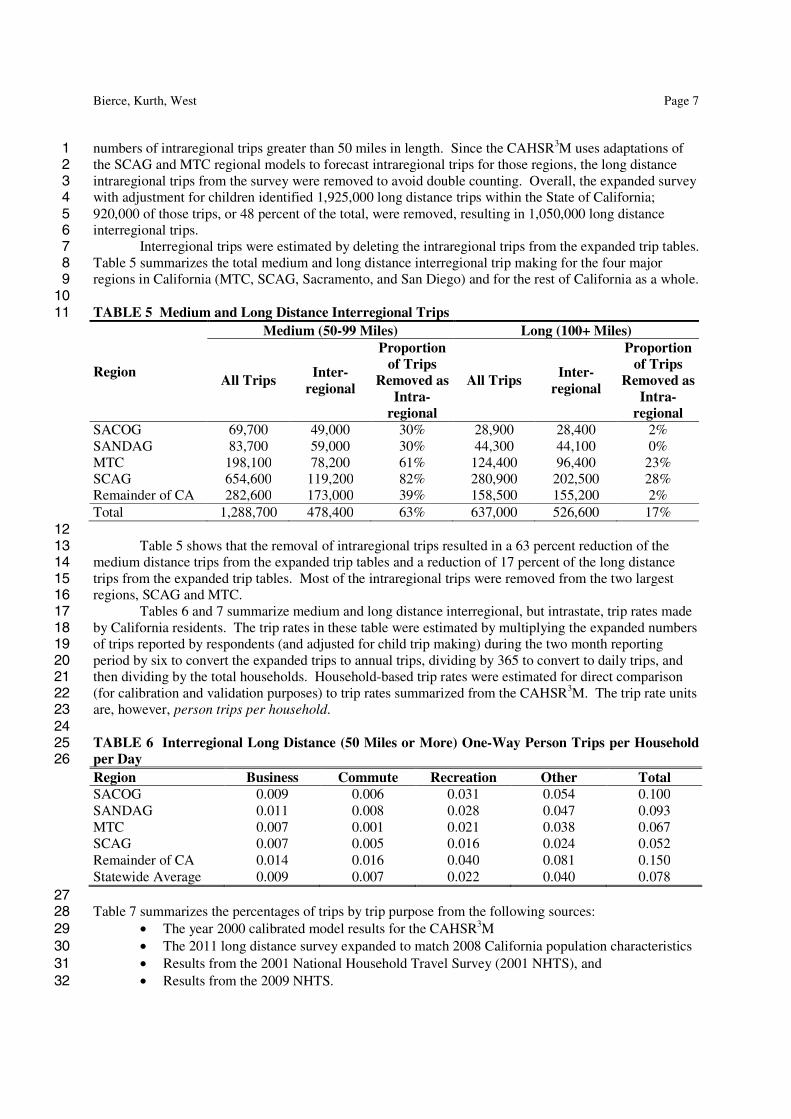
Tables 6 and 7 summarize medium and long distance interregional, but intrastate, trip rates made 17 by California residents. The trip rates in these table were estimated by multiplying the expanded numbers 18 of trips reported by respondents (and adjusted for child trip making) during the two month reporting 19 period by six to convert the expanded trips to annual trips, dividing by 365 to convert to daily trips, and 20 then dividing by the total households. Household-based trip rates were estimated for direct comparison 21 (for calibration and validation purposes) to trip rates summarized from the CAHSR3M. The trip rate units 22 are, however, person trips per household. 23 24 TABLE 6 Interregional Long Distance (50 Miles or More) One-Way Person Trips per Household 25 per Day 26 Region Business Commute Recreation Other Total SACOG 0.009 0.006 0.031 0.054 0.100 SANDAG 0.011 0.008 0.028 0.047 0.093 MTC 0.007 0.001 0.021 0.038 0.067 SCAG 0.007 0.005 0.016 0.024 0.052 Remainder of CA 0.014 0.016 0.040 0.081 0.150 Statewide Average 0.009 0.007 0.022 0.040 0.078
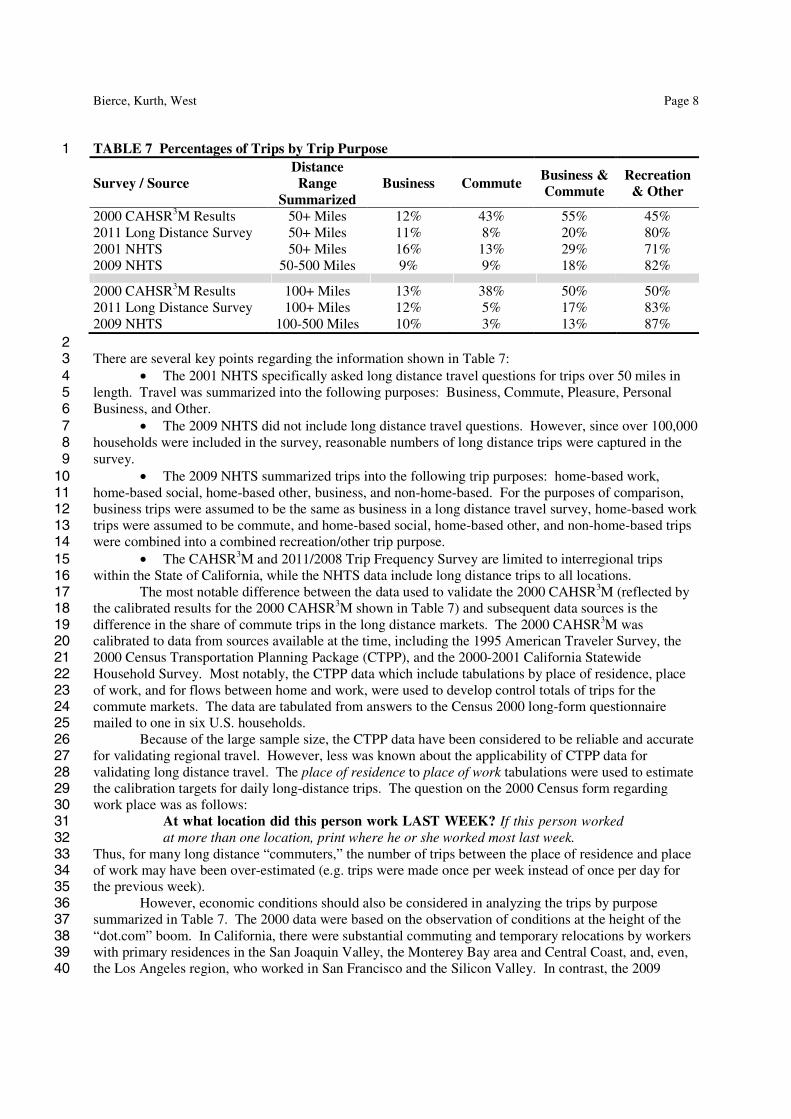
27 Table 7 summarizes the percentages of trips by trip purpose from the following sources: 28
• The year 2000 calibrated model results for the CAHSR3M 29 • The 2011 long distance survey expanded to match 2008 California population characteristics 30 • Results from the 2001 National Household Travel Survey (2001 NHTS), and 31 • Results from the 2009 NHTS. 32
TRB 2013 Annual Meeting Paper revised from original submittal.
Bierce, Kurth, West Page 8
TABLE 7 Percentages of Trips by Trip Purpose 1
Survey / Source Distance Range
Summarized Business Commute Business &
Commute Recreation
& Other
2000 CAHSR3M Results 50+ Miles 12% 43% 55% 45% 2011 Long Distance Survey 50+ Miles 11% 8% 20% 80% 2001 NHTS 50+ Miles 16% 13% 29% 71% 2009 NHTS 50-500 Miles 9% 9% 18% 82% 2000 CAHSR3M Results 100+ Miles 13% 38% 50% 50% 2011 Long Distance Survey 100+ Miles 12% 5% 17% 83% 2009 NHTS 100-500 Miles 10% 3% 13% 87% 2 There are several key points regarding the information shown in Table 7: 3
• The 2001 NHTS specifically asked long distance travel questions for trips over 50 miles in 4 length. Travel was summarized into the following purposes: Business, Commute, Pleasure, Personal 5 Business, and Other. 6
• The 2009 NHTS did not include long distance travel questions. However, since over 100,000 7 households were included in the survey, reasonable numbers of long distance trips were captured in the 8 survey. 9
• The 2009 NHTS summarized trips into the following trip purposes: home-based work, 10 home-based social, home-based other, business, and non-home-based. For the purposes of comparison, 11 business trips were assumed to be the same as business in a long distance travel survey, home-based work 12 trips were assumed to be commute, and home-based social, home-based other, and non-home-based trips 13 were combined into a combined recreation/other trip purpose. 14
• The CAHSR3M and 2011/2008 Trip Frequency Survey are limited to interregional trips 15 within the State of California, while the NHTS data include long distance trips to all locations. 16
The most notable difference between the data used to validate the 2000 CAHSR3M (reflected by 17 the calibrated results for the 2000 CAHSR3M shown in Table 7) and subsequent data sources is the 18 difference in the share of commute trips in the long distance markets. The 2000 CAHSR3M was 19 calibrated to data from sources available at the time, including the 1995 American Traveler Survey, the 20 2000 Census Transportation Planning Package (CTPP), and the 2000-2001 California Statewide 21 Household Survey. Most notably, the CTPP data which include tabulations by place of residence, place 22 of work, and for flows between home and work, were used to develop control totals of trips for the 23 commute markets. The data are tabulated from answers to the Census 2000 long-form questionnaire 24 mailed to one in six U.S. households. 25
Because of the large sample size, the CTPP data have been considered to be reliable and accurate 26 for validating regional travel. However, less was known about the applicability of CTPP data for 27 validating long distance travel. The place of residence to place of work tabulations were used to estimate 28 the calibration targets for daily long-distance trips. The question on the 2000 Census form regarding 29 work place was as follows: 30
At what location did this person work LAST WEEK? If this person worked 31 at more than one location, print where he or she worked most last week. 32
Thus, for many long distance “commuters,” the number of trips between the place of residence and place 33 of work may have been over-estimated (e.g. trips were made once per week instead of once per day for 34 the previous week). 35
However, economic conditions should also be considered in analyzing the trips by purpose 36 summarized in Table 7. The 2000 data were based on the observation of conditions at the height of the 37 “dot.com” boom. In California, there were substantial commuting and temporary relocations by workers 38 with primary residences in the San Joaquin Valley, the Monterey Bay area and Central Coast, and, even, 39 the Los Angeles region, who worked in San Francisco and the Silicon Valley. In contrast, the 2009 40
TRB 2013 Annual Meeting Paper revised from original submittal.
Bierce, Kurth, West Page 9
NHTS and the 2011 long distance travel survey were collected either during the “great recession” or 1 during the slow recovery afterwards, where such long distance commuting became less prevalent. 2
The on-line survey mechanism used to collect long distance survey data in 2011 may also have 3 been biased against long distance commuters since California residents who engaged in daily long 4 distance commutes might not have had the free time required to respond to on-line surveys. Unlike the 5 2000-2001 California Statewide Household Travel Survey, the 2012-2013 version of the survey includes 6 a long-distance trip component. Data from the 2012-2013 will be analyzed when they are available. 7
Including intraregional trips and trips made to out-of-state locations, Californians made about 8 0.093 round trip journeys per household per day in 2008. In comparison, the 2001 National Household 9 Travel Survey reported that Americans made approximately 0.067 trips per household per day in 2001, 10 indicating that Californian’s 2008 long distance trip making was approximately 40 percent greater than 11 the national statistic for 2001. However, a recent long distance travel survey completed in the Colorado 12 <3> reported an average trip rate similar to the California data: 0.097 person trips over 50 miles per 13 household per day. 14
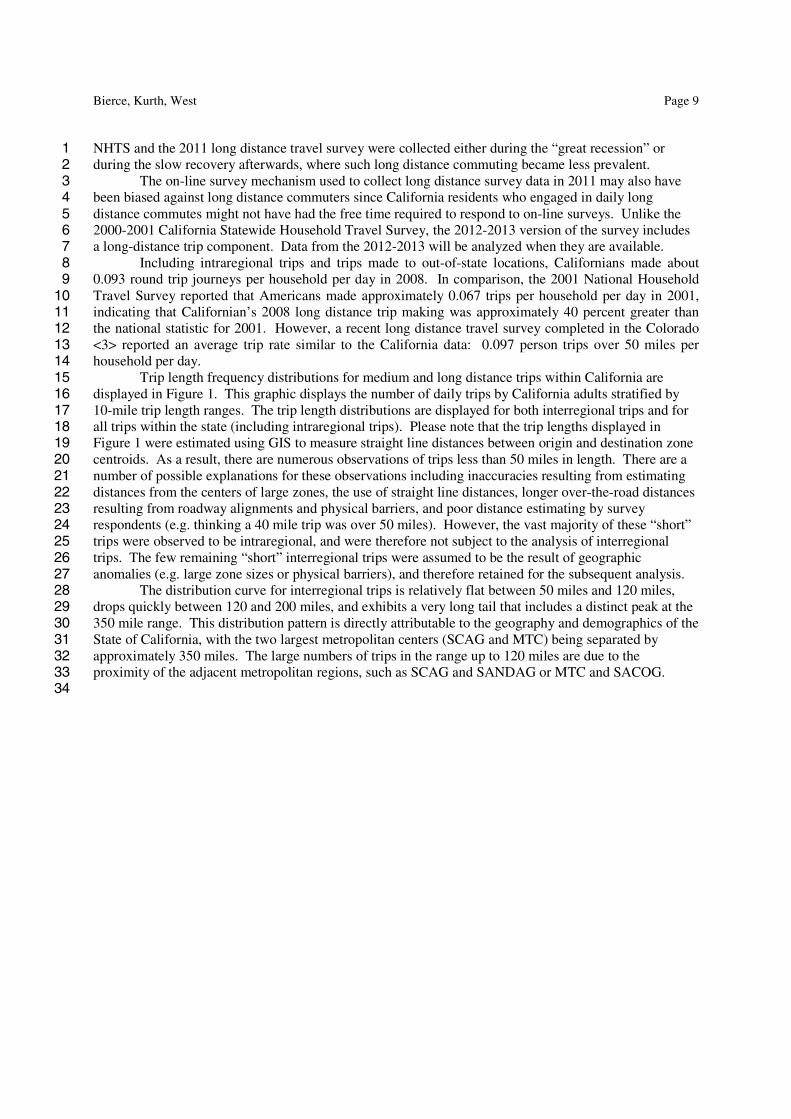
Trip length frequency distributions for medium and long distance trips within California are 15 displayed in Figure 1. This graphic displays the number of daily trips by California adults stratified by 16 10-mile trip length ranges. The trip length distributions are displayed for both interregional trips and for 17 all trips within the state (including intraregional trips). Please note that the trip lengths displayed in 18 Figure 1 were estimated using GIS to measure straight line distances between origin and destination zone 19 centroids. As a result, there are numerous observations of trips less than 50 miles in length. There are a 20 number of possible explanations for these observations including inaccuracies resulting from estimating 21 distances from the centers of large zones, the use of straight line distances, longer over-the-road distances 22 resulting from roadway alignments and physical barriers, and poor distance estimating by survey 23 respondents (e.g. thinking a 40 mile trip was over 50 miles). However, the vast majority of these “short” 24 trips were observed to be intraregional, and were therefore not subject to the analysis of interregional 25 trips. The few remaining “short” interregional trips were assumed to be the result of geographic 26 anomalies (e.g. large zone sizes or physical barriers), and therefore retained for the subsequent analysis. 27
The distribution curve for interregional trips is relatively flat between 50 miles and 120 miles, 28 drops quickly between 120 and 200 miles, and exhibits a very long tail that includes a distinct peak at the 29 350 mile range. This distribution pattern is directly attributable to the geography and demographics of the 30 State of California, with the two largest metropolitan centers (SCAG and MTC) being separated by 31 approximately 350 miles. The large numbers of trips in the range up to 120 miles are due to the 32 proximity of the adjacent metropolitan regions, such as SCAG and SANDAG or MTC and SACOG. 33
34
TRB 2013 Annual Meeting Paper revised from original submittal.
Bierce, Kurth, West Page 10
1 FIGURE 1 Trip Length Frequency Distribution for Medium and Long Distance Trips in 2 California 3
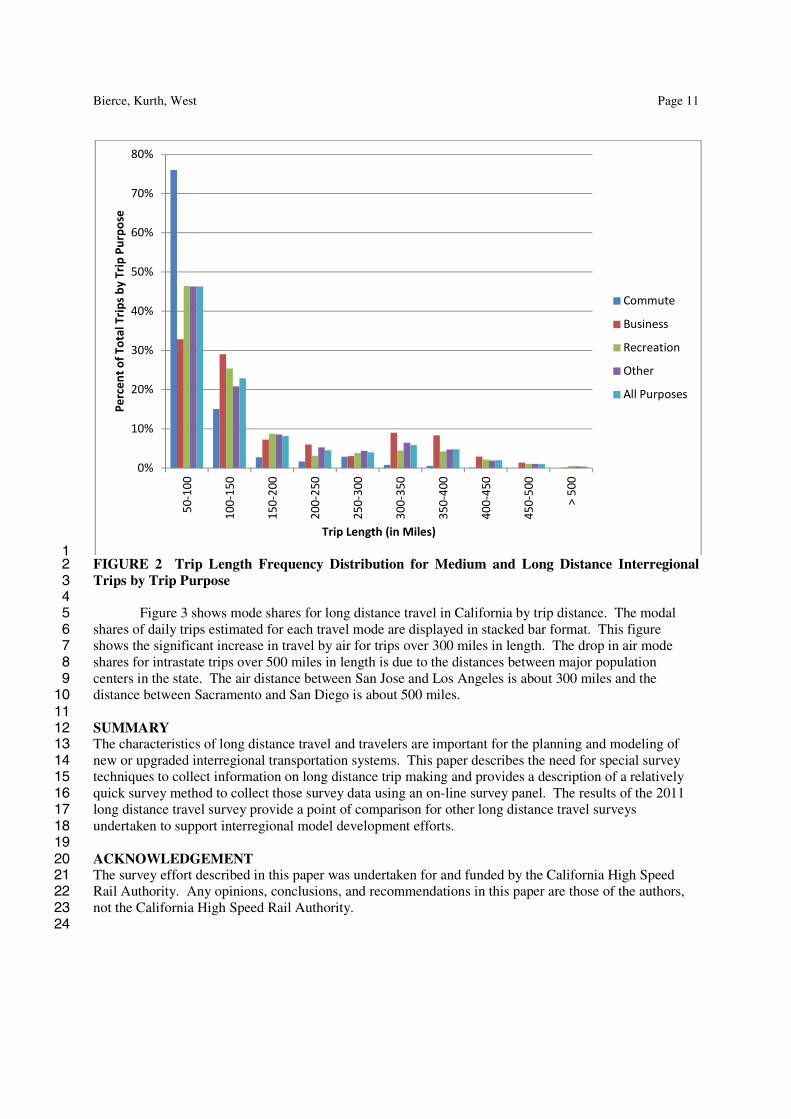
4 Trip length frequency distributions for long distance interregional trips by trip purpose are 5
displayed in Figure 2. This graphic, which aggregates the trips into 50-mile ranges, shows that the trip 6 length frequency distributions for business and commute trip purposes are different from the distributions 7 for recreational and other trip purposes. The trip distribution for the commute trips is weighted heavily to 8 the shorter trip lengths, with fewer than five percent of the long distance commute trips being over 150 9 miles in length. The trip distribution for the business trips shows a significant share of long trips with 10 approximately 20 percent of the long distance business trips being over 300 miles in length. This result is 11 reflective of the large amount of business travel between the major metropolitan regions of the state. 12
0
50000
100000
150000
200000
250000
300000<
30
40
-50
60
-70
80
-90
10
0-1
10
12
0-1
30
14
0-1
50
16
0-1
70
18
0-1
90
20
0-2
10
22
0-2
30
24
0-2
50
26
0-2
70
28
0-2
90
30
0-3
10
32
0-3
30
34
0-3
50
36
0-3
70
38
0-3
90
40
0-4
10
42
0-4
30
44
0-4
50
46
0-4
70
48
0-4
90
All LD Trips Inter-Regional Trips
TRB 2013 Annual Meeting Paper revised from original submittal.
Bierce, Kurth, West Page 11
1 FIGURE 2 Trip Length Frequency Distribution for Medium and Long Distance Interregional 2 Trips by Trip Purpose 3
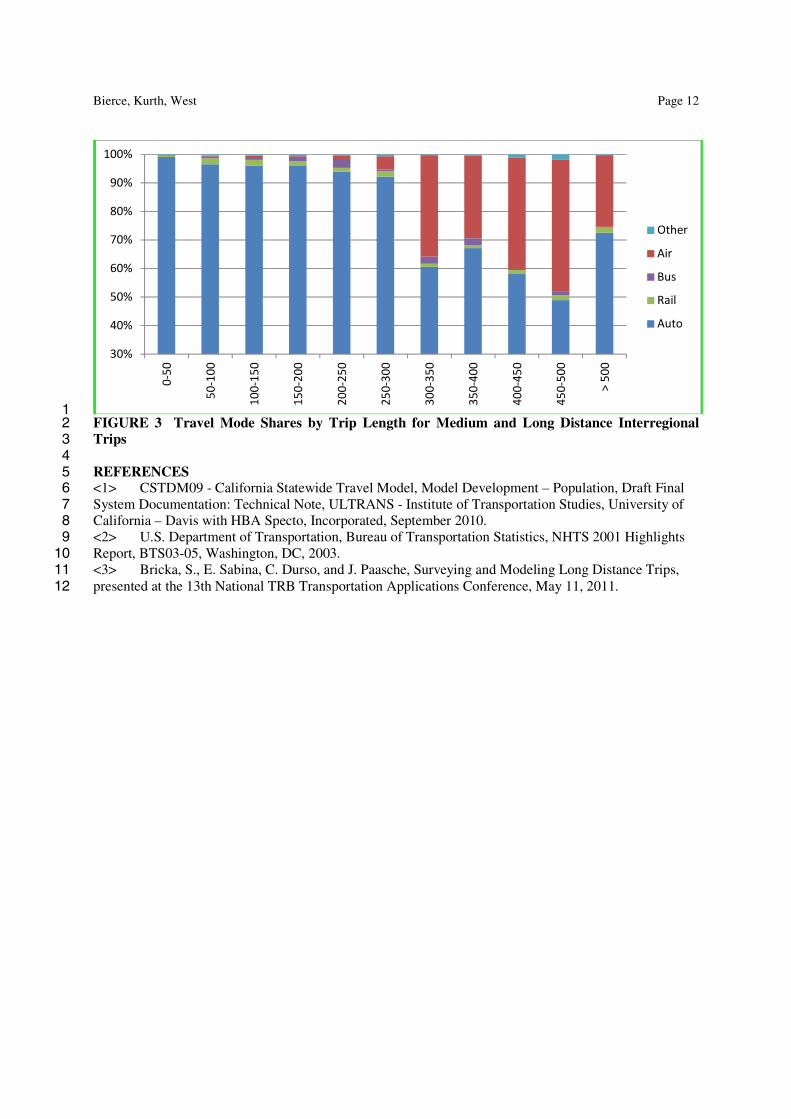
4 Figure 3 shows mode shares for long distance travel in California by trip distance. The modal 5
shares of daily trips estimated for each travel mode are displayed in stacked bar format. This figure 6 shows the significant increase in travel by air for trips over 300 miles in length. The drop in air mode 7 shares for intrastate trips over 500 miles in length is due to the distances between major population 8 centers in the state. The air distance between San Jose and Los Angeles is about 300 miles and the 9 distance between Sacramento and San Diego is about 500 miles. 10 11 SUMMARY 12 The characteristics of long distance travel and travelers are important for the planning and modeling of 13 new or upgraded interregional transportation systems. This paper describes the need for special survey 14 techniques to collect information on long distance trip making and provides a description of a relatively 15 quick survey method to collect those survey data using an on-line survey panel. The results of the 2011 16 long distance travel survey provide a point of comparison for other long distance travel surveys 17 undertaken to support interregional model development efforts. 18 19 ACKNOWLEDGEMENT 20 The survey effort described in this paper was undertaken for and funded by the California High Speed 21 Rail Authority. Any opinions, conclusions, and recommendations in this paper are those of the authors, 22 not the California High Speed Rail Authority. 23
24
0%
10%
20%
30%
40%
50%
60%
70%
80%
50
-10
0
10
0-1
50
15
0-2
00
20
0-2
50
25
0-3
00
30
0-3
50
35
0-4
00
40
0-4
50
45
0-5
00
> 5
00
Pe
rce
nt
of
To
tal
Tri
ps
by
Tri
p P
urp
ose
Trip Length (in Miles)
Commute
Business
Recreation
Other
All Purposes
TRB 2013 Annual Meeting Paper revised from original submittal.
Bierce, Kurth, West Page 12
1 FIGURE 3 Travel Mode Shares by Trip Length for Medium and Long Distance Interregional 2 Trips 3 4 REFERENCES 5 <1> CSTDM09 - California Statewide Travel Model, Model Development – Population, Draft Final 6 System Documentation: Technical Note, ULTRANS - Institute of Transportation Studies, University of 7 California – Davis with HBA Specto, Incorporated, September 2010. 8 <2> U.S. Department of Transportation, Bureau of Transportation Statistics, NHTS 2001 Highlights 9 Report, BTS03-05, Washington, DC, 2003. 10 <3> Bricka, S., E. Sabina, C. Durso, and J. Paasche, Surveying and Modeling Long Distance Trips, 11 presented at the 13th National TRB Transportation Applications Conference, May 11, 2011. 12
30%
40%
50%
60%
70%
80%
90%
100%0
-50
50
-10
0
10
0-1
50
15
0-2
00
20
0-2
50
25
0-3
00
30
0-3
50
35
0-4
00
40
0-4
50
45
0-5
00
> 5
00
Other
Air
Bus
Rail
Auto
TRB 2013 Annual Meeting Paper revised from original submittal.