Embed Size (px)
Citation preview

London’s Strategic
Transport Models
TfL Planning

1
PAGE INTENTIONALLY LEFT BLANK
2
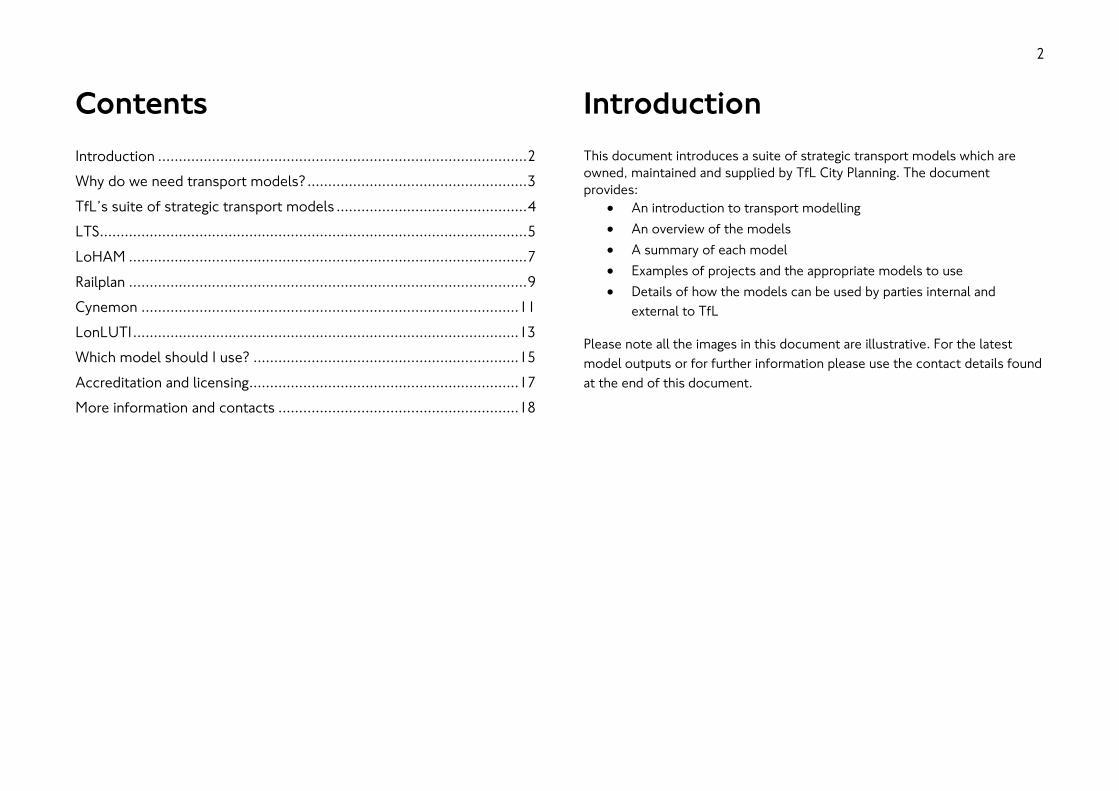
Contents
Introduction ......................................................................................... 2
Why do we need transport models? ..................................................... 3
TfL’s suite of strategic transport models .............................................. 4
LTS ....................................................................................................... 5
LoHAM ................................................................................................ 7
Railplan ................................................................................................ 9
Cynemon ........................................................................................... 11
LonLUTI ............................................................................................. 13
Which model should I use? ................................................................ 15
Accreditation and licensing ................................................................. 17
More information and contacts .......................................................... 18
Introduction
This document introduces a suite of strategic transport models which are
owned, maintained and supplied by TfL City Planning. The document
provides:
An introduction to transport modelling
An overview of the models
A summary of each model
Examples of projects and the appropriate models to use
Details of how the models can be used by parties internal and
external to TfL
Please note all the images in this document are illustrative. For the latest
model outputs or for further information please use the contact details found
at the end of this document.
3
Why do we need transport
models?
Investment in transport can bring about a range of economic, social and
environmental benefits. Building new public transport links, providing space
for cyclists, improving highways, and changing fares and tolls are all examples
of investment that have the potential to make it easier for people to move
around, or address the problems of public transport crowding and road
congestion.
However, with limited financial resources and a variety of options, how can
we tell which transport improvements are the best to invest in? We need to
predict the impact of each proposal on people’s travel decisions and the
resulting crowding and congestion impacts against a backdrop of changes in
population, employment and other economic factors. Transport models are
tools which help to provide a robust and consistent evidence base for data
and analysis when carrying out these predictions.
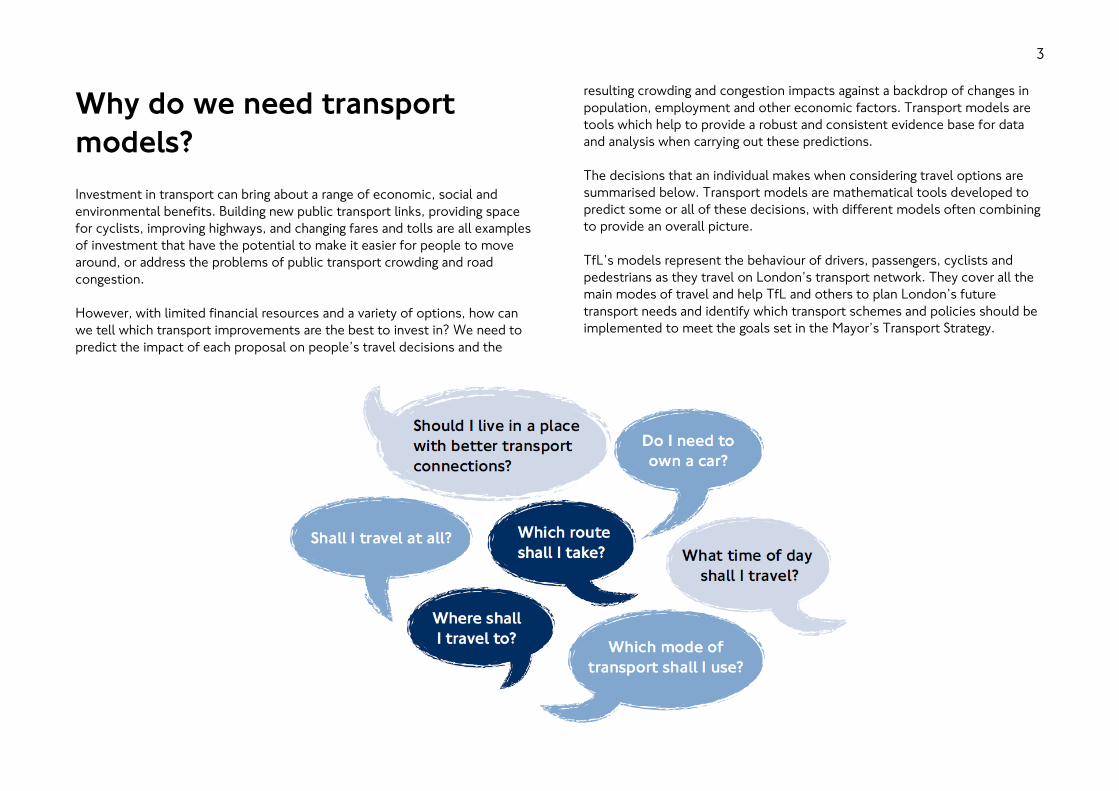
The decisions that an individual makes when considering travel options are
summarised below. Transport models are mathematical tools developed to
predict some or all of these decisions, with different models often combining
to provide an overall picture.
TfL’s models represent the behaviour of drivers, passengers, cyclists and
pedestrians as they travel on London’s transport network. They cover all the
main modes of travel and help TfL and others to plan London’s future
transport needs and identify which transport schemes and policies should be
implemented to meet the goals set in the Mayor’s Transport Strategy.
4
TfL’s suite of strategic transport models
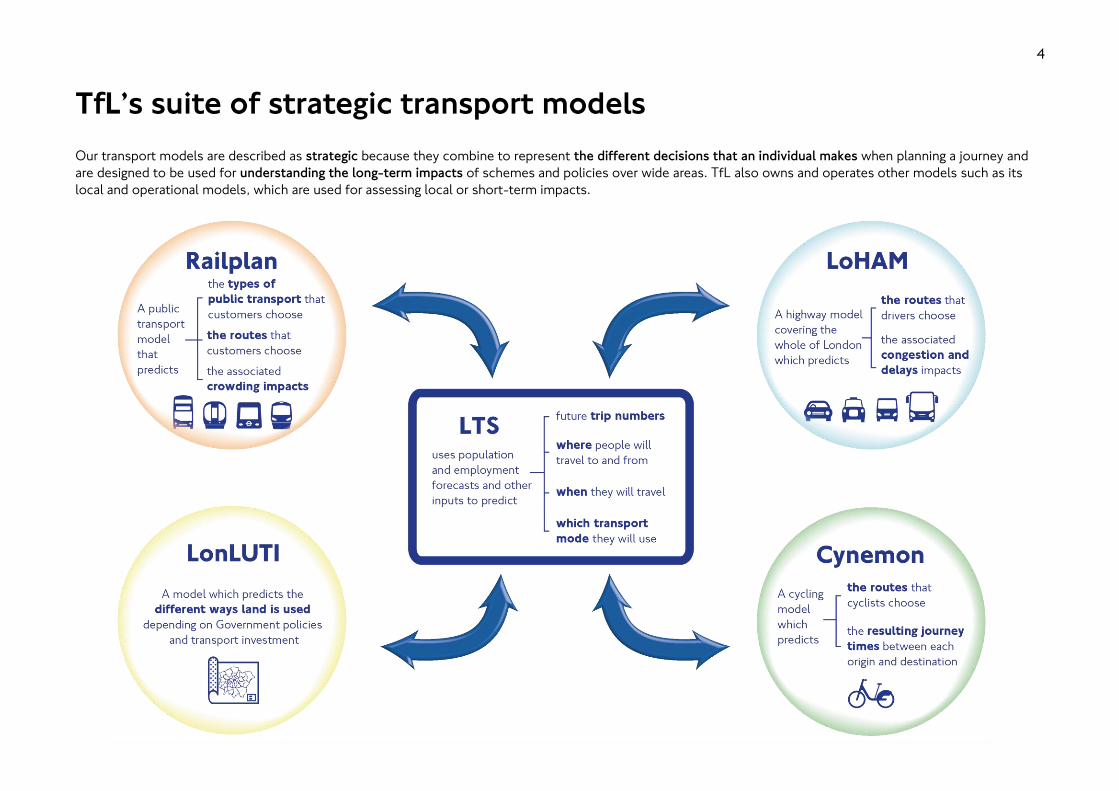
Our transport models are described as strategic because they combine to represent the different decisions that an individual makes when planning a journey and
are designed to be used for understanding the long-term impacts of schemes and policies over wide areas. TfL also owns and operates other models such as its
local and operational models, which are used for assessing local or short-term impacts.
5
LTS
Overview
The London Transportation Studies model is a multi-modal strategic
transport model of London and the surrounding area. LTS can model how
many trips there are likely to be, their origins and destinations and their
modes of transport.
LTS has been developed over a number of decades based on extensive data
sources which inform its representation of travel behaviour and trends. It is
developed to meet ever-changing needs and policy requirements with careful
adherence to industry guidelines and the leadership and review of experts in
the field of transport modelling. In particular, the Department for Transport’s
Transport Analysis Guidance (WebTAG) has been followed to ensure the
model is robust and reliable. Details of the work undertaken have been
documented in reports which are available on request.
LTS uses Greater London Authority forecast assumptions on population and
employment as one of the inputs for modelling future trip numbers. LTS
estimates how travel in London might respond to:
Changes in London’s population and employment
New transport infrastructure and services
Policy interventions eg new fare systems
Macroeconomic factors eg fuel prices
Other factors affecting travel in London such as the number of
people owning a car
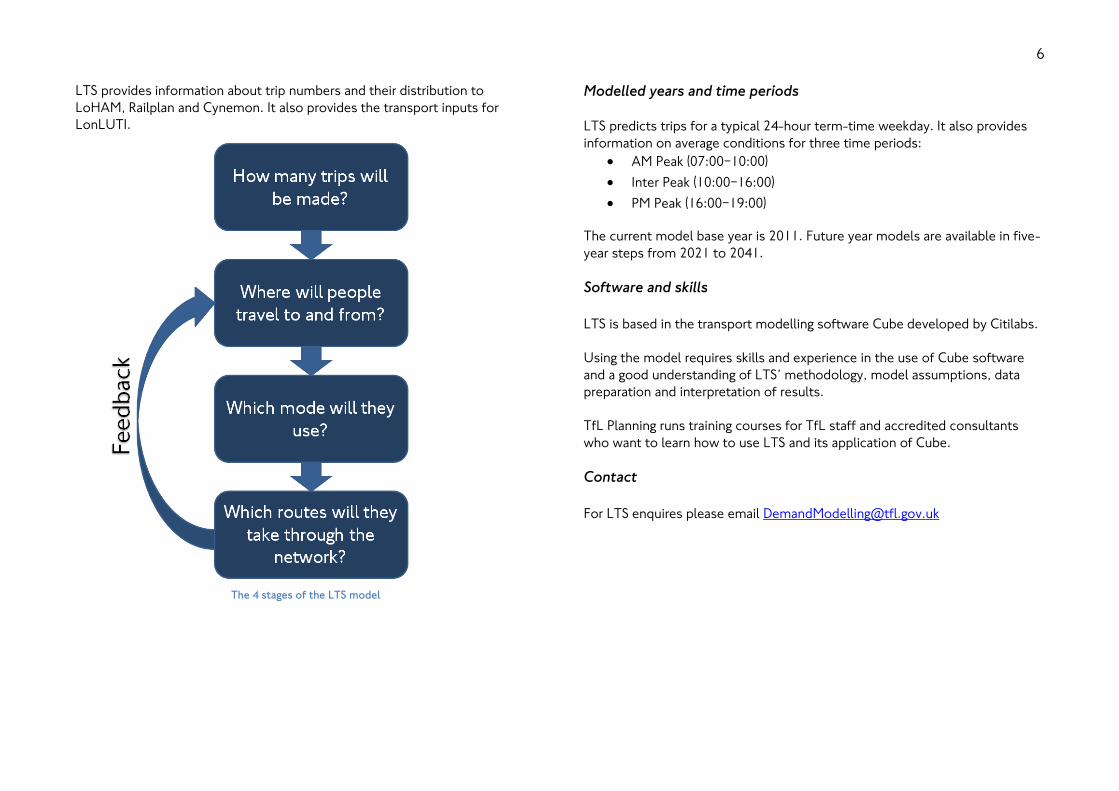
The model works in four stages, as illustrated opposite. The first three stages
are carried out in the demand model and the fourth in the network
assignment models, which for public transport is Railplan. The transport
modes modelled are car, public transport (London Bus, National Rail,
Underground, Overground, Docklands Light Railway and Tramlink), cycling and
walking. LTS also models light goods vehicles, other goods vehicles, coaches
and taxis.
Outputs
Data extracted from a number of modelled scenarios can be used to assess
the impact of a transport scheme or development. Mode share, trip numbers,
and road and public transport conditions can be analysed at a regional, sub-
regional or borough level. The outputs can be used to develop business cases
and as inputs into economic appraisal.
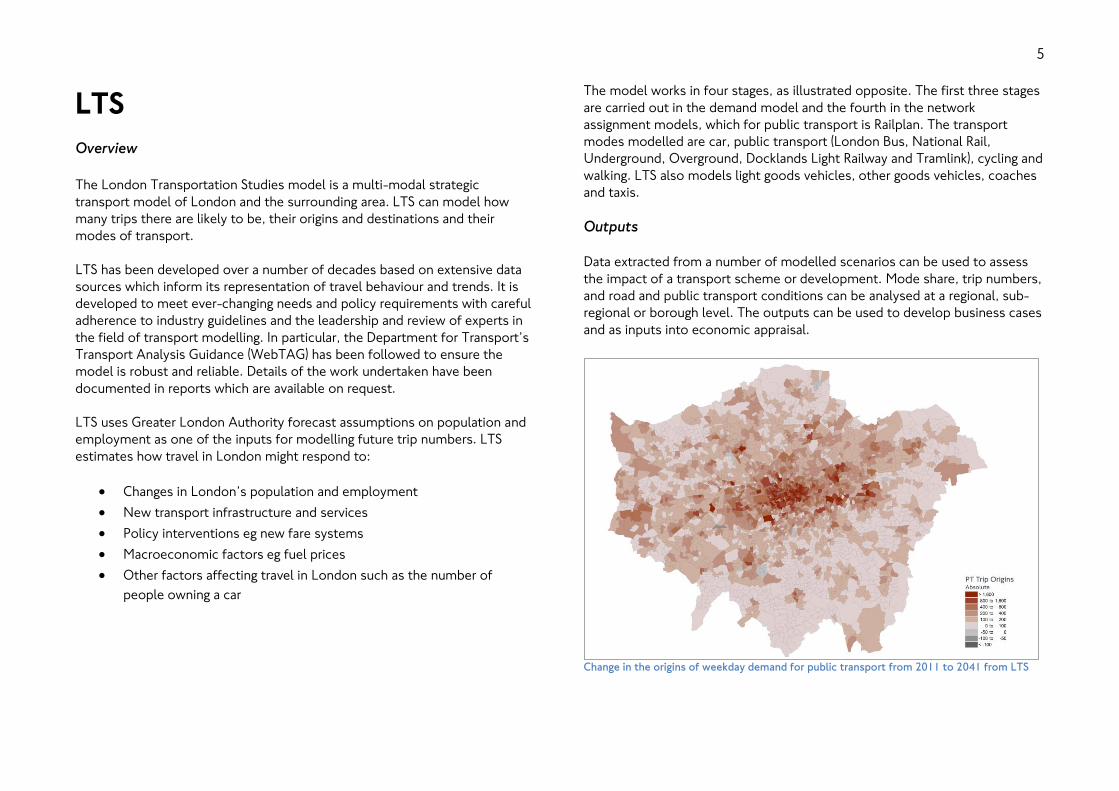
Change in the origins of weekday demand for public transport from 2011 to 2041 from LTS
6
LTS provides information about trip numbers and their distribution to
LoHAM, Railplan and Cynemon. It also provides the transport inputs for
LonLUTI.
The 4 stages of the LTS model
Modelled years and time periods
LTS predicts trips for a typical 24-hour term-time weekday. It also provides
information on average conditions for three time periods:
AM Peak (07:00−10:00)
Inter Peak (10:00−16:00)
PM Peak (16:00−19:00)
The current model base year is 2011. Future year models are available in five-
year steps from 2021 to 2041.
Software and skills
LTS is based in the transport modelling software Cube developed by Citilabs.
Using the model requires skills and experience in the use of Cube software
and a good understanding of LTS’ methodology, model assumptions, data
preparation and interpretation of results.
TfL Planning runs training courses for TfL staff and accredited consultants
who want to learn how to use LTS and its application of Cube.
Contact
For LTS enquires please email [email protected]
7
LoHAM
Overview
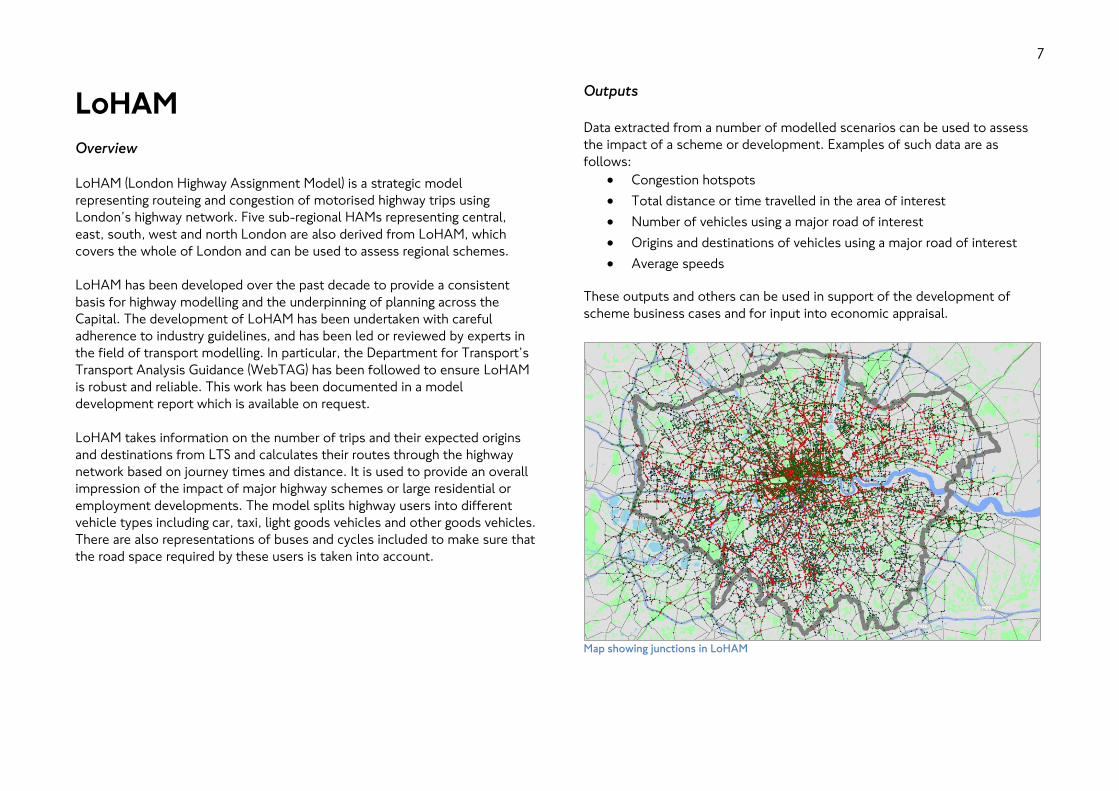
LoHAM (London Highway Assignment Model) is a strategic model
representing routeing and congestion of motorised highway trips using
London’s highway network. Five sub-regional HAMs representing central,
east, south, west and north London are also derived from LoHAM, which
covers the whole of London and can be used to assess regional schemes.
LoHAM has been developed over the past decade to provide a consistent
basis for highway modelling and the underpinning of planning across the
Capital. The development of LoHAM has been undertaken with careful
adherence to industry guidelines, and has been led or reviewed by experts in
the field of transport modelling. In particular, the Department for Transport’s
Transport Analysis Guidance (WebTAG) has been followed to ensure LoHAM
is robust and reliable. This work has been documented in a model
development report which is available on request.
LoHAM takes information on the number of trips and their expected origins
and destinations from LTS and calculates their routes through the highway
network based on journey times and distance. It is used to provide an overall
impression of the impact of major highway schemes or large residential or
employment developments. The model splits highway users into different
vehicle types including car, taxi, light goods vehicles and other goods vehicles.
There are also representations of buses and cycles included to make sure that
the road space required by these users is taken into account.
Outputs
Data extracted from a number of modelled scenarios can be used to assess
the impact of a scheme or development. Examples of such data are as
follows:
Congestion hotspots
Total distance or time travelled in the area of interest
Number of vehicles using a major road of interest
Origins and destinations of vehicles using a major road of interest
Average speeds
These outputs and others can be used in support of the development of
scheme business cases and for input into economic appraisal.
Map showing junctions in LoHAM
8
Modelled years and time periods
Three models, representing key time periods during the day, have been
developed for LoHAM. These time periods are:
AM Peak (08:00-09:00)
Inter Peak (an average hour between 10:00 and 16:00)
PM Peak (17:00-18:00)
The model base year is 2012. Future year models are available in line with LTS
for 2021, 2031 and 2041.
Software and skills
LoHAM is based in the transport modelling software SATURN developed by
Atkins.
Using the model requires skills and experience in the use of SATURN and a
good understanding of the HAM Modelling Guidance, which is available on
request.
Contact
For LoHAM enquires please email [email protected]
9
Railplan
Overview
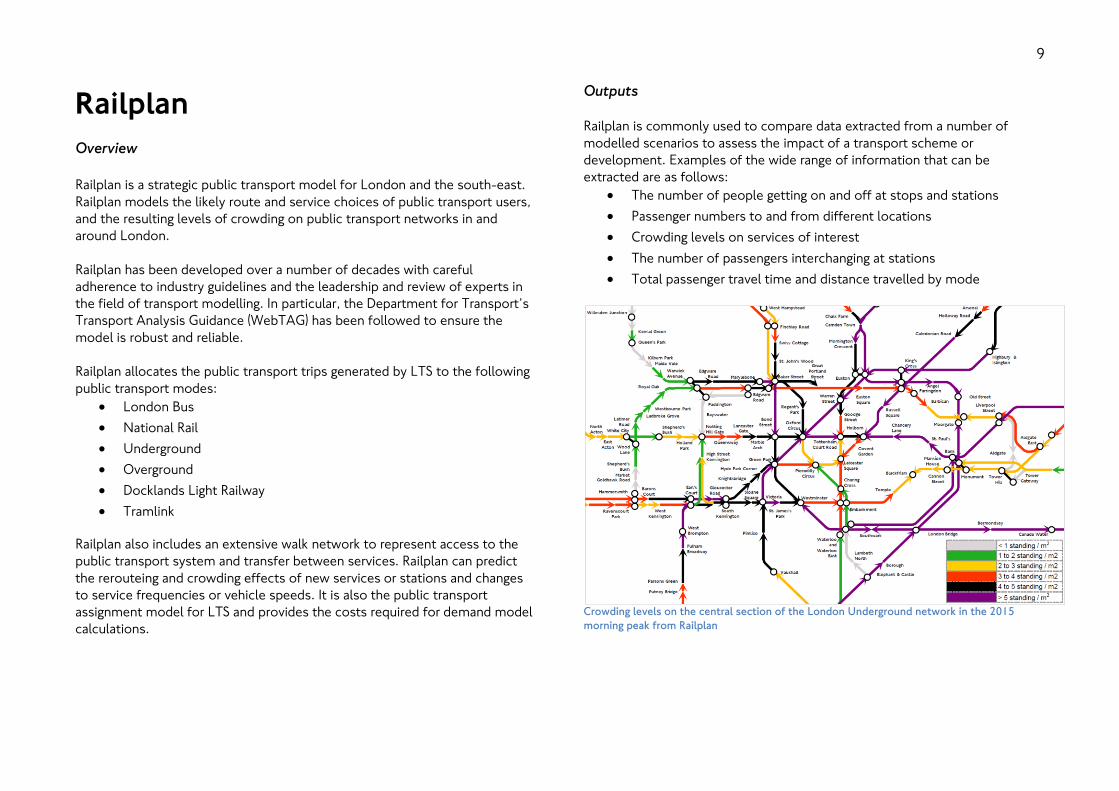
Railplan is a strategic public transport model for London and the south-east.
Railplan models the likely route and service choices of public transport users,
and the resulting levels of crowding on public transport networks in and
around London.
Railplan has been developed over a number of decades with careful
adherence to industry guidelines and the leadership and review of experts in
the field of transport modelling. In particular, the Department for Transport’s
Transport Analysis Guidance (WebTAG) has been followed to ensure the
model is robust and reliable.
Railplan allocates the public transport trips generated by LTS to the following
public transport modes:
London Bus
National Rail
Underground
Overground
Docklands Light Railway
Tramlink
Railplan also includes an extensive walk network to represent access to the
public transport system and transfer between services. Railplan can predict
the rerouteing and crowding effects of new services or stations and changes
to service frequencies or vehicle speeds. It is also the public transport
assignment model for LTS and provides the costs required for demand model
calculations.
Outputs
Railplan is commonly used to compare data extracted from a number of
modelled scenarios to assess the impact of a transport scheme or
development. Examples of the wide range of information that can be
extracted are as follows:
The number of people getting on and off at stops and stations
Passenger numbers to and from different locations
Crowding levels on services of interest
The number of passengers interchanging at stations
Total passenger travel time and distance travelled by mode
Crowding levels on the central section of the London Underground network in the 2015
morning peak from Railplan
10
These outputs and others can be used in support of the development of
scheme business cases and for input into economic appraisal. Railplan also
provides journey time information for display in TfL’s connectivity tool,
WebCAT.
Modelled years and time periods
Railplan represents average weekday conditions for three key time periods
during the day. The periods are:
AM Peak (07:00−10:00)
Inter Peak (10:00−16:00)
PM Peak (16:00−19:00)
The model base year is 2011. Future year models are available in five-year
steps from 2021 to 2041. The models for these years include up-to-date
plans for infrastructure schemes and the latest population, employment and
economic forecasts.
Software and skills
Operating the model requires experience of Cube software and a good
understanding of Railplan’s methodology, public transport networks, model
assumptions, data preparation and interpretation of results.
Contact
For Railplan enquires please email [email protected]
11
Cynemon
Overview
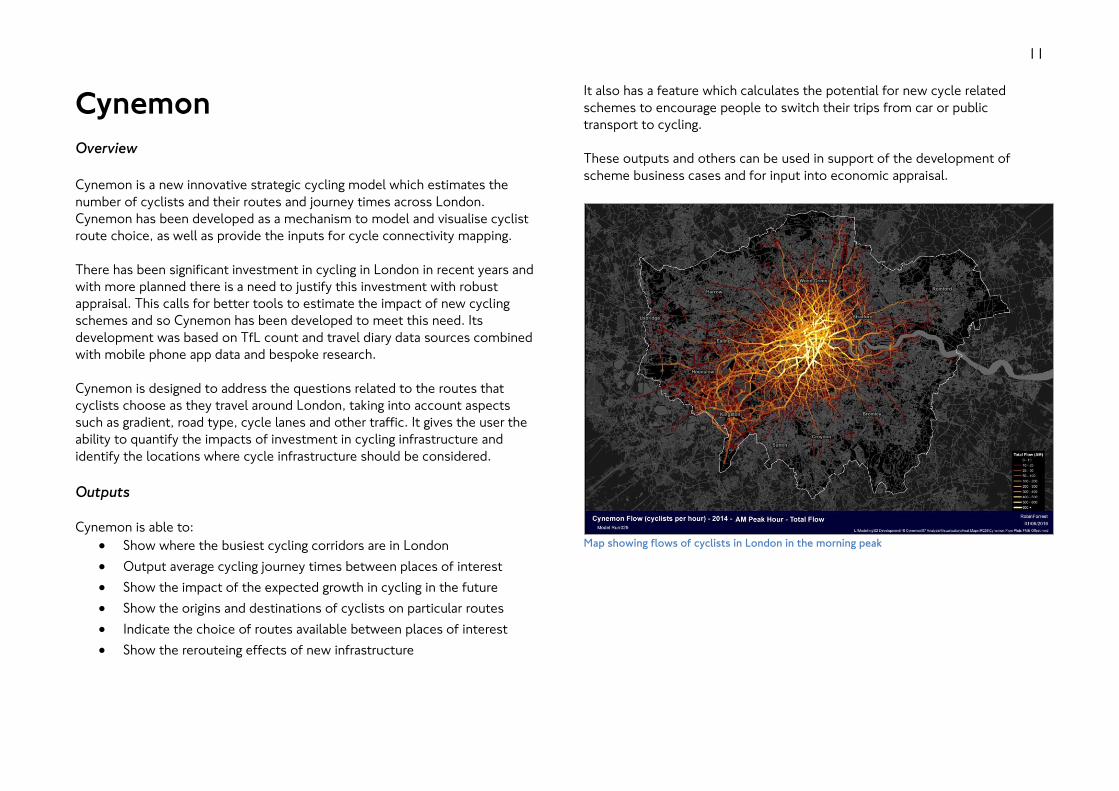
Cynemon is a new innovative strategic cycling model which estimates the
number of cyclists and their routes and journey times across London.
Cynemon has been developed as a mechanism to model and visualise cyclist
route choice, as well as provide the inputs for cycle connectivity mapping.
There has been significant investment in cycling in London in recent years and
with more planned there is a need to justify this investment with robust
appraisal. This calls for better tools to estimate the impact of new cycling
schemes and so Cynemon has been developed to meet this need. Its
development was based on TfL count and travel diary data sources combined
with mobile phone app data and bespoke research.
Cynemon is designed to address the questions related to the routes that
cyclists choose as they travel around London, taking into account aspects
such as gradient, road type, cycle lanes and other traffic. It gives the user the
ability to quantify the impacts of investment in cycling infrastructure and
identify the locations where cycle infrastructure should be considered.
Outputs
Cynemon is able to:
Show where the busiest cycling corridors are in London
Output average cycling journey times between places of interest
Show the impact of the expected growth in cycling in the future
Show the origins and destinations of cyclists on particular routes
Indicate the choice of routes available between places of interest
Show the rerouteing effects of new infrastructure
It also has a feature which calculates the potential for new cycle related
schemes to encourage people to switch their trips from car or public
transport to cycling.
These outputs and others can be used in support of the development of
scheme business cases and for input into economic appraisal.
Map showing flows of cyclists in London in the morning peak
12
Modelled years and time periods
Three models, representing key time periods during an average weekday, have
been developed for Cynemon. These time periods are:
AM Peak (08:00-09:00)
Inter Peak (an average hour between 10:00 and 16:00)
PM Peak (17:00-18:00)
The model base year is 2014. Future year models are available for 2021, 2031
and 2041.
Software and skills
Cynemon is based in the transport modelling software Cube developed by
Citilabs.
Using the model requires skills and experience in the use of Cube and a good
understanding of the Cynemon model setup.
Contact
For Cynemon enquires please email [email protected]
13
LonLUTI
Overview
The London Land-use and Transport Interaction Model (LonLUTI) can assess
the land-use impact of transport schemes and provide analysis of the
demographic, economic and transport outcomes of land-use proposals. The
term ‘land-use’ in this context refers mainly to activities that use space – in
particular, where people live and work.
LonLUTI has been developed over the past decade with careful adherence to
industry guidelines and the leadership and review of experts in the field of
transport modelling. In particular, the Department for Transport’s Transport
Analysis Guidance (WebTAG) has been followed to ensure the model is
robust and reliable. Experts from consultancies and TfL staff formed a team
of experienced transport modellers that focused on delivering LonLUTI to the
highest standards possible.
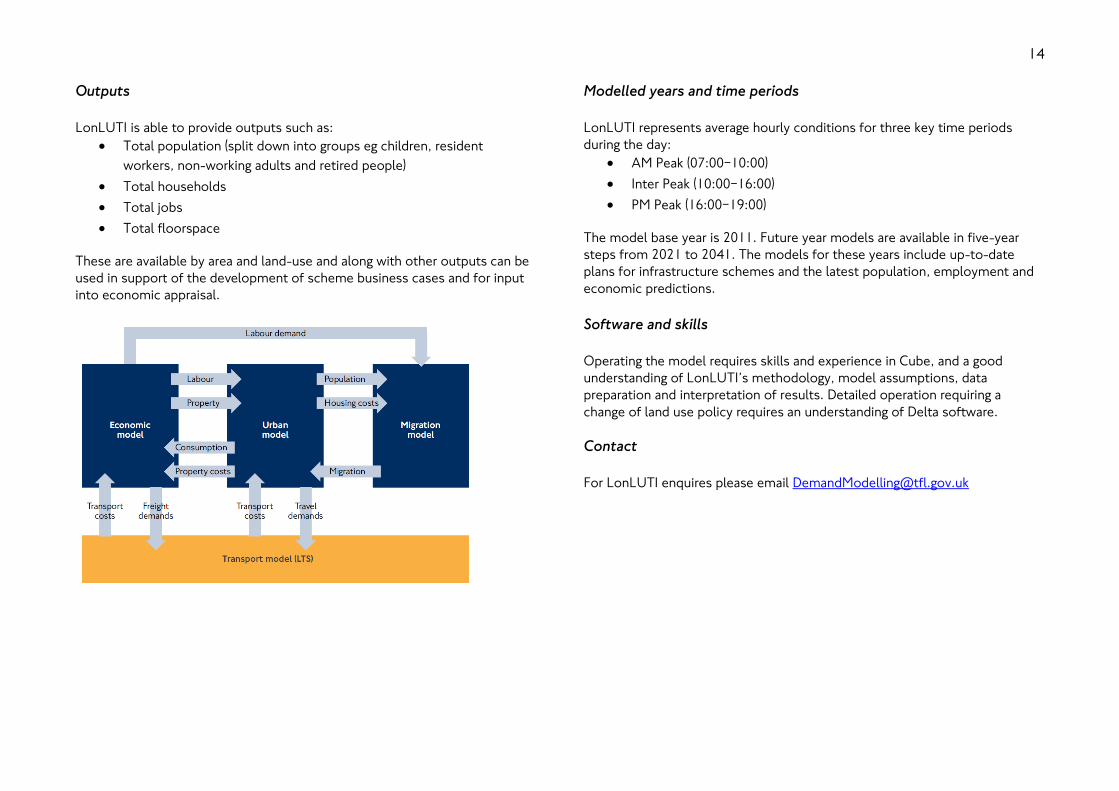
LonLUTI covers London as well as east and south-east England. The model
consists of four components: the economic, urban and migration models
form LonLUM (the land-use model), which is linked to LTS (the transport
model).
LTS predicts travel by highway and public transport using demand
inputs from the economic and urban models. In doing so, it estimates
the time and cost of travel between locations, allowing for
congestion and crowding effects
The economic model predicts the growth (or decline) of sectors of
the economy in each of the areas modelled. The predictions by
sector and area are influenced by transport costs from LTS, and
consumer demand for goods and services, with property costs from
the urban model
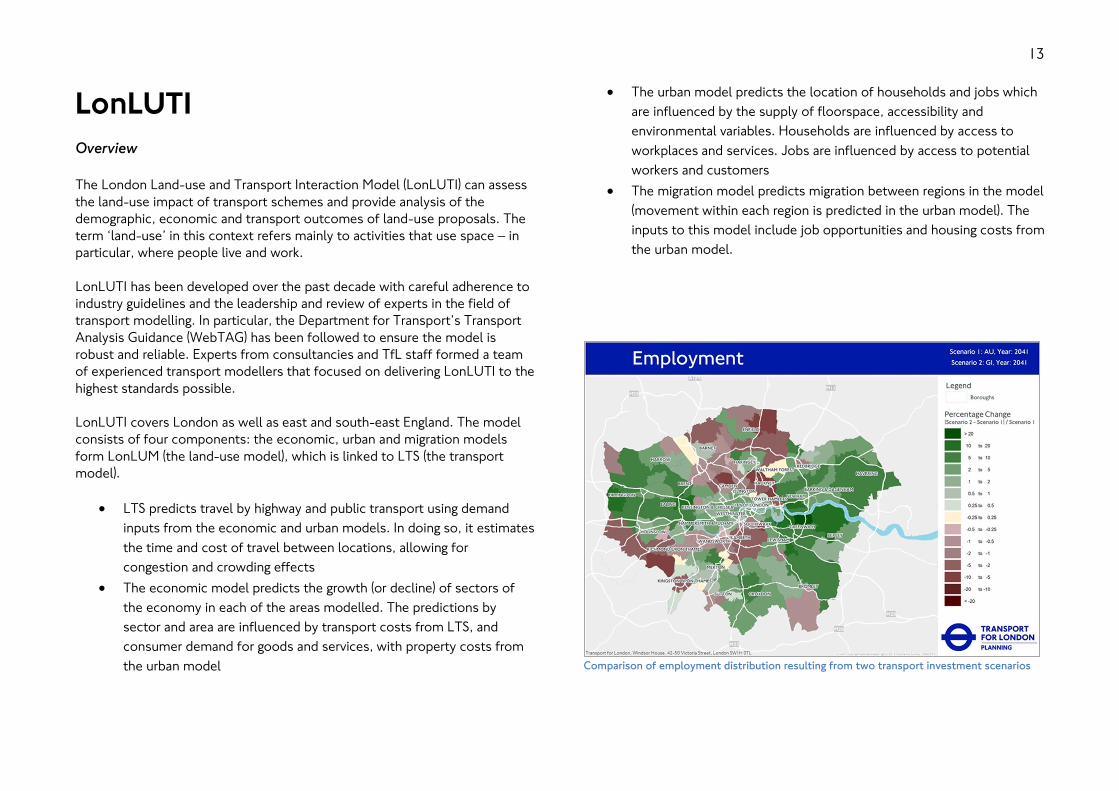
The urban model predicts the location of households and jobs which
are influenced by the supply of floorspace, accessibility and
environmental variables. Households are influenced by access to
workplaces and services. Jobs are influenced by access to potential
workers and customers
The migration model predicts migration between regions in the model
(movement within each region is predicted in the urban model). The
inputs to this model include job opportunities and housing costs from
the urban model.
Comparison of employment distribution resulting from two transport investment scenarios
14
Outputs
LonLUTI is able to provide outputs such as:
Total population (split down into groups eg children, resident
workers, non-working adults and retired people)
Total households
Total jobs
Total floorspace
These are available by area and land-use and along with other outputs can be
used in support of the development of scheme business cases and for input
into economic appraisal.
Modelled years and time periods
LonLUTI represents average hourly conditions for three key time periods
during the day:
AM Peak (07:00−10:00)
Inter Peak (10:00−16:00)
PM Peak (16:00−19:00)
The model base year is 2011. Future year models are available in five-year
steps from 2021 to 2041. The models for these years include up-to-date
plans for infrastructure schemes and the latest population, employment and
economic predictions.
Software and skills
Operating the model requires skills and experience in Cube, and a good
understanding of LonLUTI’s methodology, model assumptions, data
preparation and interpretation of results. Detailed operation requiring a
change of land use policy requires an understanding of Delta software.
Contact
For LonLUTI enquires please email [email protected]
15
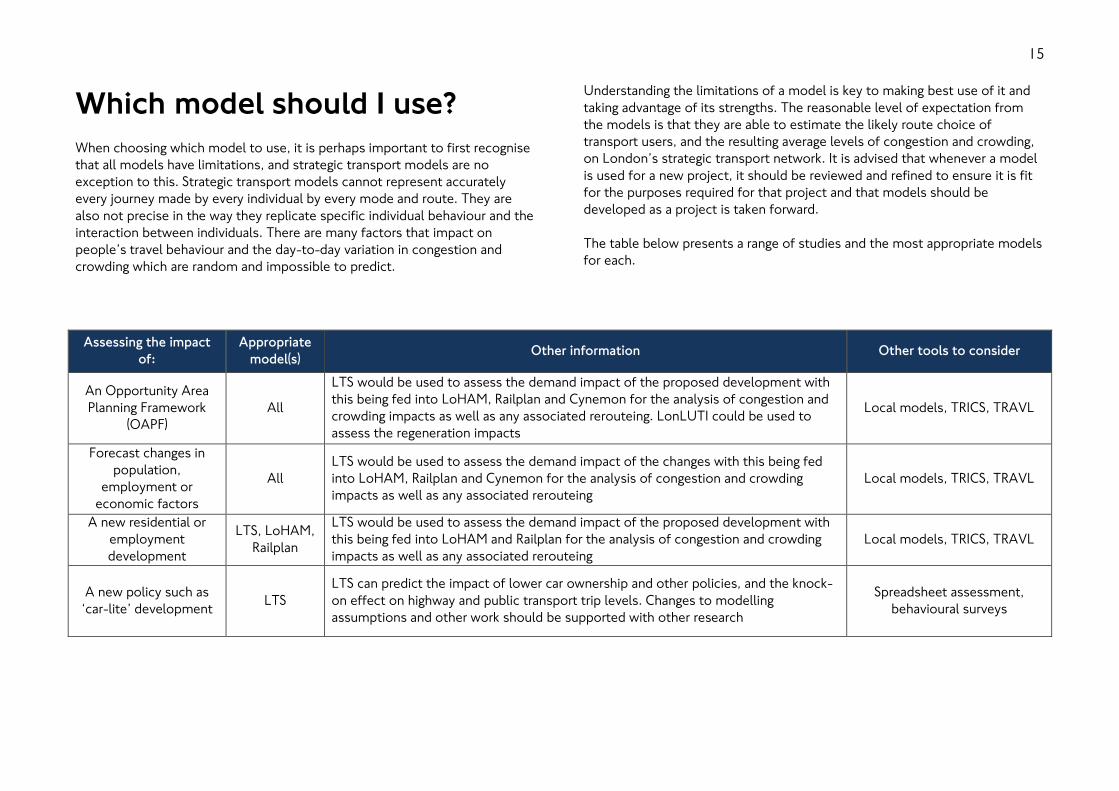
Which model should I use?
When choosing which model to use, it is perhaps important to first recognise
that all models have limitations, and strategic transport models are no
exception to this. Strategic transport models cannot represent accurately
every journey made by every individual by every mode and route. They are
also not precise in the way they replicate specific individual behaviour and the
interaction between individuals. There are many factors that impact on
people’s travel behaviour and the day-to-day variation in congestion and
crowding which are random and impossible to predict.
Understanding the limitations of a model is key to making best use of it and
taking advantage of its strengths. The reasonable level of expectation from
the models is that they are able to estimate the likely route choice of
transport users, and the resulting average levels of congestion and crowding,
on London’s strategic transport network. It is advised that whenever a model
is used for a new project, it should be reviewed and refined to ensure it is fit
for the purposes required for that project and that models should be
developed as a project is taken forward.
The table below presents a range of studies and the most appropriate models
for each.
Assessing the impact
of:
Appropriate
model(s) Other information Other tools to consider
An Opportunity Area
Planning Framework
(OAPF)
All
LTS would be used to assess the demand impact of the proposed development with
this being fed into LoHAM, Railplan and Cynemon for the analysis of congestion and
crowding impacts as well as any associated rerouteing. LonLUTI could be used to
assess the regeneration impacts
Local models, TRICS, TRAVL
Forecast changes in
population,
employment or
economic factors
All
LTS would be used to assess the demand impact of the changes with this being fed
into LoHAM, Railplan and Cynemon for the analysis of congestion and crowding
impacts as well as any associated rerouteing
Local models, TRICS, TRAVL
A new residential or
employment
development
LTS, LoHAM,
Railplan
LTS would be used to assess the demand impact of the proposed development with
this being fed into LoHAM and Railplan for the analysis of congestion and crowding
impacts as well as any associated rerouteing
Local models, TRICS, TRAVL
A new policy such as
‘car-lite’ development LTS
LTS can predict the impact of lower car ownership and other policies, and the knock-
on effect on highway and public transport trip levels. Changes to modelling
assumptions and other work should be supported with other research
Spreadsheet assessment,
behavioural surveys
16
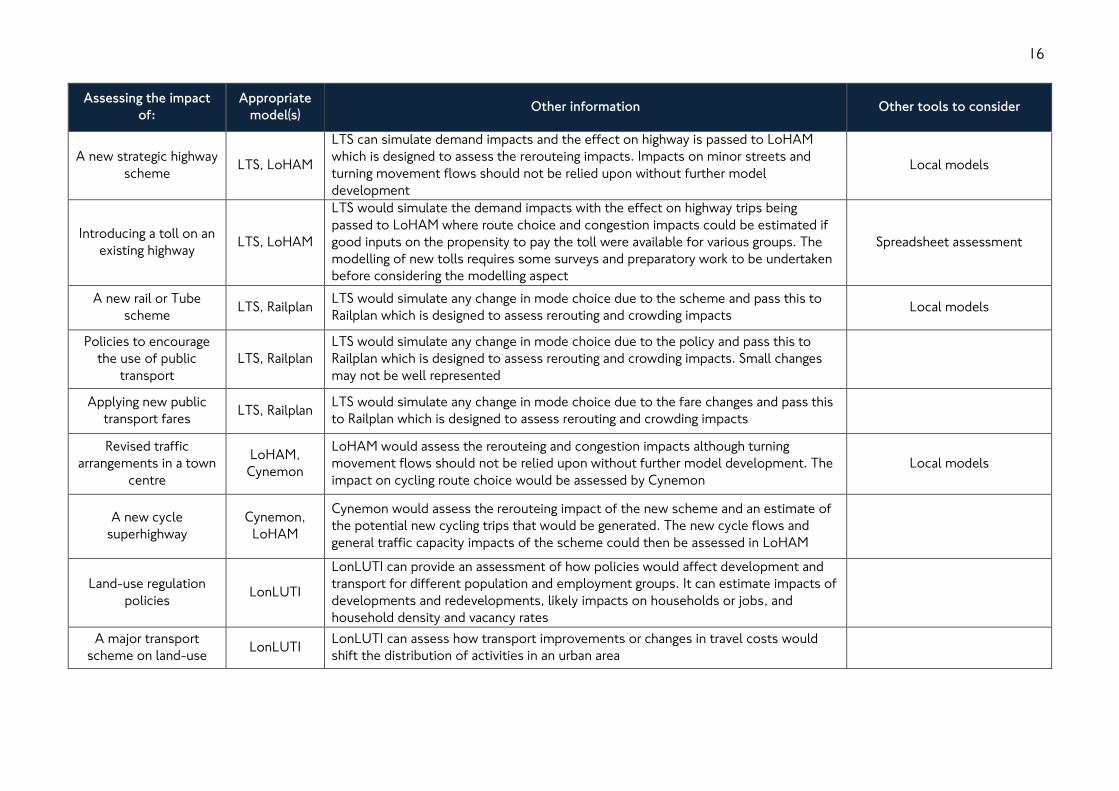
Assessing the impact
of:
Appropriate
model(s) Other information Other tools to consider
A new strategic highway
scheme LTS, LoHAM
LTS can simulate demand impacts and the effect on highway is passed to LoHAM
which is designed to assess the rerouteing impacts. Impacts on minor streets and
turning movement flows should not be relied upon without further model
development
Local models
Introducing a toll on an
existing highway LTS, LoHAM
LTS would simulate the demand impacts with the effect on highway trips being
passed to LoHAM where route choice and congestion impacts could be estimated if
good inputs on the propensity to pay the toll were available for various groups. The
modelling of new tolls requires some surveys and preparatory work to be undertaken
before considering the modelling aspect
Spreadsheet assessment
A new rail or Tube
scheme LTS, Railplan
LTS would simulate any change in mode choice due to the scheme and pass this to
Railplan which is designed to assess rerouting and crowding impacts Local models
Policies to encourage
the use of public
transport
LTS, Railplan
LTS would simulate any change in mode choice due to the policy and pass this to
Railplan which is designed to assess rerouting and crowding impacts. Small changes
may not be well represented
Applying new public
transport fares LTS, Railplan
LTS would simulate any change in mode choice due to the fare changes and pass this
to Railplan which is designed to assess rerouting and crowding impacts
Revised traffic
arrangements in a town
centre
LoHAM,
Cynemon
LoHAM would assess the rerouteing and congestion impacts although turning
movement flows should not be relied upon without further model development. The
impact on cycling route choice would be assessed by Cynemon
Local models
A new cycle
superhighway
Cynemon,
LoHAM
Cynemon would assess the rerouteing impact of the new scheme and an estimate of
the potential new cycling trips that would be generated. The new cycle flows and
general traffic capacity impacts of the scheme could then be assessed in LoHAM
Land-use regulation
policies LonLUTI
LonLUTI can provide an assessment of how policies would affect development and
transport for different population and employment groups. It can estimate impacts of
developments and redevelopments, likely impacts on households or jobs, and
household density and vacancy rates
A major transport
scheme on land-use LonLUTI
LonLUTI can assess how transport improvements or changes in travel costs would
shift the distribution of activities in an urban area
17
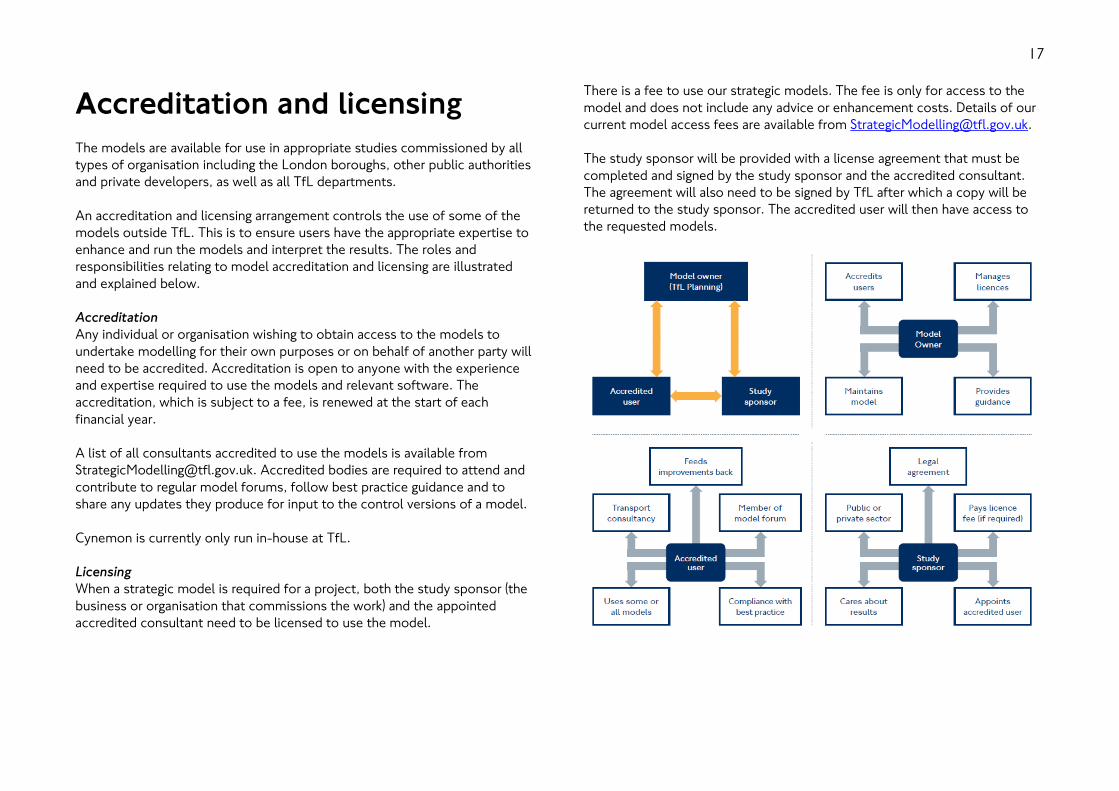
Accreditation and licensing
The models are available for use in appropriate studies commissioned by all
types of organisation including the London boroughs, other public authorities
and private developers, as well as all TfL departments.
An accreditation and licensing arrangement controls the use of some of the
models outside TfL. This is to ensure users have the appropriate expertise to
enhance and run the models and interpret the results. The roles and
responsibilities relating to model accreditation and licensing are illustrated
and explained below.
Accreditation
Any individual or organisation wishing to obtain access to the models to
undertake modelling for their own purposes or on behalf of another party will
need to be accredited. Accreditation is open to anyone with the experience
and expertise required to use the models and relevant software. The
accreditation, which is subject to a fee, is renewed at the start of each
financial year.
A list of all consultants accredited to use the models is available from
[email protected]. Accredited bodies are required to attend and
contribute to regular model forums, follow best practice guidance and to
share any updates they produce for input to the control versions of a model.
Cynemon is currently only run in-house at TfL.
Licensing
When a strategic model is required for a project, both the study sponsor (the
business or organisation that commissions the work) and the appointed
accredited consultant need to be licensed to use the model.
There is a fee to use our strategic models. The fee is only for access to the
model and does not include any advice or enhancement costs. Details of our
current model access fees are available from [email protected].
The study sponsor will be provided with a license agreement that must be
completed and signed by the study sponsor and the accredited consultant.
The agreement will also need to be signed by TfL after which a copy will be
returned to the study sponsor. The accredited user will then have access to
the requested models.

18
More information and contacts
For queries about the models, please contact the Strategic Analysis team in
TfL Planning using one of the email addresses below:
General accreditation and licensing [email protected]
LTS or LonLUTI [email protected]
LoHAM [email protected]
Railplan [email protected]
Cynemon [email protected]