Embed Size (px)
Citation preview
London Stock Exchange Group
Investor Relations Presentation
December 2018
Page 1
London Stock Exchange Group Page 2
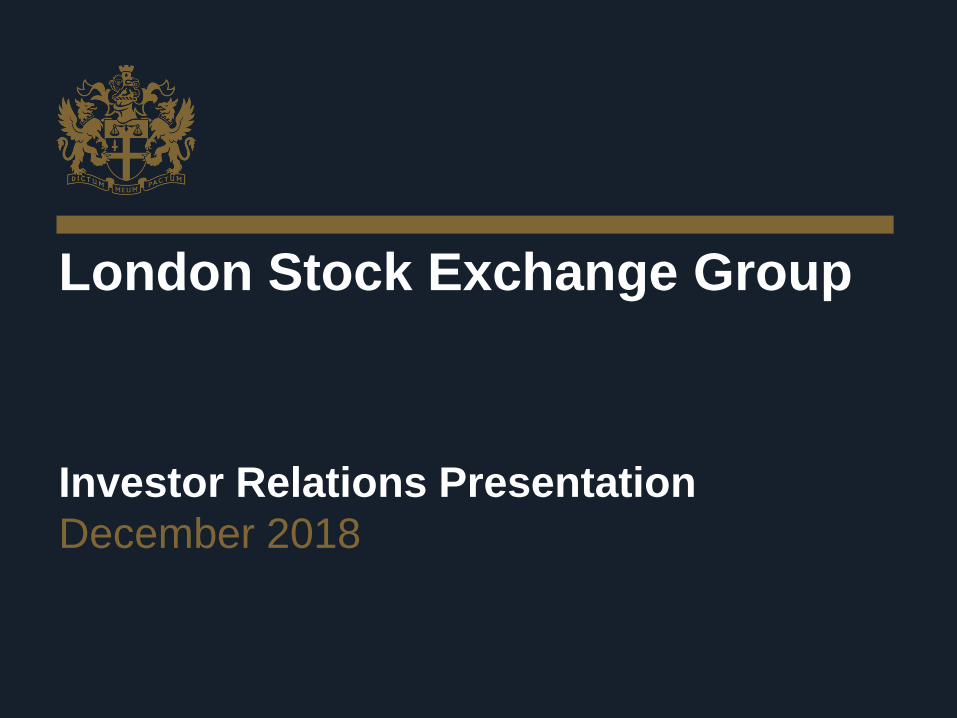
Introduction to LSEG
Capital Formation
Primary Markets
(Capital Raising)Secondary Markets
(Trading)
Risk & Balance Sheet Management
Clearing, Settlement and CSD services
Intellectual Property
Benchmarks, Analytics and Data Solutions
Double-digit growth
36%Post Trade
38%Information
services
20%Capital
Markets
5%Technology
1%Other
LSEG 2017 Total Income by segment
33%FTSE Russell revenue
up 33% (up 15% at
organic constant
currency)
21%LCH OTC clearing
revenue up 21% (up
17% at organic
constant currency)
FTSE Russell LCH
LSEG Business model
Group Technology
MillenniumIT, Hosting and Connectivity
£1,955m
London Stock Exchange Group Page 3
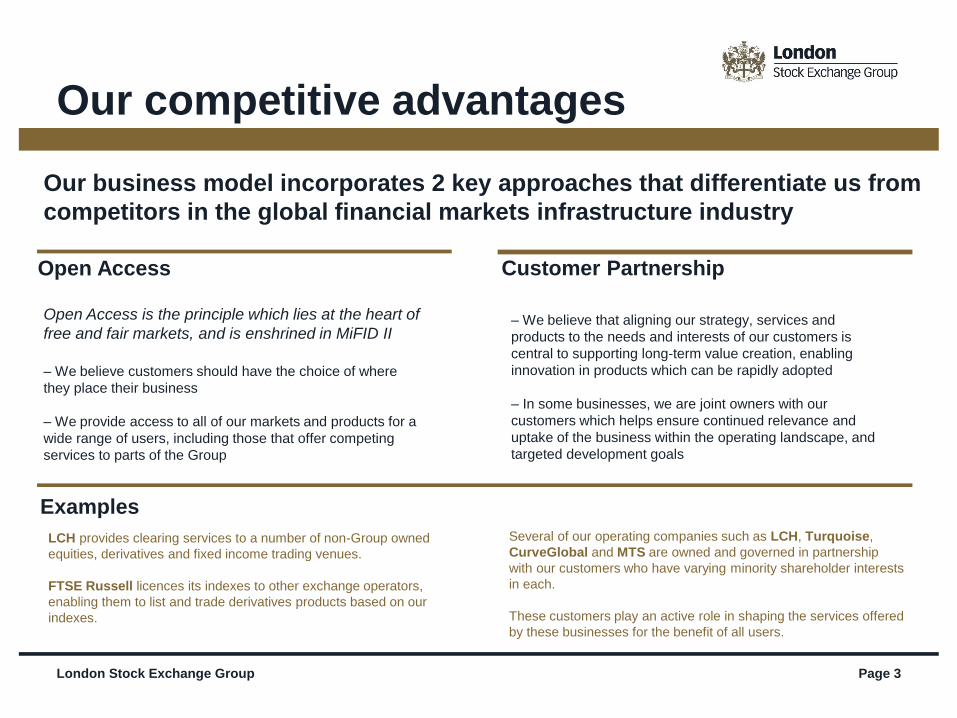
Our competitive advantages
Open Access Customer Partnership
– We believe customers should have the choice of where
they place their business
– We provide access to all of our markets and products for a
wide range of users, including those that offer competing
services to parts of the Group
– We believe that aligning our strategy, services and
products to the needs and interests of our customers is
central to supporting long-term value creation, enabling
innovation in products which can be rapidly adopted
– In some businesses, we are joint owners with our
customers which helps ensure continued relevance and
uptake of the business within the operating landscape, and
targeted development goals
Open Access is the principle which lies at the heart of
free and fair markets, and is enshrined in MiFID II
Our business model incorporates 2 key approaches that differentiate us from
competitors in the global financial markets infrastructure industry
Examples
LCH provides clearing services to a number of non-Group owned
equities, derivatives and fixed income trading venues.
FTSE Russell licences its indexes to other exchange operators,
enabling them to list and trade derivatives products based on our
indexes.
Several of our operating companies such as LCH, Turquoise,
CurveGlobal and MTS are owned and governed in partnership
with our customers who have varying minority shareholder interests
in each.
These customers play an active role in shaping the services offered
by these businesses for the benefit of all users.
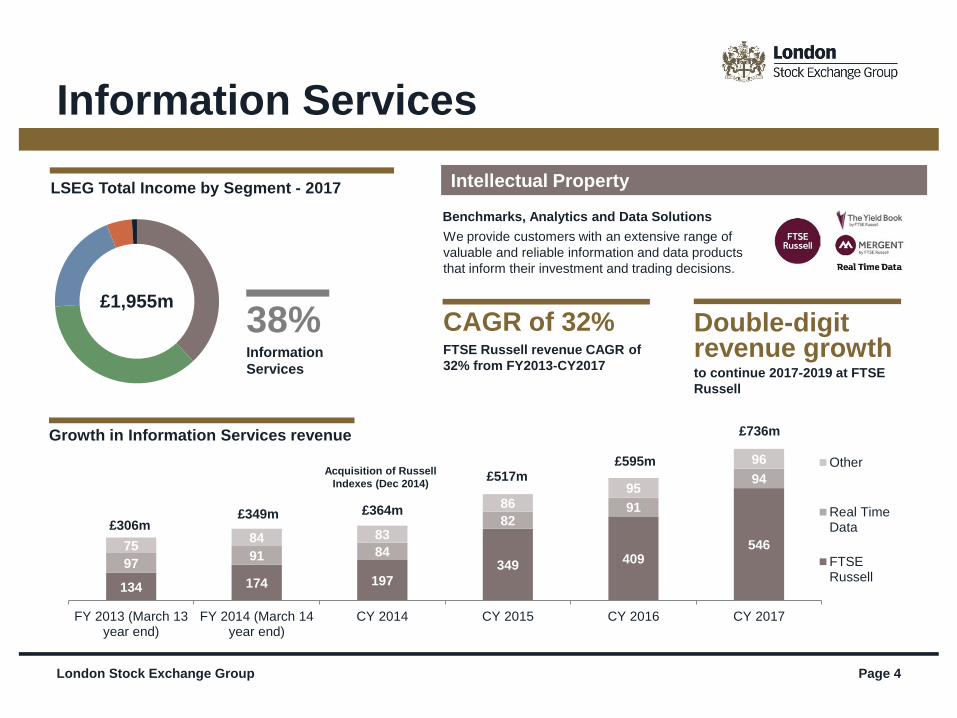
134 174 197
349 409546
9791 84
8291
94
7584 83
8695
96
FY 2013 (March 13year end)
FY 2014 (March 14year end)
CY 2014 CY 2015 CY 2016 CY 2017
Other
Real TimeData
FTSERussell
London Stock Exchange Group Page 4
Information Services
Intellectual Property
Benchmarks, Analytics and Data Solutions
LSEG Total Income by Segment - 2017
38%Information
Services
We provide customers with an extensive range of
valuable and reliable information and data products
that inform their investment and trading decisions.
Acquisition of Russell
Indexes (Dec 2014)
£349m£306m
£364m
£595m£517m
Growth in Information Services revenue £736m
CAGR of 32% FTSE Russell revenue CAGR of
32% from FY2013-CY2017
Double-digit revenue growthto continue 2017-2019 at FTSE
Russell
£1,955m
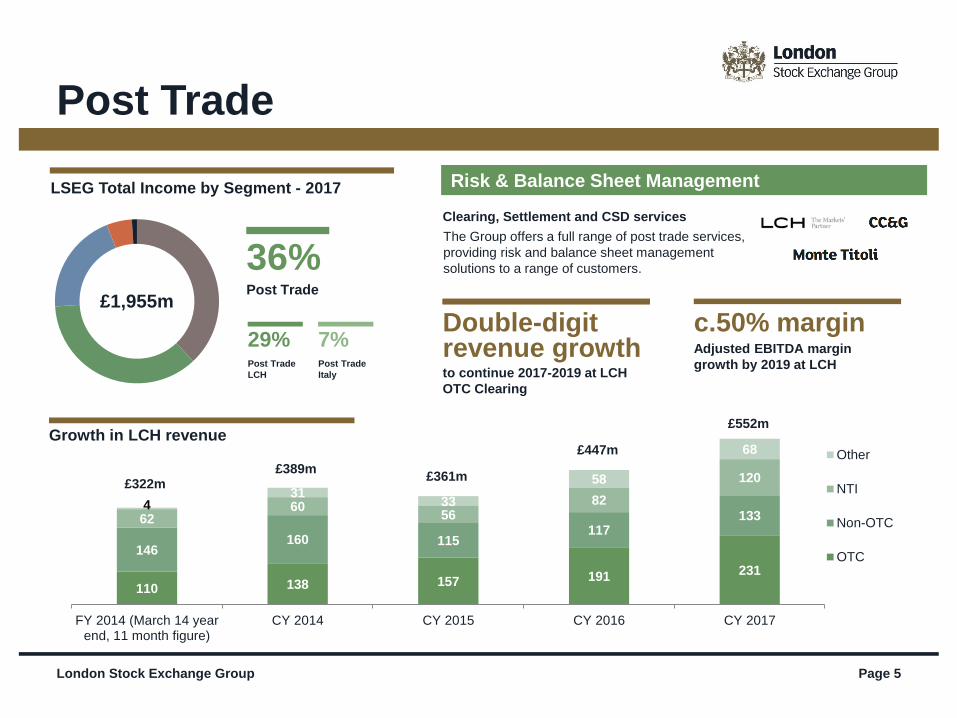
Double-digit revenue growthto continue 2017-2019 at LCH
OTC Clearing
London Stock Exchange Group Page 5
Post Trade
Risk & Balance Sheet Management
Clearing, Settlement and CSD services
LSEG Total Income by Segment - 2017
36%Post Trade
The Group offers a full range of post trade services,
providing risk and balance sheet management
solutions to a range of customers.
c.50% marginAdjusted EBITDA margin
growth by 2019 at LCH
£1,955m
110 138 157 191 231
146160 115
11713362
6056
82
120
431
33
58
68
FY 2014 (March 14 yearend, 11 month figure)
CY 2014 CY 2015 CY 2016 CY 2017
Other
NTI
Non-OTC
OTC
£389m£322m
£447m
£361m
£552m
7%Post Trade
Italy
29%Post Trade
LCH
Growth in LCH revenue
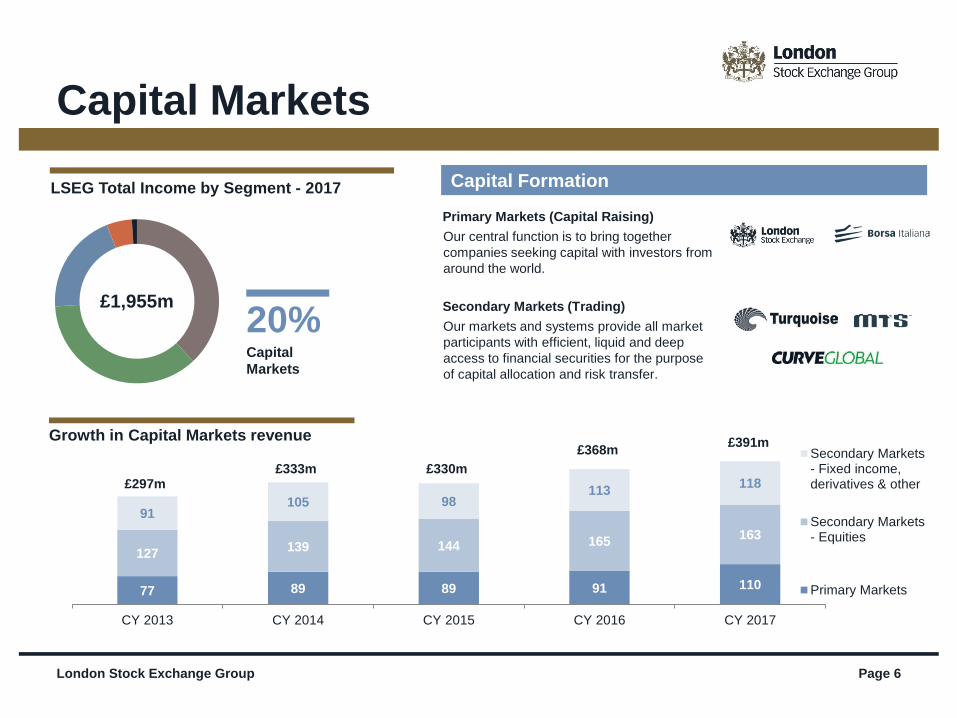
77 89 89 91 110
127139 144 165
163
91105 98
113118
CY 2013 CY 2014 CY 2015 CY 2016 CY 2017
Secondary Markets- Fixed income,derivatives & other
Secondary Markets- Equities
Primary Markets
London Stock Exchange Group Page 6
Capital Markets
Capital Formation
Primary Markets (Capital Raising)
LSEG Total Income by Segment - 2017
Our central function is to bring together
companies seeking capital with investors from
around the world.
£1,955m
£333m£297m
£368m
£330m
£391mGrowth in Capital Markets revenue
20%Capital
Markets
Secondary Markets (Trading)
Our markets and systems provide all market
participants with efficient, liquid and deep
access to financial securities for the purpose
of capital allocation and risk transfer.
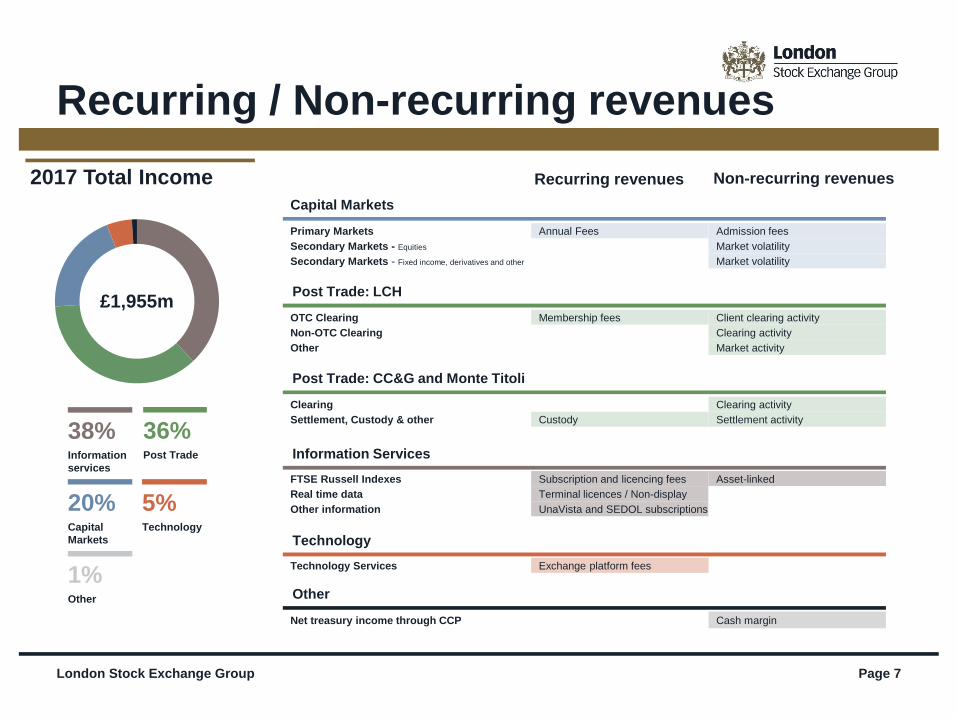
London Stock Exchange Group Page 7
Recurring / Non-recurring revenues
2017 Total Income Recurring revenues
Capital Markets
Primary Markets Annual Fees Admission fees
Secondary Markets - Equities Market volatility
Secondary Markets - Fixed income, derivatives and other Market volatility
Post Trade: LCH
Post Trade: CC&G and Monte Titoli
Information Services
FTSE Russell Indexes Subscription and licencing fees Asset-linked
Real time data Terminal licences / Non-display
Other information UnaVista and SEDOL subscriptions
£1,955mOTC Clearing Membership fees Client clearing activity
Non-OTC Clearing Clearing activity
Other Market activity
Clearing Clearing activity
Settlement, Custody & other Custody Settlement activity
Technology
Technology Services Exchange platform fees
Other
Net treasury income through CCP Cash margin
36%Post Trade
38%Information
services
20%Capital
Markets
5%Technology
1%Other
Non-recurring revenues
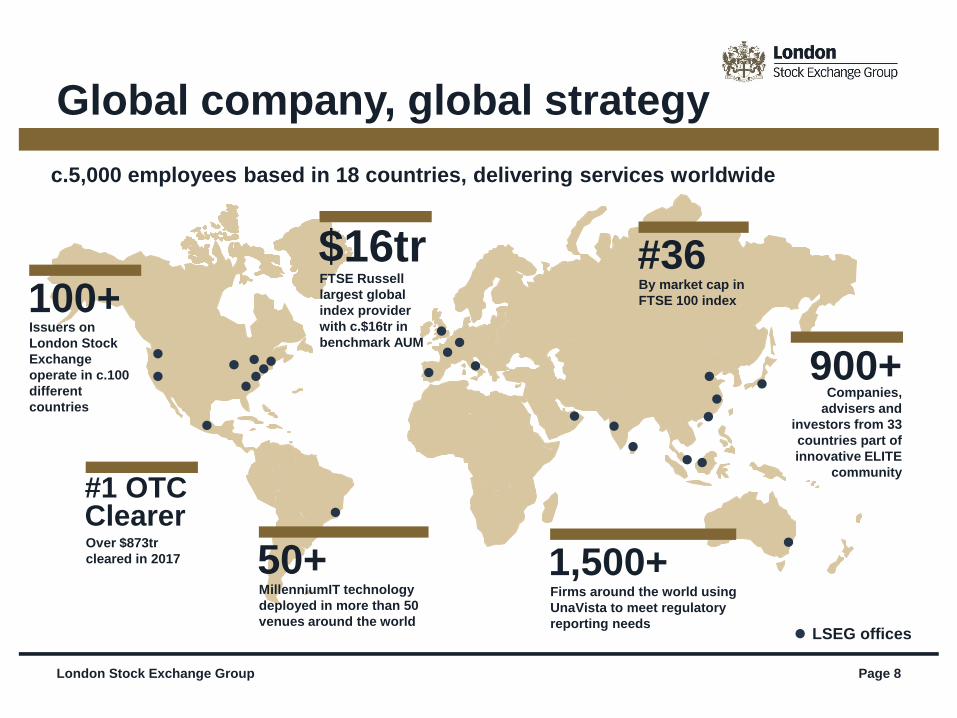
London Stock Exchange Group Page 8
Global company, global strategy
c.5,000 employees based in 18 countries, delivering services worldwide
100+Issuers on
London Stock
Exchange
operate in c.100
different
countries
#1 OTC ClearerOver $873tr
cleared in 2017
#36By market cap in
FTSE 100 index
$16trFTSE Russell
largest global
index provider
with c.$16tr in
benchmark AUM
900+Companies,
advisers and
investors from 33
countries part of
innovative ELITE
community
1,500+Firms around the world using
UnaVista to meet regulatory
reporting needsLSEG offices
50+MillenniumIT technology
deployed in more than 50
venues around the world
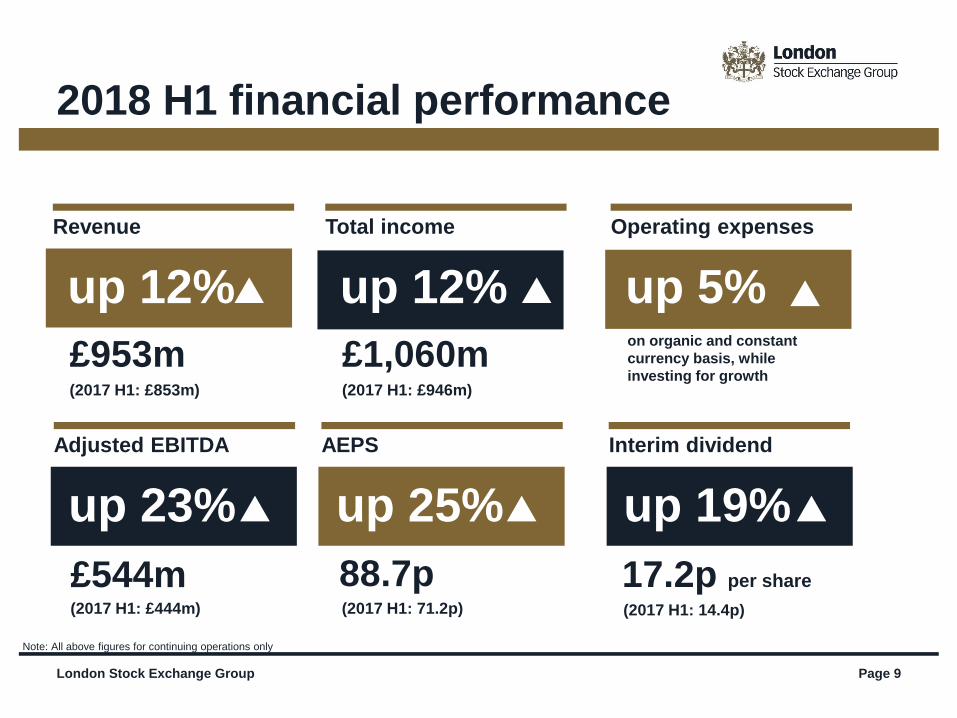
London Stock Exchange Group Page 9
2018 H1 financial performance
Note: All above figures for continuing operations only
up 23%
Adjusted EBITDA
£544m(2017 H1: £444m)
up 12%
Revenue
£953m(2017 H1: £853m)
up 25%
AEPS
88.7p(2017 H1: 71.2p)
up 12%
Total income
£1,060m(2017 H1: £946m)
up 5%
Operating expenses
on organic and constant
currency basis, while
investing for growth
up 19%
Interim dividend
17.2p per share
(2017 H1: 14.4p)
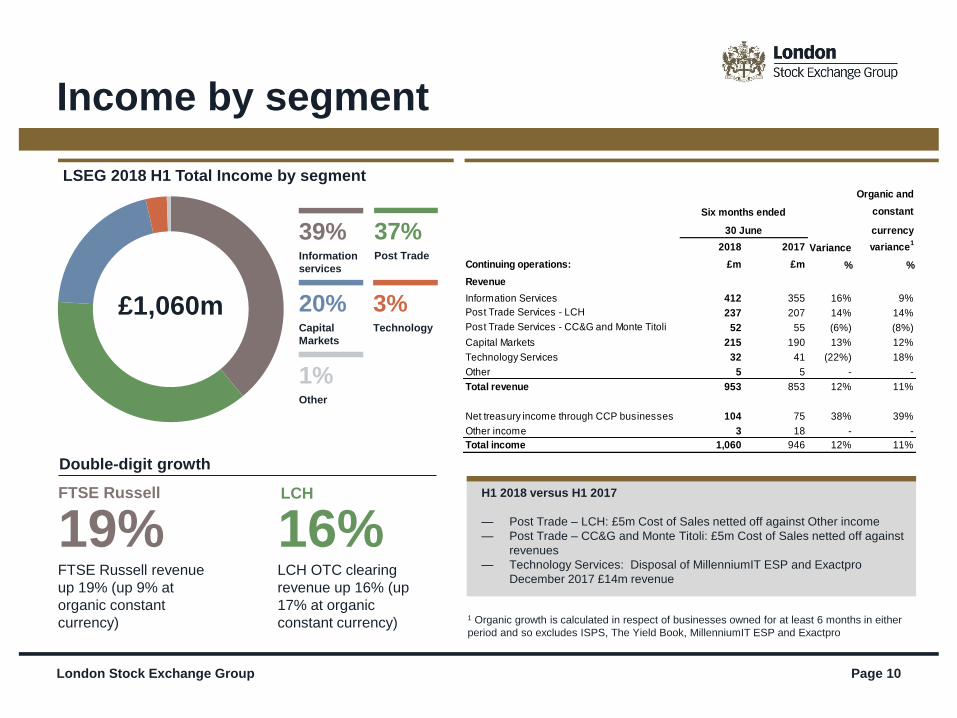
London Stock Exchange Group Page 10
Income by segment
Double-digit growth
37%Post Trade
39%Information
services
£1,060m 20%Capital
Markets
3%Technology
1%Other
LSEG 2018 H1 Total Income by segment
1 Organic growth is calculated in respect of businesses owned for at least 6 months in either
period and so excludes ISPS, The Yield Book, MillenniumIT ESP and Exactpro
19%FTSE Russell revenue
up 19% (up 9% at
organic constant
currency)
16%LCH OTC clearing
revenue up 16% (up
17% at organic
constant currency)
FTSE Russell LCH H1 2018 versus H1 2017
— Post Trade – LCH: £5m Cost of Sales netted off against Other income
— Post Trade – CC&G and Monte Titoli: £5m Cost of Sales netted off against
revenues
— Technology Services: Disposal of MillenniumIT ESP and Exactpro
December 2017 £14m revenue
Organic and
constant
currency
2018 2017 Variance variance1
Continuing operations: £m £m % %
Revenue
Information Services 412 355 16% 9%
Post Trade Services - LCH 237 207 14% 14%
Post Trade Services - CC&G and Monte Titoli 52 55 (6%) (8%)
Capital Markets 215 190 13% 12%
Technology Services 32 41 (22%) 18%
Other 5 5 - -
Total revenue 953 853 12% 11%
Net treasury income through CCP businesses 104 75 38% 39%
Other income 3 18 - -
Total income 1,060 946 12% 11%
Six months ended
30 June
London Stock Exchange Group Page 11
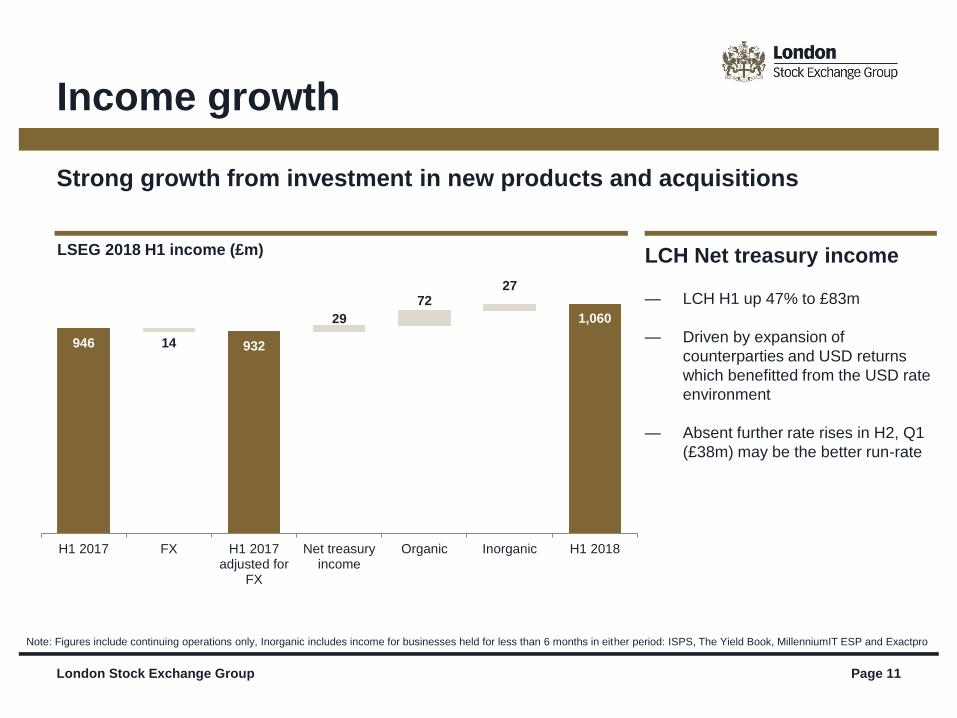
Income growth
Strong growth from investment in new products and acquisitions
LSEG 2018 H1 income (£m)
Note: Figures include continuing operations only, Inorganic includes income for businesses held for less than 6 months in either period: ISPS, The Yield Book, MillenniumIT ESP and Exactpro
LCH Net treasury income
— LCH H1 up 47% to £83m
— Driven by expansion of
counterparties and USD returns
which benefitted from the USD rate
environment
— Absent further rate rises in H2, Q1
(£38m) may be the better run-rate
946 932
1,060
14
29
72 27
H1 2017 FX H1 2017adjusted for
FX
Net treasuryincome
Organic Inorganic H1 2018
London Stock Exchange Group Page 12
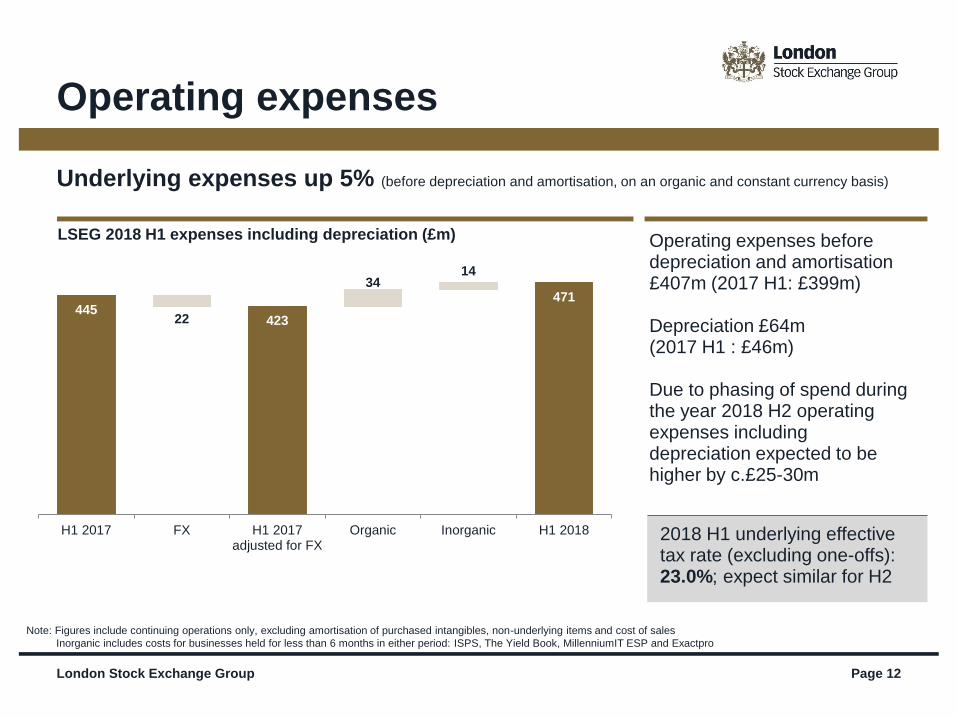
Underlying expenses up 5% (before depreciation and amortisation, on an organic and constant currency basis)
LSEG 2018 H1 expenses including depreciation (£m)
Operating expenses
Operating expenses before depreciation and amortisation £407m (2017 H1: £399m)
Depreciation £64m (2017 H1 : £46m)
Due to phasing of spend during the year 2018 H2 operating expenses including depreciation expected to be higher by c.£25-30m
2018 H1 underlying effective tax rate (excluding one-offs): 23.0%; expect similar for H2
Note: Figures include continuing operations only, excluding amortisation of purchased intangibles, non-underlying items and cost of sales
Inorganic includes costs for businesses held for less than 6 months in either period: ISPS, The Yield Book, MillenniumIT ESP and Exactpro
445423
471
22
34 14
H1 2017 FX H1 2017adjusted for FX
Organic Inorganic H1 2018
London Stock Exchange Group Page 13
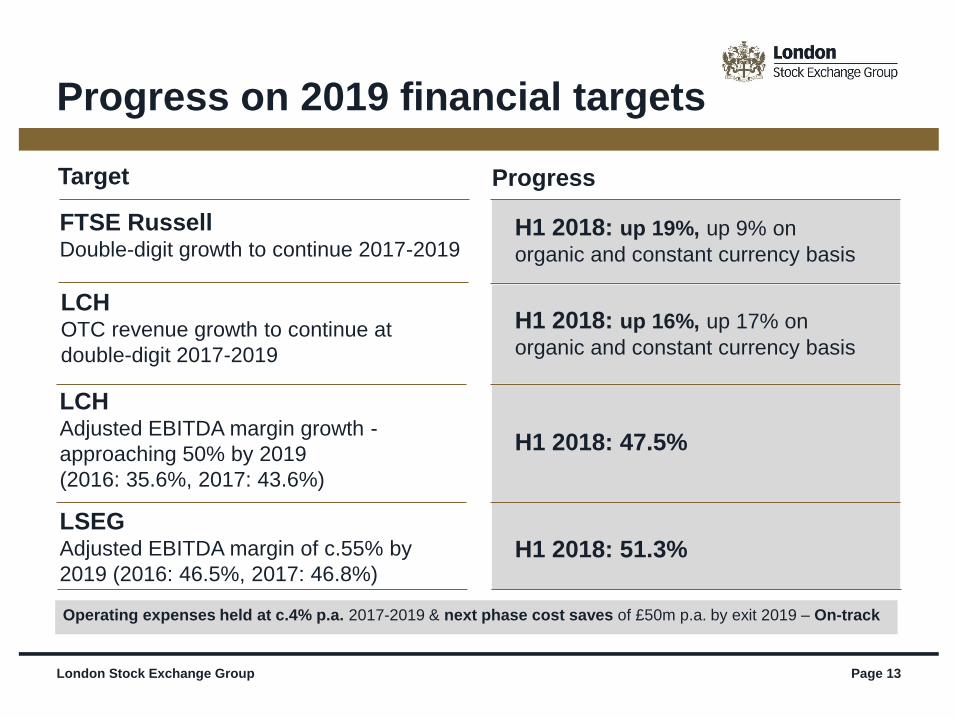
Progress on 2019 financial targets
Operating expenses held at c.4% p.a. 2017-2019 & next phase cost saves of £50m p.a. by exit 2019 – On-track
LCHOTC revenue growth to continue at
double-digit 2017-2019
LSEG Adjusted EBITDA margin of c.55% by
2019 (2016: 46.5%, 2017: 46.8%)
LCHAdjusted EBITDA margin growth -
approaching 50% by 2019
(2016: 35.6%, 2017: 43.6%)
FTSE RussellDouble-digit growth to continue 2017-2019
H1 2018: up 19%, up 9% on
organic and constant currency basis
H1 2018: 51.3%
H1 2018: 47.5%
H1 2018: up 16%, up 17% on
organic and constant currency basis
Target Progress
London Stock Exchange Group Page 14
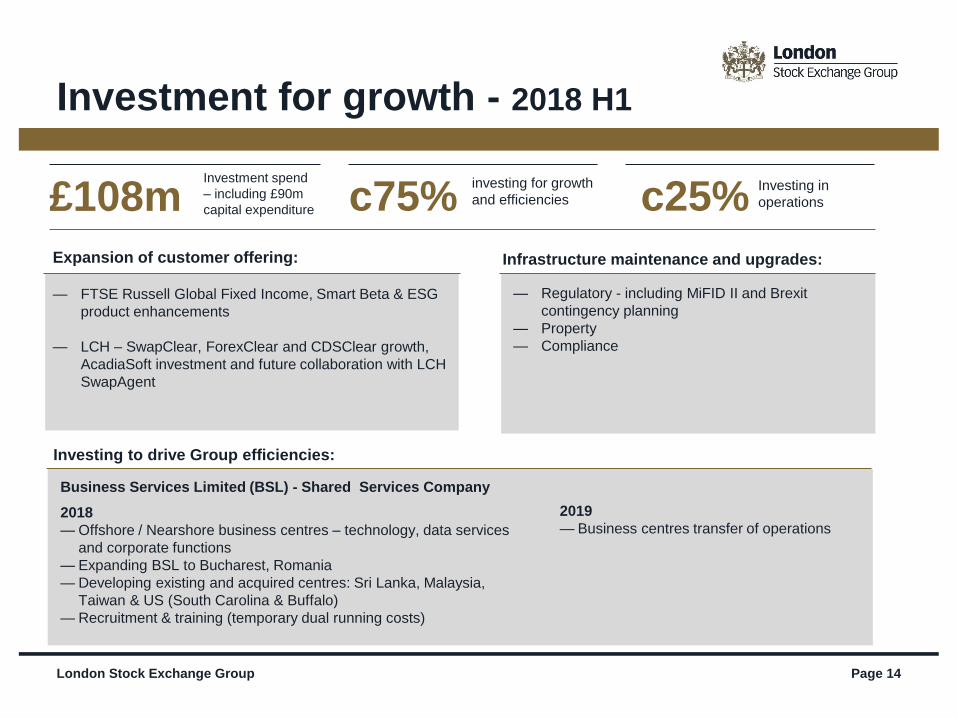
Investment for growth - 2018 H1
£108mInvestment spend
– including £90m
capital expenditure c75%investing for growth
and efficiencies c25%Investing in
operations
— FTSE Russell Global Fixed Income, Smart Beta & ESG
product enhancements
— LCH – SwapClear, ForexClear and CDSClear growth,
AcadiaSoft investment and future collaboration with LCH
SwapAgent
Expansion of customer offering:
— Regulatory - including MiFID II and Brexit
contingency planning
— Property
— Compliance
Infrastructure maintenance and upgrades:
Business Services Limited (BSL) - Shared Services Company
2018
— Offshore / Nearshore business centres – technology, data services
and corporate functions
— Expanding BSL to Bucharest, Romania
— Developing existing and acquired centres: Sri Lanka, Malaysia,
Taiwan & US (South Carolina & Buffalo)
— Recruitment & training (temporary dual running costs)
Investing to drive Group efficiencies:
2019
— Business centres transfer of operations
London Stock Exchange Group Page 15
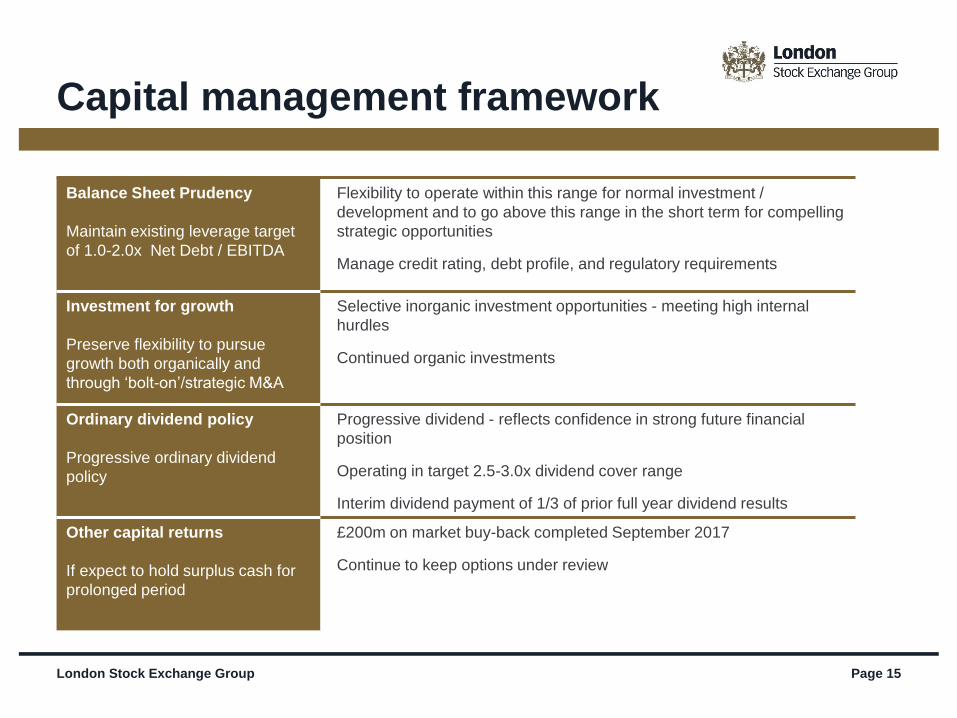
Capital management framework
Balance Sheet Prudency
Maintain existing leverage target
of 1.0-2.0x Net Debt / EBITDA
Flexibility to operate within this range for normal investment /
development and to go above this range in the short term for compelling
strategic opportunities
Manage credit rating, debt profile, and regulatory requirements
Investment for growth
Preserve flexibility to pursue
growth both organically and
through ‘bolt-on’/strategic M&A
Selective inorganic investment opportunities - meeting high internal
hurdles
Continued organic investments
Ordinary dividend policy
Progressive ordinary dividend
policy
Progressive dividend - reflects confidence in strong future financial
position
Operating in target 2.5-3.0x dividend cover range
Interim dividend payment of 1/3 of prior full year dividend results
Other capital returns
If expect to hold surplus cash for
prolonged period
£200m on market buy-back completed September 2017
Continue to keep options under review
London Stock Exchange Group Page 16
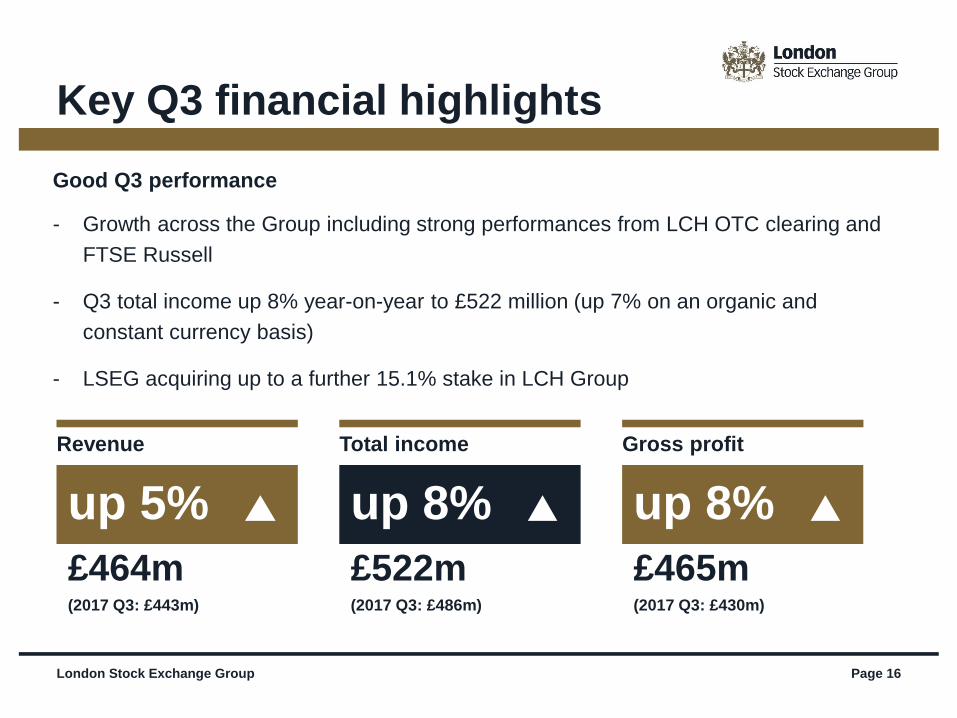
Key Q3 financial highlights
Good Q3 performance
- Growth across the Group including strong performances from LCH OTC clearing and
FTSE Russell
- Q3 total income up 8% year-on-year to £522 million (up 7% on an organic and
constant currency basis)
- LSEG acquiring up to a further 15.1% stake in LCH Group
up 5%
Revenue
£464m(2017 Q3: £443m)
up 8%
Total income
£522m(2017 Q3: £486m)
up 8%
Gross profit
£465m(2017 Q3: £430m)
London Stock Exchange Group Page 17
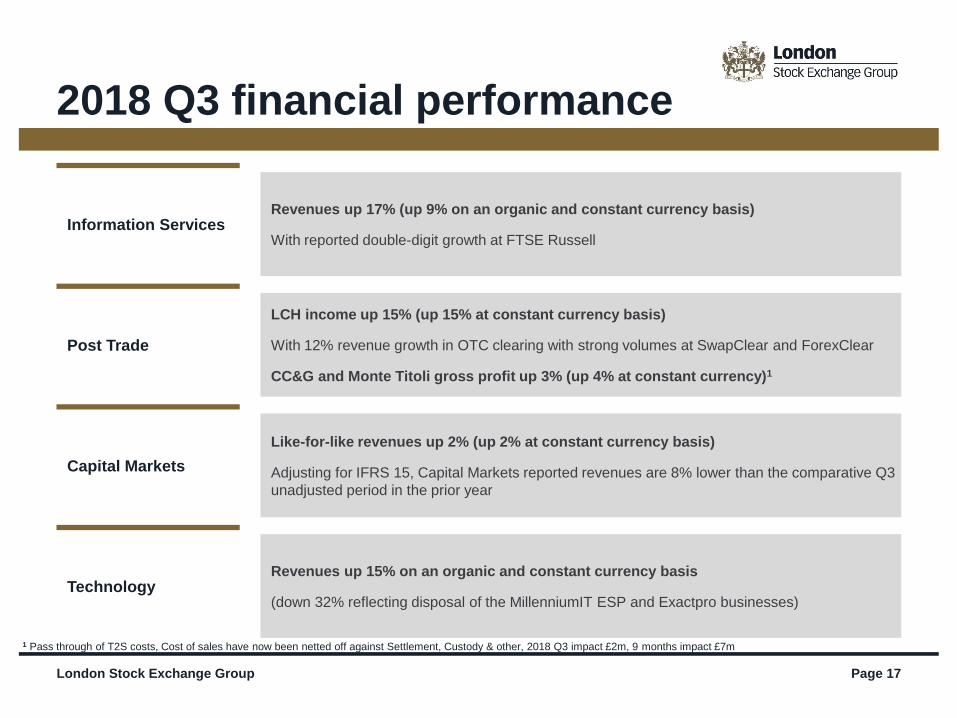
2018 Q3 financial performance
Information Services Revenues up 17% (up 9% on an organic and constant currency basis)
With reported double-digit growth at FTSE Russell
Post Trade
LCH income up 15% (up 15% at constant currency basis)
With 12% revenue growth in OTC clearing with strong volumes at SwapClear and ForexClear
CC&G and Monte Titoli gross profit up 3% (up 4% at constant currency)1
Capital Markets
Like-for-like revenues up 2% (up 2% at constant currency basis)
Adjusting for IFRS 15, Capital Markets reported revenues are 8% lower than the comparative Q3
unadjusted period in the prior year
Technology Revenues up 15% on an organic and constant currency basis
(down 32% reflecting disposal of the MillenniumIT ESP and Exactpro businesses)
1 Pass through of T2S costs, Cost of sales have now been netted off against Settlement, Custody & other, 2018 Q3 impact £2m, 9 months impact £7m
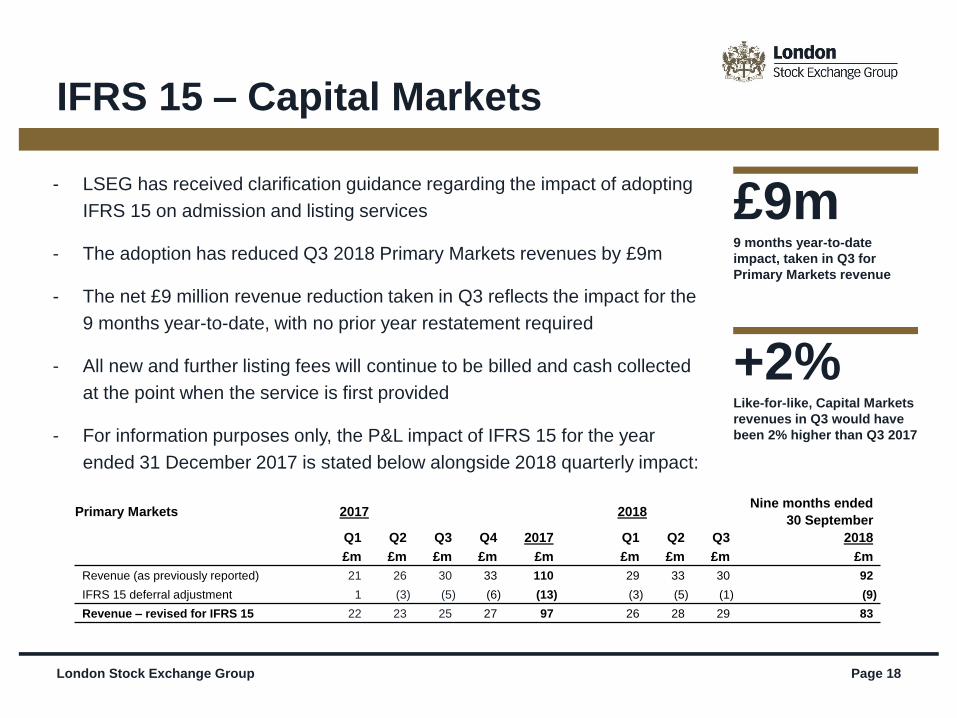
- LSEG has received clarification guidance regarding the impact of adopting
IFRS 15 on admission and listing services
- The adoption has reduced Q3 2018 Primary Markets revenues by £9m
- The net £9 million revenue reduction taken in Q3 reflects the impact for the
9 months year-to-date, with no prior year restatement required
- All new and further listing fees will continue to be billed and cash collected
at the point when the service is first provided
- For information purposes only, the P&L impact of IFRS 15 for the year
ended 31 December 2017 is stated below alongside 2018 quarterly impact:
IFRS 15 – Capital Markets
London Stock Exchange Group Page 18
Primary Markets 2017 2018Nine months ended
30 September
Q1 Q2 Q3 Q4 2017 Q1 Q2 Q3 2018
£m £m £m £m £m £m £m £m £m
Revenue (as previously reported) 21 26 30 33 110 29 33 30 92
IFRS 15 deferral adjustment 1 (3) (5) (6) (13) (3) (5) (1) (9)
Revenue – revised for IFRS 15 22 23 25 27 97 26 28 29 83
£9m 9 months year-to-date
impact, taken in Q3 for
Primary Markets revenue
+2%Like-for-like, Capital Markets
revenues in Q3 would have
been 2% higher than Q3 2017

Opportunities and development
Page 19
London Stock Exchange Group Page 20
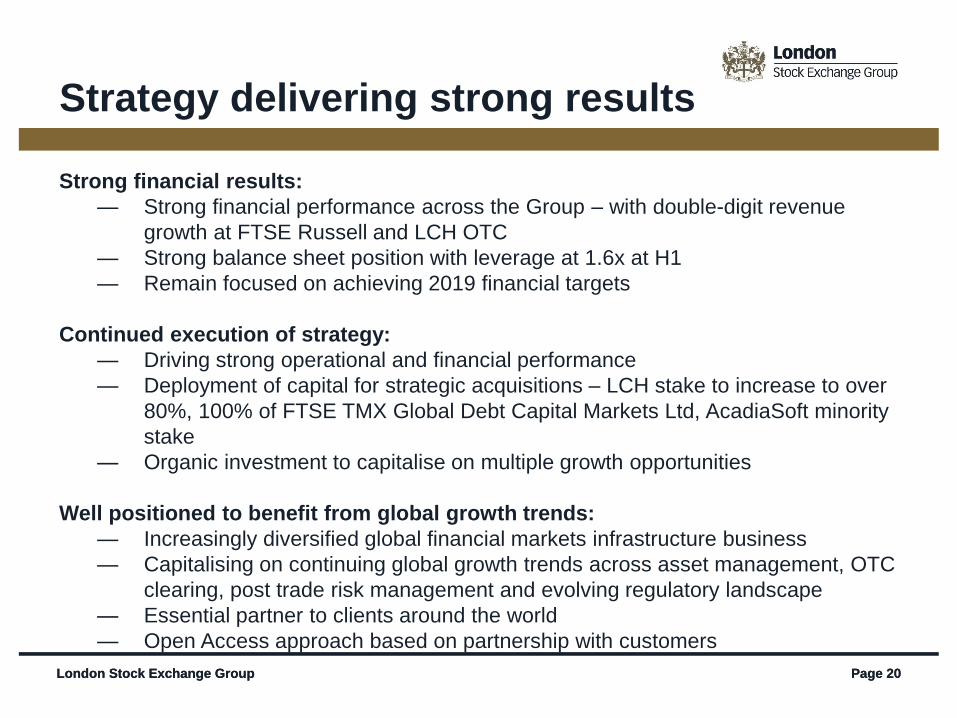
Strong financial results:
— Strong financial performance across the Group – with double-digit revenue
growth at FTSE Russell and LCH OTC
— Strong balance sheet position with leverage at 1.6x at H1
— Remain focused on achieving 2019 financial targets
Continued execution of strategy:
— Driving strong operational and financial performance
— Deployment of capital for strategic acquisitions – LCH stake to increase to over
80%, 100% of FTSE TMX Global Debt Capital Markets Ltd, AcadiaSoft minority
stake
— Organic investment to capitalise on multiple growth opportunities
Well positioned to benefit from global growth trends:
— Increasingly diversified global financial markets infrastructure business
— Capitalising on continuing global growth trends across asset management, OTC
clearing, post trade risk management and evolving regulatory landscape
— Essential partner to clients around the world
— Open Access approach based on partnership with customers
London Stock Exchange Group Page 20
Strategy delivering strong results
London Stock Exchange Group Page 21
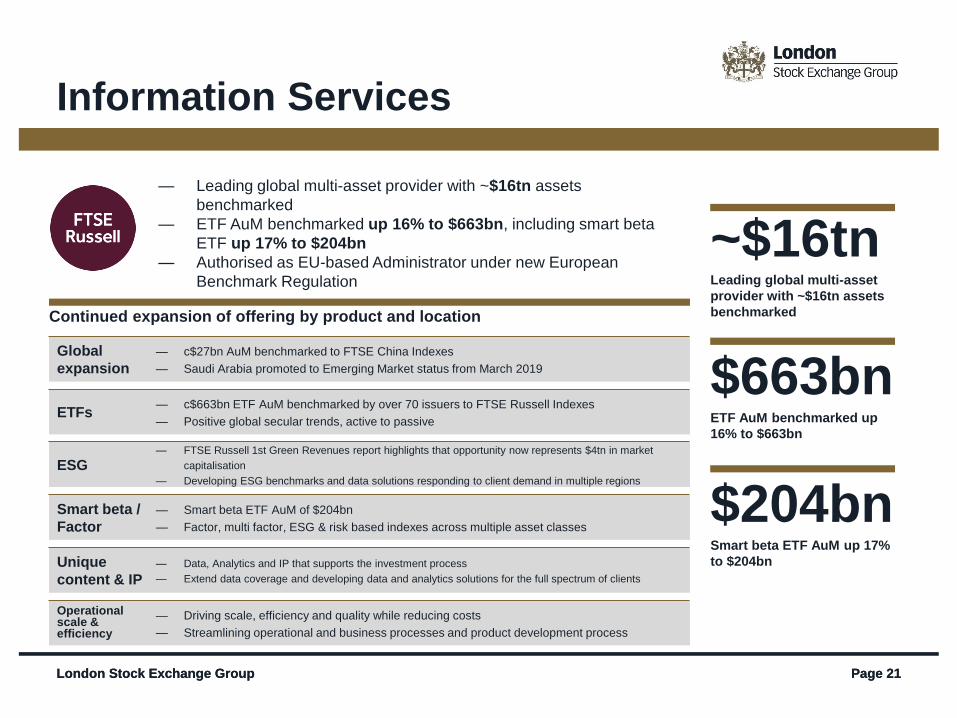
— Leading global multi-asset provider with ~$16tn assets
benchmarked
— ETF AuM benchmarked up 16% to $663bn, including smart beta
ETF up 17% to $204bn
— Authorised as EU-based Administrator under new European
Benchmark Regulation
London Stock Exchange Group Page 21
Information Services
~$16tn Leading global multi-asset
provider with ~$16tn assets
benchmarked
$663bnETF AuM benchmarked up
16% to $663bn
$204bn Smart beta ETF AuM up 17%
to $204bn
Continued expansion of offering by product and location
Global
expansion
— c$27bn AuM benchmarked to FTSE China Indexes
— Saudi Arabia promoted to Emerging Market status from March 2019
ETFs— c$663bn ETF AuM benchmarked by over 70 issuers to FTSE Russell Indexes
— Positive global secular trends, active to passive
ESG— FTSE Russell 1st Green Revenues report highlights that opportunity now represents $4tn in market
capitalisation
— Developing ESG benchmarks and data solutions responding to client demand in multiple regions
Smart beta /
Factor
— Smart beta ETF AuM of $204bn
— Factor, multi factor, ESG & risk based indexes across multiple asset classes
Unique
content & IP
— Data, Analytics and IP that supports the investment process
— Extend data coverage and developing data and analytics solutions for the full spectrum of clients
Operational scale & efficiency
— Driving scale, efficiency and quality while reducing costs
— Streamlining operational and business processes and product development process
Page 22
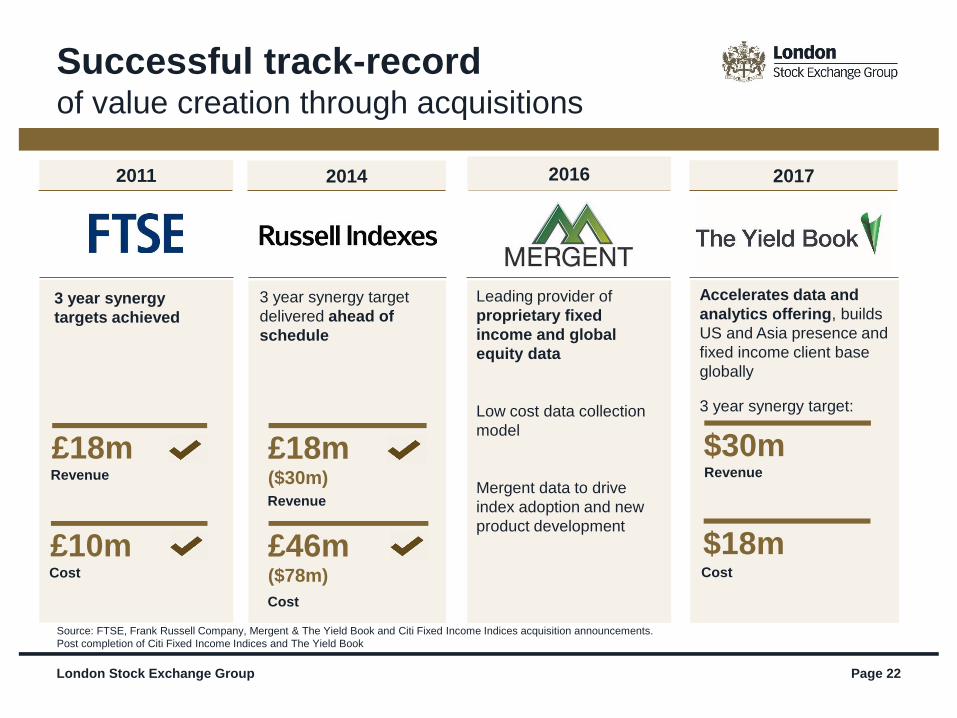
3 year synergy
targets achieved
3 year synergy target
delivered ahead of
schedule
Leading provider of
proprietary fixed
income and global
equity data
Low cost data collection
model
Mergent data to drive
index adoption and new
product development
Accelerates data and
analytics offering, builds
US and Asia presence and
fixed income client base
globally
3 year synergy target:
2011 2014 2017
£18mRevenue
£10mCost
£18m($30m)Revenue
£46m($78m)
Cost
$30mRevenue
$18mCost
2016
Source: FTSE, Frank Russell Company, Mergent & The Yield Book and Citi Fixed Income Indices acquisition announcements.
Post completion of Citi Fixed Income Indices and The Yield Book
London Stock Exchange Group
Successful track-recordof value creation through acquisitions
Page 23
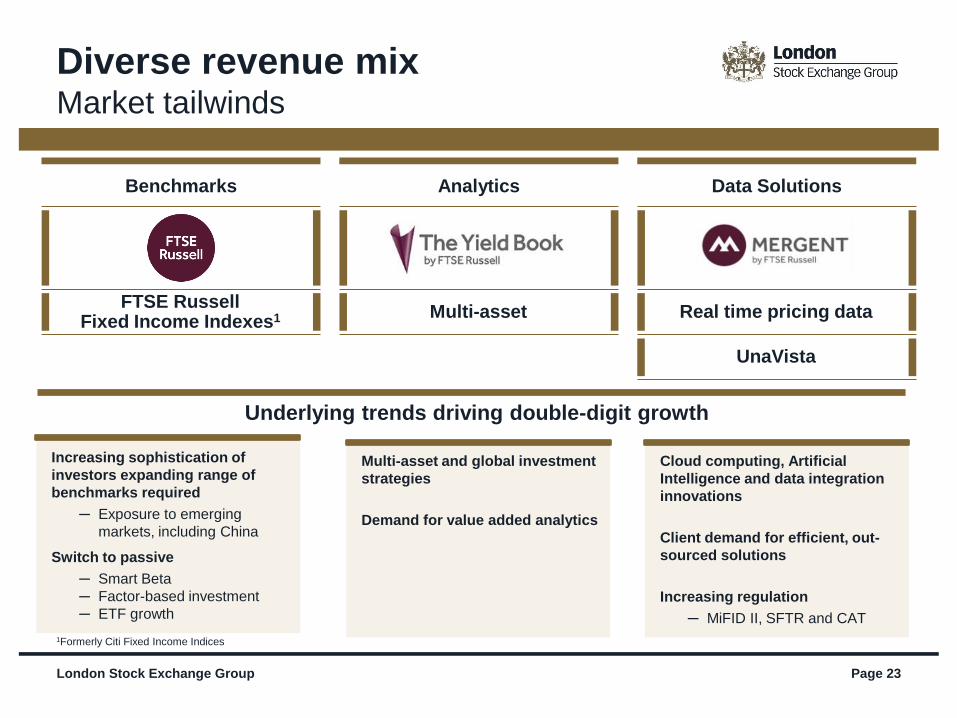
1Formerly Citi Fixed Income Indices
London Stock Exchange Group
Diverse revenue mix Market tailwinds
Underlying trends driving double-digit growth
Increasing sophistication of
investors expanding range of
benchmarks required
─ Exposure to emerging
markets, including China
Switch to passive
─ Smart Beta
─ Factor-based investment
─ ETF growth
Cloud computing, Artificial
Intelligence and data integration
innovations
Client demand for efficient, out-
sourced solutions
Increasing regulation
─ MiFID II, SFTR and CAT
Benchmarks
FTSE Russell Fixed Income Indexes1
Analytics
Multi-asset
Data Solutions
Real time pricing data
UnaVista
Multi-asset and global investment
strategies
Demand for value added analytics
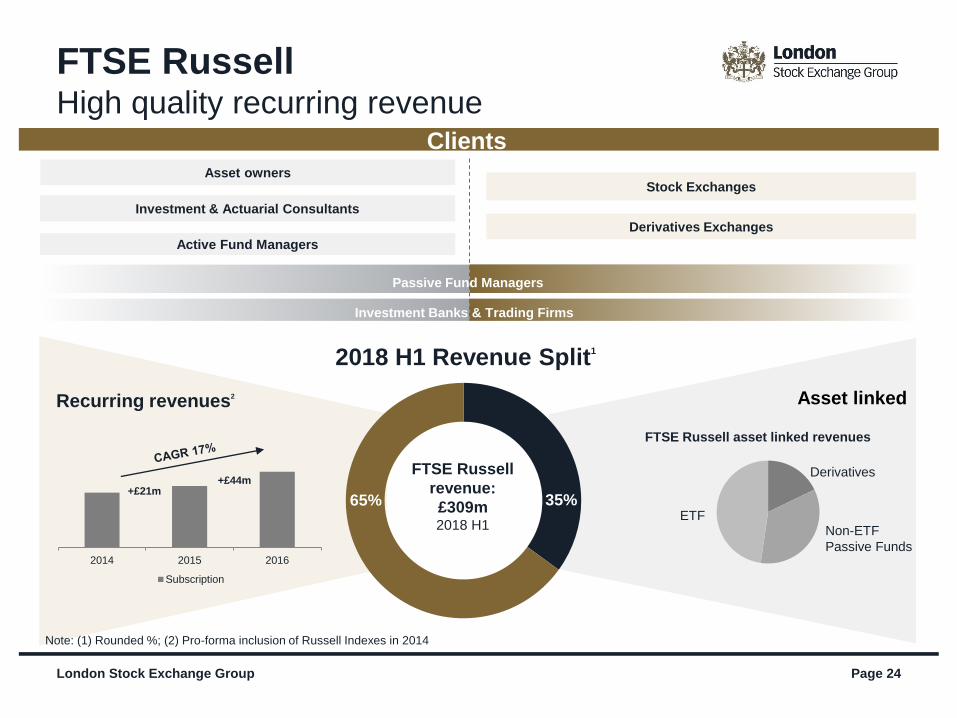
Page 24
2018 H1 Revenue Split1
Asset linked
Clients
Derivatives Exchanges
Stock Exchanges
35%65%
Investment & Actuarial Consultants
Asset owners
Active Fund Managers
Passive Fund Managers
Investment Banks & Trading Firms
FTSE Russell asset linked revenues
Derivatives
Non-ETF
Passive Funds2014 2015 2016
Subscription
Recurring revenues2
Note: (1) Rounded %; (2) Pro-forma inclusion of Russell Indexes in 2014
ETF
+£21m+£44m
FTSE Russell
revenue:
£309m2018 H1
London Stock Exchange Group
FTSE RussellHigh quality recurring revenue
Smart Beta
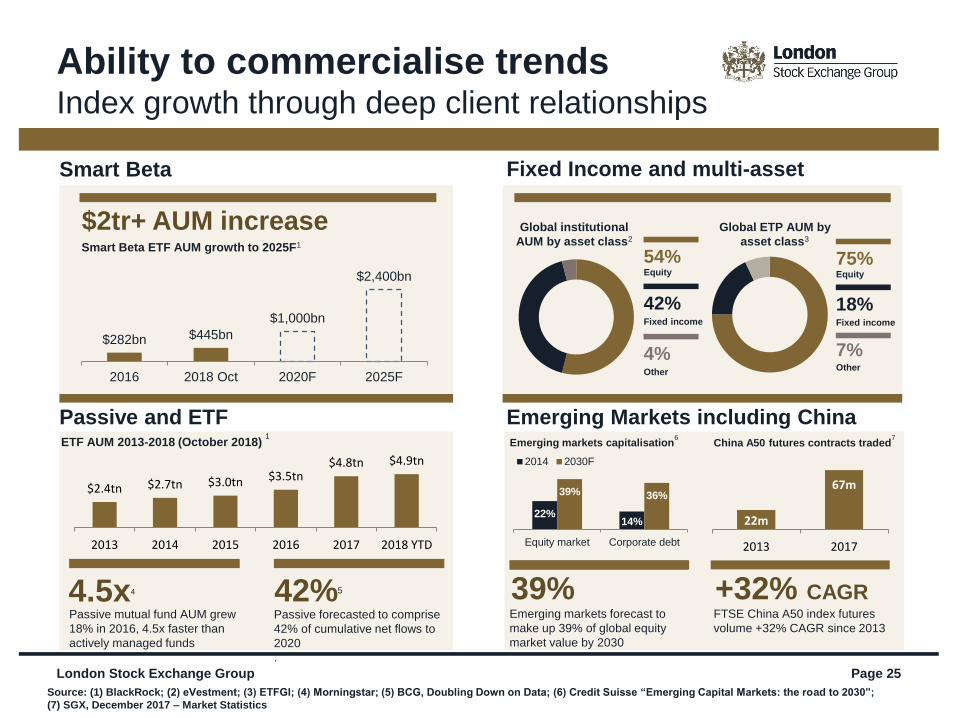
Passive and ETF Emerging Markets including China
Page 25
Source: (1) BlackRock; (2) eVestment; (3) ETFGI; (4) Morningstar; (5) BCG, Doubling Down on Data; (6) Credit Suisse “Emerging Capital Markets: the road to 2030”;
(7) SGX, December 2017 – Market Statistics
Fixed Income and multi-asset
70m
22m
$2tr+ AUM increaseSmart Beta ETF AUM growth to 2025F1
4.5x4
Passive mutual fund AUM grew
18% in 2016, 4.5x faster than
actively managed funds
42%5
Passive forecasted to comprise
42% of cumulative net flows to
2020
.
+32% CAGRFTSE China A50 index futures
volume +32% CAGR since 2013
Global institutional
AUM by asset class2
Global ETP AUM by
asset class3
China A50 futures contracts traded7
18%Fixed income
75%Equity
7%Other
42%Fixed income
54%Equity
4%Other
ETF AUM 2013-2018 (October 2018) 1
22%14%
39% 36%
Equity market Corporate debt
2014 2030F
39%Emerging markets forecast to
make up 39% of global equity
market value by 2030
Emerging markets capitalisation6
London Stock Exchange Group
22m
67m
2013 2017
Ability to commercialise trendsIndex growth through deep client relationships
$2.4tn $2.7tn $3.0tn $3.5tn$4.8tn $4.9tn
2013 2014 2015 2016 2017 2018 YTD
$282bn $445bn
$1,000bn
$2,400bn
2016 2018 Oct 2020F 2025F
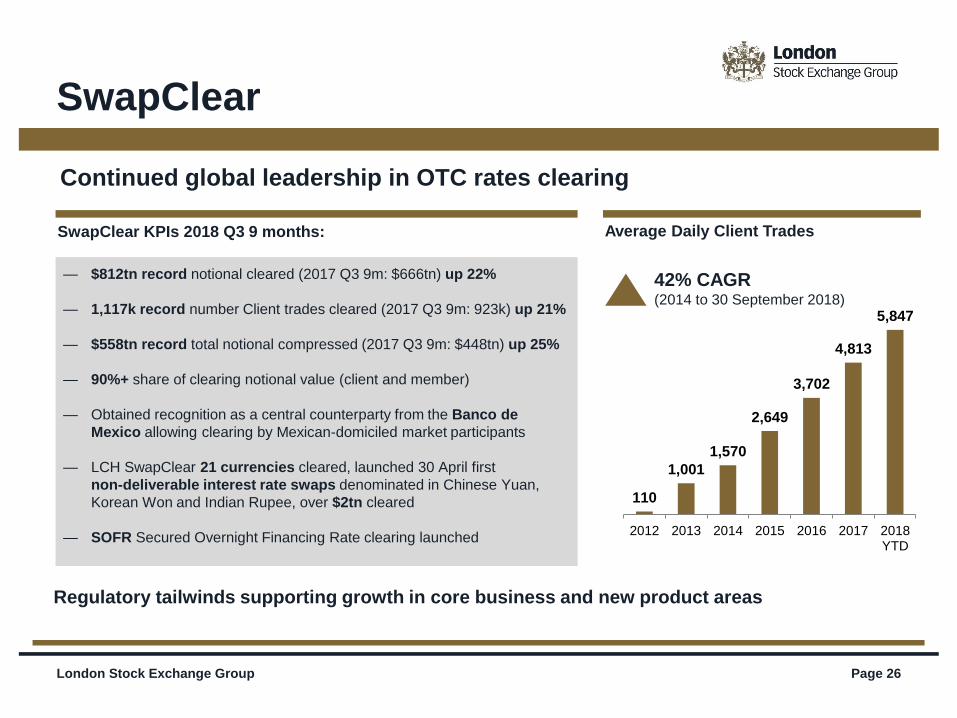
110
1,001
1,570
2,649
3,702
4,813
5,847
2012 2013 2014 2015 2016 2017 2018YTD
London Stock Exchange Group Page 26
SwapClear
Regulatory tailwinds supporting growth in core business and new product areas
Continued global leadership in OTC rates clearing
Average Daily Client Trades
— $812tn record notional cleared (2017 Q3 9m: $666tn) up 22%
— 1,117k record number Client trades cleared (2017 Q3 9m: 923k) up 21%
— $558tn record total notional compressed (2017 Q3 9m: $448tn) up 25%
— 90%+ share of clearing notional value (client and member)
— Obtained recognition as a central counterparty from the Banco de
Mexico allowing clearing by Mexican-domiciled market participants
— LCH SwapClear 21 currencies cleared, launched 30 April first
non-deliverable interest rate swaps denominated in Chinese Yuan,
Korean Won and Indian Rupee, over $2tn cleared
— SOFR Secured Overnight Financing Rate clearing launched
SwapClear KPIs 2018 Q3 9 months:
42% CAGR (2014 to 30 September 2018)
Page 27London Stock Exchange Group
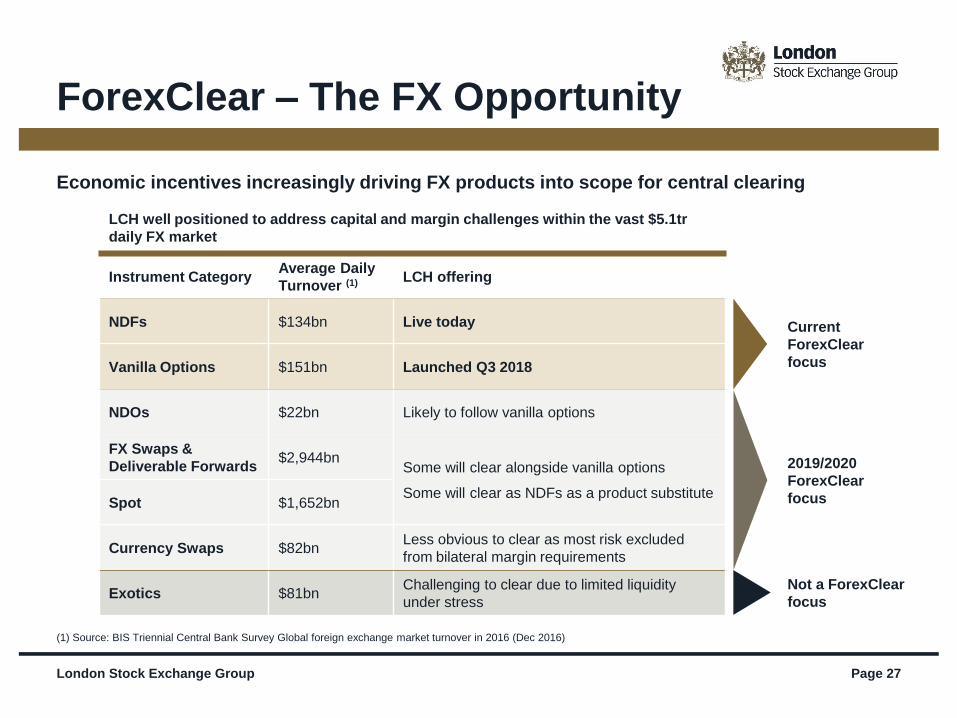
ForexClear – The FX Opportunity
(1) Source: BIS Triennial Central Bank Survey Global foreign exchange market turnover in 2016 (Dec 2016)
Instrument CategoryAverage Daily
Turnover (1) LCH offering
NDFs $134bn Live today
Vanilla Options $151bn Launched Q3 2018
NDOs $22bn Likely to follow vanilla options
FX Swaps &
Deliverable Forwards$2,944bn
Some will clear alongside vanilla options
Some will clear as NDFs as a product substituteSpot $1,652bn
Currency Swaps $82bnLess obvious to clear as most risk excluded
from bilateral margin requirements
Exotics $81bnChallenging to clear due to limited liquidity
under stress
Economic incentives increasingly driving FX products into scope for central clearing
Current
ForexClear
focus
2019/2020
ForexClear
focus
Not a ForexClear
focus
LCH well positioned to address capital and margin challenges within the vast $5.1tr
daily FX market
Page 28London Stock Exchange Group
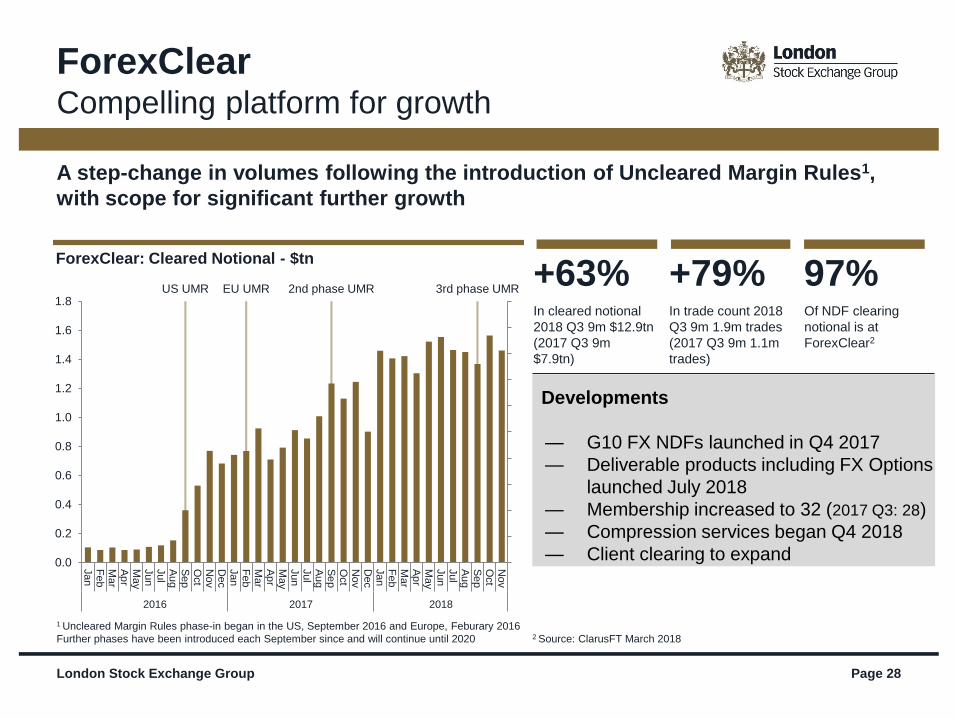
ForexClearCompelling platform for growth
A step-change in volumes following the introduction of Uncleared Margin Rules1,
with scope for significant further growth
ForexClear: Cleared Notional - $tn
+79%+63%In cleared notional
2018 Q3 9m $12.9tn
(2017 Q3 9m
$7.9tn)
In trade count 2018
Q3 9m 1.9m trades
(2017 Q3 9m 1.1m
trades)
97%Of NDF clearing
notional is at
ForexClear2
Developments
— G10 FX NDFs launched in Q4 2017
— Deliverable products including FX Options
launched July 2018
— Membership increased to 32 (2017 Q3: 28)
— Compression services began Q4 2018
— Client clearing to expand
2 Source: ClarusFT March 2018
1 Uncleared Margin Rules phase-in began in the US, September 2016 and Europe, Feburary 2016
Further phases have been introduced each September since and will continue until 2020
US UMR EU UMR 2nd phase UMR 3rd phase UMR
0.0
0.2
0.4
0.6
0.8
1.0
1.2
1.4
1.6
1.8
Jan
Fe
bM
ar
Ap
rM
ay
Jun
Jul
Au
gS
ep
Oct
Nov
Dec
Jan
Fe
bM
ar
Ap
rM
ay
Jun
Jul
Au
gS
ep
Oct
Nov
Dec
Jan
Fe
bM
ar
Ap
rM
ay
Jun
Jul
Au
gS
ep
Oct
Nov
2016 2017 2018
Page 29
Global business, balanced portfolio of assets across listing, trading, index and
clearing and settlement services in the UK, EU, United States and Asia
Clearing houses operate globally across 59 jurisdictions with equivalence and
enhanced cooperative regulation arrangements
LSEG diversified mix by product, revenues earned in a variety of currencies – over 50%
income non-GBP
Committed to supporting customers as they prepare contingency plans, but no
discernible change in current customer behaviour across listing, trading, index
and clearing businesses
Select LSEG businesses (Turquoise, UnaVista, TRADEcho) have applied for additional
licences in The Netherlands, should a EU27 location be needed to serve EU customers
in Hard Brexit scenario
LCH Ltd to apply for recognition as a third country (TC) EMIR recognised CCP (32
CCPs already TC recognised) to provide EU customers with continued access, should
this be required;
LCH SA and CC&G to apply for licences from BoE to provide services in UK.
Brexit - LSEG well positioned
Global business,
balanced portfolio
Global clearing operations
Diversified mix of revenues
No discernible change in
customer behaviour
Additional licence and
regulatory preparations in
hand
LSEG committed to orderly function of markets, continuity of service to
customers and supporting financial stability.
London Stock Exchange Group
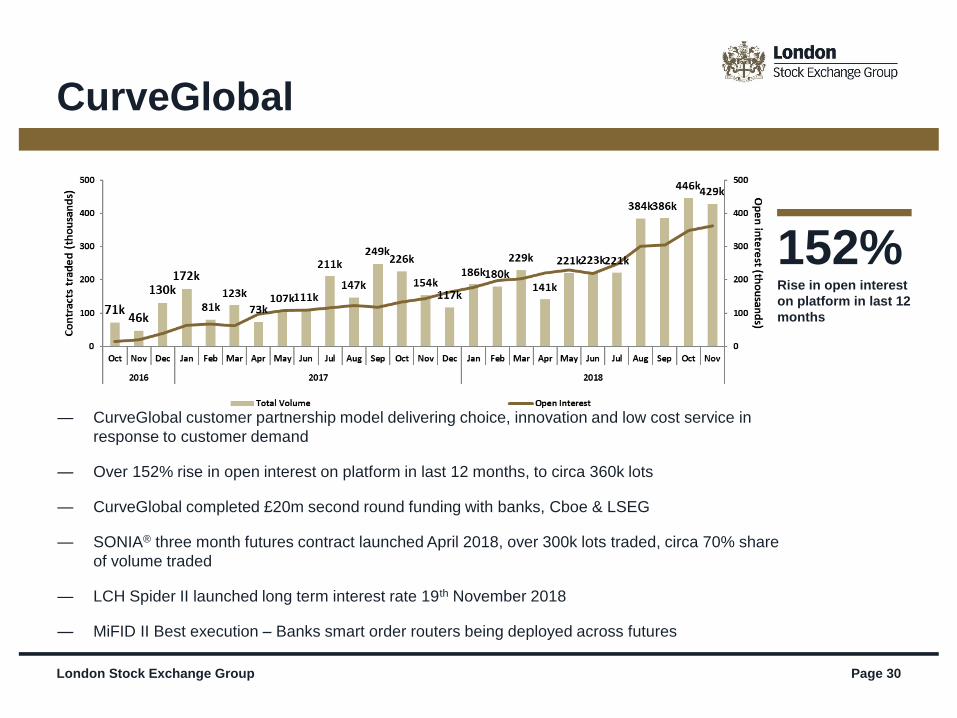
— CurveGlobal customer partnership model delivering choice, innovation and low cost service in
response to customer demand
— Over 152% rise in open interest on platform in last 12 months, to circa 360k lots
— CurveGlobal completed £20m second round funding with banks, Cboe & LSEG
— SONIA® three month futures contract launched April 2018, over 300k lots traded, circa 70% share
of volume traded
— LCH Spider II launched long term interest rate 19th November 2018
— MiFID II Best execution – Banks smart order routers being deployed across futures
London Stock Exchange Group Page 30
CurveGlobal
152%Rise in open interest
on platform in last 12
months

Appendices
Page 31
London Stock Exchange Group Page 32
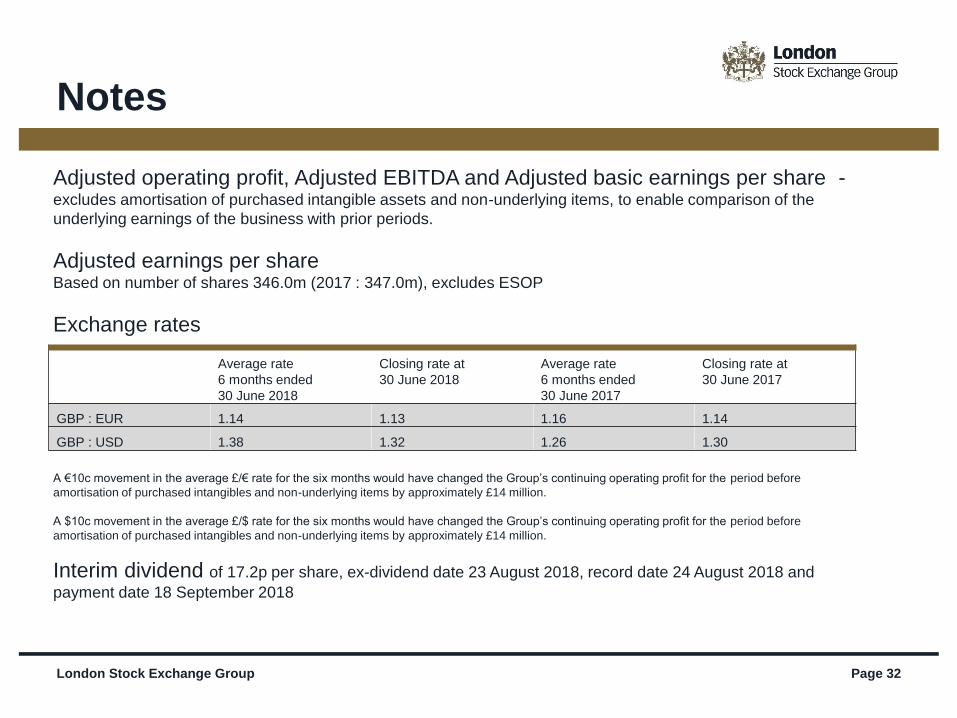
Notes
Adjusted operating profit, Adjusted EBITDA and Adjusted basic earnings per share -excludes amortisation of purchased intangible assets and non-underlying items, to enable comparison of the
underlying earnings of the business with prior periods.
Adjusted earnings per shareBased on number of shares 346.0m (2017 : 347.0m), excludes ESOP
Exchange rates
A €10c movement in the average £/€ rate for the six months would have changed the Group’s continuing operating profit for the period before
amortisation of purchased intangibles and non-underlying items by approximately £14 million.
A $10c movement in the average £/$ rate for the six months would have changed the Group’s continuing operating profit for the period before
amortisation of purchased intangibles and non-underlying items by approximately £14 million.
Interim dividend of 17.2p per share, ex-dividend date 23 August 2018, record date 24 August 2018 and
payment date 18 September 2018
Average rate
6 months ended
30 June 2018
Closing rate at
30 June 2018
Average rate
6 months ended
30 June 2017
Closing rate at
30 June 2017
GBP : EUR 1.14 1.13 1.16 1.14
GBP : USD 1.38 1.32 1.26 1.30
London Stock Exchange Group Page 33
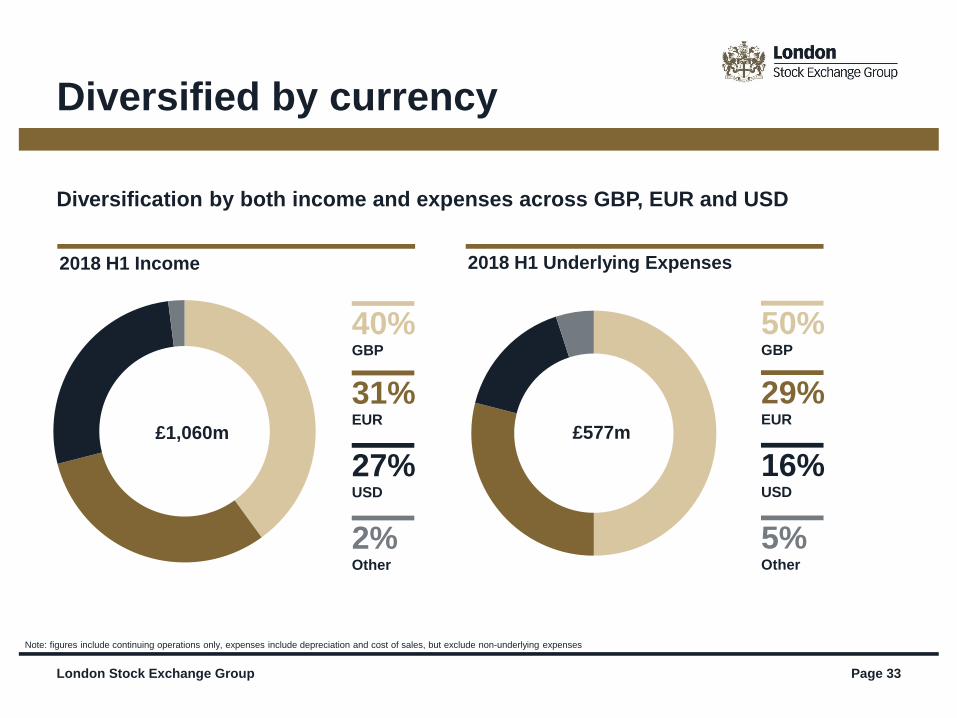
Diversified by currency
Note: figures include continuing operations only, expenses include depreciation and cost of sales, but exclude non-underlying expenses
2018 H1 Income
27%USD
40%GBP
31%EUR
2%Other
£1,060m
2018 H1 Underlying Expenses
16%USD
50%GBP
29%EUR
5%Other
£577m
Diversification by both income and expenses across GBP, EUR and USD
London Stock Exchange Group Page 34London Stock Exchange Group Page 34
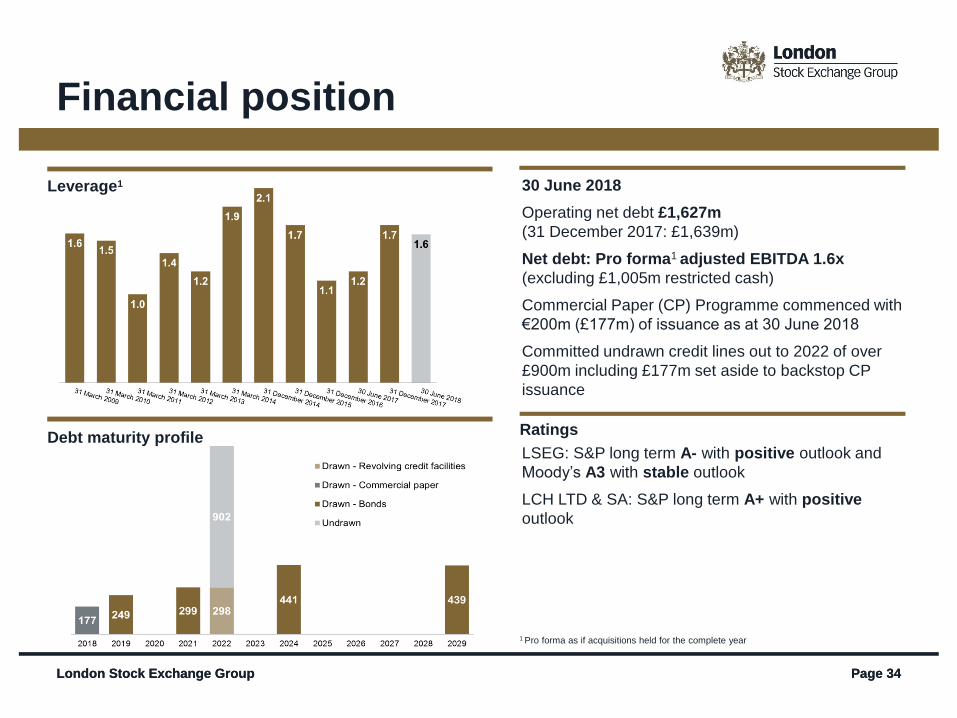
1 Pro forma as if acquisitions held for the complete year
Leverage1
Debt maturity profile
Financial position
30 June 2018
Operating net debt £1,627m
(31 December 2017: £1,639m)
Net debt: Pro forma1 adjusted EBITDA 1.6x
(excluding £1,005m restricted cash)
Commercial Paper (CP) Programme commenced with
€200m (£177m) of issuance as at 30 June 2018
Committed undrawn credit lines out to 2022 of over
£900m including £177m set aside to backstop CP
issuance
LSEG: S&P long term A- with positive outlook and
Moody’s A3 with stable outlook
LCH LTD & SA: S&P long term A+ with positive
outlook
Ratings
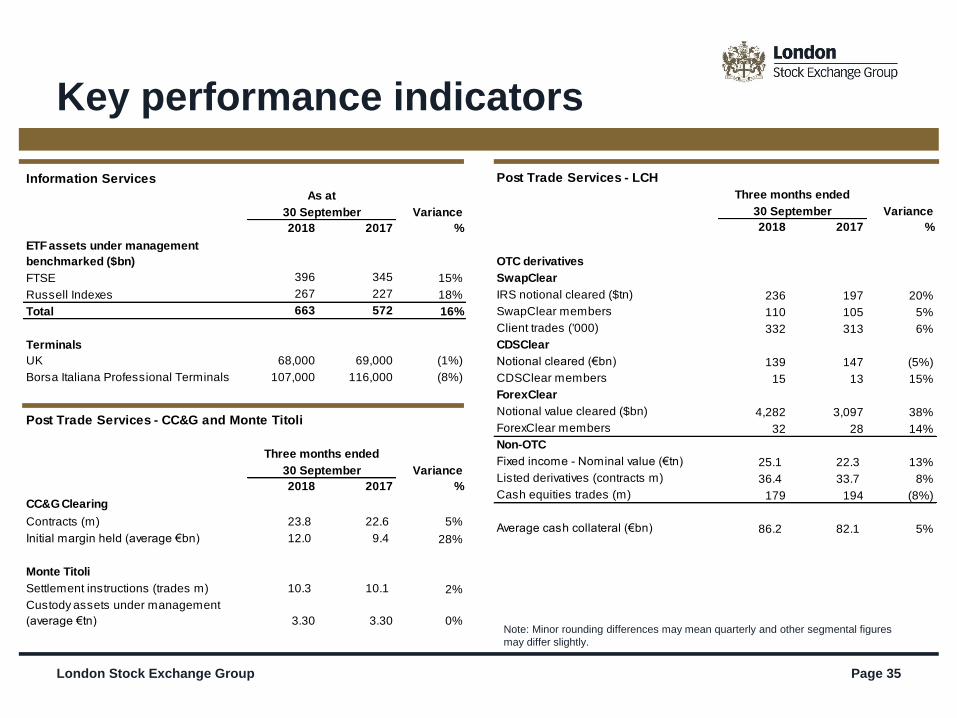
Information Services
Variance
2018 2017 %
ETF assets under management
benchmarked ($bn)
FTSE 396 345 15%
Russell Indexes 267 227 18%
Total 663 572 16%
Terminals
UK 68,000 69,000 (1%)
Borsa Italiana Professional Terminals 107,000 116,000 (8%)
30 September
As at
Post Trade Services - LCH
Variance
2018 2017 %
OTC derivatives
SwapClear
IRS notional cleared ($tn) 236 197 20%
SwapClear members 110 105 5%
Client trades ('000) 332 313 6%
CDSClear
Notional cleared (€bn) 139 147 (5%)
CDSClear members 15 13 15%
ForexClear
Notional value cleared ($bn) 4,282 3,097 38%
ForexClear members 32 28 14%
Non-OTC
Fixed income - Nominal value (€tn) 25.1 22.3 13%
Listed derivatives (contracts m) 36.4 33.7 8%
Cash equities trades (m) 179 194 (8%)
Average cash collateral (€bn) 86.2 82.1 5%
30 September
Three months ended
Post Trade Services - CC&G and Monte Titoli
Variance
2018 2017 %
CC&G Clearing
Contracts (m) 23.8 22.6 5%
Initial margin held (average €bn) 12.0 9.4 28%
Monte Titoli
Settlement instructions (trades m) 10.3 10.1 2%
Custody assets under management
(average €tn) 3.30 3.30 0%
30 September
Three months ended
London Stock Exchange Group Page 35
Key performance indicators
Note: Minor rounding differences may mean quarterly and other segmental figures
may differ slightly.
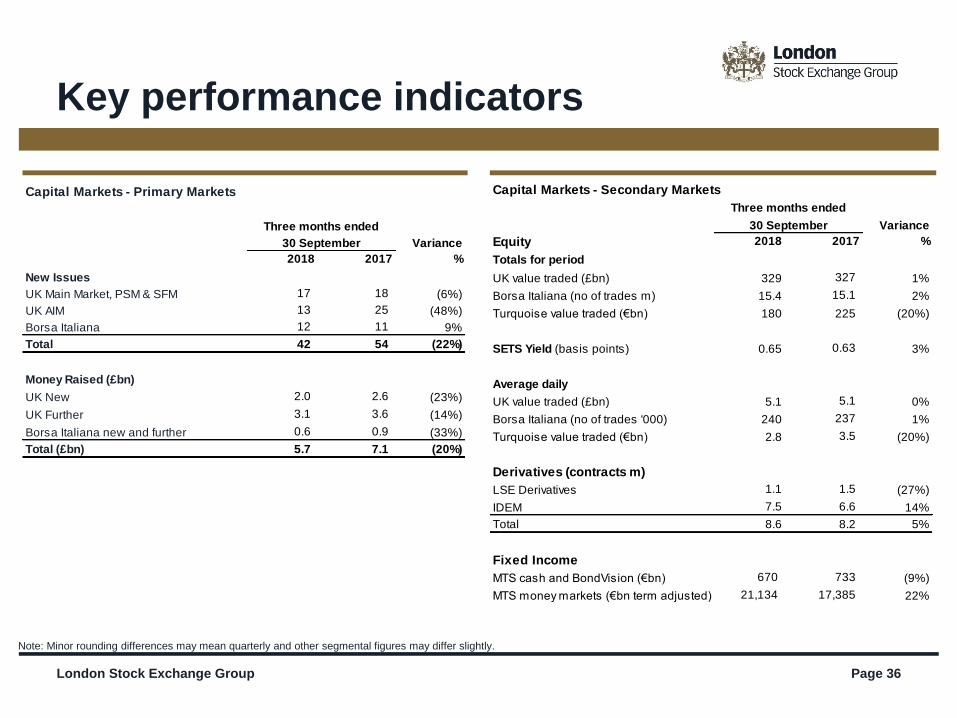
Capital Markets - Secondary Markets
Variance
Equity 2018 2017 %
Totals for period
UK value traded (£bn) 329 327 1%
Borsa Italiana (no of trades m) 15.4 15.1 2%
Turquoise value traded (€bn) 180 225 (20%)
SETS Yield (basis points) 0.65 0.63 3%
Average daily
UK value traded (£bn) 5.1 5.1 0%
Borsa Italiana (no of trades '000) 240 237 1%
Turquoise value traded (€bn) 2.8 3.5 (20%)
Derivatives (contracts m)
LSE Derivatives 1.1 1.5 (27%)
IDEM 7.5 6.6 14%
Total 8.6 8.2 5%
Fixed Income
MTS cash and BondVision (€bn) 670 733 (9%)
MTS money markets (€bn term adjusted) 21,134 17,385 22%
Three months ended
30 September
Capital Markets - Primary Markets
Variance
2018 2017 %
New Issues
UK Main Market, PSM & SFM 17 18 (6%)
UK AIM 13 25 (48%)
Borsa Italiana 12 11 9%
Total 42 54 (22%)
Money Raised (£bn)
UK New 2.0 2.6 (23%)
UK Further 3.1 3.6 (14%)
Borsa Italiana new and further 0.6 0.9 (33%)
Total (£bn) 5.7 7.1 (20%)
Three months ended
30 September
London Stock Exchange Group Page 36
Key performance indicators
Note: Minor rounding differences may mean quarterly and other segmental figures may differ slightly.
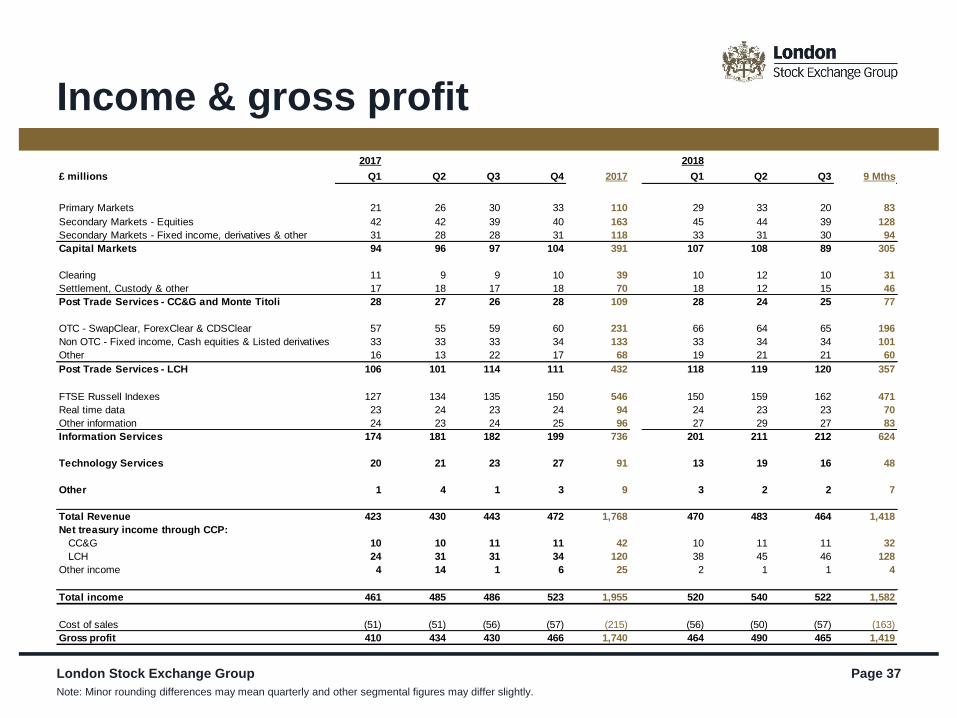
2017 2018
£ millions Q1 Q2 Q3 Q4 2017 Q1 Q2 Q3 9 Mths
Primary Markets 21 26 30 33 110 29 33 20 83
Secondary Markets - Equities 42 42 39 40 163 45 44 39 128
Secondary Markets - Fixed income, derivatives & other 31 28 28 31 118 33 31 30 94
Capital Markets 94 96 97 104 391 107 108 89 305
Clearing 11 9 9 10 39 10 12 10 31
Settlement, Custody & other 17 18 17 18 70 18 12 15 46
Post Trade Services - CC&G and Monte Titoli 28 27 26 28 109 28 24 25 77
OTC - SwapClear, ForexClear & CDSClear 57 55 59 60 231 66 64 65 196
Non OTC - Fixed income, Cash equities & Listed derivatives 33 33 33 34 133 33 34 34 101
Other 16 13 22 17 68 19 21 21 60
Post Trade Services - LCH 106 101 114 111 432 118 119 120 357
FTSE Russell Indexes 127 134 135 150 546 150 159 162 471
Real time data 23 24 23 24 94 24 23 23 70
Other information 24 23 24 25 96 27 29 27 83
Information Services 174 181 182 199 736 201 211 212 624
Technology Services 20 21 23 27 91 13 19 16 48
Other 1 4 1 3 9 3 2 2 7
Total Revenue 423 430 443 472 1,768 470 483 464 1,418
Net treasury income through CCP:
CC&G 10 10 11 11 42 10 11 11 32
LCH 24 31 31 34 120 38 45 46 128
Other income 4 14 1 6 25 2 1 1 4
Total income 461 485 486 523 1,955 520 540 522 1,582
Cost of sales (51) (51) (56) (57) (215) (56) (50) (57) (163)
Gross profit 410 434 430 466 1,740 464 490 465 1,419
London Stock Exchange Group Page 37
Income & gross profit
Note: Minor rounding differences may mean quarterly and other segmental figures may differ slightly.
London Stock Exchange Group plc
10 Paternoster Square
London
EC4M 7LS
For information on the Group:
www.lseg.com
London Stock Exchange Group plc
10 Paternoster Square
London
EC4M 7LS
For information on the Group:
www.lseg.com
London Stock Exchange Group
Paul Froud
Head of Investor Relations
Tel: +44 (0)20 7797 1186
email : [email protected]
Tom Woodley
Investor Relations Manager
Tel: +44 (0)20 7797 1293
email: [email protected]
Ian Hughes
Investor Relations Executive
email: [email protected]
Page 38
Contacts