Embed Size (px)
Citation preview

Earlier versions of this paper were presented to the Alternative Futures and Popular Protest conference in March 2013 and the British Sociological Association conference in April 2014. We thank Betsy Stanko and Trevor Adams from the Metropolitan Police Service and Vicky Roberts from the Charity Commission for their help in accessing the data. We also thank Ben Bradford, Tak Wing Chan, Raheel Dhattiwala, Jalal Imran, Rima Majed, David Pettinicchio, Federico Varese, Wybo Wiersma and two anonymous reviewers for their valuable feedback. Please direct correspondence to Juta Kawalerowicz, Nuffield College, University of Oxford, UK; E-mail: [email protected].
London Riot of 2011
Anarchy in the UK: Economic Deprivation, Social Disorganization, and Political Grievances in the London Riot of 2011
Juta Kawalerowicz and Michael Biggs, University of Oxford
Thousands rioted in London in August 2011, with the police losing control of parts of the city for four days. This event was not an ethnic riot: participants were ethni-cally diverse and did not discriminate in choosing targets for looting or destruc-
tion. Whereas the sociological literature has focused on variation in rioting across cities, we examine variation within London by mapping the residential addresses of 1,620 rioters—who were subsequently arrested and charged—on to 25,022 neighbor-hoods. Our findings challenge the orthodoxy that rioting is not explained by deprivation or by disorganization. Rioters were most likely to come from economically disadvan-taged neighborhoods. Rioters also tended to come from neighborhoods where ethnic fractionalization was high, and from areas with few charitable organizations. Political grievances also emerge as important. Rioters were more likely to come from boroughs where the police had previously been perceived as disrespectful.
It wasn’t no drama, no stress, everyone had the power. Everyone had the strength.The police wasn’t in control. We had the power.
—Young man recalling the riot (BBC 2012)
The outbreak of rioting in London in August 2011 was an extraordinary episode in British history. Over four days, thousands of people took part in destruction and looting, causing property damage costing at least $50 million. The police ceded control of large swathes of territory; rioting occurred in two-thirds of the city’s boroughs. Rioting in London also inspired outbreaks elsewhere in Eng-land, including Manchester and Birmingham. Parliament was recalled from summer recess to deal with the crisis. Eventually more than 3,000 people were arrested in the capital. This was the most widespread and prolonged breakdown
London Riot of 2011 673
© The Author 2015. Published by Oxford University Press on behalf of the University of North Carolina at Chapel Hill. All rights reserved. For permissions, please e-mail: [email protected].
Social Forces 94(2) 673–698, December 2015doi: 10.1093/sf/sov052
Advance Access publication on 8 March 2015
at Bodleian Library on D
ecember 1, 2015
http://sf.oxfordjournals.org/D
ownloaded from

of order in London’s history since the Gordon riot of 1780. What makes this episode sociologically intriguing is its divergence from the familiar pattern of an ethnic riot. To be sure, it was triggered by the police shooting of a young man of mixed race, but there the resemblance ends. The rioters were ethnically hetero-geneous: of those arrested in London, just under half were classified as black, while a third were white. Rioters did not focus on any ethnic group when target-ing properties, and only the police were subject to sustained attack. The socio-logical literature has been dominated by ethnic riots in the United States, especially the spectacular wave of riots by African Americans in the 1960s. The London riot therefore provides an opportunity to test sociological theories on another sort of event.
Sociological investigation of riots is dominated by the examination of varia-tion in frequency and severity of rioting across American cities. Lieberson and Silverman (1965) conducted the first systematic comparison, while Spilerman (1970, 1971, 1976) provocatively concluded that social conditions did not matter. The tradition culminated in sophisticated event-history analyses by Myers (1997, 2000, 2010) and by Olzak and collaborators (Olzak 1992; Olzak and Shanahan 1996; Olzak, Shanahan, and McEneaney 1996). These studies are ideal for tracing the diffusion of rioting from one city to another. Taking the city as the unit of observation, however, provides only limited insight into the social con-texts conducive to riots, because rioting is highly localized. There are surprisingly few systematic analyses of variation in rioting within a city.1 Bergesen and Herman (1998; see also Herman 2005) locate riot fatalities within Census tracts in six major American riots during the twentieth century. Baudains, Braithwaite, and Johnson (2013) map offenses during the London riot of 2011 within areas comprising about 1,500 people. We exploit similar data to analyze variation within London. Unlike previous work, we investigate where rioters lived rather than where riot offenses were committed, which has the advantage of more pre-cisely matching individuals to their social context. We also disaggregate to smaller neighborhoods, containing about 300 residents. The dependent variable is the number of rioters—those arrested and charged for offenses committed during the riot—in each neighborhood.
The findings contribute to the literature on riots in three ways. One is to show that relations between residents and police made a significant difference to the prevalence of rioting within London. Although it is obvious that riots are often sparked by illegitimate police actions, our analysis is unique in measuring resi-dents’ perceptions of the police before the outbreak. A second contribution is to demonstrate the importance of economic deprivation for explaining rioting. The literature has rejected deprivation on the grounds that it does not explain varia-tion across cities; orthodoxy is reinforced by the misinterpretation of findings from the 1960s riots. This rejection is challenged by our analysis. The third con-tribution is to identify the significance of social disorganization, insofar as it is measured by ethnic fractionalization and (inversely) by density of charitable organizations. These measures are standard in studies of communities and crime; our innovation is to deploy them to explain rioting. The fact that rioting increased with ethnic fractionalization—after accounting for ethnic composition—is con-sistent with the controversial argument that diversity reduces social cohesion.
674 Social Forces 94(2)
at Bodleian Library on D
ecember 1, 2015
http://sf.oxfordjournals.org/D
ownloaded from

The London RiotWe define a riot as an event in which a large number of people deliberately dam-age property and attack others; this often also involves looting. The numerical threshold is not pertinent here; it is often 30 or 50 participants (Wilkinson 2009, 330). A riot invariably involves vicarious participants who watch and thereby encourage those who attack, destroy, or steal (Collins 2008, 413–30). But here we restrict the term “rioter” to those who actually commit the acts. “Riot” covers a wide variety of events, and so it is useful to make two heuristic distinctions (drawing on typologies by Marx [1970]; McPhail [1994]).2 The first is the occa-sion for the riot. Some riots develop out of another event, like a protest demon-stration or sporting fixture; such riots are often explained as the spontaneous reaction, by a minority, to aggressive policing (e.g., Stott and Reicher 1998). In other cases, the event is a riot from the outset: people assemble specifically for the purpose of rioting (or of watching others do so). A second distinction is the type of target. In some cases, rioters target the police or other organs of state power. In other cases, they primarily target another non-state group.
These distinctions will help situate the London riot. On August 4, a specialized armed unit of police shot and killed a young man of mixed race from Tottenham—Mark Duggan—whom they suspected of carrying a gun. The circumstances of his death were unclear (and remain disputed). Certainly the authorities released false information to the media and failed to properly communicate with the family. Rumors circulated that Duggan had been deliberately assassinated. These accusa-tions were taken up by the Black Independent Advisory Group, established to challenge policing in Haringey Borough (which encompasses Tottenham). Two days after the shooting, on the afternoon of August 6, activists from the Group and Duggan’s family led a demonstration to the Tottenham police station. About a hundred protesters waited while negotiations with the police continued. Over a period of three hours in the evening, crowds gathered and the tension grew. A police car was set alight and rioting began, inflamed by rumors (apparently false) that police at the scene had just beaten a young black woman or girl (Guardian, December 9, 2011). This initial outbreak can be classified as a riot developing out of a protest. Hypothetically, if the police had defused the situation at the outset, the riot would not have occurred. Rioting spread to other points in Haringey Bor-ough that night, as the police ceded control of the streets.3
Rioting on subsequent nights occurred as people congregated specifically for that purpose. The rioting spread across London and to a few other English cities. When interviewed subsequently, rioters recounted their anger at the police, frus-tration at economic deprivation, resentment toward the government for cutting social programs, and the lure of looting. The relative importance of these motiva-tions—to put it crudely, whether protest or crime was paramount—is debated. Lewis et al. (2011, 4) highlight the “anger and frustration at people’s every day treatment at the hands of the police.” This emphasis is criticized by Treadwell, Briggs, and collaborators (Treadwell et al. 2013, 1), whose interviews contained “far more mentions of designer clothing brand names such as Gucci and Prada than of the name of Mark Duggan.” Briggs (2012) suggests that rioters initially justify their involvement by anger at the police; only as the interview continues do
London Riot of 2011 675
at Bodleian Library on D
ecember 1, 2015
http://sf.oxfordjournals.org/D
ownloaded from
they gradually admit the importance of material gain. Discerning individual moti-vations is complicated by the fact that the decision to riot depends heavily on the actions of others. A schoolgirl recounted how her initial reluctance was overcome: “because everyone was doing it, I thought, if everyone was doing that and no one is getting caught at the time, why can’t I do it?” (BBC 2012; see also Lewis et al. 2011, 29; Morrell et al. 2011, 29). The riot, like other waves of protest, was gener-ated in part by positive feedback: people participated because others were partici-pating (Biggs 2003). Alongside television, BlackBerry Messenger was important in relaying information as events unfolded (Morrell et al. 2011, 30–33).
As observed at the outset, the London riot is not usefully framed as an ethnic riot. Obviously this event was completely different from a riot in which one ethnic group attacked another, like whites and blacks in Chicago in 1919 (Chicago Commission on Race Relations 1922) or Hindus and Muslims in Ahmedabad in 2002 (Dhattiwala and Biggs 2012). More subtlety is needed to distinguish the London riot from the American “race” or “ghetto” riots of the 1960s, such as Watts, Newark, and Detroit (Fogelson 1971; Janowitz 1968). Those were sparked by a confrontation between white police and black citizens. Most importantly, the great majority of rioters were black (NACCD 1968, 74).4 Notorious riots in Lon-don in the 1980s fit the same pattern: in Brixton in 1981, and at the Broadwater Farm Estate in Tottenham in 1985 (Benyon and Salomos 1987; Keith 1993). The London riot differed in important respects. Duggan’s father was from Jamaica, but his mother is white. His maternal aunt was prominent at the standoff outside Tottenham police station, and some of the protesters were white.5 The senior police officer who tried to defuse the situation is not white; the crowd shouted “Uncle Tom” at him (Guardian, July 2, 2012). The precipitating incident was therefore not strictly black and white. When interviewed, rioters did not consider the event to be a race riot (Lewis et al. 2011, 5). Finally, the rioters were ethnically heterogeneous. Of those arrested in London, 47 percent were classified as black, 32 percent as white, 11 percent as mixed, and 8 percent as South Asian (Home Office 2011, 29). Blacks were overrepresented in comparison to the population, and whites underrepresented, but no group comprised a pronounced majority.
Explaining RiotsRiots can be explained in various ways. We focus on the social, economic, and political circumstances that are conducive to rioting. This means neglecting the dynamics of the riot as a process, not because these dynamics are less impor-tant but because our ecological data are particularly suited to investigating cross-sectional variation. We consider five distinct explanations: deprivation, relative deprivation, ethnic competition, social disorganization, and political grievances.
Deprivation—standing for poverty, unemployment, and lack of education—is an obvious explanation for rioting. Several mechanisms can be adduced. People who are deprived have less reason to view societal institutions as legitimate. They have more to gain from looting, and less to lose from a criminal conviction. Deprivation may also operate indirectly. People who are deprived are less able to exercise power via political parties or social movements. They are more likely to
676 Social Forces 94(2)
at Bodleian Library on D
ecember 1, 2015
http://sf.oxfordjournals.org/D
ownloaded from

experience conflict with police. Since the 1970s, however, sociologists have rejected or at least downplayed deprivation (prominent exceptions are Piven and Cloward [1992]; Useem [1998]). The reasons are worth scrutinizing.
In the 1960s, politicians denounced rioters as “riffraff” (Fogelson 1967), while sociological theory—in the tradition of Le Bon and Blumer—branded them as irrational (McPhail 1989). Rejecting these notions, revisionist sociologists unfor-tunately equated them with deprivation as an explanation. In addition, revisionists tended to conflate rioting with other forms of contention where privileged rather than deprived strata were in the vanguard; consider the role of college students in the Civil Rights movement (Andrews and Biggs 2006). When all forms of conten-tion are lumped together, then deprivation is no longer a plausible explanation.
Research on individual participation in the 1960s riots has been interpreted as refuting deprivation. McPhail (1971) summarizes 10 reports on individual partici-pation. Out of 50 bivariate associations with variables for deprivation, Cramer’s V is not statistically significant (at the .05 level) 19 times, and it exceeds .3 only twice. One wonders how many sociological findings would survive such stringent bivari-ate tests in small samples. Oberschall’s (1973, 307) pioneering treatise crystallized the emerging consensus: “the majority of rioters were a representative cross section of the youth and adult males resident in the neighborhoods in which rioting occurred and were not composed of habitual criminals, recent migrants, the unem-ployed and uneducated under-class.” The cited evidence does not provide unequiv-ocal support for all these assertions. Just over half the arrested rioters had a criminal record, though that may not denote habitual criminality (Fogelson and Hill 1968, 247). Although most rioters were not unemployed, surveys of Newark and Detroit (Caplan and Paige 1968) actually provide evidence that unemployment increased the probability of an individual rioting within riot-affected areas. Most impor-tantly, Oberschall’s statement avoids the first-order question of whether rioters were more deprived than the population of the city as a whole, or equivalently whether rioting tended to occur in deprived neighborhoods. Oberschall’s (1968, 328) own analysis of the Watts riot confirms its “lower-class character.”
There is evidence against deprivation from multivariate analysis of variation across and within American cities. Deprivation has no effect or a negative effect—the opposite from that predicted—on rioting (Herman 2005, 152; Olzak and Shanahan 1996, 949; Olzak, Shanahan, and McEneaney 1996, 604). Note, how-ever, that nonwhite unemployment is incorporated into one of Olzak and Shana-han’s (1996, 942) preferred explanatory variables, competition. And the percentage or number of unemployed nonwhites significantly increases the prob-ability of a riot (DiPasquale and Glaeser 1998, 69; Myers 1997, 107). Within cities, deprivation has no additional effect on fatalities when ethnic competition is taken into account (Bergesen and Herman 1998, 50; Herman 2005, 71, 110, 152). In sum, deprivation receives little support, but the evidence is less compel-ling than is portrayed.
Relative deprivation is a distinct explanation. People are more likely to riot if their conditions are relatively worse than those of a comparison group. For the 1960s riots, for example, blacks would riot where their conditions were worse relative to whites. Although the theoretical logic is compelling, relative deprivation receives little empirical support (e.g., Caplan and Paige 1968, 20; Lieske 1978,
London Riot of 2011 677
at Bodleian Library on D
ecember 1, 2015
http://sf.oxfordjournals.org/D
ownloaded from

1327; Olzak and Shanahan 1996, 949; an exception is Morgan and Clark [1973], 621). This explanation is more difficult to test, because the scope of comparison remains unspecified by theory. It properly requires evidence on subjective beliefs before the riot; surveys and interviews undertaken afterward are inevitably influ-enced by the riot itself. Without such evidence, a proxy can be constructed from the relative affluence of the surrounding areas.
Ethnic competition has emerged as the master variable in recent literature on American riots. Olzak (1992, 3) argues that “ethnic conflicts and protests erupt when ethnic inequalities and racially ordered systems begin to break down.” The mechanism here is threat: people in one group are more likely to riot if they feel another group has designs on their prerogatives (Blumer 1958). The findings are complex. Race riots were more likely in cities with higher levels of segregation between whites and nonwhites, yet also where segregation was decreasing (Olzak, Shanahan, and McEneaney 1996, 604). Within a city, riot fatalities tended to occur in tracts where the black percentage was high and increasing; in Los Angeles in 1992, though, fatalities happened where the black percentage was declining (Berge-sen and Herman 1998, 50; Herman 2005, 71, 110, 152). These results make sense theoretically where a majority was threatened by an increasing minority, such as whites threatened by blacks in Chicago in 1919 or blacks (the majority in the local area) threatened by Latinos in Los Angeles in 1992. In Newark and Detroit in 1967, however, the interpretation of these results seems less straightforward.
The literature on riots often specifies “breakdown” as a distinct explanation (e.g., Useem 1998), but this lacks theoretical amplification. Drawing on the exten-sive literature on crime and community (e.g., Sampson and Groves 1989; Samp-son 2012), we use the concept of “social disorganization” (Shaw and McKay 1942) as synonymous with low levels of social cohesion or social capital or collec-tive efficacy.6 The mechanism linking this with rioting is the same as for crime: in a disorganized community, the law-abiding majority is not able to prevent or pun-ish criminal actions by a minority of young people. This mechanism does not apply to a riot with widespread support, where the majority of the community approves of rioters attacking a minority. It could be relevant, however, where riot-ers destroy property and loot stores close to home, thus harming the majority of residents. Social disorganization is ideally measured by survey questions (Warren 1969). In the absence of a direct measure, we can try to grasp social disorganiza-tion at various points in a hypothetical sequence. One potential cause is residential mobility (Kasarda and Janowitz 1974; Baudains, Braithwaite, and Johnson 2013). Another is ethnic fractionalization: the extent to which people belong to different ethnic groups. (Do not confuse this with “diversity” as a euphemism for the pro-portion of nonwhites.) Several American studies find that people in more fraction-alized communities are less trusting and less likely to participate in collective activities (Alesina and Ferrara 2000, 2002; Putnam 2007). Whether this finding applies to Britain is debated (Demireva and Heath 2014; Laurence 2011; Letki 2008; Sturgis et al. 2010). The density of charitable organizations provides argu-ably the most direct measure (Sampson 2012). Finally, a potential consequence of disorganization is low electoral turnout (Putnam 1993).
Political grievances provide a final explanation. Grievances over policing are the most obvious, given that so many riots are precipitated by an incident in
678 Social Forces 94(2)
at Bodleian Library on D
ecember 1, 2015
http://sf.oxfordjournals.org/D
ownloaded from

which the police are seen to have acted unjustly (e.g., NACCD 1968, 69; Keith 1993). Note, however, that the vast majority of such incidents do not trigger a riot. There is surprisingly little evidence that policing explains cross-sectional variation. Variables such as the number of police officers or the expenditure on police cannot capture the quality of policing (Carter 1987; DiPasquale and Glaeser 1998; Morgan and Clark 1973). In the American context, the ratio of black police officers to black population is pertinent, but appears only in bivari-ate analysis (Lieberson and Silverman 1965, 896). When surveyed retrospectively, rioters are more aggrieved by the police than are nonparticipants (e.g., Murphy and Watson 1970, 186; Santoro and Broidy 2014). Such evidence is problematic because the grievances may be the result, rather than the cause, of participating in the riot (McPhail 1971). More fundamentally, even if grievances predated the riot, they could reflect criminality on the part of people who subsequently rioted as well as malpractice on the part of the police. (As observed above, rioters are more likely to have a criminal record.) Ideally, then, we want evidence on griev-ances among the community as a whole, predating the riot. Perez, Berg, and Myers (2003) use a survey conducted in 1966 to compare attitudes to the police in San Francisco and Boston before subsequent riots, but rioting had occurred in the former just before the survey (New York Times, September 29, 1966).
Grievances over the provision of public services do not feature in the socio-logical literature, no doubt because the American riots of the 1960s coincided with a period of increasing government expenditure. Indeed, riots were more likely in cities with higher expenditure (DiPasquale and Glaeser 1998, 67; Lieske 1978, 1331). (Racial disparity in public services has not been tested.) Nevertheless, grievances over cuts in public services provide a plausible explana-tion for the London riot of 2011, given the testimony of rioters and the timing of the riot after the accession of a Conservative government (in 2010) committed to cutting public expenditure. At the most aggregate level, with country-year as the unit of analysis, there is suggestive evidence that budget cuts increase protest, including riots (Ponticelli and Voth 2011).
From this review of explanations, we draw five hypotheses. Rioters came from areas that were:
1. economically deprived2. surrounded by prosperous areas3. socially disorganized4. characterized by poor relations with police5. subjected to cuts in public expenditure
Hypothesis 1 is formulated in accordance with commentary on the London riot, though the orthodox sociological view would not expect it to hold. Ethnic com-petition is excluded from the hypotheses because no ethnic group predominated in this riot.
Data and MethodThe Metropolitan Police provided an anonymized list of 3,552 individuals whom they arrested in connection with the 2011 riot. This police force covers the
London Riot of 2011 679
at Bodleian Library on D
ecember 1, 2015
http://sf.oxfordjournals.org/D
ownloaded from

conurbation of Greater London, with a population of 8.2 million.7 We filter this list by three criteria. First, we exclude individuals arrested for crimes committed after August 10, whose offenses—such as handling stolen goods—did not imply participation in the actual riot. Second, we exclude individuals who were arrested but not subsequently charged in court. This exclusion distinguishes our study from previous analyses of arrest data (e.g., Fogelson and Hill 1968; Baudains, Braithwaite, and Johnson 2013).8 Third, we necessarily exclude individuals for whom no postcode was recorded (or whose postcode could not be identified). This reduces the number of individuals to 1,674. The most common offenses were burglary and violent disorder (in which three or more people “use or threaten unlawful violence”).
How representative is this “sample” of rioters? Oberschall (1968, 327) warns that “those arrested are more likely to be representative of the groups which were milling about or looting than of the activists.” After all, a riot signifies that the police have lost control—and so individuals at the vortex are relatively invulner-able to arrest. Fortunately for our purpose, the police devoted unprecedented resources to subsequent investigations (Metropolitan Police 2012, 124–29). Hun-dreds of detectives were assigned, and they exploited CCTV, which is ubiquitous in Britain. Almost two-thirds of our sample were arrested after August 10, extending to January 2012. We should acknowledge two offsetting biases in these later investigations. On one hand, the police could more readily identify suspects already known to them from previous brushes with the law (if the police tended to round up the usual suspects, we minimize this bias by restricting the sample to those against whom evidence was sufficient to prosecute). On the other hand, experienced criminals were more adept at avoiding arrest, for example conceal-ing themselves from CCTV (Harding 2012, 208–9). Seven out of 10 of those arrested for riot offenses in London had a prior criminal record, albeit this includes infractions too minor to warrant prosecution (Metropolitan Police 2012, 14).9 This accords nicely with 270 English rioters interviewed by Lewis et al. (2011, 14), of whom 68 percent admitted to a criminal record. Furthermore, the scale of the police investigations ensures that our sample is a significant frac-tion of the total number of rioters. Although any estimate of the total is hazard-ous, it must have been on the order of 10,000 in London.
One great virtue of our data is that British postcodes provide exceptional spa-tial resolution (first exploited by Biggs and Knauss [2012]). The residential addresses of rioters are matched with the smallest geographical unit available from the Census, the “output area.” At the 2011 Census—undertaken just four months before the riot—there are 25,022 of these neighborhoods (as they will be termed) in London, with a median of 321 residents. Of our sample, 3 percent lived outside London. The remaining 1,620 individuals were located in 1,375 neighborhoods (5 percent of the total). Figure 1 maps the geographical distribu-tion, showing borough boundaries. Boroughs are units of governance with elected councils and control over local services.
The most flexible estimation strategy is a hurdle model with two components: logistic regression to predict whether any rioters came from the neighborhood; and if there were any, zero-truncated negative binomial regression to predict their number (Hilbe 2011). The second component has little power—only 199
680 Social Forces 94(2)
at Bodleian Library on D
ecember 1, 2015
http://sf.oxfordjournals.org/D
ownloaded from

neighborhoods had more than a single rioter, and the maximum number of riot-ers was six—and so we focus on the logistic regression.10 This enables us to incorporate a multilevel structure, with neighborhoods nested within 624 electoral wards (comprising roughly 10,000 residents), in turn nested within 32 boroughs (comprising roughly a quarter of a million). We estimate the probability of neighborhoods having one or more rioters, piwb, where neighborhoods (i) are grouped by ward (w) and borough (b):
ln ln( ) .( ) ( )pp
P Xiwb
iwbiwb k kiwb wb b1 0
2 3
−⎛⎝⎜
⎞⎠⎟ = + + + +∑β β ζ ζ
P is the population, and Xk are independent variables. To account for the cluster-ing of neighborhoods within wards and boroughs, random intercepts ζ(2) and ζ(2) are entered at each level, drawn from the normal distribution with mean zero and variance ψ(2) and ψ(3), respectively. Most independent variables are measured at the neighborhood level.11 Table 1 provides the summary statistics (and appendix table A1 the correlations).
For Hypothesis 1, several variables measure deprivation. Because these variables are intercorrelated, we construct an index following Land, McCall, and Cohen (1990) and subsequent neighborhood research (e.g., Sampson, Raudenbush, and Earls 1997; Kirk and Papachristos 2011). Principal-component factor analysis is used to combine unemployment, adults without educational qualifications, employment in routine and semi-routine occupations, over-crowded housing, council housing (equivalent to public housing in the United
Figure 1. Geographic distribution of rioters in London
London Riot of 2011 681
at Bodleian Library on D
ecember 1, 2015
http://sf.oxfordjournals.org/D
ownloaded from

States), and single parents (detailed in appendix table A2). Each variable is highly correlated with at least one of the others (maximum pairwise r = .88). The final two variables—council housing and single parents—could conceivably be
Table 1. Summary Statistics
Variable min median mean std dev max
(1) At least one rioter arrested and charged
.00 .00 .05 .23 1.00
(2) Population 91 321 326 83 2296
(3) Youth .00 .11 .12 .05 .95
(4) Proximity to nearest Foot Locker .00 .12 .52 1.60 16.00
(5) Population density .00 .10 .12 .20 22.60
(6) Ethnicity: white Irish .00 .02 .02 .02 .24
(7) Ethnicity: white other .00 .11 .13 .08 .63
(8) Ethnicity: black African .00 .04 .07 .07 .64
(9) Ethnicity: black Caribbean .00 .03 .04 .05 .34
(10) Ethnicity: Asian Pakistani .00 .01 .02 .04 .46
(11) Ethnicity: Asian Indian .00 .03 .06 .09 .76
(12) Ethnicity: Asian Bangladeshi .00 .00 .02 .07 .90
(13) Ethnicity: Asian other .00 .03 .05 .04 .52
(14) Ethnic segregation (ward) .03 .07 .07 .02 .14
(15) Deprivation index –2.02 –.13 .00 1.00 3.61
(16) Deprivation index (ward) –1.44 –.02 –.01 .67 1.76
(17) Class: managerial and professional
.01 .34 .37 .16 .90
(18) Class: intermediate professions .00 .11 .12 .04 .39
(19) Class: small employers and self-employed
.00 .09 .09 .03 .45
(20) Relative affluence in surrounding area
–.48 .00 .00 .11 .47
(21) Home ownership .00 .48 .49 .25 1.00
(22) Immigrants arrived since 2010 .00 .03 .04 .04 .60
(23) Ethnic fractionalization .04 .72 .67 .18 .91
(24) Density of charitable organizations (ward)
.00 .55 .62 .39 2.74
(25) Voting turnout at 2010 local election (ward)
.36 .61 .62 .07 .79
(26) Opinion that police are respectful (borough)
4.67 5.32 5.30 .35 6.19
(27) Growth of government expenditure, 2009/10–2010/11 (borough)
–.15 .00 .00 .04 .08
682 Social Forces 94(2)
at Bodleian Library on D
ecember 1, 2015
http://sf.oxfordjournals.org/D
ownloaded from

interpreted as also measuring social disorganization. If they are omitted from the index and included as separate variables, they are not statistically significant and the effect of the index remains unaltered. An index makes it simpler to incorpo-rate deprivation on a wider geographical scale: we also enter the weighted mean of the deprivation index within the ward’s neighborhoods. Aside from the depri-vation index, we capture affluence by including the proportion of the occupied population in each of the three top occupational classes (out of five): managerial and professional; intermediate occupations; and small employers and self-employed. These three variables are expected to reduce rioting.
For Hypothesis 2, relative deprivation, we measure the extent to which the neighborhood is surrounded by more affluent neighborhoods:
R
A A
Jiwb
j iwbj
J
=−
=∑
1
A is the proportion of the occupied population in the top class (managers and professionals), for all neighborhoods (j = 1 … J) within a certain distance of neighborhood iwb (measured from each centroid). After experimentation, 1,500 meters is used for the distance threshold.
Social disorganization, Hypothesis 3, is explored using several variables. These are not highly correlated, unlike those for deprivation. Residential mobility in the year preceding the 2011 Census is sadly not yet available. Two variables are sub-stituted. One is the proportion of residents who had immigrated to the United Kingdom since 2010. Another is the proportion of households owned (outright or mortgaged), which is expected to reduce rioting. Ethnic fractionalization is derived from the 18 ethnic identities offered by the Census (detailed below). The standard Herfindahl or Simpson index is calculated to yield the probability that two individuals randomly drawn from the neighborhood belong to different eth-nic groups.12 The density of charitable organizations is equivalent to Sampson’s (2012, ch. 8) density of nonprofit organizations. The Charity Commission regis-ters all charitable incorporated organizations whose annual income reaches £5,000.13 Each charity has a contact person with a physical address (not a post box). Starting from the Commission’s database at July 2011, we select all organi-zations whose scope of operation included London. Because some organizations (like the Boy Scouts) register numerous local affiliates at the same national head-quarters, we discard duplicate organizations insofar as they had the same contact person. This leaves 5,000 charities whose postcode suffices for geocoding. We count the number in each ward, denominated by population (in thousands).14 There is one outlier: the ward enclosing Buckingham Palace has double the den-sity of charities as the next highest, reflecting its prestigious location. The next highest value is substituted, though this does not alter the results. The final vari-able for social disorganization is electoral turnout. The proportion of the eligible electorate who voted in London’s local elections in May 2010 is expected to reduce rioting.15
Hypotheses 4 and 5, on political grievances, are tested by variables at the bor-ough level. With only 32 boroughs, it is necessary to choose a single variable for
London Riot of 2011 683
at Bodleian Library on D
ecember 1, 2015
http://sf.oxfordjournals.org/D
ownloaded from

each. The Metropolitan Police (n.d.) regularly survey the public on their attitudes toward the police. We focus on the question “How well do you think the Metro-politan Police treat people with respect?” with answers on a scale ranging from 1 (“not at all well”) to 7 (“very well”). We aggregate over six months (January to June 2011) to boost the sample size for each borough (around 250). The average score ranges across boroughs from 4.7 to 6.2. This variable is expected to reduce rioting. For Hypothesis 5, we use the net current expenditure of each borough’s local authority.16 This expenditure is funded mainly from central government, with a small portion raised from local taxes. Local expenditure is dominated by education and social care. We calculate the growth in net current expenditure for the financial year ending in March 2011 (compared to the year ending in March 2010). It ranges from –15 percent, representing a significant cut, to 8 percent. This variable is expected to reduce rioting.
Aside from the hypotheses, we incorporate ethnicity because of its importance in the sociological literature. The British Census employs a detailed classification. For example, “Black/African/Caribbean/Black British” is subdivided into three categories: “African,” “Caribbean,” and “Other” (to be written in). We enter all categories exceeding 2.5 percent of London’s population (treating white British as the reference category). It is crucial to remember that Caribbean, for example, refers to those who categorized themselves as such; it does not imply foreign birth or lack of British identity. Each ethnic category is expressed as a proportion of the total neighborhood population. Given the importance of segregation between blacks and whites in the literature on American riots, we also enter an index of multi-group segregation, Theil’s information theory index (Reardon and Fire-baugh 2002). This measures the extent to which ethnic groups within the ward are segregated by neighborhood.
Three control variables are included. Rioters are always predominantly young, and so we enter the proportion of the population aged between 16 and 24.17 Rioters tend to target locations close to home; the median distance to the location of the criminal offense was about 2 km (Baudains, Braithwaite, and Johnson 2013, 266). People living far away from potential looting opportunities should be less likely to participate. As a proxy for significant concentrations of retail stores, we use locations of the 24 Foot Locker outlets in London.18 This was a prominent chain targeted for looting (Briggs 2012; Guardian, February 17, 2012; Lewis et al. 2011, 28). For each neighborhood, we compute distance to the near-est store. The proximity variable is calculated as 1 over the square of distance.19 We expect proximity to increase rioting. Finally, we enter population density, in thousands per hectare, expecting this to increase rioting.
ResultsTable 2 shows the estimates, expressing coefficients as odds ratios. Model 1 begins with Hypotheses 1 and 2; Model 2 adds Hypothesis 3; Model 3 adds Hypotheses 4 and 5. Successive models represent a substantial improvement, as indicated by reductions in AICc; this criterion captures the trade-off between fit and parsimony (Burnham and Anderson 2004). The estimates for the standard deviation of ψ(2) and ψ(3) reveal significant similarity (unexplained by independent
684 Social Forces 94(2)
at Bodleian Library on D
ecember 1, 2015
http://sf.oxfordjournals.org/D
ownloaded from

Tabl
e 2.
Pre
dict
ing
the
Prob
abili
ty o
f Rio
ters
in L
ondo
n’s
Nei
ghbo
rhoo
ds, 2
011
1
2
3
odds
sep
odds
sep
odds
sep
You
th17
.77
12.7
8.0
0***
7.25
5.67
.01*
7.24
5.67
.01*
Prox
imity
to n
eare
st F
oot L
ocke
r1.
04.0
2.0
2*1.
04.0
2.0
2*1.
04.0
2.0
2*
Popu
latio
n de
nsity
.29
.10
.00*
**.2
7.0
9.0
0***
.27
.09
.00*
**
Ethn
icity
: whi
te Ir
ish
1.24
2.75
.92
.41
.95
.70
.31
.71
.61
Ethn
icity
: whi
te o
ther
.72
.44
.58
.22
.18
.06
.22
.17
.05
Ethn
icity
: bla
ck A
fric
an4.
642.
50.0
0**
1.24
.75
.73
1.24
.75
.72
Ethn
icity
: bla
ck C
arib
bean
112.
6690
.27
.00*
**22
.69
20.7
8.0
0***
16.4
114
.72
.00*
*
Ethn
icity
: Asi
an P
akis
tani
7.77
7.74
.04*
1.46
1.55
.72
2.35
2.43
.41
Ethn
icity
: Asi
an In
dian
.37
.24
.12
.18
.13
.02*
.14
.10
.00*
*
Ethn
icity
: Asi
an B
angl
ades
hi1.
40.9
4.6
2.5
6.4
0.4
21.
09.7
2.9
0
Ethn
icity
: Asi
an o
ther
1.41
1.31
.71
.25
.26
.18
.21
.22
.13
Ethn
ic s
egre
gatio
n (w
ard)
.81
2.30
.94
24.8
770
.38
.26
27.0
975
.70
.24
Dep
riva
tion
inde
x1.
45.1
2.0
0***
1.37
.15
.00*
*1.
38.1
5.0
0**
Dep
riva
tion
inde
x (w
ard)
1.43
.14
.00*
**1.
34.1
5.0
1**
1.32
.14
.01*
*
Cla
ss: m
anag
eria
l and
pro
fess
iona
l.8
9.7
6.8
9.9
9.8
91.
00.7
3.6
3.7
2
Cla
ss: i
nter
med
iate
pro
fess
ions
.35
.41
.37
.59
.71
.66
.61
.74
.68
Cla
ss: s
mal
l em
ploy
ers
and
self-
empl
oyed
.44
.56
.52
.56
.72
.65
.60
.78
.70
Rel
ativ
e af
fluen
ce in
sur
roun
ding
are
a.8
2.6
0.7
9.7
1.5
1.6
4.4
7.3
3.2
8
Hom
e ow
ners
hip
.61
.18
.10
.62
.18
.10
Imm
igra
nts
arri
ved
sinc
e 20
10.1
7.2
1.1
6.2
3.2
9.2
4
(Con
tinu
ed)
London Riot of 2011 685
at Bodleian Library on D
ecember 1, 2015
http://sf.oxfordjournals.org/D
ownloaded from

Tabl
e 2.
continued
1
2
3
odds
sep
odds
sep
odds
sep
Ethn
ic fr
actio
naliz
atio
n7.
793.
90.0
0***
8.06
3.97
.00*
**
Den
sity
of c
hari
tabl
e or
gani
zatio
ns
(war
d).7
5.0
8.0
1**
.75
.08
.01*
*
Vot
ing
turn
out a
t 201
0 lo
cal e
lect
ion
(war
d)1.
051.
04.9
61.
061.
02.9
5
Opi
nion
that
pol
ice
are
resp
ectf
ul
(bor
ough
).3
3.0
7.0
0***
Gro
wth
of g
over
nmen
t exp
endi
ture
, 20
09/1
0–20
10/1
1 (b
orou
gh)
1.24
2.13
.90
Ran
dom
inte
rcep
t: w
ard
(sta
ndar
d de
viat
ion)
.36
.05
.00*
**.3
3.0
5.0
0***
.33
.05
.00*
**
Ran
dom
inte
rcep
t: bo
roug
h (s
tand
ard
devi
atio
n).5
3.0
9.0
0***
.51
.09
.00*
**.2
9.0
7.0
0***
Diff
eren
ce in
AIC
c co
mpa
red
to M
odel
1–7
6–9
4
Mul
tilev
el lo
gist
ic re
gres
sion
(8 in
tegr
atio
n po
ints
), w
ith ln
(pop
ulat
ion)
as o
ffset
; N =
25,
022 n
eigh
borh
oods
in 62
4 war
ds in
32 b
orou
ghs
odds
: odd
s rat
io; s
e: st
anda
rd e
rror
; p: p
-val
ue (t
wo-
taile
d), *
** p
< .0
01 **
p <
.01 *
p <
.05
686 Social Forces 94(2)
at Bodleian Library on D
ecember 1, 2015
http://sf.oxfordjournals.org/D
ownloaded from

variables) among neighborhoods within a ward and among wards within a bor-ough. As expected, the probability of rioting increases with the proportion of young people and with the proximity of opportunities for looting. Population density unexpectedly reduces the probability of rioting.
In Model 1, Hypothesis 1 is strongly supported. The deprivation index greatly increases the probability of rioting, at both the neighborhood and the ward level. Variables for affluence are not statistically significant. Hypothesis 2 is not sup-ported, as the proxy for relative deprivation has no discernible effect. Even con-trolling for deprivation, rioting is strongly associated with people identifying as African and even more by those identifying as Caribbean, compared to white British (the difference between the two is statistically significant, p = .002). Riot-ing is also more associated with people of Pakistani origin than with those of Indian origin (the difference is statistically significant, p = .02). Differences between the two black groups and between the two Asian groups reveal how much information is lost in coarse ethnic categories.
In Model 2, Hypothesis 3 is affirmed by two results. First, ethnic fractionaliza-tion increases the probability of rioting.20 This variable dramatically reduces the association between the two black ethnic groups and rioting. In other words, blacks tend to live in areas with high ethnic diversity. Controlling for fractional-ization, the presence of people of Indian descent significantly reduces the proba-bility of rioting compared to the presence of white British. Second, the density of charities at the ward level reduces the probability of rioting.
In Model 3, Hypothesis 4 is strongly supported. In boroughs where people felt they had the respect of police, rioting was less likely. Hypothesis 5 is not supported, as local government expenditure has no apparent effect. Hypotheses 1 and 3 are unaffected, while ethnic composition still has significant effects. Figure 2 shows the magnitude of the effect of selected variables. The predicted probability of rioters coming from a neighborhood is on the vertical axis. For the “typical” neighborhood, with all variables set to the median, the probability is .036 (denoted by the horizontal black line). The horizontal axis shows how the variable affects the predicted probability. The vertical gray lines mark the vari-able’s 10th percentile, median, and 90th percentile. The 95 percent confidence interval for the predicted probabilities is shaded. For the deprivation index at the neighborhood level, going from the 10th to the 90th percentile more than dou-bles the predicted probability, from .026 to .059. The index extends far beyond the 90th percentile (the two highest values have a predicted probability that is off the graph), though prediction at the extreme values is uncertain. Note that this graph omits the effect of deprivation at the ward level. The effect for both vari-ables together can be calculated. At their 10th percentiles—signifying a prosper-ous neighborhood within a prosperous ward—the predicted probability is .019; at their 90th percentiles—a poor neighborhood within a poor ward—the pre-dicted probability quadruples to .077. For ethnic fractionalization, going from the 10th to the 90th percentile more than doubles the predicted probability, from .018 to .047. For charitable organizations, going from the 10th to the 90th per-centile reduces the predicted probability from .040 to .031. This difference is not large. Some wards have much higher organizational density than the 90th percen-tile, however, and their predicted probability is substantially lower, albeit
London Riot of 2011 687
at Bodleian Library on D
ecember 1, 2015
http://sf.oxfordjournals.org/D
ownloaded from

estimated w
ith greater uncertainty. For opinion about the police, going from the
10th to the 90th percentile cuts the predicted probability by almost tw
o-thirds, from
.064 to .022. 21
The sm
all number of boroughs m
ay raise concern about the result for public opinion regarding the police. Its robustness can be tested by dropping each bor-ough in turn from
Model 3. T
he odds ratio hardly changes, ranging from .30 to
.36. Furthermore, boroughs could differ system
atically in ways not captured by
the two independent variables. M
odel 4 in table 3 introduces a separate intercept
Figure 2. How rioting varied with deprivation, disorganization, and grievances
0
.1
0
.1
0
.1
–2 0 2 4Deprivation index (neighborhood)
0 1Ethnic fractionalization (neighborhood)
0 3Charities per 1000 residents (ward)
0
.1
5 6Opinion whether police are respectful (borough)
688 Social Forces 94(2)
at Bodleian Library on December 1, 2015 http://sf.oxfordjournals.org/ Downloaded from
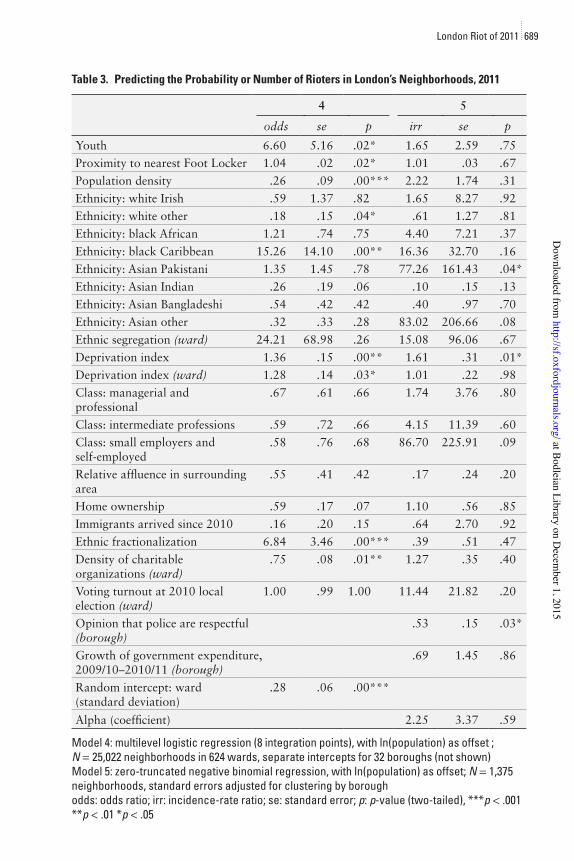
Table 3. Predicting the Probability or Number of Rioters in London’s Neighborhoods, 2011
4 5
odds se p irr se p
Youth 6.60 5.16 .02* 1.65 2.59 .75Proximity to nearest Foot Locker 1.04 .02 .02* 1.01 .03 .67Population density .26 .09 .00*** 2.22 1.74 .31Ethnicity: white Irish .59 1.37 .82 1.65 8.27 .92Ethnicity: white other .18 .15 .04* .61 1.27 .81Ethnicity: black African 1.21 .74 .75 4.40 7.21 .37Ethnicity: black Caribbean 15.26 14.10 .00** 16.36 32.70 .16Ethnicity: Asian Pakistani 1.35 1.45 .78 77.26 161.43 .04*Ethnicity: Asian Indian .26 .19 .06 .10 .15 .13Ethnicity: Asian Bangladeshi .54 .42 .42 .40 .97 .70Ethnicity: Asian other .32 .33 .28 83.02 206.66 .08Ethnic segregation (ward) 24.21 68.98 .26 15.08 96.06 .67Deprivation index 1.36 .15 .00** 1.61 .31 .01*Deprivation index (ward) 1.28 .14 .03* 1.01 .22 .98Class: managerial and professional
.67 .61 .66 1.74 3.76 .80
Class: intermediate professions .59 .72 .66 4.15 11.39 .60Class: small employers and self-employed
.58 .76 .68 86.70 225.91 .09
Relative affluence in surrounding area
.55 .41 .42 .17 .24 .20
Home ownership .59 .17 .07 1.10 .56 .85Immigrants arrived since 2010 .16 .20 .15 .64 2.70 .92Ethnic fractionalization 6.84 3.46 .00*** .39 .51 .47Density of charitable organizations (ward)
.75 .08 .01** 1.27 .35 .40
Voting turnout at 2010 local election (ward)
1.00 .99 1.00 11.44 21.82 .20
Opinion that police are respectful (borough)
.53 .15 .03*
Growth of government expenditure, 2009/10–2010/11 (borough)
.69 1.45 .86
Random intercept: ward (standard deviation)
.28 .06 .00***
Alpha (coefficient) 2.25 3.37 .59
Model 4: multilevel logistic regression (8 integration points), with ln(population) as offset ; N = 25,022 neighborhoods in 624 wards, separate intercepts for 32 boroughs (not shown)Model 5: zero-truncated negative binomial regression, with ln(population) as offset; N = 1,375 neighborhoods, standard errors adjusted for clustering by boroughodds: odds ratio; irr: incidence-rate ratio; se: standard error; p: p-value (two-tailed), ***p < .001 **p < .01 *p < .05
London Riot of 2011 689
at Bodleian Library on D
ecember 1, 2015
http://sf.oxfordjournals.org/D
ownloaded from

for each borough. Haringey, where Duggan lived, has one of the highest inter-cepts. Nevertheless, this makes no difference to the results.
Finally, it is worth briefly considering the second component of the hurdle model: predicting the number of rioters, conditional on there being at least one. There were only 1,375 neighborhoods with one or more rioters; all boroughs were represented, albeit some by very few neighborhoods. Model 5 in Table 3 shows the results of zero-truncated negative binomial regression. Coefficients are expressed as incidence-rate ratios. Only three variables are statistically significant at the .05 level. The rate of rioting increases with the proportion of people iden-tifying as Asians of Pakistani descent. This estimate depends on a small number of neighborhoods where they comprise a substantial proportion, and so should be taken with caution. The other two results lend further support to Hypotheses 1 and 4. The rate of rioting increases with neighborhood deprivation. Boroughs where people had judged the police to treat them with respect have a lower rate of rioting.
DiscussionBefore discussing the implications of these findings, we should reiterate their limitations. Our analysis assumes that people who were arrested and charged for crimes during the riot provide a tolerable approximation of the location of actual rioters. Unlike other studies using arrest data, we exclude cases where there was insufficient evidence to bring a charge. This makes our analysis less vulnerable to one concern, that the police arrest people without real evidence of their involve-ment. It is still vulnerable, of course, to the problem that most rioters escape detection.
Our analysis is ecological, identifying the characteristics of small neighbor-hoods that make the presence of rioters more or less likely. The analysis requires geographical variation. This restriction might explain the lack of support for Hypothesis 5, measured by local government expenditure. In England, the central government controls the bulk of expenditure and its policies have far greater salience. Its decision to abolish the Education Maintenance Allowance, paid to teenagers who stayed in school, was mentioned by rioters in subsequent inter-views (Lewis et al. 2011, 25; Morrell et al. 2011, 7). At the time of the riot, how-ever, most payments had not yet ceased. Therefore, we do not conclude that government policy was unimportant in explaining the riot, only that we cannot detect such an effect across local authorities. Similarly, the lack of support for Hypothesis 2 does not license the conclusion that inequality was unimportant in explaining the riot, only that we cannot detect such an effect using local dispari-ties in class composition.
Rioting varied with a neighborhood’s ethnic composition, even after taking into account many other characteristics. There could be suspicion that the police disproportionately targeted blacks for arrest, but this is hard to reconcile with the disparity between the proportions of blacks identifying as Caribbean and those identifying as African. This ecological difference aligns with survey evidence, as the former express greater mistrust in the police (Heath et al. 2013, 194). There is a long history of conflict between police and Caribbean immigrants, going back
690 Social Forces 94(2)
at Bodleian Library on D
ecember 1, 2015
http://sf.oxfordjournals.org/D
ownloaded from

to the 1950s, which reached its nadir in the riots of the 1980s (White 2001, 295–303). It is important to emphasize that London’s black population is not nearly as segregated as in American cities (Peach 1996). Of those identifying as Caribbean, only 4 percent live in a neighborhood where blacks are the majority. This is why, despite the overrepresentation of blacks among those arrested, the riot did not manifest the characteristics of an ethnic riot. One methodological point is worth making. The significant differences within coarse ethnic categories—Asian as well as black—reveal the superiority of detailed categories as used in the British Census.
Deprivation emerges as an important explanation for variation across London. The probability of rioters increased with deprivation both in the immediate neighborhood and in the wider area. These findings amplify what is known from qualitative and quantitative studies of the 2011 riot, but are hard to square with the rejection of deprivation in the sociological literature.22 As Useem (1998) observes, the case against deprivation has been exaggerated. It may be true that rioters were no more deprived than their neighbors who did not take part—but that proposition does not bear on the question of whether rioters were more likely to come from deprived neighborhoods across the city as a whole, or equiv-alently whether rioters were more deprived than the city’s overall population. In American cities, areas where blacks predominate are almost invariably poor; indeed, proportion black is used as one measure of concentrated disadvantage (Sampson, Raudenbush, and Earls 1997). The overlap surely hinders any attempt to distinguish poverty from race in American ethnic riots. It is possible, by con-trast, in London. Our results complement Caren’s (2011) cross-national time-series analysis, which suggests that riots tend to occur in economies undergoing recession.
Even after accounting for many other variables, rioting varied with public opinion about the police. Compared to the testimony of rioters (the interpreta-tion of which is disputed), our variable has two advantages. It captures public opinion before the riot happened, and it predominantly reflects the views of the vast majority who did not riot. We suggest that where police had worse relations with the public, rioting against the police attracted less disapproval from the local community. Certainly there is strong evidence that anger at the police was not simply a rationalization proffered by rioters.
The most provocative findings pertain to social disorganization. Ethnically diverse neighborhoods were more likely to produce rioters, controlling for ethnic composition. Wards where charitable organizations were scarce were more likely to produce rioters. These results are plausibly interpreted as evidence for social disorganization. Disorganization—lack of collective efficacy at the community level—is conducive to crime (e.g., Sampson and Groves 1989; Sampson 2012). Young people experienced in crime were surely more likely to commit crimes during the riot. Note that disorganization at the community level is compatible with highly organized gangs (Shaw and McKay 1942, 436). In the London riot, criminal gangs exploited the opportunity and even arranged a truce to enable them to roam beyond their normal territories (Harding 2012). The Metropolitan Police classified 19 percent of those arrested as gang members, though it is not clear how membership is defined (Home Office 2011, 5). Aside from the enduring
London Riot of 2011 691
at Bodleian Library on D
ecember 1, 2015
http://sf.oxfordjournals.org/D
ownloaded from

effect of social disorganization on crime, disorganization would have made it harder for parents and neighbors to prevent young people from joining the riot. Attacks on the police had a degree of legitimacy in some communities—above all in Haringey on the first night—but looting and arson did not. Interviews with people who did not participate in the riot reveal the importance of parental con-trol (Morrell et al. 2011, 43–45).
There are good reasons, then, for rioting to have increased with social disor-ganization. The link from concept to variables is admittedly contestable. The use of ethnic fractionalization is justified by the assumption that it tends to increase disorganization. This assumption is controversial, especially in Britain. Using ecological analysis of survey data, Letki (2008) and Laurence (2011) find that ethnic fractionalization does reduce collective efficacy. By contrast, Sturgis et al. (2010) and Demireva and Heath (2014) argue that fractionalization has no discernible effect, once deprivation and other factors are taken into account. The last two studies, however, make the effect disappear only by controlling for factors that would mediate between ethnic fractionalization and social disorga-nization: recorded crime or fear of crime, and social contact. Thus, they do not challenge the association posited here. Our innovation in using the British equivalent of American nonprofit organizations provides a more direct measure of social disorganization. Areas where charities are located should have a denser network of associational ties, especially where location is the residential address of the charity’s contact person. This inference is weaker where the loca-tion is the address of a large corporate headquarters (as with the Boy Scouts). This measurement issue has not, to our knowledge, been recognized. An important task for future work is to compare the density of charitable organiza-tions with geocoded survey measures of collective efficacy or associational membership.
ConclusionRiots remain an enduring sociological puzzle. What causes the rules regulating public order to collapse, as large numbers attack others, destroy property, and steal goods? The London riot of 2011 is an important case because it was not really an ethnic riot, the subset of events that dominate the literature. This is not to say that ethnicity was insignificant: rioters were more likely to come from neighborhoods with greater ethnic fractionalization and with a higher proportion of people of Caribbean descent. Nevertheless, rioters came from no single ethnic group, and ethnicity did not shape their choice of targets. The London riot of 2011 is also valuable for yielding unique data on where rioters lived and on pub-lic attitudes toward the police.
Our findings rigorously confirm two accepted explanations for this event: riot-ers came from economically deprived areas and from boroughs where policing had less legitimacy. The novel findings are that rioters came from areas with high ethnic diversity and with low organizational density. This we interpret as evi-dence for social disorganization. If a skeptical reader rejects this theoretical inter-pretation, then she will have to provide alternative explanations for these results. There is still much to learn about this event. The diffusion of rioting over time
692 Social Forces 94(2)
at Bodleian Library on D
ecember 1, 2015
http://sf.oxfordjournals.org/D
ownloaded from

and across space is a promising direction for future research. Analyzing this properly will require tackling the problem of measurement error: just because someone was charged with an offense on the third day, for example, does not mean they had not participated in rioting on previous days. Another topic for future research is the association between rioting and previous crime patterns—assault and theft, for example. Crime statistics pose formidable problems, of course, because they depend on public confidence in the police and on police activity as well as the actual distribution of crime.
Our main contribution to the literature on riots is to challenge—echoing Piven and Cloward (1992) and Useem (1998)—the rejection of economic deprivation and of social disorganization as potential explanations for rioting. As sociologists in the 1970s defined the new field of social movements, they rigidly demarcated protest from crime (Oliver 2008). Protest now would be explained by resources rather than deprivation, and by organization rather than its absence. This per-spective yielded tremendous insights, but also introduced blind spots. Our results show that collective contention can, sometimes, emerge from poverty and disor-ganization. This raises a hard but crucial question for sociology. When do people riot rather than participate in more legitimate and orderly forms of collective contention? Answering this question will require investigating rioting across dif-ferent social contexts. The dominance of American race riots in the sociological literature is certainly justified by their magnitude and significance. Yet, those riots inevitably reflected their particular circumstances, such as extreme residential segregation. In order to generalize, it will be necessary to study other societies. Europe has experienced numerous significant riots in the past decade, and these will prove fruitful events for future research.
Notes1. Earlier work on variation across Census tracts (e.g., Abudu et al. 1972; Abudu Stark
et al. 1974) is hard to interpret because of the methods used.2. Riots in prison are excluded because their institutional conditions are so different
(Goldstone and Useem 1999).3. This account draws on Metropolitan Police (2012, 17, 32); Lewis et al. (2011, 16–17);
Morrell et al. (2011, 13, 15).4. It is usually claimed that blacks targeted stores owned by whites, but Rosenfeld
(1997) demonstrates how the ethnicity of owners can be confounded by type of store.5. Video evidence from Fully Focused (2012).6. “Social disorganization” appears only in Ernest Burgess’s introduction (Shaw and
McKay 1942, ix, xi).7. A small portion of the financial district, known as the City of London (with only
7,400 residents), is under the jurisdiction of a separate police force. This area wit-nessed no rioting and is excluded from our analysis.
8. There is no information on the ultimate verdict. In the English riots overall, only one in five of those charged were acquitted (Ministry of Justice 2012, 4).
9. In Britain, the police can issue a caution, reprimand, or warning to someone who admits guilt; no penalty is attached.
10. Negative binomial regression on the number of rioters does not permit random inter-cepts at higher levels (Rabe-Hesketh and Skrondal 2008, 394). It yields essentially identical results to those shown in table 2.
London Riot of 2011 693
at Bodleian Library on D
ecember 1, 2015
http://sf.oxfordjournals.org/D
ownloaded from

11. Measuring them instead at higher levels of aggregation, closer to the American Cen-sus tract, produces a markedly inferior model (AICc increases by 286 over Model 3).
12. Fractionalization computed instead from five coarser ethnic categories (white, black, Asian, mixed, other) is highly correlated (r = .92) and makes no difference to the results. Neither logging nor adding a quadratic term improves AICc.
13. Registration is not essential for churches or chapels of some Christian denominations if their income is below £100,000. Universities and national museums are exempt.
14. A binary variable for the presence of at least one charity at the neighborhood level has no effect.
15. http://data.london.gov.uk/datastore/package/borough-council-election-results-2010.16. “Revenue Outturn Summary” at http://www.gov.uk/government/collections/local-
authority-revenue-expenditure-and-financing.17. The sex ratio does not vary appreciably across neighborhoods.18. A list of stores within London was compiled using an online store locator available at
http://www.footlocker.eu/en/gb/k/store-locator.aspx.19. Distances less than 250 meters are treated as 250, which is approximately the radius
of the average neighborhood. Other functional forms, such as square root of distance or inverse distance, prove inferior (e.g. Andrews and Biggs 2006; Myers 1997).
20. The same measure of fractionalization at the ward level is not statistically significant. Presumably this explains why Baudains, Braithwaite, and Johnson (2013, 271) find only a marginal effect.
21. Percentiles refer to neighborhoods even for variables measured at the ward or bor-ough level.
22. We can analyze the incidence of rioting (arrests per population) across the 57 British cities exceeding 200,000. Controlling for the proportion of youth and of nonwhites, deprivation has no detectable effect. This illustrates the limitation of analyzing rioting across cities.
About the AuthorsJuta Kawalerowicz is a doctoral candidate in sociology at Nuffield College, Oxford University. She is interested in political sociology, with an emphasis on determinants of prejudice and far-right politics. She is also interested in research methods, particularly mapping and spatial techniques in quantitative social research.
Michael Biggs is Associate Professor of Sociology at the University of Oxford. He is fascinated by the dynamics of protest waves, from strikes in Chicago in 1886 to sit-ins in the American South in 1960. He is also interested in the political uses of suffering, including self-immolation and hunger strikes.
ReferencesAbudu, Margaret J. G., Walter J. Raine, Stephen L. Burbeck, and Keith K. Davison. 1972. “Black Ghetto
Violence: A Case Study Inquiry into the Spatial Pattern of Four Los Angeles Riot Event-Types.” Social Problems 19(3):408–26.
Abudu Stark, Margaret J., Walter J. Raine, Stephen L. Burbeck, and Keith K. Davison. 1974. “Some Empiri-cal Patterns in a Riot Process.” American Sociological Review 39(6):865–76.
Alesina, Alberto, and Eliana La Ferrara. 2000. “Participation in Heterogeneous Communities.” Quarterly Journal of Economics 115(3):847–904.
694 Social Forces 94(2)
at Bodleian Library on D
ecember 1, 2015
http://sf.oxfordjournals.org/D
ownloaded from

______. 2002. “Who Trusts Others?” Journal of Public Economics 85(2):207–34.______. 2005. “Ethnic Diversity and Economic Performance.” Journal of Economic Literature 43(3):762–800.Andrews, Kenneth T., and Michael Biggs. 2006. “The Dynamics of Protest Diffusion: Movement Organiza-
tions, Social Networks, and News Media in the 1960 Sit-Ins.” American Sociological Review 71(5):752–77.
Baudains, Peter, Alex Braithwaite, and Shane D. Johnson. 2013. “Target Choice During Extreme Events: A Discrete Spatial Choice Model of the 2011 London Riots.” Criminology 51(2):251–85.
BBC. 2012. The Riots: In Their Own Words. Directed by Fatima Salaria. London: BBC.Benyon, John, and John Solomos, eds. 1987. The Roots of Urban Unrest. Oxford: Pergamon.Bergesen, Albert, and Max Herman. 1998. “Immigration, Race, and Riot: The 1992 Los Angeles Uprising.”
American Sociological Review 63(1):39–54.Biggs, Michael. 2003. “Positive Feedback in Collective Mobilization: The American Strike Wave of 1886.”
Theory and Society 32(2):217–54.Biggs, Michael, and Steven Knauss. 2012. “Explaining Membership in the British National Party: A Multi-
level Analysis of Contact and Threat.” European Sociological Review 28(5):633–46.Blumer, Herbert. 1958. “Race Prejudice as a Sense of Group Position.” Pacific Sociological Review 1(1):3–7.Briggs, Daniel. 2012. “Frustrations, Urban Relations, and Temptations: Contextualising the English
Riots.” In The English Riots of 2011: A Summer of Discontent, edited by Briggs, Daniel. Hook, UK: Waterside Press.
Burnham, Kenneth P., and David R. Anderson. 2004. “Multimodel Inference: Understanding AIC and BIC in Model Selection.” Sociological Methods and Research 33(2):261–304.
Caplan, Nathan, and Jeffery M. Paige. 1968. “A Study of Ghetto Rioters.” Scientific American 219(2):15–21.Caren, Neal. 2011. “Bringing Adversity Back In: Economic Breakdown and the Pace of Collective Action.”
Paper presented at the Annual Meeting of the American Sociological Association, Las Vegas, Nevada.Carter, Gregg Lee. 1987. “Local Police Force Size and the Severity of the 1960s Black Rioting.” Journal of
Conflict Resolution 31(4):601–14.Chicago Commission on Race Relations. 1922. The Negro in Chicago: A Study of Race Relations and a Race
Riot. Chicago: University of Chicago Press.Collins, Randall. 2008. Violence: A Micro-Sociological Theory. Princeton, NJ: Princeton University Press.Demireva, Neli, and Anthony Heath. 2014. “Diversity and the Civic Spirit in British Neighbourhoods:
An Investigation with MCDS and EMBES 2010 Data.” Sociology 48(4):643–62.Dhattiwala, Raheel, and Michael Biggs. 2012. “The Political Logic of Ethnic Violence: The Anti-Muslim
Pogrom in Gujarat, 2002.” Politics and Society 40(4):481–514.DiPasquale, Denise, and Edward L. Glaeser. 1998. “The Los Angeles Riot and the Economics of Urban
Unrest.” Journal of Urban Economics 43(1):52–78.Fogelson, Robert M. 1967. “White on Black: A Critique of the McCone Commission Report on the Los
Angeles Riots.” Political Science Quarterly 82(3):337–67.______. 1971. Violence as Protest: A Study of Riots and Ghettos. New York: Doubleday.Fogelson, Robert M., and Robert Hall. 1968. “Who Riots? A Study of Participation in the 1967 Riots.”
Supplemental Studies for the National Advisory Commission on Civil Disorders. Washington, DC: Government Print Office.
Fully Focused. 2012. Riot from Wrong. Directed by Ted Nygh. Fully Focused Productions.Goldstone, Jack A., and Bert Useem. 1999. “Prison Riots as Microrevolutions: An Extension of State-
Centered Theories of Revolution.” American Journal of Sociology 104(4):985–1029.Harding, Simon. 2012. “Street Government: The Role of the Urban Street Gang in the London Riots.” In The
English Riots of 2011: A Summer of Discontent, edited by Briggs, Daniel. Hook, UK: Waterside Press.Heath, Anthony F., Stephen D. Fisher, Gemma Rosenblatt, David Sanders, and Maria Sobolewska. 2013.
The Political Integration of Ethnic Minorities in Britain. Oxford: Oxford University Press.
London Riot of 2011 695
at Bodleian Library on D
ecember 1, 2015
http://sf.oxfordjournals.org/D
ownloaded from

Herman, Max. 2005. Fighting in the Streets: Ethnic Succession and Urban Unrest in Twentieth-Century Urban America. New York: Peter Lang Publishing.
Hilbe, Joseph. 2011. Negative Binomial Regression. 2nd ed. Cambridge, UK: Cambridge University Press.Home Office . 2011. An Overview of Recorded Crimes and Arrests Resulting from Disorder Events in August
2011. London.Janowitz, Morris. 1968. Social Control of Escalated Riots. Chicago: University of Chicago.Kasarda, John D., and Morris Janowitz. 1974. “Community Attachment in Mass Society.” American Socio-
logical Review 39(3):328–39.Keith, Michael. 1993. Race, Riots, and Policing: Lore and Disorder in a Multi-Racist Society. London: UCL Press.Kirk, David S., and Andrew V. Papachristos. 2011. “Cultural Mechanisms and the Persistence of Neighbor-
hood Violence.” American Journal of Sociology 116(4):1190–233.Land, Kenneth C., Patricia L. McCall, and Lawrence E. Cohen. 1990. “Structural Covariates of Homicide Rates:
Are There Any Invariances across Time and Social Space?” American Journal of Sociology 95(4):922–63.Laurence, James. 2011. “The Effect of Ethnic Diversity and Community Disadvantage on Social Cohesion:
A Multi-Level Analysis of Social Capital and Interethnic Relations in UK Communities.” European Sociological Review 27(1):70–89.
Letki, Natalia. 2008. “Does Diversity Erode Social Cohesion? Social Capital and Race in British Neighbour-hoods.” Political Studies 56(1):99–126.
Lewis, Paul, Tim Newburn, Matthew Taylor, Catriona Mcgillivray, Aster Greenhill, Harold Frayman, and Rob Proctor. 2011. Reading the Riots: Investigating England’s Summer of Disorder. http://www.guardian.co.uk/uk/series/reading-the-riots.
Lieberson, Stanley, and Arnold R. Silverman. 1965. “The Precipitants and Underlying Conditions of Race Riots.” American Sociological Review 30(6):887–98.
Lieske, Joel A. 1978. “The Conditions of Racial Violence in American Cities: A Developmental Synthesis.” American Political Science Review 72(4):1324–40.
Marx, Gary T. 1970. “Issueless Riots.” Annals of the American Academy of Political and Social Science 391(1):21–33.
McPhail, Clark. 1971. “Civil Disorder Participation: A Critical Examination of Recent Research.” American Sociological Review 36(6):1058–73.
______. 1989. “Blumer’s Theory of Collective Behavior.” Sociological Quarterly 30(3):401–23.______. 1994. “The Dark Side of Purpose: Individual and Collective Violence in Riots.” Sociological Quar-
terly 35(1):1–32.Metropolitan Police. 2012. 4 Days in August: The Metropolitan Police Service Strategic Review into the
Disorder of 2011.Metropolitan Police. n.d. Public Attitudes Surveys, 2000–2013 (computer file). UK Data Archive, SN 7048 .Ministry of Justice. 2012. Statistical Bulletin on the Public Disorder of 6th to 9th August 2011: September
2012 Update.Morgan, William R., and Terry Nichols Clark. 1973. “The Causes of Racial Disorders: A Grievance-Level
Explanation.” American Sociological Review 38(5):611–24.Morrell, Gareth, Sara Scott, Di McNeish, and Stephen Webster. 2011. The August Riots in England: Under-
standing the Involvement of Young People. London: NatCen.Murphy, Raymond J., and James W. Watson. 1970. “The Structure of Discontent: Relationship between
Social Structure, Grievance, and Riot Support.” In The Los Angeles Riots: A Socio-Psychological Study, edited by Cohen, Nathan, 140–257. New York: Praeger Publishers.
Myers, Daniel J. 1997. “Racial Rioting in the 1960s: An Event History Analysis of Local Conditions.” American Sociological Review 62(1):94–112.
______. 2000. “The Diffusion of Collective Violence: Infectiousness, Susceptibility, and Mass Media Networks.” American Journal of Sociology 106(1):173–208.
696 Social Forces 94(2)
at Bodleian Library on D
ecember 1, 2015
http://sf.oxfordjournals.org/D
ownloaded from

______. 2010. “Violent Protest and Heterogeneous Diffusion Processes: The Spread of US Racial Rioting from 1964 to 1971.” Mobilization 15(3):289–321.
National Advisory Commission on Civil Disorders (NACCD). 1968. Report of the National Advisory Commis-sion on Civil Disorders. New York: National Advisory Commission on Civil Disorders.
Oberschall, Anthony. 1968. “The Los Angeles Riot of August 1965.” Social Problems 15(3):322–41.______. 1973. Social Conflict and Social Movements. Englewood Cliffs, NJ: Prentice-Hall.Oliver, Pamela E. 2008. “Repression and Crime Control: Why Social Movement Scholars Should Pay Attention
to Mass Incarceration as a Form of Repression.” Mobilization 13(1):1–24.Olzak, Susan. 1992. The Dynamics of Ethnic Competition and Conflict. Stanford, CA: Stanford University
Press.Olzak, Susan, and Suzanne Shanahan. 1996. “Deprivation and Race Riots: An Extension of Spilerman’s
Analysis.” Social Forces 74(3):931–61.Olzak, Susan, Suzanne Shanahan, and Elizabeth H. McEneaney. 1996. “Poverty, Segregation, and Race
Riots: 1960 to 1993.” American Sociological Review 61(4):590–613.Peach, Ceri. 1996. “Does Britain Have Ghettos?” Transactions of the Institute of British Geographers
21(1):216–35.Perez, Anthony Daniel, Kimberly M. Berg, and Daniel J. Myers. 2003. “Police and Riots, 1967–1969.” Jour-
nal of Black Studies 34(2):153–82.Piven, Frances Fox, and Richard A. Cloward. 1992. “Normalizing Collective Protest.” In Frontiers in Social
Movement Theory, edited by Morris, Aldon D., and Carol McClurg Mueller, 301–25. New Haven, CT: Yale University Press.
Ponticelli, Jacopo, and Hans-Joachim Voth. 2011. “Austerity and Anarchy: Budget Cuts and Social Unrest in Europe, 1919–2008.” Discussion Paper, Centre for Economic Policy Research, London.
Putnam, Robert. 1993. Making Democracy Work: Civic Traditions in Modern Italy. Princeton, NJ: Princeton University Press.
Putnam, Robert D. 2007. “E Pluribus Unum: Diversity and Community in the Twenty-First Century.” Scandi-navian Political Studies 30(2):137–74.
Rabe-Hesketh, Sophia, and Anders Skrondal. 2008. Multilevel and Longitudinal Modeling Using Stata. 2nd ed. College Station, TX: Stata Press.
Reardon, Sean F. and Glenn Firebaugh. 2002. “Measures of Multigroup Segregation.” Sociological Meth-odology 32(1):33–67.
Rosenfeld, Michael J. 1997. “Celebration, Politics, Selective Looting and Riots: A Micro-Level Study of the Bulls Riot of 1992 in Chicago.” Social Problems 44(4):483–502.
Sampson, Robert J. 2012. Great American City: Chicago and the Enduring Neighborhood Effect. Chicago: University of Chicago Press.
Sampson, Robert J., and W. Byron Groves. 1989. “Community Structure and Crime: Testing Social-Disorga-nization Theory.” American Journal of Sociology 94(4):774–802.
Sampson, Robert J., Stephen W. Raudenbush, and Felton Earls. 1997. “Neighborhoods and Violent Crime: A Multilevel Study of Collective Efficacy.” Science 277(5328):918–24.
Santoro, Wayne A., and Lisa Broidy. 2014. “Gendered Rioting: A General Strain Theoretical Approach.” Social Forces 93(1):329–54.
Shaw, Clifford R., and Henry Donald McKay. 1942. Juvenile Delinquency and Urban Areas: A Study of Rates of Delinquency in Relation to Differential Characteristics of Local Communities in American Cities. Chicago: Chicago University Press.
Spilerman, Seymour. 1970. “The Causes of Racial Disturbances: A Comparison of Alternative Explanations.” American Sociological Review 35(4):627–49.
______. 1971. “The Causes of Racial Disturbances: Tests of an Explanation.” American Sociological Review 36(3):427–42.
London Riot of 2011 697
at Bodleian Library on D
ecember 1, 2015
http://sf.oxfordjournals.org/D
ownloaded from

______. 1976. “Structural Characteristics of Cities and the Severity of Racial Disorders.” American Socio-logical Review 41(5):771–93.
Stott, Clifford, and Steve Reicher. 1998. “How Conflict Escalates: The Inter-Group Dynamics of Collective Football Crowd Violence.” Sociology 32(2):353–77.
Sturgis, Patrick, Ian Brunton-Smith, Sanna Read, and Nick Allum. 2010. “Does Ethnic Diversity Erode Trust? Putnam’s ‘Hunkering Down’ Thesis Reconsidered.” British Journal of Political Science 41(1):57–82.
Treadwell, James, Daniel Briggs, Simon Winlow, and Steve Hall. 2013. “Shopocalypse Now: Consumer Culture and the English Riots of 2011.” British Journal of Criminology 53(1):1–17.
Useem, Bert. 1998. “Breakdown Theories of Collective Action.” Annual Review of Sociology 24:215–38.Warren, Donald I. 1969. “Neighborhood Structure and Riot Behavior in Detroit: Some Exploratory Findings.”
Social Problems 16(4):464–84.White, Jerry. 2001. London in the Twentieth Century: A City and Its People. London: Vintage Books.Wilkinson, Steven I. 2009. “Riots.” Annual Review of Political Science 12:329–43.
698 Social Forces 94(2)
at Bodleian Library on D
ecember 1, 2015
http://sf.oxfordjournals.org/D
ownloaded from