Embed Size (px)
Citation preview

Roche Interim Results 2006July 20, 2006 1
r
RocheInterim results 2006
London, July 20, 2006

Roche Interim Results 2006July 20, 2006 2
3
This presentation contains certain forward-looking statements. These forward-looking statements may be identified by words such as ‘believes’, ‘expects’, ‘anticipates’, ‘projects’, ‘intends’, ‘should’, ‘seeks’, ‘estimates’, ‘future’ or similar expressions or by discussion of, among other things, strategy, goals, plans or intentions. Various factors may cause actual results to differ materially in the future from those reflected in forward-looking statements contained in this presentation, among others:
1 pricing and product initiatives of competitors;2 legislative and regulatory developments and economic conditions;3 delay or inability in obtaining regulatory approvals or bringing products to market; 4 fluctuations in currency exchange rates and general financial market conditions; 5 uncertainties in the discovery, development or marketing of new products or new uses of existing products,
including without limitation negative results of clinical trials or research projects, unexpected side-effects of pipeline or marketed products;
6 increased government pricing pressures; 7 interruptions in production 8 loss of or inability to obtain adequate protection for intellectual property rights; 9 litigation;10 loss of key executives or other employees; and11 adverse publicity and news coverage.
Any statements regarding earnings per share growth is not a profit forecast and should not be interpreted to mean that Roche’s earnings or earnings per share for this year or any subsequent period will necessarily match or exceed the historical published earnings or earnings per share of Roche.
For marketed products discussed in this presentation, please see full prescribing information on our website –www.roche.com
All mentioned trademarks are legally protected
4
GroupDr. Franz B. HumerChief Executive Officer

Roche Interim Results 2006July 20, 2006 3
5
H1 '06: Securing short and long-term growthSustainability also a value driver
• Highest sales and operating profit1 for Roche ever (interim)
• Highest increase in sales and operating profit1 for Roche ever (interim)
• Strengthening pipeline ensuring the long-term future of Roche
• Further active steps for pandemic planning
• Around 90,000 patients benefiting from Roche Pharma clinical trials
– over 300 study protocols and results published in our clinical trial registry and results database
1 before exceptional items
6
CHF bn USD2005 2006 CHF local growth
% change in
H1 '06: Outgrowing the market> CHF 3 billion additional sales by organic growth
Pharmaceuticals 12.7 15.6 23 19 17
Diagnostics 4.0 4.3 8 4 2
Roche Group 16.6 19.8 19 16 13
Roche Interim Results 2006July 20, 2006 4
7
H1 ’06: Strong underlying business momentum
Contribution to total Group sales growth (local)
1 Avastin, Boniva, CellCept, Herceptin, MabThera/ Rituxan, NeoRecormon/ Epogin, Pegasys, Tarceva, Xeloda
1
(Rocephin, Copegus)
15% 16%
1%2% -2%
Key products Tamiflu Other Pharma Diagnostics Group salesgrowth
8
Improved quality of business over timeYear over year - despite Roaccutane and Rocephin
1 respective 10 leading products in each period2 Avastin, Boniva, CellCept, Herceptin, MabThera/ Rituxan, NeoRecormon/ Epogin, Pegasys, Tarceva, Xeloda
Top 10 as % of pharma sales1 Key products as % of pharma sales2
0%
20%
40%
60%
80%
H1 '02 H1 '03 H1 '04 H1 '05 H1 '060%
20%
40%
60%
80%
H1 '02 H1 '03 H1 '04 H1 '05 H1 '06
Roche Interim Results 2006July 20, 2006 5
9
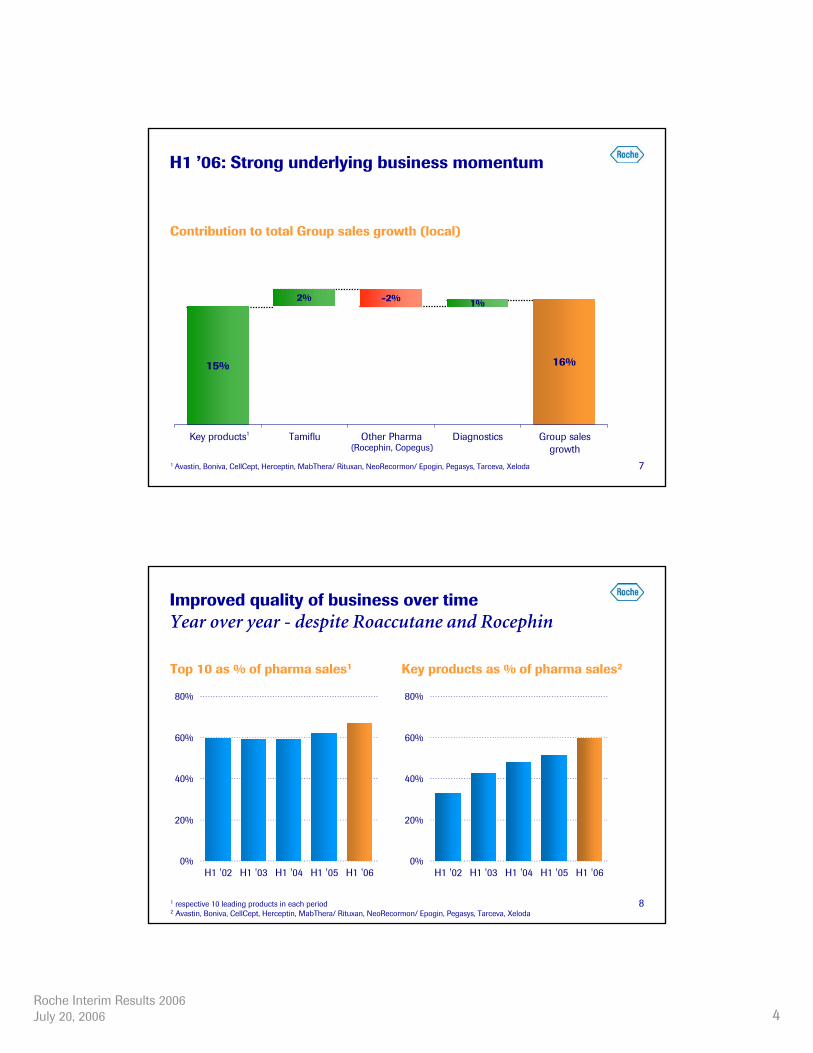
Sales 16.6 19.8 3.2 +19 +16
Operating profit1 4.5 5.8 1.4 +30 +27as % of sales 26.8 29.2
Profit from continuing businesses 3.3 4.5 1.2 +36as % of sales 20.0 22.8
Net income 3.3 4.5 1.2 +37as % of sales 20.0 22.9
Attributable toRoche shareholders 2.9 4.0 1.1 +38
CHF bn Change2005 2006 CHF bn % loc %
H1 '06: Strong sales drive bottom line growth
1 before exceptional items
10
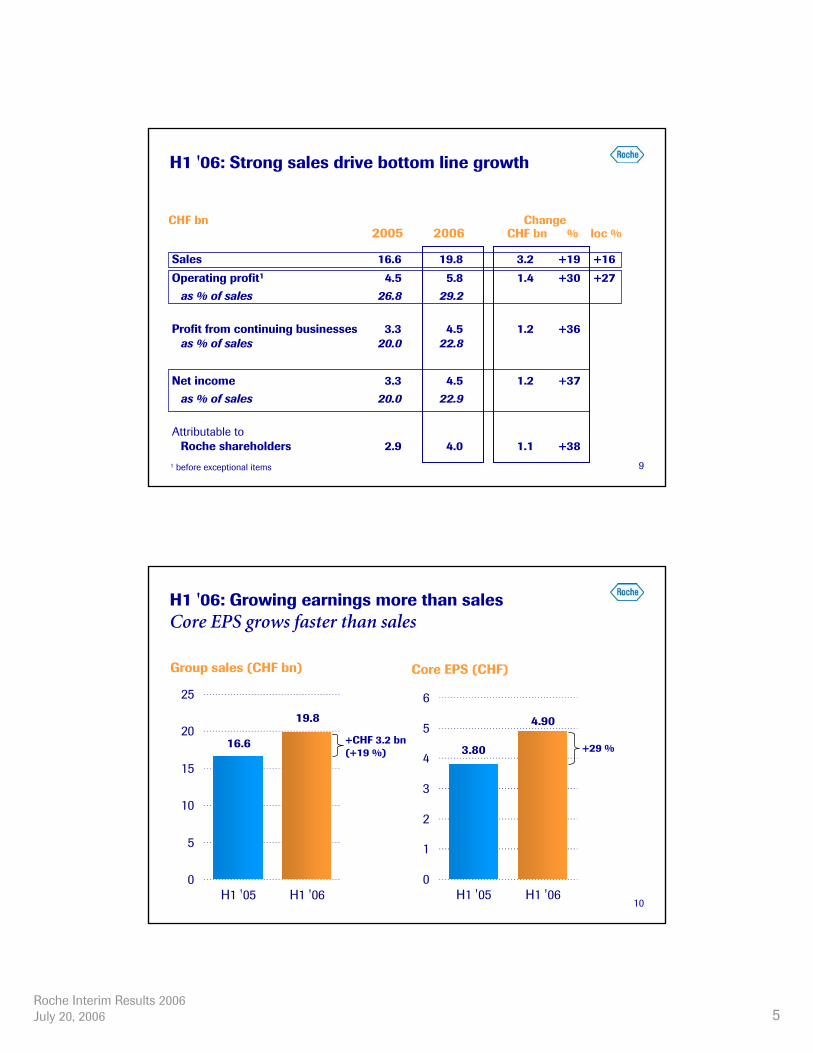
4.90
3.80
0
1
2
3
4
5
6
H1 '05 H1 '06
H1 '06: Growing earnings more than salesCore EPS grows faster than sales
19.8
16.6
0
5
10
15
20
25
H1 '05 H1 '06
Group sales (CHF bn) Core EPS (CHF)
+CHF 3.2 bn(+19 %) +29 %

Roche Interim Results 2006July 20, 2006 6
11
Our prioritiesValue creation - now and for the future
Focus on top & bottom line: Translation of above-peer growth into an attractive bottom line - without compromising the future
Execute on assets on hand: Maximize near-term attractive profitability via sales in existing indications and line extensions
Execute on late-stage pipeline
Build now the future beyond 2010/15: Strengthen the pipeline, in particular Phase I and II compounds, to keep the Roche Group amongst the industry leaders
12
Taking actions now for sustained growth beyond 2010/15
2010 - 2015
Sales
In-licensing
Collabo-rations
In-house R&D
Illustrative

Roche Interim Results 2006July 20, 2006 7
13
Our growth objectives for 2006Profitability target again increased
Sales
• Double-digit growth1 for Group and Pharmaceuticals
• Above market growth for Pharmaceuticals and Diagnostics
• Accelerating growth for Diagnostics
Core EPS target
• Growth above sales growth
1 in local currencies barring unforeseen events
14
Pharmaceuticals DivisionW. M. BurnsCEO Division Roche Pharmaceuticals

Roche Interim Results 2006July 20, 2006 8
15
H1 '06: Sales outgrowing market over three timesHighest increase in operating profit1 ever
• Oncology franchise continues to grow rapidly (+48 %2)
• Autoimmune franchise starting off in Europe and US following approval of MabThera/ Rituxan in first RA indication
• Boniva continues successful rollout in US, already 42 countries launched
• Operating profit1 increased 35 %2
• 11 approvals received, 11 filings submitted
• Six phase III trials met primary endpoint
• Four phase II trials met primary endpoint
1 before exceptional items 2 local growth
16
Pharma continues to significantly outgrow the marketCHF 2.9 bn additional organic sales
USDH1 '06 H1 '06 CHF local growth
Roche Pharma 7,978 9,670 21 17 15
Genentech 2,867 4,223 47 39 39
Chugai 1,807 1,684 -7 -4 -12
Pharmaceuticals 12,652 15,577 23 19 17
% change inSales CHF m
Roche Pharma 18 17 32 19 15
Genentech 41 42 49 40 39
Chugai 8 7 22 -8 1
Pharmaceuticals 21 21 34 19 19
2005 vs. 2004 2006 vs. 2005Q2 Q3 Q4 Q1 Q2
Quarterly local growth

Roche Interim Results 2006July 20, 2006 9
17
Oncology 47 % 48 % 20 %1
Transplantation 7 % 8 % 10 %1
Virology 7 %2/ 14 % -5 %2/ 17 % 5 %2
Renal Anemia 5 % -1 % 4 %3
H1 '06: Outperforming the US market nearly four times despite generic erosion of Rocephin
North America 41 % 23 % 6 %4
Japan 11 % -4 % -1 %4
Europe 33 % 23 % 5 %4
Total 85 % 19 %
Total 66 %1/ 73 % 30 %1/ 32 %
% of pharma sales
Localgrowth
1 IMS Q1 06 2 excluding Tamiflu 3 H1 '06 estimate 4IMS YTD Apr 06
Market growth
18
19%
-8%
20%
6%
12%
-4%
35%
21%
Sales 15,577 100.0 +2,925
Royalties & other op inc 636 4.1 +94
Cost of sales -3,160 -20.3 -329
M & D -4,187 -26.9 -833R & D -2,736 -17.6 -529G & A -786 -5.0 +39Amortisation/imp IA2 -328 -2.1 +4
Operating profit 1 5,016 32.2 +1,371
1 before exceptional items 2 Intangible assets
H1 '06CHF m % sales
H1 '06 vs. H1 '05local growth
Operational profit growing nearly twice sales Economies of scale translate into improved margin

Roche Interim Results 2006July 20, 2006 10
19
Pharma operating profit1
Highest increase in operating profit1 ever
452838
2'355
3'645
276
1'686
3'054
5'016
Pharma Division Roche Pharma Genentech Chugai
CHF m
% of sales
H1 '05 H1 '06
1 before exceptional items 2 local growth
+35 % 2
(+38 %)
32.2%
28.8%
31.6%
29.5%
39.9%
29.2%
16.4%
25.0%
-35 % 2
(-39 %)
+90 % 2
(+101 %)
+27 % 2
(+30 %)
20
Product performance
Pipeline and outlook

Roche Interim Results 2006July 20, 2006 11
21
MabThera / RituxanSales now above one billion CHF per quarter
• Sales of CHF 2.3 bn – Europe/ RoW strongest growth contributor
• Approved in EU as maintenance therapy in patients with relapsed or refractory iNHL
• RA launched in US and in the EU following approval in July
• Strong data presented at EULAR:– radiographic data showing significant joint damage reduction– efficacy even more improved following subsequent treatment courses – protocol of ongoing phase III studies amended to include subsequent treatments
1 local growth
CH
F bn
Global sales
Europe/ RoW +25 %
Japan +1 %
US +11 %
local growth
0.0
1.0
2.0
3.0
H1 '01 H1 '02 H1 '03 H1 '04 H1 '05 H1 '06
+ 16 %1
22
HerceptinAnnualized sales now over three billion CHF
• Sales of CHF 1.8 bn – significant growth in all regions, mainly driven by adjuvant use
• Approved for adjuvant BC in EU in May– US filed Q1, priority review granted– overall survival benefit shown for HERA (1-yr treatment, ASCO ‘06)
• Phase III (TAnDEM) data showed that Herceptin added to hormonal therapy prolongs progression-free survival for patients with HER2-pos/ ER-pos mBC
– plan to present and file data in H2 '061 local growth
CH
F bn
Global sales
Europe/ RoW +106 %
Japan +30 %
US +116 %
local growth
0.0
0.5
1.0
1.5
2.0
H1 '01 H1 '02 H1 '03 H1 '04 H1 '05 H1 '06
+ 105 %1

Roche Interim Results 2006July 20, 2006 12
23
AvastinFiled in mBC (US, EU) and NSCLC (US)
• Sales of CHF 1.4 bn – continued strong US growth and further rollout in Europe
• Data from over 4,000 patients enrolled in EAPs confirmed benefits and safety (ASCO ‘06)
• AVANT (adjuvant CC): recruitment restarted
• US phase III trial in 1st-line advanced pancreatic cancer unlikely to meet primary endpoint
– Roche trial (AVITA) continues while US study was closed
• Phase III 1st-line RCC data and NO16966 (1st-line mCRC combo) expected this year
1 local growth
CH
F bn
Global sales
Europe/ RoW +405 %
US +83 %
local growth
0.0
0.5
1.0
1.5
2.0
H1 '03 H1 '04 H1 '05 H1 '06
+ 119 %1
24
XelodaIncreasing use in adjuvant colon cancer main driver
• Sales of CHF 472 m – equal strong performance in US and EU
• ML17032 in gastric cancer and REAL-2 oesophago-gastric cancer met primary endpoints– data presented at ASCO ‘06, filing for gastric cancer in H2 ‘06
• Filing of 1st-line mCRC combo Avastin (NO 16966) on track for H2 '06
• Recruitment in phase III adj BC completed
1 local growth
CH
F m
Global sales
Europe/ RoW +27 %
Japan -2 %
US +31 %
local growth
0
100
200
300
400
500
H1 '01 H1 '02 H1 '03 H1 '04 H1 '05 H1 '06
+ 27 %1

Roche Interim Results 2006July 20, 2006 13
25
TarcevaVery successful initial rollout in Europe
• Sales of CHF 367 m – already one third of sales coming from Europe
• Pancreatic cancer under regulatory review in EU
• Filed for advanced NSCLC in Japan
• Phase II data in 2nd-line NSCLC combo Avastin presented at ASCO ‘06:– A+T or A+chemo (docetaxel or permetrexed) improve progression-free survival
when compared with standard chemotherapy alone1 local growth
CH
F bn
Global sales
Europe/ RoW +3818 %
US +66 %
local growth
0
100
200
300
400
H1 '03 H1 '04 H1 '05 H1 '06
+ 143 %1
26
Anemia franchiseFirst filings for Mircera
• Sales of NeoRecormon/ Epogin of CHF 1.1 bn
• NeoRecormon growing in renal (+4 %1) and oncology (+8 %1)
• Mircera (C.E.R.A.): phase III anemia correction trials also met primary endpoint– filed for renal anemia in the US and EU– phase III maintenance trials presented at ERA-EDTA ‘06
• dialysis patients treated with frequently administered epoetin were switched to once-monthly Mircera, maintaining stable Hb levels
– dose-optimization study in oncology started1 local growth
CH
F bn
Global sales
Europe/ RoW +5 %
Japan -6 %
local growth
0.0
0.5
1.0
1.5
H1 '01 H1 '02 H1 '03 H1 '04 H1 '05 H1 '06
+ 1 %1
Roche Interim Results 2006July 20, 2006 14
27
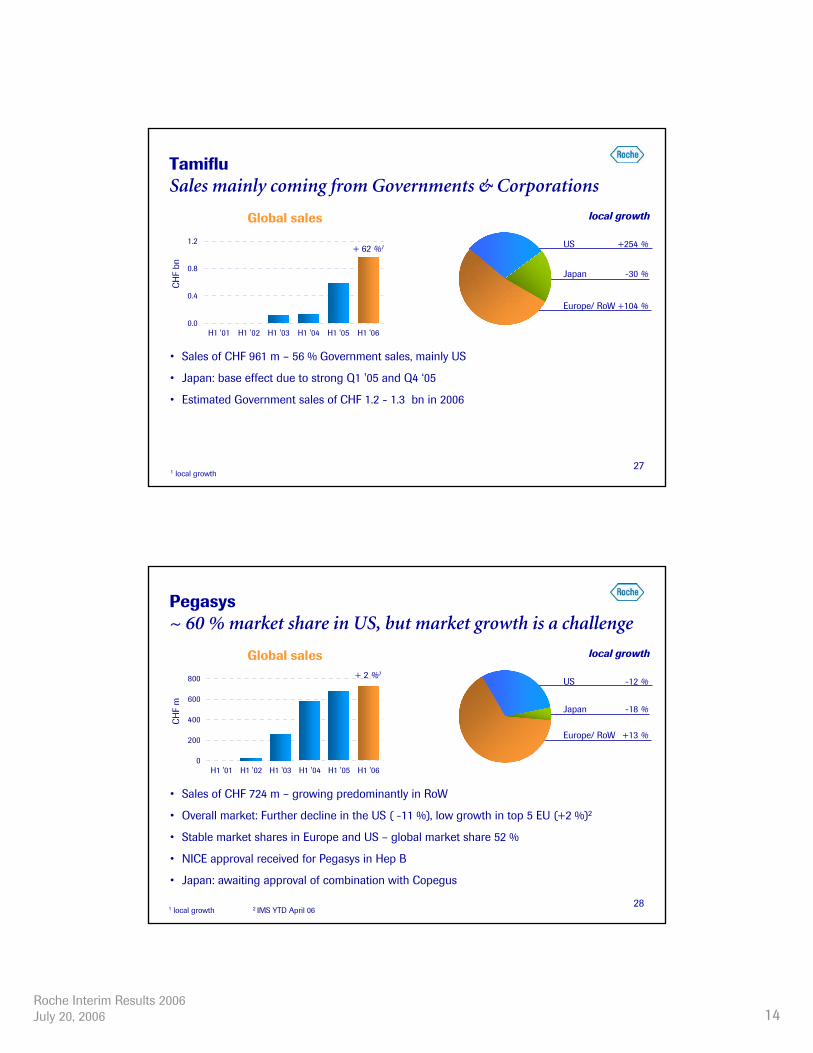
TamifluSales mainly coming from Governments & Corporations
• Sales of CHF 961 m – 56 % Government sales, mainly US
• Japan: base effect due to strong Q1 '05 and Q4 ‘05
• Estimated Government sales of CHF 1.2 - 1.3 bn in 2006
1 local growth
CH
F bn
Global sales
Europe/ RoW +104 %
Japan -30 %
US +254 %
local growth
0.0
0.4
0.8
1.2
H1 '01 H1 '02 H1 '03 H1 '04 H1 '05 H1 '06
+ 62 %1
28
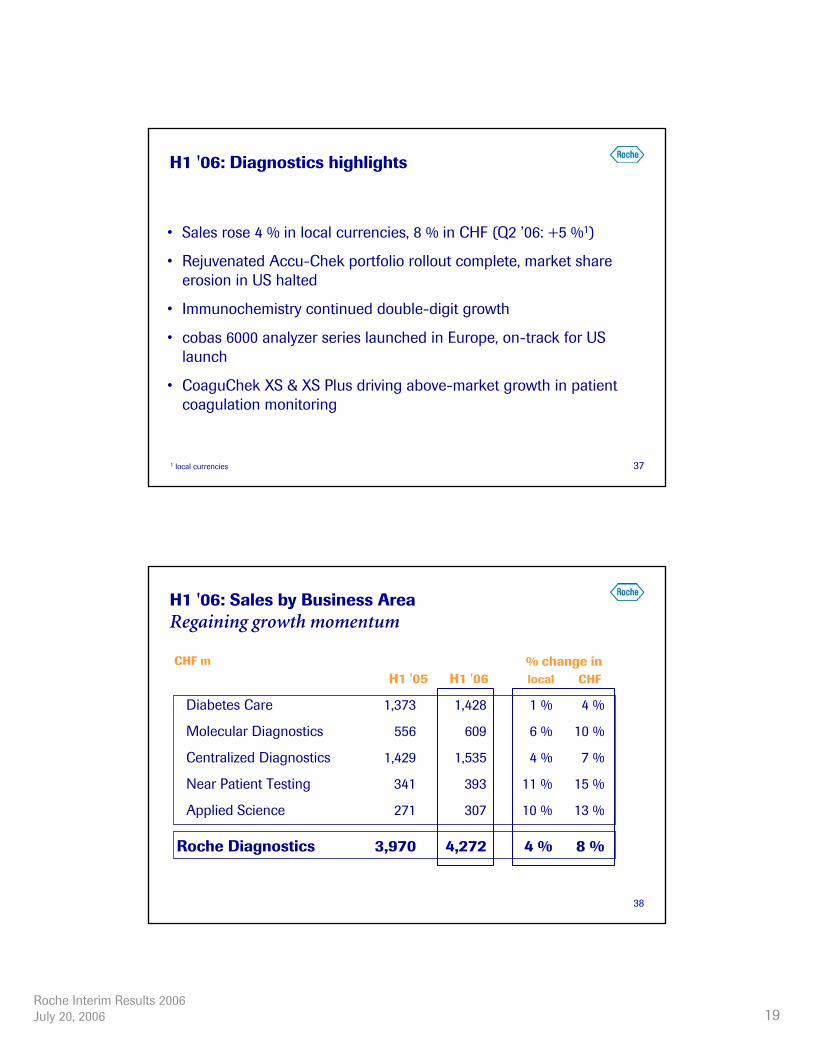
Pegasys~ 60 % market share in US, but market growth is a challenge
• Sales of CHF 724 m – growing predominantly in RoW
• Overall market: Further decline in the US ( -11 %), low growth in top 5 EU (+2 %)2
• Stable market shares in Europe and US – global market share 52 %
• NICE approval received for Pegasys in Hep B
• Japan: awaiting approval of combination with Copegus
CH
F m
Global sales
Europe/ RoW +13 %
Japan -18 %
US -12 %
local growth
0
200
400
600
800
H1 '01 H1 '02 H1 '03 H1 '04 H1 '05 H1 '06
+ 2 %1
1 local growth 2 IMS YTD April 06

Roche Interim Results 2006July 20, 2006 15
29
CellCept The leading immunosuppressant in transplantation
• Sales of CHF 891 m – Q1 '06 global MPA market share around 95 %, confirmed by recent Rx trends
• US growth comparison distorted by base effect
• EU/ RoW sales affected by wholesaler destocking in some countries in anticipation of mandatory price decreases, generics in some Latin American countries
• Completion of phase III (induction) in lupus nephritis early 2007 (Aspreva)– filing remains on track for 2007
1 local growth
CH
F m
Global sales
Europe/ RoW -3 %
Japan +18 %
US +17 %
local growth
0
200
400
600
800
1000
H1 '01 H1 '02 H1 '03 H1 '04 H1 '05 H1 '06
+ 7 %1
30
Three billion CHF additional sales during six monthsOncology products, Tamiflu and Boniva major contributors
Oncology
Virology
Transplant
Anemia
Boniva
Rocephin
All other
H1 '06 incremental contributions (CHF m)
+ 2,563
+ 365
+ 126
+ 146
+ 140
Herceptin AvastinMabThera
- 17
- 398
Other
Impacted by Copegus generics in the US since end '05
Xolair, Xenical, Evistamajor contributors
Predominantly US, 13 % NRx share early July
US generics wash-out now completed

Roche Interim Results 2006July 20, 2006 16
31
Product performance
Pipeline and outlook
32
H1 '06: Progress report on a leading late stage pipeline
AVITA continues, Filing EU ’08Avastin – pancreatic Ca (CALGB 80303)
Stopped due to slow recruitmentBondronat - Metastatic Bone Pain
MabThera – RA TNF IR (REFLEX FU)
Herceptin – adjuvant BC (HERA FU)
Herceptin – mBC combo hormonal (TAnDEM)
Actemra – RA (Japanese S&S)
Xeloda – oesophagogastric Ca (REAL2)
Xeloda – gastric Ca (ML17032)
Mircera – renal anemia in pre-dialysis patients (ARCTOS)
Mircera – renal anemia in dialysis patients (AMICUS)
Phase III results
Approved EU and US H1 ’06
Approved EU H1’06
Filing EU H2’ 06
Filed Jp April ‘06
Filing H2’ 06
Filing H2’ 06
Filed EU and US April ‘06
Filed EU and US April ‘06
Status
-

Roche Interim Results 2006July 20, 2006 17
33
An industry leading late stage pipelineAgain strengthened
* Including one project previously combined and now listed as two single indications
Phase III/ filed projects
41 21
8* 46
FY '05 approved discontinued new entries HY '06
34
H1 '06: Progress report on early stage pipeline Major additions to support growth beyond 2010/ 2015
Safety phase II trial ongoingR1658 – dyslipidemia (efficacy)
Opted in, phase II (sustained release formulation) to start early '07Ipsen BIM 51077 – T2D
Insulin sensitizer – T2D
Avastin + Tarceva – NSCLC 2nd line
Ocrelizumab – RA (Action)
Phase II results Status
Discontinued
Phase III ongoing
Phase III to start soon
Raptiva (GNE) – adult atopic dermatitis
3 terminated CHC 12103 (CHU) – solid tumors
R3477 (S1P1, Actelion)1 – autoimmune diseases
Topical VEGF (GNE) – diabetic foot ulcers2 moved forward to phase II
Opt-in (ARQ 501) – solid tumors
5 new entries (moved from phase 0 or newly entered)
Phase I progress
R1507 – solid tumors
Trastuzumab DM1 (GNE) – mBC
R1550 (Antisoma)– mBC
R1450 – Alzheimer’s
R1664 – dyslipidemia
1 partnered in July '06

Roche Interim Results 2006July 20, 2006 18
35
Our objectives for 2006 - Pharmaceuticals Announced for 2006
FinalFinalFinalFinalFinalInterimFinalFinalFinalFinalData
DyslipidemiaIIR1658 mCRC 1st line combo extensionIIIAvastin / Xeloda
mCRC 2nd lineIIIXeloda
RAIIR1594
NSCLC 1st line (AVAIL)IIIAvastin
MEDIIaR873NSCLC 2nd line IIAvastin / Tarceva
Status H1Renal anemia (correction)IIIMircera (CERA)
III III
Phase
mBC combo hormonal (TAnDEM)HerceptinLupus nephritis (Induction phase)CellCept
IndicationCompound
mCRC 1st line combomBC combo hormonalAdjuvant BCmCRC 1st line extension
mBC 1st lineNSCLC 1st lineRenal anemiaIndication
Herceptin
Mircera (CERA)
Avastin/ Xeloda
Xeloda
Avastin
Herceptin
(US)Avastin
Status H1Compound
Double-digit growth in local currenciesFi
lings
Maj
or c
linic
al d
ata
barring unforeseen events
Divisional sales growth
36
Diagnostics DivisionSeverin SchwanCEO Division Roche Diagnostics
Roche Interim Results 2006July 20, 2006 19
37
H1 '06: Diagnostics highlights
• Sales rose 4 % in local currencies, 8 % in CHF (Q2 ’06: +5 %1)
• Rejuvenated Accu-Chek portfolio rollout complete, market share erosion in US halted
• Immunochemistry continued double-digit growth
• cobas 6000 analyzer series launched in Europe, on-track for US launch
• CoaguChek XS & XS Plus driving above-market growth in patient coagulation monitoring
1 local currencies
38
H1 '05 H1 '06 local CHF
H1 '06: Sales by Business AreaRegaining growth momentum
Diabetes Care 1,373 1,428 1 % 4 %
Molecular Diagnostics 556 609 6 % 10 %
Centralized Diagnostics 1,429 1,535 4 % 7 %
Near Patient Testing 341 393 11 % 15 %
Applied Science 271 307 10 % 13 %
Roche Diagnostics 3,970 4,272 4 % 8 %
% change inCHF m

Roche Interim Results 2006July 20, 2006 20
39
Japan
CHF 4,272 m
EMEA*
Iberia/Latin Am.
North America
Others
Asia Pacific
5 %
7 %
11 %28 %
48 %
6 %
2 %
6 %
10 %
0 %
4 %
EMEA*
Japan
Asia Pacific
Iberia/LatAm
NorthAmerica
Roche Dx
local sales growth
* Europe, Middle East, and Africa
H1 '06: Sales by RegionStrong sales growth globally, North America stable
40
H1 '06: Cost base controlledCOGS driven up by instrument placements
4%
-17%
-1%
14%
-47%
-3%
-7%
-5%
H1 '06 vs. H1 '05local growth
H1 '06CHF m % sales
1 before exceptional items 2 Intangible assets
Sales 4,272 100.0 +302
Royalties & other op inc 91 2.1 -77
Cost of sales -1,774 -41.4 -274
M & D -1,021 -23.9 -23R & D -327 -7.7 +9G & A -165 -3.9 +27Amortisation/imp IA2 -166 -3.9 0
Operating profit1 910 21.3 -36

Roche Interim Results 2006July 20, 2006 21
411 before exceptional items 2 local growth
World leading margins
1,353
946
1,333
910
H1 ’05 H1 ’06 H1 ’05 H1 ‘06
23.8%
21.3%
Operating profit1 EBITDA
-7 %2
(-4 %)
(-1 %)-4 %2
CHF m
34.1%
31.2% % ofSales
42
0
50
100
H1 '04 H1 '05 H1 '06
Diabetes CareRejuvenated Accu-Chek portfolio returning to growth in Q2
0
500
1000
1500
H1 '04 H1 '05 H1 '06
• Accu-Chek Compact/ Plus extending leadership in Integrated systems– EU rollout complete, US successfully launched Q1 ‘06
• Accu-Chek Aviva gaining market share in single-strip segment– US programs driving strong meter placements & new strip share
• Accu-Chek Spirit continued double-digit growth ex-US
Blood Glucose Monitoring*
* meters, strip, lancets 1 local growth
+22 %1
Insulin Delivery ex-US
CH
F m
0 %1
Roche Interim Results 2006July 20, 2006 22
43
Renewed Accu-Chek PortfolioDriving positive quarterly growth development
2005 2006
Accu-Chek Aviva
Accu-Chek Compact PlusAccu-Chek
Advantage Blood Glucose Market Growth ~7 %+7 %
-5 %
+6 %
-1 %
Q3 05 Q4 05 Q1 06 Q2 06
local sales growth % vs. previous year
44
0
400
800
H1 '04 H1 '05 H1 '06
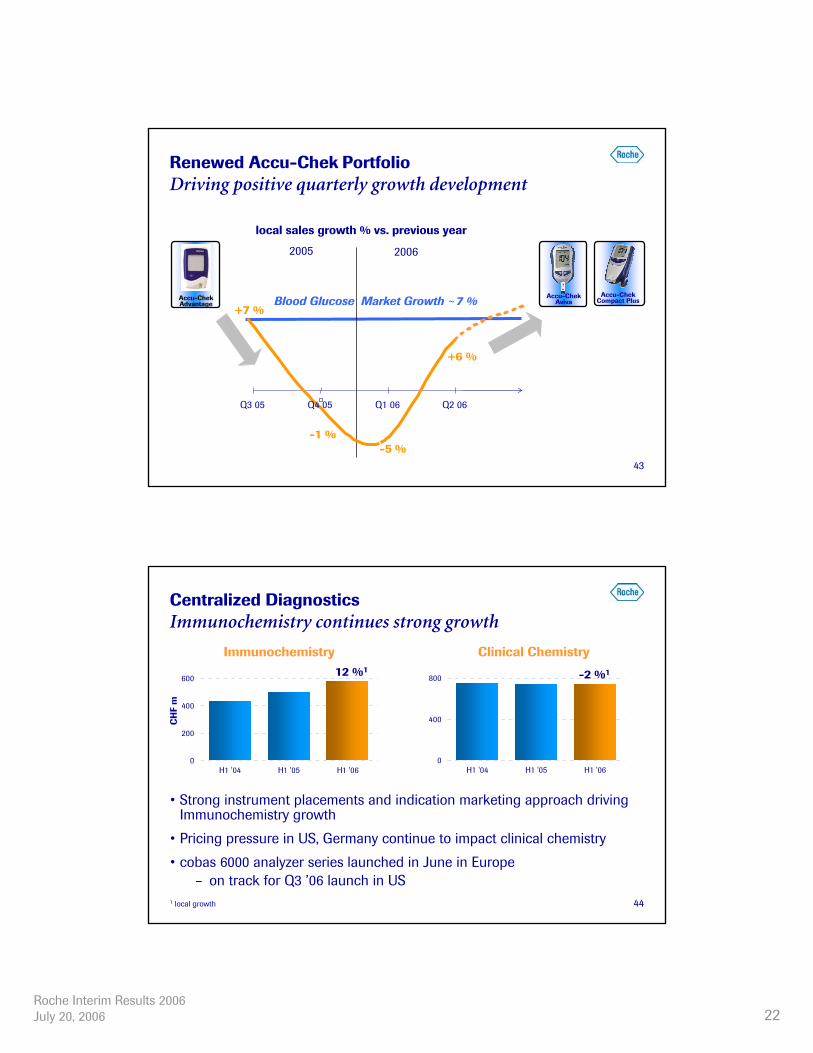
Centralized DiagnosticsImmunochemistry continues strong growth
• Strong instrument placements and indication marketing approach driving Immunochemistry growth
• Pricing pressure in US, Germany continue to impact clinical chemistry
• cobas 6000 analyzer series launched in June in Europe – on track for Q3 ’06 launch in US
Immunochemistry Clinical Chemistry
1 local growth
0
200
400
600
H1 '04 H1 '05 H1 '06
-2 %1
CH
F m
12 %1

Roche Interim Results 2006July 20, 2006 23
45
# of systems 13 5
high
med
ium
low
Het. IA
H917
I800
H912
I400
D2400
P800
Elecsys2010
Elecsys1010
CC / HIA
H902
I700
E170
COBAS CORE II
e 411analyzer
c 701module
CC/ HIA Het. IA
c 311analyzer
cobas 6000 analyzer series: Next generation modular systemsConsolidating platforms and combining CC & IC
c 501module
e 601module
COBAS MIRA
coremodule
e 601 module
c 501 module
2001diverse platforms
2006 +modular platforms
cobas 6000 analyzer series
46
0
100
200
300
H1 '04 H1 '05 H1 '06
Molecular Diagnostics Virology regained growth momentum
• EU rollout started for multiplex HIV/ HCV/ HBV test on modular, automated cobas s 201 system
– BLA filing (FDA) for cobas s 201 and multiplex test on-track H2 ‘06 – evaluation started of cobas s 401 in Japan (fully integrated system)
• Amplicor HPV Test FDA filing planned early ‘07
NAT Blood Screening Virology
1 local growth
0
100
200
H1 '04 H1 '05 H1 '06
+8 %1
CH
F m
3 %1

Roche Interim Results 2006July 20, 2006 24
47
0
50
100
Near Patient TestingNew products providing growth
• Strong market acceptance of CoaguChek XS & XS Plus for coagulation monitoring
– US rollout planned 2007• Rapid market penetration of Cardiac proBNP in EMEA, Latin America and
Asia Pacific– US rollout planned 2008
15 %1
H1 ’04 H1 ’05 H1 ’06 H1 ’04 H1 ’05 H1 ’06 H1 ’04 H1 ’05 H1 ’06
4 %1
12 %1
1 local growth
CH
F m
Coagulation Blood gas/ Electrolytes
Cardiac markers
48
Key growth drivers in 2006 Commercialise assets on hand; prepare market for new drivers
•Genome Sequencer 20•LightCycler 480 instrumentApplied Science
•CoaguChek XS Plus•Cardiac NT-proBNP•CoaguChek XS
Near Patient Testing
•cobas s 201 system & MPX Test •LightCycler SeptiFast Test
•COBAS AmpliPrep/ COBAS TaqMan•AmpliChip CYP450 Test
Molecular Diagnostics
•cobas 6000 analyzer series•cobas 4000 analyzer series•cobas IT 3000 & 5000
Centralized Diagnostics
•Accu-Chek Go
•Accu-Chek Aviva•Accu-Chek Compact Plus•Accu-Chek Multiclix•Accu-Chek Spirit•Accu-Chek D-TRONplus
Diabetes Care
Key 2006 Launches*Key 2005 Launches
Above market growth in local currenciesDivisional sales growth
* Subject to appropriate regulatory approvals; US launch may be later barring unforeseen events

Roche Interim Results 2006July 20, 2006 25
49
Group financial resultsErich HunzikerChief Financial Officer
50
H1 '06: Strong operational performance translated into net income
Strong operating result
• Record operating profit1 of CHF 5.8 bn (+27 %2)
• Positive net financial income increased to CHF 424 m
• Higher tax rate by 3 percentage points – due to higher effective tax rate at Genentech
Improved financial condition
• Increase in net cash and equity ratio
1 before exceptional items 2 in local currencies

Roche Interim Results 2006July 20, 2006 26
51
CHF m
Sales 16,622 19,849 +19 +16
EBITDA 5,592 7,061 +26 +23% of sales 33.6 35.6 +2.0 p
Operating profit before exceptional items 4,454 5,805 +30 +27% of sales 26.8 29.2 +2.4 p
Net financial income 85 424 +399
Taxes -1,066 -1,701 +60Tax rate in % 24.3 27.3 +3.0 p
Net income 3,328 4,543 +37% of sales 20.0 22.9 +2.9 p
EPS diluted (CHF) 3.36 4.58 +36Core EPS (CHF) 3.80 4.90 +29
2005 2006% change
CHF local
H1 '06: Group resultsGood sales performance translated into profit increase
52
16%
-10%
16%
9%
-2%
-3%
27%
17%
Sales 19,849 100.0 +3,227
Royalties & other op inc 727 3.7 +17
Cost of sales -4,934 -24.9 -603
M & D -5,208 -26.3 -856R & D -3,063 -15.4 -520G & A -1,072 -5.4 +82Amortisation/imp IA2 -494 -2.5 +4
Operating profit 1 5,805 29.2 +1,351
H1 '06CHF m % sales
H1 '06 vs. H1 '05local growth
1 before exceptional items 2 Intangible assets
H1 '06: Strongest group operating result …. while investing in new launches and R&D

Roche Interim Results 2006July 20, 2006 27
53
4'454
3'645
946
910
5'0165'805
Roche Group Pharmaceuticals Diagnostics
29.2%26.8%
32.2%
28.8%
21.3%23.8%
+35 % 2
(+38 %)
-7 % 2
(-4 %)
CHF m+27 % 2
(+30 %)
H1 '06H1 '05
% of sales
1 before exceptional items 2 local growth
H1 '06: Group operating profit1
Pharma drives margin increase
54
-600
-400
-200
0
200
400
600
800
1'000
2005 2006Financial income, net 85 424Treasury management, net 69 390Pension management, net 16 34
+
-
CH
F m
Interest ExpenseInterest Expense
Interest Income &Debt Securities Income
Equity Income
Amortisation of Debt Discounts
Interest Income &Debt Securities Income
Equity Income
Time Cost of ProvisionsAmortisation of Debt DiscountsTime Cost of Provisions
Expected Return onPension Plan Assets
Interest Cost ofPension Plans
Expected Return onPension Plan Assets
Interest Cost ofPension Plans
H1 '06: Net financial income Strong increase due to equity and interest income
Net gains fin liabs at fair value
Fx losses

Roche Interim Results 2006July 20, 2006 28
55
Group tax rate developmentIncrease at Genentech partly compensated by decrease at Roche
%
4.1
27.3
24.3
0.4 -0.1
0.2
-1.6
22
23
24
25
26
27
28
29
30
H1 '05 Exceptionals Profit bef.tax mix
ChangeGenentech
tax rate
ChangeChugai tax
rate
ChangeRoche tax
rate
H1 '06
27.3 → 41.8
22.5 → 20.1
35.4 → 39.2
56
Cash andMarketableSecurities31.12.2005
Free CashFlow
Divisions
Cash andMarketableSecurities30.06.2006
CHF bn
1 cash-out for equity compensation plans 2 property, plant & equipment/intangible assets 3 net working capital4 currency translation adjustments & other
20.920.3
+7.3 -3.4
-0.5-0.7
EBITDAPharma
5.8
EBITDADia 1.3
Oth 0.2
NWC3
-1.4
PPE/IA2
-1.4
ECP1 -0.6
Treasury -0.2 Treasury
FreeCashFlow
Dividends-2.2
Taxes-1.5
Free CashFlow
Non-operating
-3.9+0.6
0.6 Debt
Changes inFinancing
CTA4
Free cash flow of CHF 0.6 bn in H1 '06Strong EBITDA paid for operating investments, taxes and dividends

Roche Interim Results 2006July 20, 2006 29
57
31 December 30 JuneCHF m 2005 2006
Cash 4,228 3,543Marketable securities 16,657 16,786
Liquid funds 20,885 20,329
Long-term debt -9,322 -8,020Short-term debt -348 -344
Interest-bearing liabilities -9,670 -8,364
Net Cash 11,215 11,965
H1 '06: Solid net cash position maintained for future investment
58
CHF m
1 mainly currency translation adjustments
A solid equity base Strong and increasing due to net income
Equitycompensationplans, net of
sharerepurchases
equity+3 %
Netincome
Net incomedirectly
recognisedin equity1
Convertibledebt
31 Dec 05 30 Jun 06
Dividends
40,158
4,543
41,520
747-194
-1,511
-2,223

Roche Interim Results 2006July 20, 2006 30
59
33.6 32.5
15.114.7
20.9 20.3
40.2 41.5
17.619.5
9.5 8.9
31.12.05 30.06.06 31.12.05 30.06.06
Non-currentassets
Assets
68.069.2
Equity & liabilities
Non-currentliabilities
Equity(Net assets)
Other currentassets
Cash andmarketablesecurities
Currentliabilities
68.069.2
58 % 61 %49 %
21 %
30 %
48 %
22 %
30 %
28 % 26 %
14 % 13 %
CHF bn
Balance sheet 87 % of assets financed long-term
60
Diluted EPS Core EPS
Earnings Net income Net income- Minority interest - Minority interest
- Discontinued businesses, after tax- Exceptional items, after tax- Intangible asset amortisation, after tax- Minority interest on above
- Dilution1 - Dilution1
Earnings for diluted EPS Core Net Income
Per # of issued shares and NES # of issued shares and NESShare - Own equity - Own equity
- Dilution1 - Dilution1
# shares for EPS # of shares for EPS1 Dilution from convertible debt and employee stock options, especially Genentech
Measuring our progress on Core EPS

Roche Interim Results 2006July 20, 2006 31
61
H1 '06: Core EPS growing faster than sales On track to deliver on full year guidance
19.4
10.932.5
0.528.9
-2.9 -1.230.12.230.3
0
5
10
15
20
25
30
35
Sales Operating Operating Net Profit Amorti- Minorities Core net Dilution/ Corecost profit financial continuing sation income number of EPS
before income businesses sharesexceptional and before
items taxes exceptional items
CHF growthin %
62
Our growth objectives for 2006Profitability target again increased
Sales
• Double-digit growth1 for Group and Pharmaceuticals
• Above market growth for Pharmaceuticals and Diagnostics
• Accelerating growth for Diagnostics
Core EPS target
• Growth above sales growth
1 in local currencies barring unforeseen events

Roche Interim Results 2006July 20, 2006 32
r
Appendix

Roche Interim Results 2006July 20, 2006 33
65
Pharma sales H1 '06 (vs. H1 '05)Top 20 products
MabThera/ Rituxan 2,348 16 1,309 11 89 1 950 25Herceptin 1,813 105 775 116 70 30 968 106Avastin 1,389 119 1,043 83 - - 346 405NeoRecorm/ Epogin 1,100 1 - - 342 -6 758 5Tamiflu 961 62 276 254 179 -30 506 104CellCept 891 7 436 17 15 18 440 -3Pegasys 724 2 218 -12 33 -18 473 13Xeloda 472 27 182 31 13 -2 277 27Tarceva 367 143 249 66 - - 118 3818Xenical 363 12 62 20 - - 301 10Xolair 257 34 257 34 - - - -Kytril 254 6 100 2 65 8 89 9Nutropin 244 -1 237 -1 - - 7 3Cymevene/Valcyte 223 16 114 17 - - 109 15Rocephin 216 -66 17 -96 29 -1 170 -17Pulmozyme 212 9 122 6 - - 90 14Neutrogin 188 15 - - 188 15 - -Activase/TNKase 178 20 156 19 - - 22 24Boniva 167 661 147 569 - - 20 -Dilatrend 159 -7 - - - - 159 -7
Global US Japan Europe/ RoW% % % %
CHF m loc CHF m loc CHF m loc CHF m loc
66
Pharma sales H1 '06 (vs. H1 '05)Other launches since January 20031
Fuzeon 143 19 69 19 - - 74 20
Copegus 117 -46 12 -89 - - 105 -11
Evista 64 60 - - 64 60 - -
Raptiva 62 0 62 0 - - - -
Renagel 29 15 - - 29 15 - -
Lucentis 13 - 13 - - - - -
Actemra 2 - - - 2 - - -
Femara 1 - - - 1 - - -
Global US Japan Europe/ RoW% % % %
CHF m loc CHF m loc CHF m loc CHF m loc
1 other than launches already covered in Top 20

Roche Interim Results 2006July 20, 2006 34
67
Pharma local sales growth1 in %Global top 20 products
Q3 Q4 Q1 Q2MabThera/ Rituxan 18 23 16 16Herceptin 57 77 107 103Avastin 107 127 141 102NeoRecormon/Epogin 6 12 3 0Tamiflu 148 631 37 133CellCept 28 25 15 -1Pegasys 15 17 2 3Xeloda 44 47 35 21Tarceva - 722 182 119Xenical 9 9 16 8Xolair 51 57 39 30Kytril 14 5 18 -4Nutropin 3 4 -3 1Cymevene/Valcyte 22 23 21 12Rocephin -54 -55 -69 -63Pulmozyme 15 15 14 4Neutrogin 20 18 19 12Activase/TNKase 9 23 19 21Boniva - - - 323Dilatrend -12 3 -6 -8
1 Q3 to Q4: 2005 vs. 2004 and Q1 to Q2: 2006 vs. 2005
68
Pharma local sales growth1 in %Top 20 products by region
MabThera/ Rituxan 14 20 7 16 1 5 3 -1 29 32 30 20Herceptin 70 99 123 110 15 26 31 30 51 69 105 107Avastin 78 88 96 72 - - - - 1755 1203 654 294NeoRecorm/ Epogin - - - - 2 7 -3 -9 9 16 6 5Tamiflu 132 390 414 143 - 733 -33 367 158 864 88 124CellCept 52 44 32 6 18 22 15 20 9 9 2 -7Pegasys 9 14 -14 -10 4 3 -11 -24 20 23 12 13Xeloda 51 64 40 24 27 20 1 -5 41 37 34 20Tarceva - 528 95 46 - - - - - - - 2566Xenical 20 18 24 15 - - - - 7 7 14 7Xolair 51 57 39 30 - - - - - - - -Kytril 20 -2 31 -20 10 11 6 9 9 9 13 4Nutropin 3 4 -3 1 - - - - -6 -5 12 -4Cymevene/Valcyte 17 14 15 20 - - - - 27 36 27 5Rocephin -75 -81 -96 -96 17 14 -11 8 -23 -10 -24 -9Pulmozyme 17 15 12 0 - - - - 11 16 18 10Neutrogin - - - - 20 18 19 12 - - - -Activase/TNKase 10 25 19 19 - - - - 6 6 14 33Boniva - - - 262 - - - - - - - -Dilatrend - - - - - - - - -12 3 -6 -8
US Japan Europe/ RoWQ3 Q4 Q1 Q2 Q3 Q4 Q1 Q2 Q3 Q4 Q1 Q2
1 Q3 to Q4: 2005 vs. 2004 and Q1 to Q2: 2006 vs. 2005

Roche Interim Results 2006July 20, 2006 35
69
H1 '06: Pharmaceuticals DivisionGrowth in main regions and therapeutic areas
Geographies Therapeutic areas
5%
5% 47%
14%
7%
2%
20%
6%9 %
33%
11%
41%
+23 %North America
+23 %Europe*
+15 %Latin America
+28 %others
-4 %Japan
all growth figures are in local currencies * including Eastern Europe
oncology+ 48 %
virology+17 %
transplant+8 %
others+7 %
cardiovascular–5 %
anemia-1 %
infectious disease-58 %
70
H1 '06: Pharmaceuticals Division Sales distribution and growth
6%
4%
3%
4%
28%
5%
5%
1%14%11%
6%
41%
Western Europe
Japan -4%Others* +26 %
NorthAmerica +23%
Latin America +15 %
all growth figures are in local currencies * including Eastern Europe
other Western Europe
UK
SpainItaly
Germany
France
Switzerland
Geographies

Roche Interim Results 2006July 20, 2006 36
H1 '06: 11 approvals in major markets Pharmaceuticals Division
EUInfluenza prophylaxis (ped.)Tamiflu
US1st line aNHLRituxan
EUiNHL maintenanceMabThera
US, EURheumatoid arthritisMabThera/ Rituxan
USAMDLucentis
JapanBCFemara
EUAdjuvant BCHerceptin
US, EUOsteoporosisBoniva/ Bonviva iv
US2nd line mCRCAvastin
RegionIndicationProduct
72
Ong
oing
Mircera (CERA)renal anemia
AvastinNSCLC
Xelodaadjuvant CC combo
Xelodaadjuvant BC
MabThera1st line CLL
Xeloda mCRC 1st line combo
Avastinpancreatic Ca
AvastinRCC
Herceptinadjuvant BC
Avastinadjuvant CC
MabTheraiNHL maint relapsed
HerceptinmBC combo hormonal
Actemra RA
AvastinmBC combo taxol
TarcevaNSCLC 1st line
Avastinovarian Ca
Herceptingastric Ca
MabThera RA DMARD failures
MabThera PPMS
Xolair pediatric asthma
ED-71 osteoporosis
A rich and low risk Phase III pipelineKeeping the high level of commitment
CellCept lupus nephritis
MabTherarelapsed CLL
Tarceva & AvastinNSCLC 2nd line
Status as of June 30, 2006
AvastinprostateCa
Epogin chemotherapy-induced
anemia
Sigmartacute heart failure
File
d o
r
to fi
le s
oon
Antevassubarach. haemor.
MabTheraRA TNF nonresp.
Tarcevapancreatic Ca
AvastinmCRC 1st line ext.
Tarceva & AvastinNSCLC maitenance
Actemra sJIA
Xeloda mCRC 2nd line combo
MabThera ANCA ass. vasculitis
MabThera SLE
√
√
√
√
AvastinmBC combo Taxotere
√
CellCept MG/PV
√ √Xeloda
gastric Ca √
MabThera Lupus nephritis
ValcyteCMV ext.
Avastinadjuvant rectal Ca
√
√
MabTheraiNHL maint 1st line
AvastinmBC combo non-taxanes
AvastinGIST
AvastinmBC 2nd line
*
*
* Approved in July 2006
To s
tart
soo
n Tarcevaadjuvant NSCLC
Avastinadjuvant NSCLC
Avastinadjuvant BC

Roche Interim Results 2006July 20, 2006 37
73Status as of June 30, 2006 Unless stated otherwise, submissions will occur in US and EU
Mircera (CERA)renal anaemia
2006 2007 2008 2009
Xeloda mCRC 2nd line combo
HerceptinmBC hormonal (EU)
AvastinNSCLC 1st line (EU)
Xelodaadj. CC combo
R1273 (Omnitarg)solid tumors (EU)
AvastinRCC (EU)
R1492solid tumors
Phase IIIPhase II
post 2009
Herceptingastric Ca (EU)
Avastinpancreatic Ca (EU)
R1658dyslipidemia
Xelodaadj. BC
MabTheraCLL (EU)
ActemraRA / sJIA
R1558bacterial infections
Avastinadj. CC (EU)
Avastinovarian Ca (EU)
Mircera (CERA)cancer anaemia
CellCeptlupus nephritis
AvastinmBC 1st line (EU)
TarcevaNSCLC 1st line chemo (EU)
R1438type II diabetes
Tarceva+AvastinNSCLC 2nd line (EU)
R667 emphysema
Avastinprostate Ca (EU)
AvastinmCRC 1st line combo
extension (EU)
MabTheraRA DMARD inadeq. resp. (EU)
R1594RA (EU)
R873male erectile dysfunction
R1440type II diabetes
R1503RA
Xeloda mCRC 1st line combo
Tarceva+AvastinNSCLC 1st line
maint (EU)
AvastinNSCLC squamous (EU)
AvastinmBC 1st line extension(EU)
Major Roche managed projected submissionsover the next years
Xeloda gastric Ca (EU)
HerceptinAdj. BC (EU) √
√
√
r
74
Roche R&D pipeline todayTotal of 57 NMEs + 55 Additional Indications
CHU
CHU
R1415
R435
R435
R105*
R105*
R597
CHU
R744
MabThera SLE
MabThera ANCA a. vascul.
MabThera PPMS
MabThera Lupus nephritis
Avastin mBC 2nd line
Avastin adj. rectal cancer
Avastin GIST
Xolair pediatric asthma
Valcyte CMV ext.
Herceptin gastric cancer
Herceptin mBC combo
Avastin mCRC 1st line ext.
Avastin ovarian cancer
Avastin prostate cancer
Avastin RCC
Avastin pancreatic cancer
Avastin mBC combo non-tax 1st
Avastin mBC combo taxotere 1st
Avastin adj. CC
Xeloda gastric Ca
Xeloda adj. BC
Xeloda adj. CC combo
Xeloda mCRC 2nd line combo
Xeloda mCRC 1st line combo
T+A NSCLC 1st line maint.
T+A NSCLC 2nd line
Tarceva NSCLC 1st line
MabThera iNHL maint 1st line
MabThera CLL relapsed
MabThera CLL 1st line
MabThera RA DMARD nonresp.
CellCept MG/PV
CellCept lupus nephritis
Äctemra sJIA
ED-71 osteoporosis
Actemra RA
GEN
GEN
GEN
GEN
NMEs Roche Managed
GEN
GEN
GEN** Opted-in in July 2006MEM Memory
GENISO Isotechnika
R127MabThera RRMSGENIPS Ipsen
R597Avastin glioblastomaGENARQ ArQule
R597Avastin adj. BC HER2-GENGEN Genentech
R435Lucentis diabetic macular edemaGENCHU Chugai
R435Daclizumab asthmaR35Daclizumab transpl. maint.R35Opt-in Opportunities (NME/AI)xx
R435metastatic breast cancerR1273NHLR1594Additional Indications (AI)R
R435Tarceva glioblastomaR1415Valganciclovir ulcerat.. colitisR127NMEs/AIs ParticipationsA
R435Avastin NSCLC mCNS treatGENAlzheimer'sMEMR
R435Avastin NSCLC squamousR435mBCGENLegendR435Mircera cancer rel. anemiaR744cancerGEN
R435solid tumorsARQbasal cell carcinomaGEN
R340type 2 diabetesIPS**RA / Sjögrens syndrome GEN
R340renal transplantationISOHCVR1626
R340dianetic foot ulcersGENHCVR1656
R340post-hepatectomyCHUsolid tumorsR1645solid tumorsCHU
R340osteoporosisCHUsolid tumorsR1530HCVR7128
* Approved in July 2006R1415+R435gastroparesisCHUsolid tumorsR1507HCVR7025
R1415+R435asthmaR411solid tumorsR1454HIVR1206
Sigmart acute heart failureR1415emphysemaR667solid tumorsR547NHLR7159
Epogin cancer anemiaR105solid tumorsR1492anxietyR7090schizophreniaR7118
Tarceva pancreatic cancerR105ovarian cancerR1273schizophreniaR1678schizophreniaR1551
Avastin mBC combo taxol 1stR105MEDR873Alzheimer’sR1450depressionR1647
Avastin NSCLC 1st lineR105dyslipidemiaR1658dyslipidemiaR1664Alzheimer'sR641
MabThera RA TNF nonresp.R99type 2 diabetesR1438dyslipidemiaR1593anticoagulantR1663
MabThera iNHL maint relapseR99type 2 diabetesR1440type 2 diabetesR1439overactive bladderR1646
Herceptin adj. BCR1569rheumatoid arthritisR1594AI / transplantR3421type 2 diabetesR1579
Antevas subarach. haemor.CHUrheumatoid arthritisR1503rheumatoid arthritisR1295type 2 diabetesR1511
Mircera renal anemiaR1569bacterial infectionsR1558IBDR1541osteoarthritisR1599
phase 0 (14 NMEs)
phase I (21 NMEs + 3 AIs)
phase ll(18 NMEs + 10 AIs)
phase III(2 NMEs + 34 AIs)
Status as of June 30, 2006
Registration(2 NMEs + 8 AIs)

Roche Interim Results 2006July 20, 2006 38
75
Roche managed R&D pipeline - overviewProjects by Therapeutic Area
32
98
15
29
22
2 3 17
13
2
7
9
39
Research Development
Neurological and Psychiatric Diseases
Cardiovascular and Metabolic Diseases
Heamatologyand Nephrology
Respiratory Diseases
GenitourinaryDiseases
Viral and Other Infectious Diseases
Inflammatory, Autoimmune and Bone Diseases
Oncology
115 projects
Neurological and Psychiatric Diseases
Respiratory DiseasesInflammatory,
Autoimmune and Bone Diseases
Oncology
Cardiovascular and Metabolic Diseases
83 projects
Viral and Other Infectious Diseases
Transplant
Status as of June 30, 2006
76
Diagnostics quarterly sales & local growth1
Q2 ‘05 Q3 ‘05 Q4 ‘05 Q1 ’06 Q2 ‘06CHF m % loc CHF m % loc CHF m % loc CHF m % loc CHF m % loc
Diabetes 690 2% 713 7% 793 -1% 682 -5% 746 6%Care
Centralized 746 6% 712 5% 766 4% 760 7% 775 2%Diagnostics
Molecular 293 3% 303 5% 312 5% 297 7% 312 5%Diagnostics
Near Patient 173 3% 180 9% 204 8% 193 9% 200 14%Testing
Applied 133 0% 130 1% 160 19% 159 10% 148 10%Science
DIA Division 2,035 4% 2,038 6% 2,235 3% 2,091 3% 2,181 5%
1 2005 vs. 2004 for Q1 to Q4 ‘05, 2006 vs. 2005 for Q1 to Q2 ‘06

Roche Interim Results 2006July 20, 2006 39
77
H1 '06: Diagnostics local salesBy region & Business Area (vs. H1 ‘05)
CHF m CHF m% loc growth
GlobalCHF m
Nth Am.CHF m
EMEA RoW% loc
growth% loc
growth% loc
growth
Diabetes Care 1,428 1 405 -9 794 4 229 7
Molecular Diagnostics 609 6 210 5 198 9 201 5
Centralized Diagnostics 1,535 4 290 -2 784 5 461 8
Near Patient Testing 393 11 151 17 168 9 74 7
Applied Science 307 10 124 11 123 9 60 8
Roche Diagnostics 4,272 4 1,180 0 2,067 6 1,025 7
78
2006: Key planned product launches* (1)
Global Successor meter for Accu-Chek Go offering improved features and design
DCAccu-Chek Go (new)
EUMultiplex detection test for screening blood for HIV, HBV & HCV on the automated cobas s 201 system
MDcobas s 201 & MPX Test
EUBlood based test to rapidly detect major bacterial & fungal pathogens causing sepsis
MDLightCyclerSeptiFast Test
NPT
BA1
Global
Region
Handheld system for coagulation monitoring for professional use
CoaguChek XS Plus
IndicationProduct
1 Business Areas: Applied Science (AS), Near Patient Testing (NPT), Molecular Diagnostics (MD), Diabetes Care (DC)* Subject to appropriate regulatory approvals; US launches may be later than indicated
√
√
√

Roche Interim Results 2006July 20, 2006 40
79
2006: Key planned product launches* (2)
GlobalLab Information System (LIS) supporting complete IVD testing, from order entry to result reporting
CDcobas IT 5000 solution
GlobalCentral Lab Data Management System (WAM) consolidating instrument interfacing
CDcobas IT 3000 solution
GlobalStandalone clinical chemistry and electrolyte analyzer for extra-small workload laboratories
CDcobas c 111 analyzer
GlobalNext generation modular system consolidating clinical chemistry and immunochemistry testing for small to medium workload laboratories; links cobas c 311 & cobas e 411 modules with the PSM data manager
CDcobas 4000 analyzer series
GlobalNext generation modular system consolidating clinical chemistry and immunochemistry testing for medium to large workload laboratories; combines cobas c 501 & cobas e 601 modules
CDcobas 6000 analyzer series
BA1 RegionIndicationProduct
1 Business Area: Centralized Diagnostics (CD)* Subject to appropriate regulatory approvals; US launches may be later than indicated
√
80
15.6 %
19.4%0.4 %0.1 %0.3 %
0.4 %0.4 %
0.6 %2.4 %
USD LAT-AM
CAD AS-PAC
EUR Other JPY
Localsales
growthH1 '06
vs. H1 '05
Exchange rate impact on sales growthHigher CHF growth rate driven by stronger US$
CHFsales
growthH1 '06
vs. H1 '05
mainlyBRL

Roche Interim Results 2006July 20, 2006 41
81
15.4 % 15.6 %
21.5 %19.4 %
Q1 H1
H1 '06: Currency impactUSD strengthened
localgrowth
CHFgrowth
Difference in CHF / local growth
+6.1 %pt +3.8 %pt
Sales growth 2006 vs. 2005
CHF 3 mJPYCHF 17 m
CHF 10 mEURCHF 35 m
CHF 12 mUSDCHF 60 m
Operating profit1CurrencySales
CHF 0.01 change against USD / EURO / JPY effect on
• USD 1 = CHF 1.27 ± CHF 0.01
• EUR 1 = CHF 1.56 ± CHF 0.01
• JPY 100 = CHF 1.10 ± CHF 0.01
Currency sensitivities (order of magnitude) are based on business / product mix composition of H1 '06 1 before exceptional items
82
1.53
1.54
1.55
1.56
1.57
1.58
Jan Feb Mar Apr May Jun Jul Aug Sep Oct Nov Dec
2006
2006 and 2005CHF / EUR
2005
1.53
1.54
1.55
1.56
1.57
1.58
Jan Feb Mar Apr May Jun Jul Aug Sep Oct Nov Dec
Monthly averages
Year-To-Date averages
2006
2005+1 % +1 %

Roche Interim Results 2006July 20, 2006 42
83
1.16
1.20
1.24
1.28
1.32
Jan Feb Mar Apr May Jun Jul Aug Sep Oct Nov Dec
2006
2006 and 2005CHF / USD
2005
1.16
1.20
1.24
1.28
1.32
Jan Feb Mar Apr May Jun Jul Aug Sep Oct Nov Dec
Monthly averages
Year-To-Date averages
2006
2005+10 % +6 %