Embed Size (px)
Citation preview
LONDON CONGESTION TRENDS MARCH 2016
TABLE OF CONTENTS
Executive Summary ....................................................................................................................................................1 Project Summary ........................................................................................................................................................ 1 Key Conclusions ......................................................................................................................................................... 1 Findings ...................................................................................................................................................................... 2 Data Summary............................................................................................................................................................ 4
Section 1: Introduction ...............................................................................................................................................5
Section 2: Study Design ..............................................................................................................................................6 Approach .................................................................................................................................................................... 6
Zone System .................................................................................................................................................................. 7 Functional Road Classes ................................................................................................................................................ 8
Data Sources .............................................................................................................................................................. 8
Section 3: Traffic Conditions Congestion in London ............................................................................................... 10 INRIX Journey Time Analysis .................................................................................................................................... 10
Section 4: Drivers of Travel Demand Key Indicators .............................................................................................. 13 Economic Indicators ................................................................................................................................................. 13
Increasing GDP — Economic Growth .......................................................................................................................... 13 Increasing Employment ............................................................................................................................................... 14 Decreasing Petrol Prices .............................................................................................................................................. 14 Increasing Ecommerce ................................................................................................................................................ 15
Population Changes ................................................................................................................................................. 15
Section 5: Actual Travel Demand Volume Observations ........................................................................................ 16 London Traffic Count Data ....................................................................................................................................... 16 Transport for London Traffic Volumes ..................................................................................................................... 18 Vehicles Entering Congestion Charge Zone ............................................................................................................. 18
Section 6: Influence of Mode and Vehicle Type on Travel Demand ............................................................................ 19 Travel by Other Modes ............................................................................................................................................ 19 Vehicle Type Trends ................................................................................................................................................. 21 Private Hire Vehicles Entering Congestion Charge Zone ......................................................................................... 22
Section 7: Private Hire Vehicles Impact on Congestion .......................................................................................... 23 Vehicle Registrations ................................................................................................................................................ 23 INRIX Private Hire Vehicle Analysis .......................................................................................................................... 24
Section 8: Travel Supply Planned and Unplanned Disruptions ............................................................................... 25 Disruptions by Time ................................................................................................................................................. 25 Unplanned Disruptions ............................................................................................................................................ 26
Section 9: Summary and Conclusion ......................................................................................................................... 27 Key Conclusions ....................................................................................................................................................... 27
Page 1
EXECUTIVE SUMMARY
Project Summary
The annual INRIX Scorecard shows that London continues to be one of the most congested cities in the world.
Congestion has a significant impact on cities—both on businesses that drive economic growth and on individuals’ quality
of life. While increased congestion is generally a result of a growing and vibrant economy, it may ultimately stall
economic growth if not addressed.
Traffic congestion is caused when the demand for space on the road network exceeds the supply. In order to understand
the changes in the supply and demand elements, data was analysed from a range of high quality sources including the
Department for Transport, Transport for London and the Office for National Statistics, along with INRIX’s own traffic
data. This study utilises information from 20122015 from these data sources to consider each of the factors that could
impact congestion and to build up a multi-faceted picture of the causes of congestion.
Key Conclusions
Congestion in London has risen noticeably between the years of 2012 and 2015 with journey times in Central
London increasing by 12% annually.
Car traffic, including taxis and private hire vehicles (PHVs), is decreasing in Central London and the Congestion
Charge Zone (CCZ); thus, as a category, cars are not causing an increase in congestion in these area
Roadway travel demand, as seen in vehicle counts, is flat or decreasing in Central London and increasing only
slightly in Outer London; increased use of alternate modes of transit may explain why roadway traffic volumes
remain flat.
Truck (LGV) traffic is increasing in Central London, possibly related to the rise in ecommerce. This is the only
vehicle type to show more roadway volume in all three zones of London.
One of the most significant drivers of increased congestion in London is roadworks, increasing 362% during the
study period.
Page 2
Findings
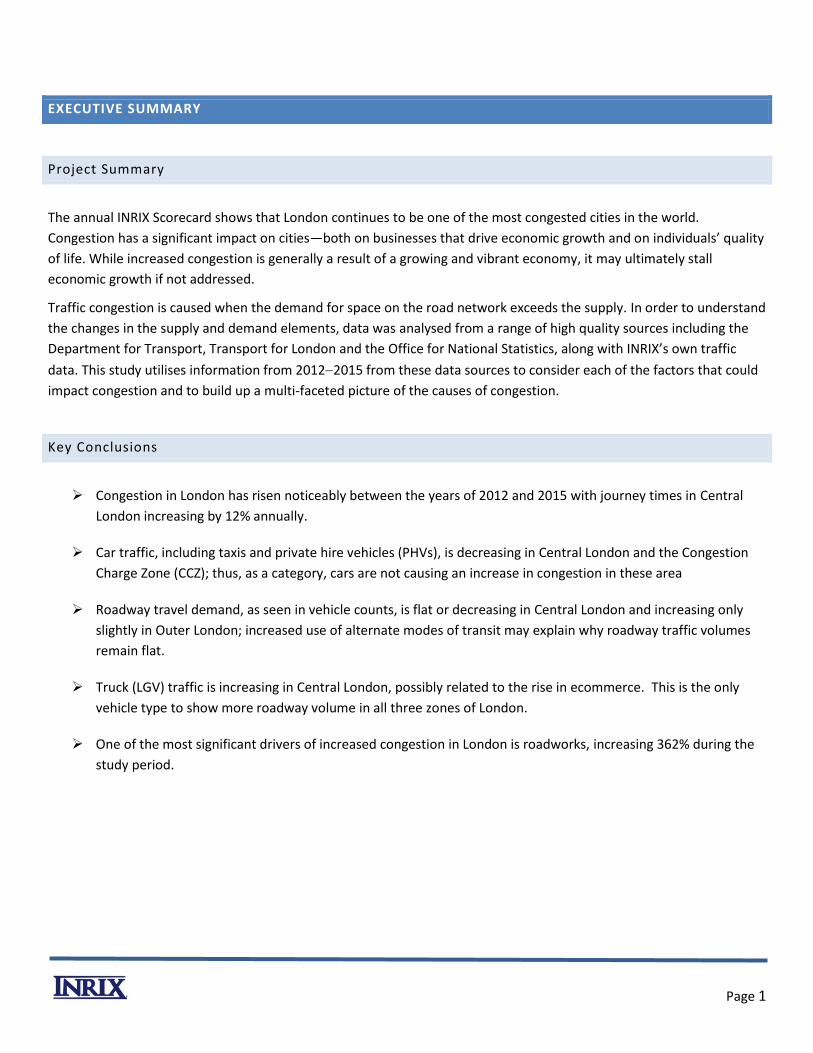
Congestion in London has increased each year during the study period, especially in Central London.
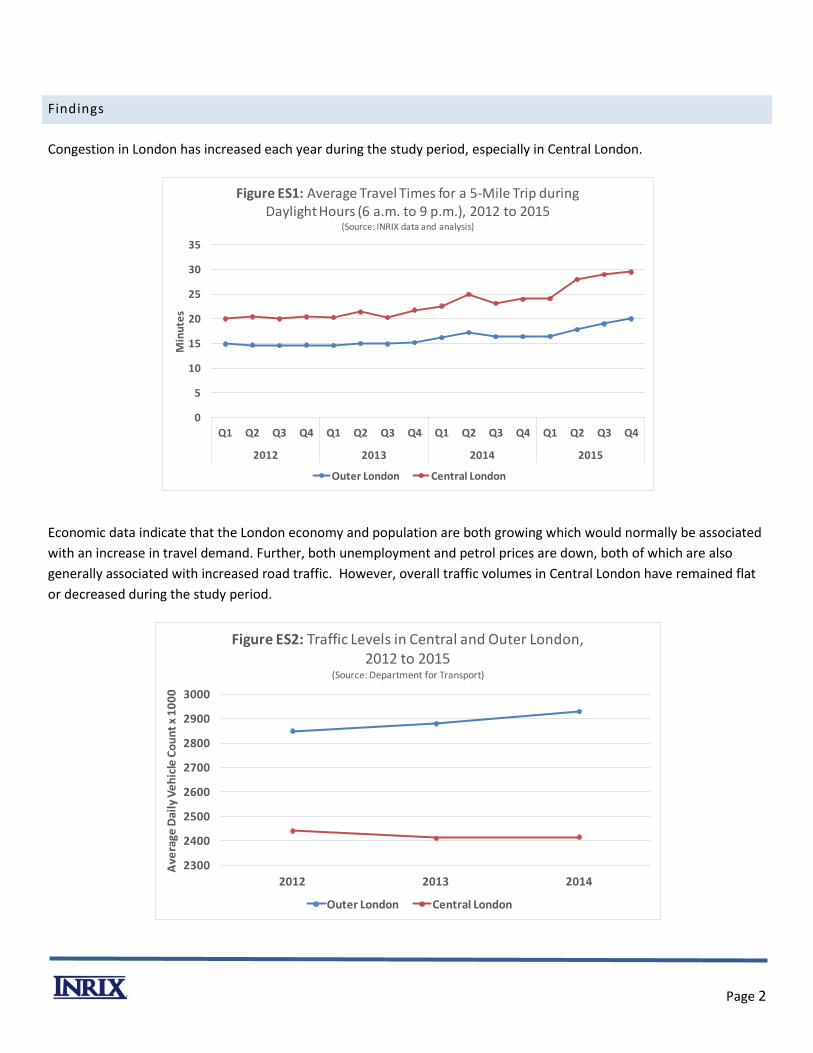
Economic data indicate that the London economy and population are both growing which would normally be associated
with an increase in travel demand. Further, both unemployment and petrol prices are down, both of which are also
generally associated with increased road traffic. However, overall traffic volumes in Central London have remained flat
or decreased during the study period.
0
5
10
15
20
25
30
35
Q1 Q2 Q3 Q4 Q1 Q2 Q3 Q4 Q1 Q2 Q3 Q4 Q1 Q2 Q3 Q4
2012 2013 2014 2015
Min
ute
sFigure ES1: Average Travel Times for a 5-Mile Trip during
Daylight Hours (6 a.m. to 9 p.m.), 2012 to 2015(Source: INRIX data and analysis)
Outer London Central London
2300
2400
2500
2600
2700
2800
2900
3000
2012 2013 2014
Ave
rage
Dai
ly V
eh
icle
Co
un
t x
10
00
Figure ES2: Traffic Levels in Central and Outer London,2012 to 2015
(Source: Department for Transport)
Outer London Central London
Page 3
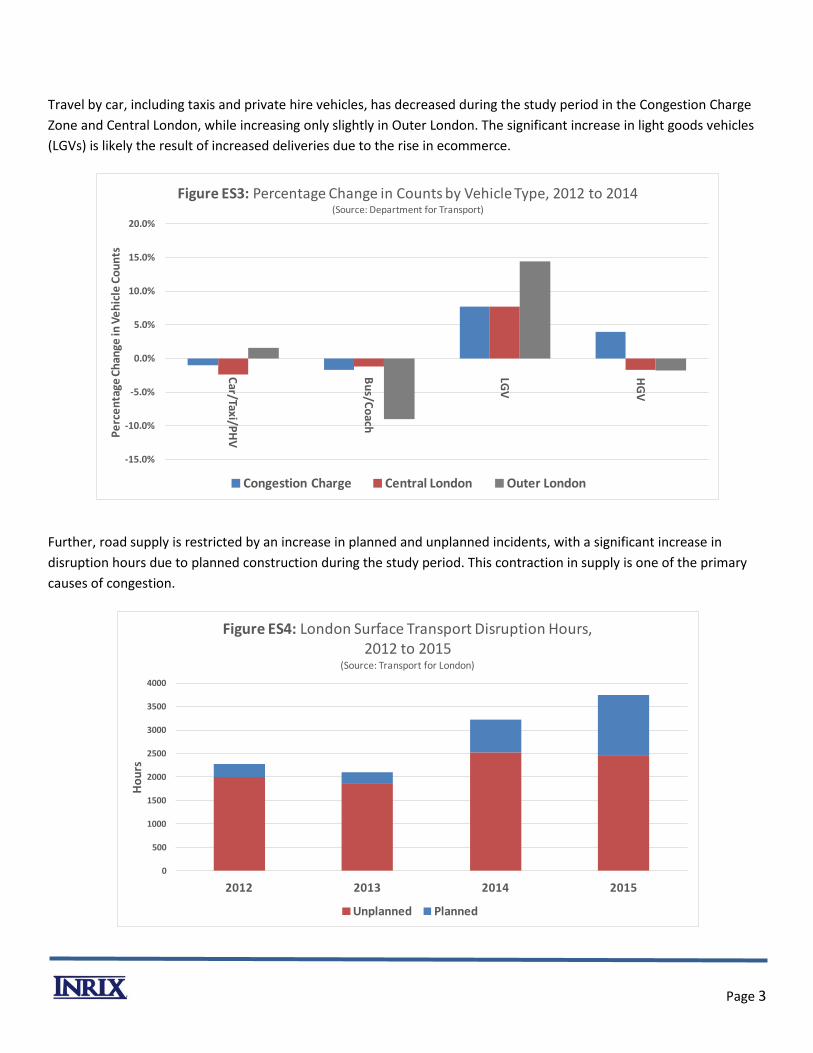
Travel by car, including taxis and private hire vehicles, has decreased during the study period in the Congestion Charge
Zone and Central London, while increasing only slightly in Outer London. The significant increase in light goods vehicles
(LGVs) is likely the result of increased deliveries due to the rise in ecommerce.
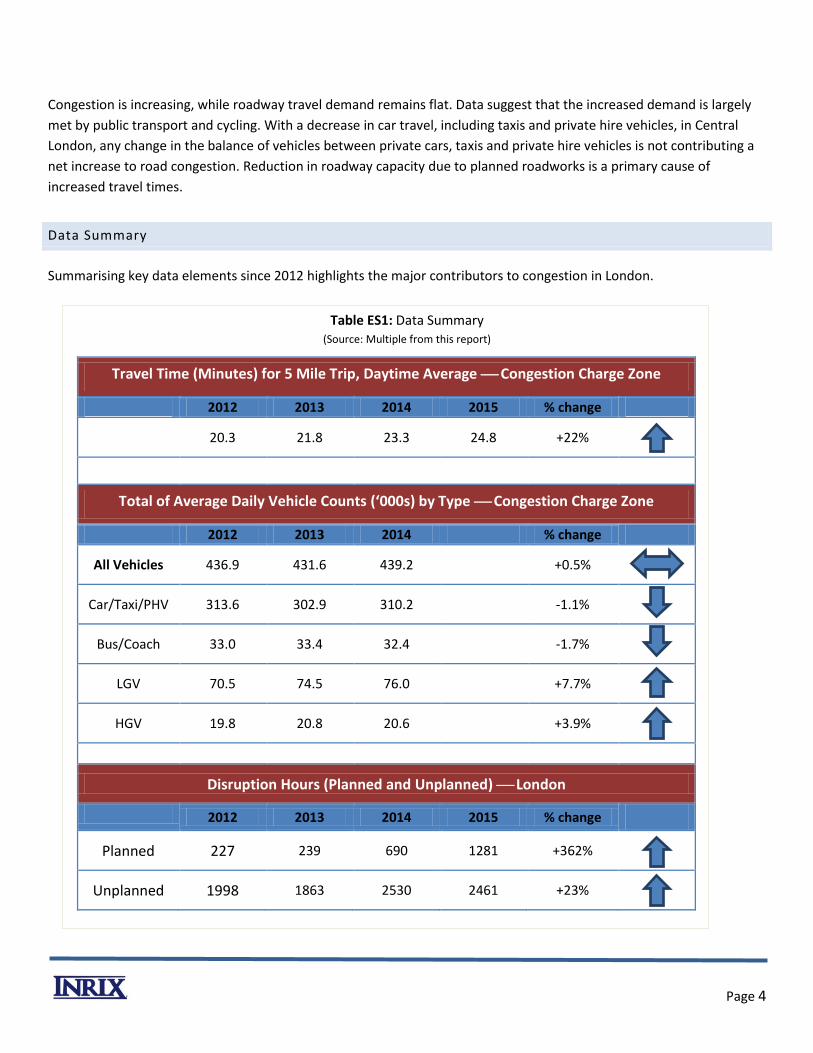
Further, road supply is restricted by an increase in planned and unplanned incidents, with a significant increase in
disruption hours due to planned construction during the study period. This contraction in supply is one of the primary
causes of congestion.
-15.0%
-10.0%
-5.0%
0.0%
5.0%
10.0%
15.0%
20.0%
Car/Taxi/P
HV
Bu
s/Co
ach
LGV
HG
V
Pe
rce
nta
ge C
han
ge in
Ve
hic
le C
ou
nts
Figure ES3: Percentage Change in Counts by Vehicle Type, 2012 to 2014(Source: Department for Transport)
Congestion Charge Central London Outer London
0
500
1000
1500
2000
2500
3000
3500
4000
2012 2013 2014 2015
Ho
urs
Figure ES4: London Surface Transport Disruption Hours, 2012 to 2015
(Source: Transport for London)
Unplanned Planned
Page 4
Congestion is increasing, while roadway travel demand remains flat. Data suggest that the increased demand is largely
met by public transport and cycling. With a decrease in car travel, including taxis and private hire vehicles, in Central
London, any change in the balance of vehicles between private cars, taxis and private hire vehicles is not contributing a
net increase to road congestion. Reduction in roadway capacity due to planned roadworks is a primary cause of
increased travel times.
Data Summary
Summarising key data elements since 2012 highlights the major contributors to congestion in London.
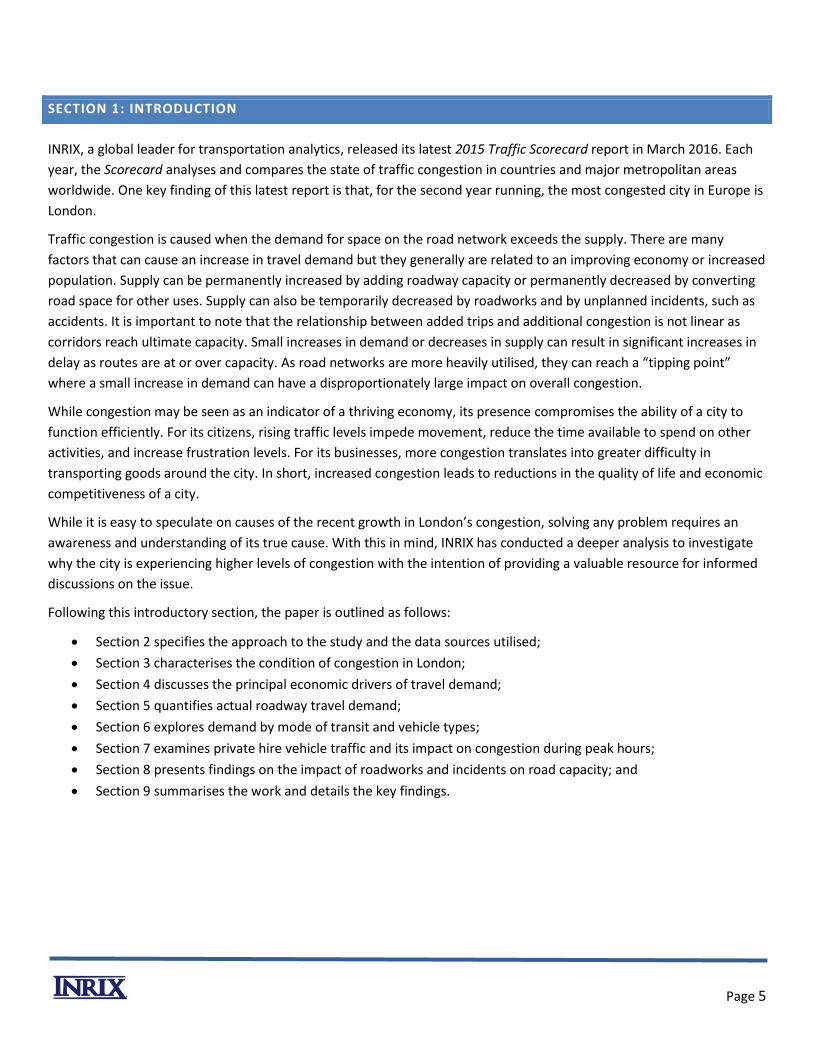
Table ES1: Data Summary (Source: Multiple from this report)
Travel Time (Minutes) for 5 Mile Trip, Daytime Average Congestion Charge Zone
2012 2013 2014 2015 % change
20.3 21.8 23.3 24.8 +22%
Total of Average Daily Vehicle Counts (‘000s) by Type Congestion Charge Zone
2012 2013 2014 % change
All Vehicles 436.9 431.6 439.2 +0.5%
Car/Taxi/PHV 313.6 302.9 310.2 -1.1%
Bus/Coach 33.0 33.4 32.4 -1.7%
LGV 70.5 74.5 76.0 +7.7%
HGV 19.8 20.8 20.6 +3.9%
Disruption Hours (Planned and Unplanned) London
2012 2013 2014 2015 % change
Planned 227 239 690 1281 +362%
Unplanned 1998 1863 2530 2461 +23%
Page 5
SECTION 1: INTRODUCTION
INRIX, a global leader for transportation analytics, released its latest 2015 Traffic Scorecard report in March 2016. Each
year, the Scorecard analyses and compares the state of traffic congestion in countries and major metropolitan areas
worldwide. One key finding of this latest report is that, for the second year running, the most congested city in Europe is
London.
Traffic congestion is caused when the demand for space on the road network exceeds the supply. There are many
factors that can cause an increase in travel demand but they generally are related to an improving economy or increased
population. Supply can be permanently increased by adding roadway capacity or permanently decreased by converting
road space for other uses. Supply can also be temporarily decreased by roadworks and by unplanned incidents, such as
accidents. It is important to note that the relationship between added trips and additional congestion is not linear as
corridors reach ultimate capacity. Small increases in demand or decreases in supply can result in significant increases in
delay as routes are at or over capacity. As road networks are more heavily utilised, they can reach a “tipping point”
where a small increase in demand can have a disproportionately large impact on overall congestion.
While congestion may be seen as an indicator of a thriving economy, its presence compromises the ability of a city to
function efficiently. For its citizens, rising traffic levels impede movement, reduce the time available to spend on other
activities, and increase frustration levels. For its businesses, more congestion translates into greater difficulty in
transporting goods around the city. In short, increased congestion leads to reductions in the quality of life and economic
competitiveness of a city.
While it is easy to speculate on causes of the recent growth in London’s congestion, solving any problem requires an
awareness and understanding of its true cause. With this in mind, INRIX has conducted a deeper analysis to investigate
why the city is experiencing higher levels of congestion with the intention of providing a valuable resource for informed
discussions on the issue.
Following this introductory section, the paper is outlined as follows:
Section 2 specifies the approach to the study and the data sources utilised;
Section 3 characterises the condition of congestion in London;
Section 4 discusses the principal economic drivers of travel demand;
Section 5 quantifies actual roadway travel demand;
Section 6 explores demand by mode of transit and vehicle types;
Section 7 examines private hire vehicle traffic and its impact on congestion during peak hours;
Section 8 presents findings on the impact of roadworks and incidents on road capacity; and
Section 9 summarises the work and details the key findings.
Page 6
SECTION 2: STUDY DESIGN
Approach
Congestion is a complex issue that manifests itself in a number of ways, some related to traffic phenomena and others
(arguably more important) associated with business productivity and support for economic development. In simple
terms, congestion problems involve extra travel time and/or unpredictable arrival times and are caused by an imbalance
between travel demand and transportation capacity.
In reality, there are many interactions that can change this demand-and-supply dynamic on a dailyor even hourly
basis, such as planned events (roadworks), unplanned events (car crashes or other incidents), inclement weather, and
other traffic disruptions. These interactions become even more complicated when also considering different modes of
travel, like single-occupancy driving, bus, underground, taxis, private hire cars, cycling, and walking.
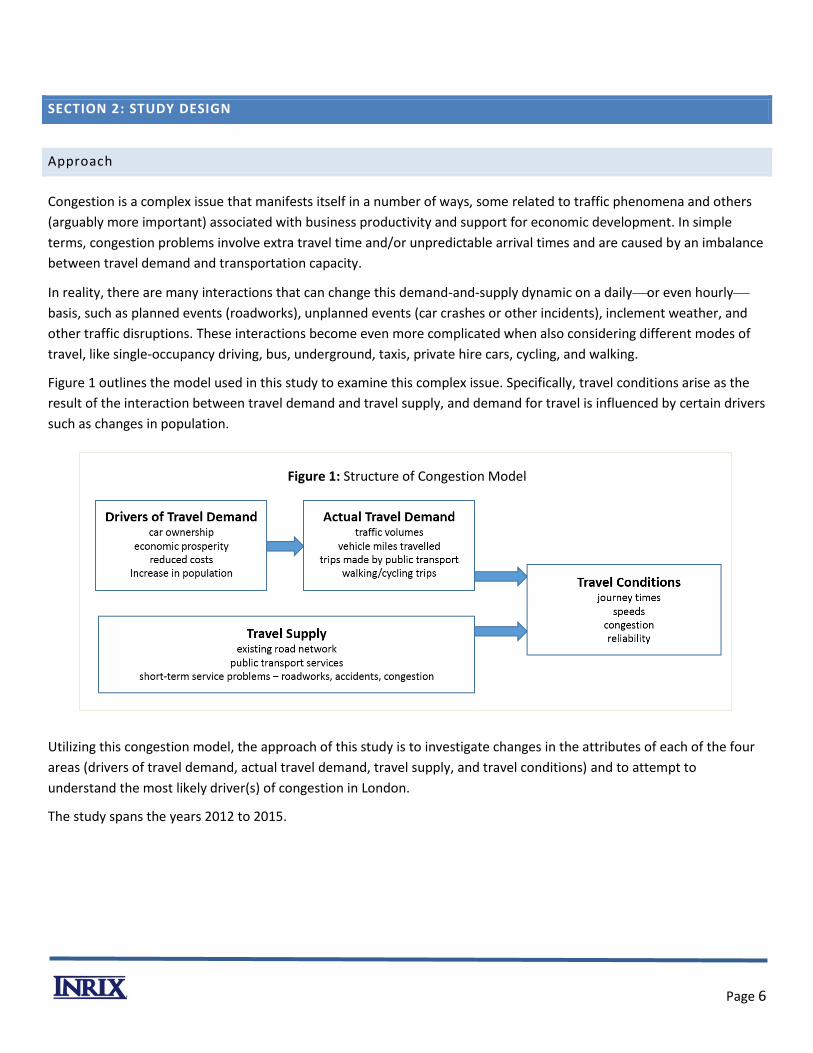
Figure 1 outlines the model used in this study to examine this complex issue. Specifically, travel conditions arise as the
result of the interaction between travel demand and travel supply, and demand for travel is influenced by certain drivers
such as changes in population.
Figure 1: Structure of Congestion Model
Utilizing this congestion model, the approach of this study is to investigate changes in the attributes of each of the four
areas (drivers of travel demand, actual travel demand, travel supply, and travel conditions) and to attempt to
understand the most likely driver(s) of congestion in London.
The study spans the years 2012 to 2015.
Page 7
ZONE SYSTEM
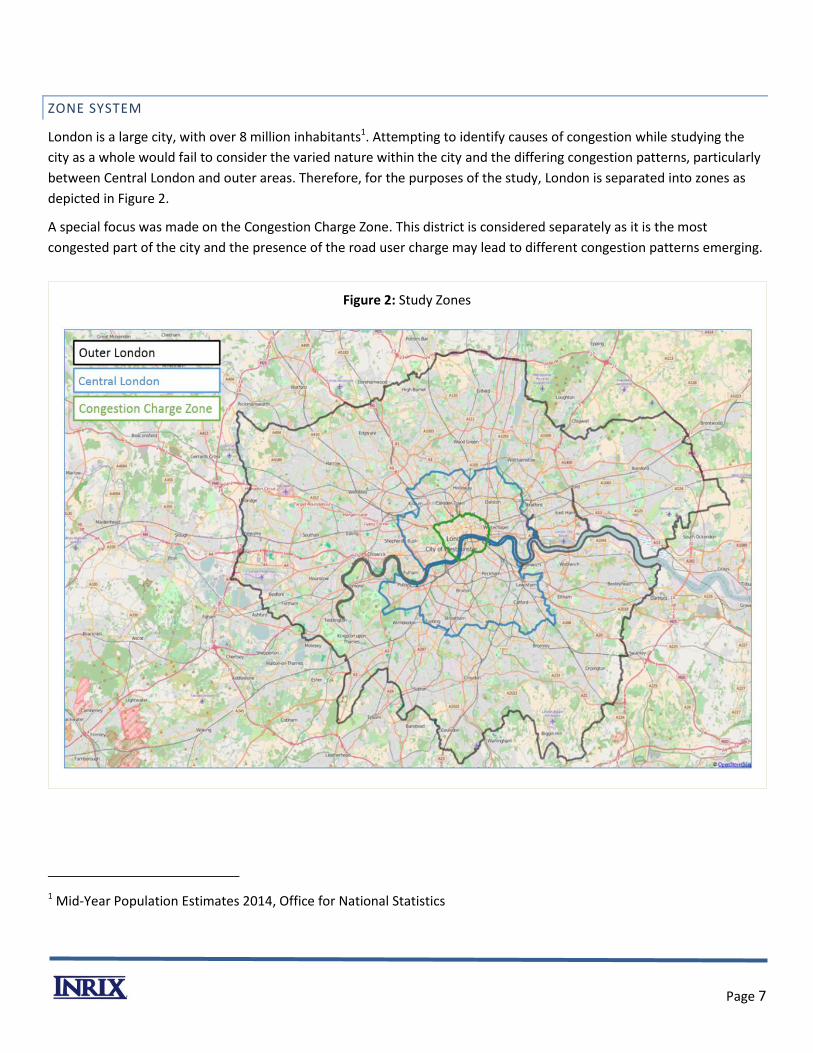
London is a large city, with over 8 million inhabitants1. Attempting to identify causes of congestion while studying the
city as a whole would fail to consider the varied nature within the city and the differing congestion patterns, particularly
between Central London and outer areas. Therefore, for the purposes of the study, London is separated into zones as
depicted in Figure 2.
A special focus was made on the Congestion Charge Zone. This district is considered separately as it is the most
congested part of the city and the presence of the road user charge may lead to different congestion patterns emerging.
Figure 2: Study Zones
1 Mid-Year Population Estimates 2014, Office for National Statistics
Page 8
FUNCTIONAL ROAD CLASSES
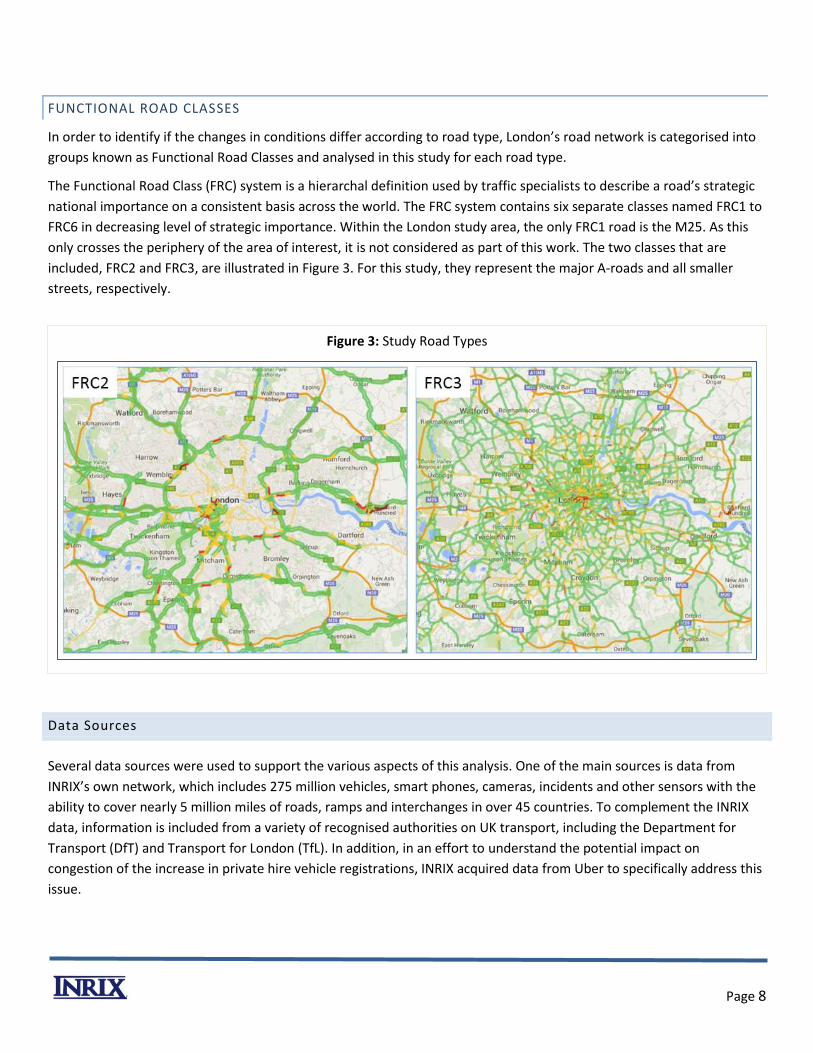
In order to identify if the changes in conditions differ according to road type, London’s road network is categorised into
groups known as Functional Road Classes and analysed in this study for each road type.
The Functional Road Class (FRC) system is a hierarchal definition used by traffic specialists to describe a road’s strategic
national importance on a consistent basis across the world. The FRC system contains six separate classes named FRC1 to
FRC6 in decreasing level of strategic importance. Within the London study area, the only FRC1 road is the M25. As this
only crosses the periphery of the area of interest, it is not considered as part of this work. The two classes that are
included, FRC2 and FRC3, are illustrated in Figure 3. For this study, they represent the major A-roads and all smaller
streets, respectively.
Figure 3: Study Road Types
Data Sources
Several data sources were used to support the various aspects of this analysis. One of the main sources is data from
INRIX’s own network, which includes 275 million vehicles, smart phones, cameras, incidents and other sensors with the
ability to cover nearly 5 million miles of roads, ramps and interchanges in over 45 countries. To complement the INRIX
data, information is included from a variety of recognised authorities on UK transport, including the Department for
Transport (DfT) and Transport for London (TfL). In addition, in an effort to understand the potential impact on
congestion of the increase in private hire vehicle registrations, INRIX acquired data from Uber to specifically address this
issue.
Page 9
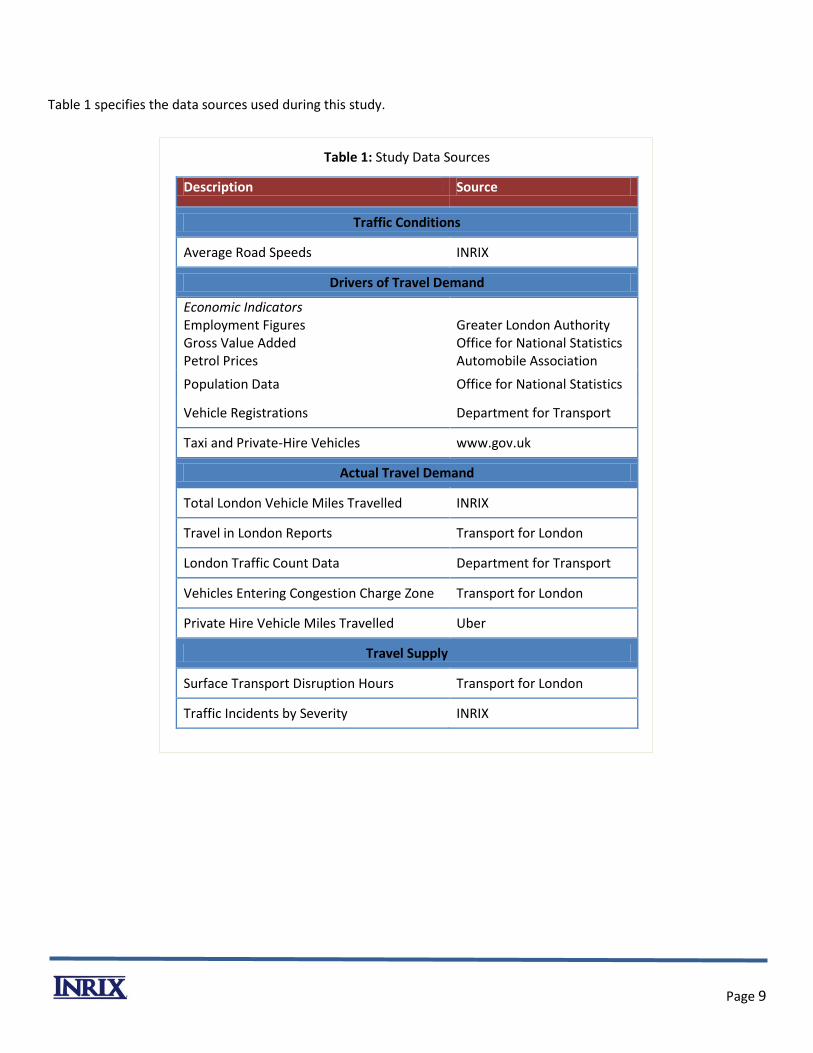
Table 1 specifies the data sources used during this study.
Table 1: Study Data Sources
Description Source
Traffic Conditions
Average Road Speeds INRIX
Drivers of Travel Demand
Economic Indicators Employment Figures Gross Value Added Petrol Prices
Greater London Authority Office for National Statistics Automobile Association
Population Data Office for National Statistics
Vehicle Registrations Department for Transport
Taxi and Private-Hire Vehicles www.gov.uk
Actual Travel Demand
Total London Vehicle Miles Travelled INRIX
Travel in London Reports Transport for London
London Traffic Count Data Department for Transport
Vehicles Entering Congestion Charge Zone Transport for London
Private Hire Vehicle Miles Travelled Uber
Travel Supply
Surface Transport Disruption Hours Transport for London
Traffic Incidents by Severity INRIX
Page 10
SECTION 3: TRAFFIC CONDITIONS CONGESTION IN LONDON
Weekday journey times have been calculated using INRIX’s historical archive of information derived from floating vehicle
car data (FCD). The information used was originally transmitted by GPS devices in vehicles making journeys throughout
London. The FCD input data contain a high level of spatial and temporal precision, meaning it is possible to accurately
derive the speeds of vehicles and clearly attribute these speeds to the specific sections of roads on which the vehicles
are travelling.
For this study, the FCD archive for Greater London was analysed between 2012 and 2015. The analysis is broken out by
geographic areas and road type delineated by FRC, as described in Section 2.
INRIX Journey Time Analysis
INRIX computes speed every minute on each segment of roadway in its coverage area and stores this information. This
data can then be converted into various forms to conduct longitudinal studies of congestion, looking at speed, journey
time, congestion levels, or various indices related to these elements. While all of these methodologies show the same
relative trends, for this report, the basic data has been analysed and presented by considering what the average travel
time would be for a hypothetical five-mile journey at different times during a typical weekday.
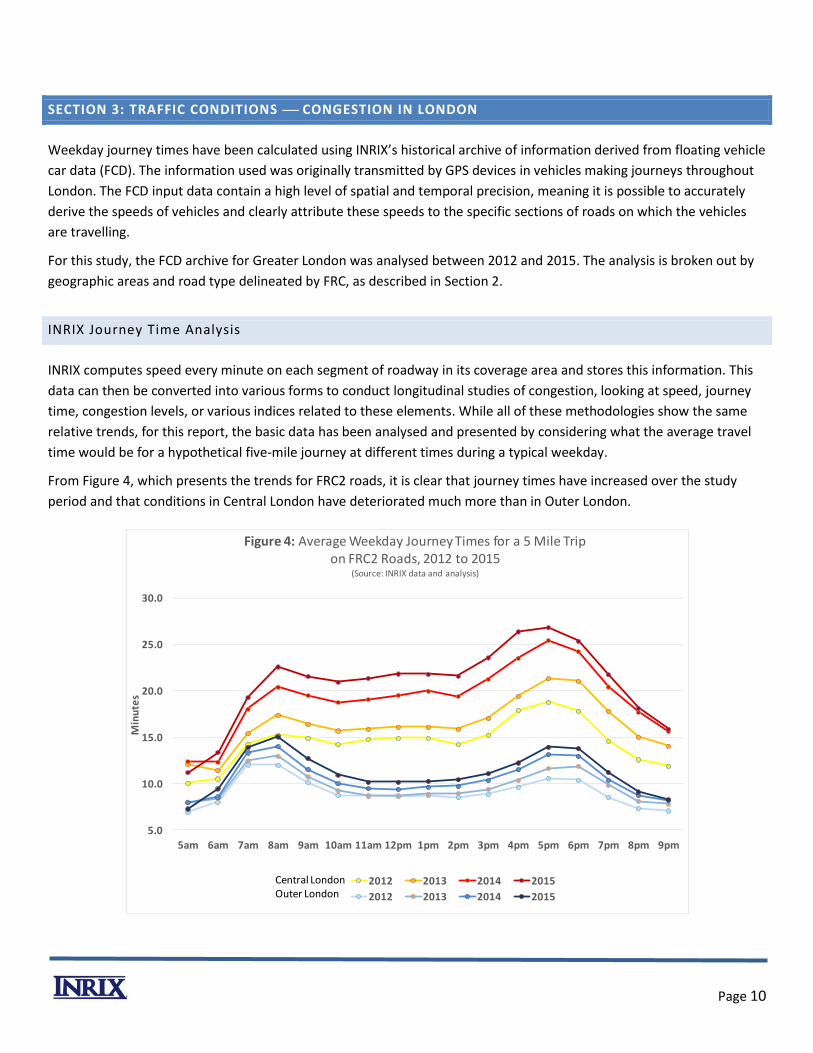
From Figure 4, which presents the trends for FRC2 roads, it is clear that journey times have increased over the study
period and that conditions in Central London have deteriorated much more than in Outer London.
5.0
10.0
15.0
20.0
25.0
30.0
5am 6am 7am 8am 9am 10am 11am 12pm 1pm 2pm 3pm 4pm 5pm 6pm 7pm 8pm 9pm
Min
ute
s
Figure 4: Average Weekday Journey Times for a 5 Mile Trip on FRC2 Roads, 2012 to 2015
(Source: INRIX data and analysis)
2012 2013 2014 2015
2012 2013 2014 2015
Central LondonOuter London
Page 11
Figure 4 shows that congestion has increased across all daylight hours (not just during peak hours) in Central and Outer
London. There has been 3- to 4-minute growth in travel time (30+ percent increase) from 2012 to 2015 in Outer London.
In Central London, evening peak travel times have increased from 19 to 27 minutes (40+ percent), morning peak travel
times have increased from 16 to 23 minutes (40+ percent), and inter-peak period travel times have increase from 23 to
35 minutes (50+ percent).
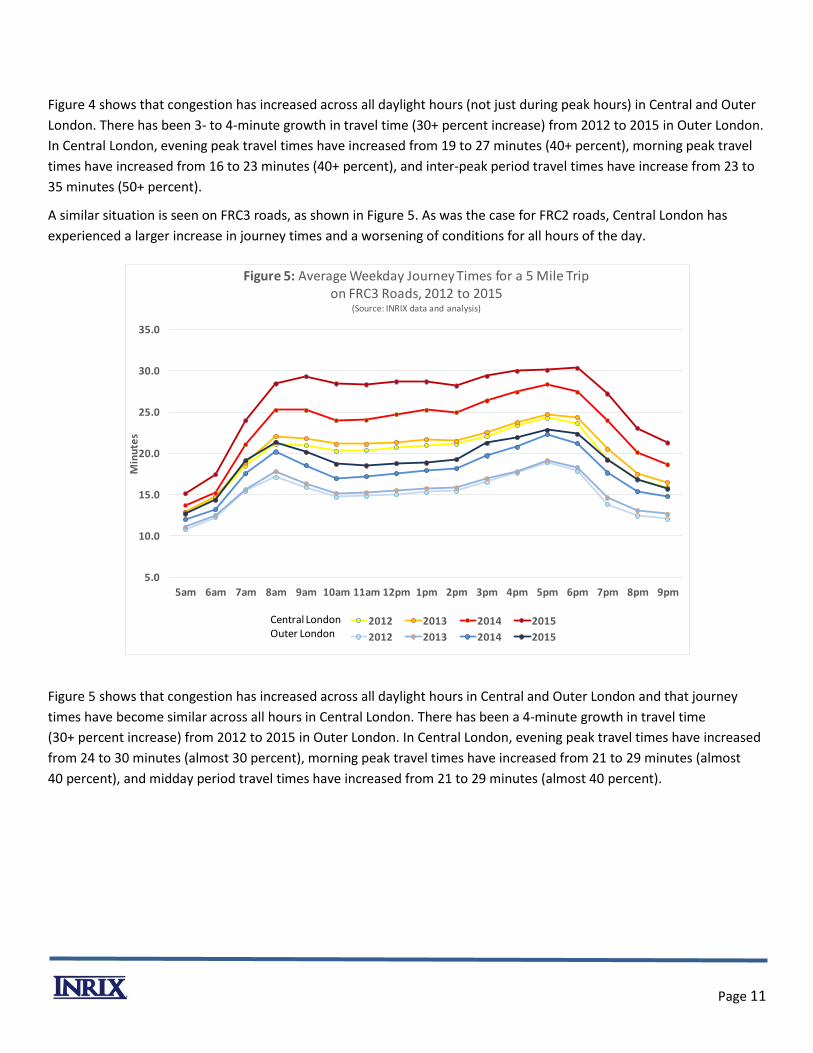
A similar situation is seen on FRC3 roads, as shown in Figure 5. As was the case for FRC2 roads, Central London has
experienced a larger increase in journey times and a worsening of conditions for all hours of the day.
Figure 5 shows that congestion has increased across all daylight hours in Central and Outer London and that journey
times have become similar across all hours in Central London. There has been a 4-minute growth in travel time
(30+ percent increase) from 2012 to 2015 in Outer London. In Central London, evening peak travel times have increased
from 24 to 30 minutes (almost 30 percent), morning peak travel times have increased from 21 to 29 minutes (almost
40 percent), and midday period travel times have increased from 21 to 29 minutes (almost 40 percent).
5.0
10.0
15.0
20.0
25.0
30.0
35.0
5am 6am 7am 8am 9am 10am 11am 12pm 1pm 2pm 3pm 4pm 5pm 6pm 7pm 8pm 9pm
Min
ute
s
Figure 5: Average Weekday Journey Times for a 5 Mile Trip on FRC3 Roads, 2012 to 2015
(Source: INRIX data and analysis)
2012 2013 2014 2015
2012 2013 2014 2015
Central LondonOuter London
Page 12
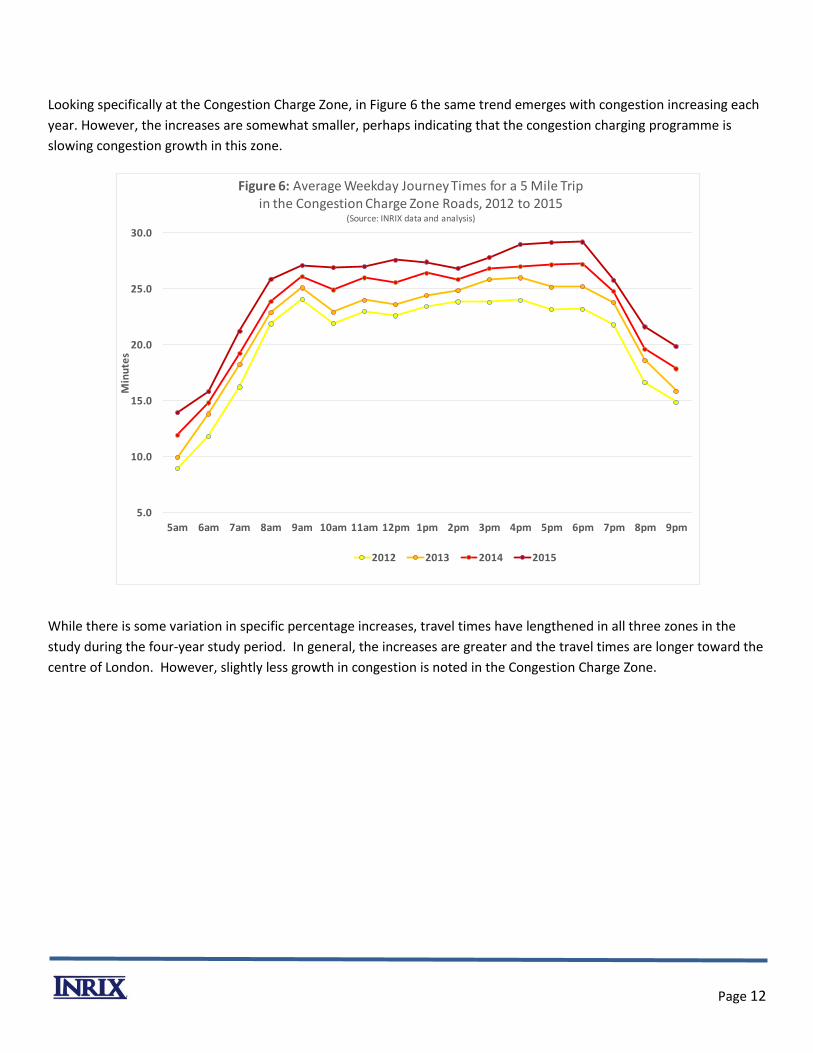
Looking specifically at the Congestion Charge Zone, in Figure 6 the same trend emerges with congestion increasing each
year. However, the increases are somewhat smaller, perhaps indicating that the congestion charging programme is
slowing congestion growth in this zone.
While there is some variation in specific percentage increases, travel times have lengthened in all three zones in the
study during the four-year study period. In general, the increases are greater and the travel times are longer toward the
centre of London. However, slightly less growth in congestion is noted in the Congestion Charge Zone.
5.0
10.0
15.0
20.0
25.0
30.0
5am 6am 7am 8am 9am 10am 11am 12pm 1pm 2pm 3pm 4pm 5pm 6pm 7pm 8pm 9pm
Min
ute
s
Figure 6: Average Weekday Journey Times for a 5 Mile Trip in the Congestion Charge Zone Roads, 2012 to 2015
(Source: INRIX data and analysis)
2012 2013 2014 2015
Page 13
SECTION 4: DRIVERS OF TRAVEL DEMAND KEY INDICATORS
In economic terms, transport is a derived demand. Few journeys are made through a desire to travel per se but are,
rather, a means to some other end. People travel to work or for other business reasons, to attend leisure activities, for
educational or health related activities, or to acquire goods and services required for day-to-day life. Travel demand
generally rises as the population increases or if an existing population has more time or money to pursue activities that
require travel. Economic improvements also give individuals more choice in transportation and may allow them to afford
travel by different modes of transport or to acquire and utilise private vehicles. Increased use of ecommerce increases
the trips made by delivery vehicles. This section describes the changes in primary travel demand drivers: economic
indicators and population changes.
Economic Indicators
With the United Kingdom and London economy recovering from the recession over the last several years, and with
higher employment levels and lower petrol prices, it should be expected that more people and goods are being moved
in London. London’s economy has grown faster than the United Kingdom’s—more than 3 percent annually since 2008,
compared to the United Kingdom rate of about 2 percent2. London employment exceeded 5.5 million jobs in 2014, 5
percent higher than in 2013 and 12 percent higher than the pre-recession peak in 2008. This growth means more
buildings are being constructed with more work-related trips, more goods and services are being delivered, and more
people are visiting shops and other retail outlets. The result is more individuals making more trips, and in the past, this
activity would have resulted in more cars, taxis and freight vehicles on the roads.
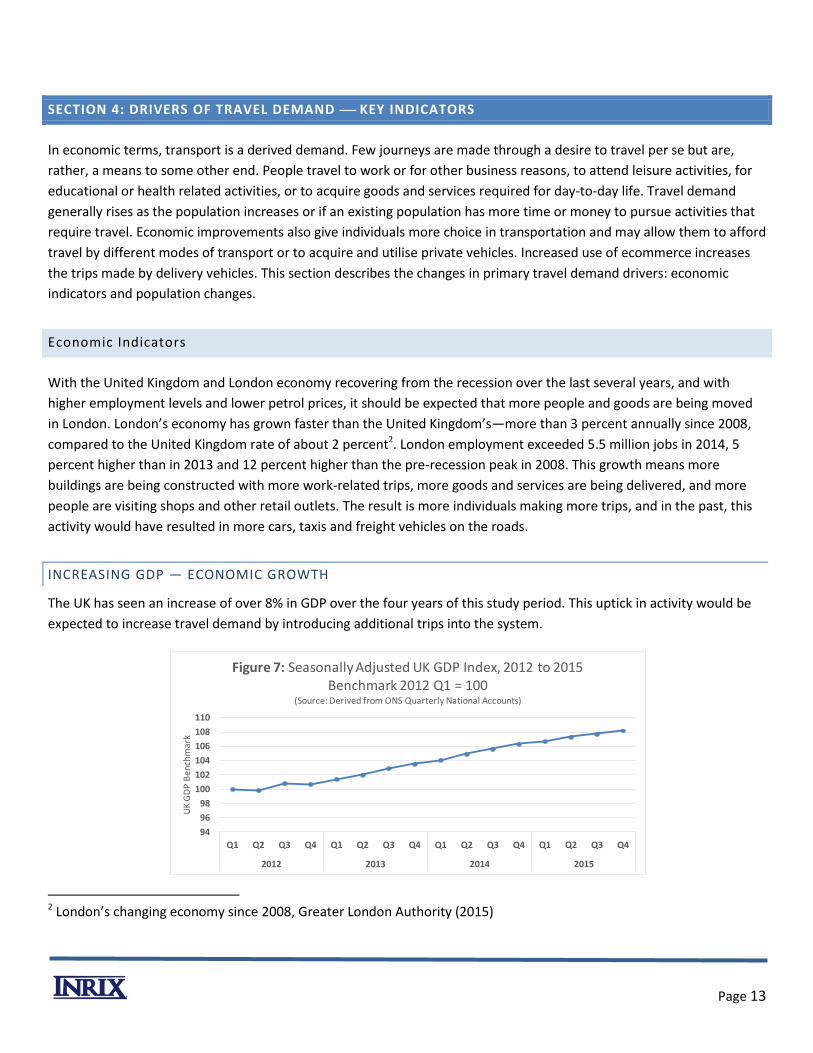
INCREASING GDP — ECONOMIC GROWTH
The UK has seen an increase of over 8% in GDP over the four years of this study period. This uptick in activity would be
expected to increase travel demand by introducing additional trips into the system.
2 London’s changing economy since 2008, Greater London Authority (2015)
94
96
98
100
102
104
106
108
110
Q1 Q2 Q3 Q4 Q1 Q2 Q3 Q4 Q1 Q2 Q3 Q4 Q1 Q2 Q3 Q4
2012 2013 2014 2015
UK
GD
P B
en
chm
ark
Figure 7: Seasonally Adjusted UK GDP Index, 2012 to 2015 Benchmark 2012 Q1 = 100
(Source: Derived from ONS Quarterly National Accounts)
Page 14
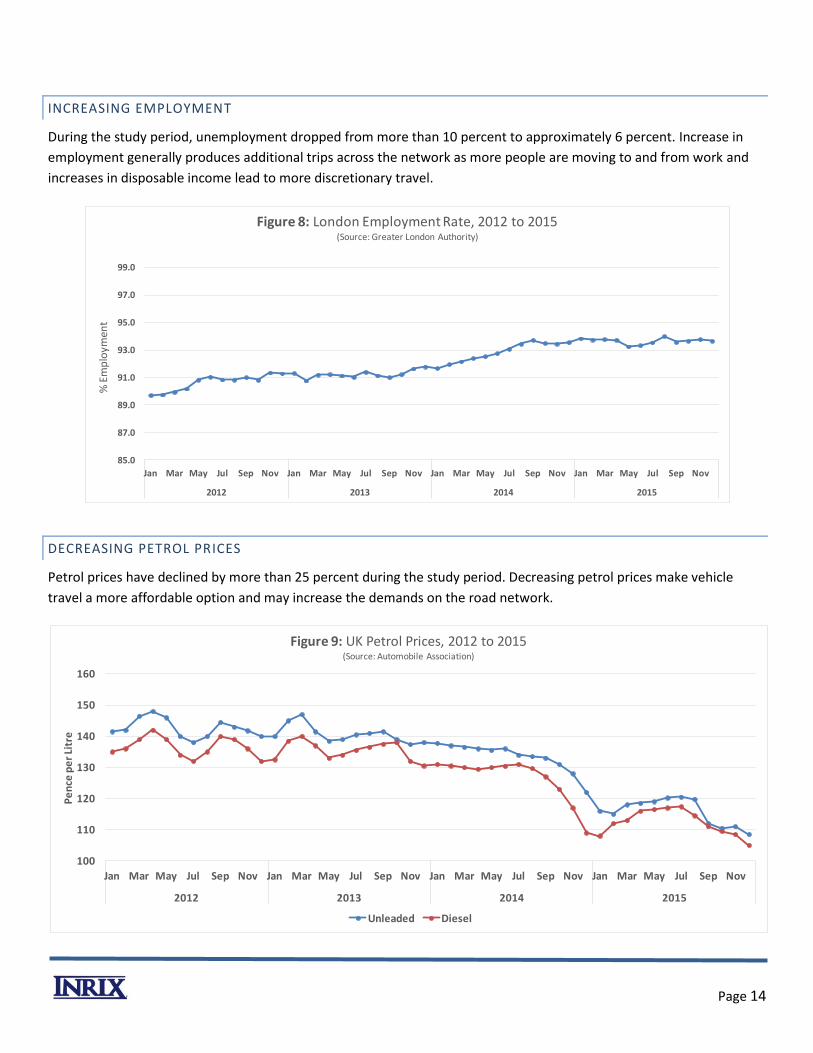
INCREASING EMPLOYMENT
During the study period, unemployment dropped from more than 10 percent to approximately 6 percent. Increase in
employment generally produces additional trips across the network as more people are moving to and from work and
increases in disposable income lead to more discretionary travel.
DECREASING PETROL PRICES
Petrol prices have declined by more than 25 percent during the study period. Decreasing petrol prices make vehicle
travel a more affordable option and may increase the demands on the road network.
85.0
87.0
89.0
91.0
93.0
95.0
97.0
99.0
Jan Mar May Jul Sep Nov Jan Mar May Jul Sep Nov Jan Mar May Jul Sep Nov Jan Mar May Jul Sep Nov
2012 2013 2014 2015
% E
mp
loym
ent
Figure 8: London Employment Rate, 2012 to 2015(Source: Greater London Authority)
100
110
120
130
140
150
160
Jan Mar May Jul Sep Nov Jan Mar May Jul Sep Nov Jan Mar May Jul Sep Nov Jan Mar May Jul Sep Nov
2012 2013 2014 2015
Pe
nce
pe
r Li
tre
Figure 9: UK Petrol Prices, 2012 to 2015(Source: Automobile Association)
Unleaded Diesel
Page 15
INCREASING ECOMMERCE
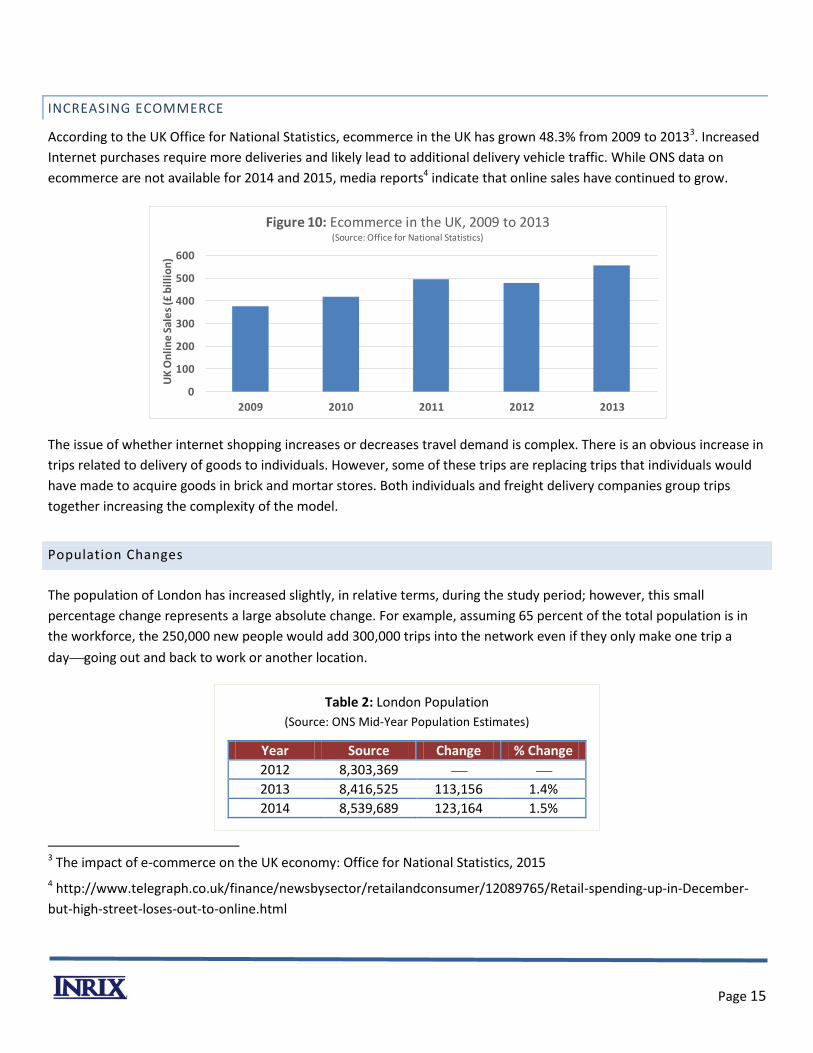
According to the UK Office for National Statistics, ecommerce in the UK has grown 48.3% from 2009 to 20133. Increased
Internet purchases require more deliveries and likely lead to additional delivery vehicle traffic. While ONS data on
ecommerce are not available for 2014 and 2015, media reports4 indicate that online sales have continued to grow.
The issue of whether internet shopping increases or decreases travel demand is complex. There is an obvious increase in
trips related to delivery of goods to individuals. However, some of these trips are replacing trips that individuals would
have made to acquire goods in brick and mortar stores. Both individuals and freight delivery companies group trips
together increasing the complexity of the model.
Population Changes
The population of London has increased slightly, in relative terms, during the study period; however, this small
percentage change represents a large absolute change. For example, assuming 65 percent of the total population is in
the workforce, the 250,000 new people would add 300,000 trips into the network even if they only make one trip a
daygoing out and back to work or another location.
Table 2: London Population
(Source: ONS Mid-Year Population Estimates)
Year Source Change % Change
2012 8,303,369
2013 8,416,525 113,156 1.4%
2014 8,539,689 123,164 1.5%
3 The impact of e-commerce on the UK economy: Office for National Statistics, 2015
4 http://www.telegraph.co.uk/finance/newsbysector/retailandconsumer/12089765/Retail-spending-up-in-December-
but-high-street-loses-out-to-online.html
0
100
200
300
400
500
600
2009 2010 2011 2012 2013
UK
On
lin
e S
ale
s (£
bil
lio
n)
Figure 10: Ecommerce in the UK, 2009 to 2013(Source: Office for National Statistics)
Page 16
SECTION 5: ACTUAL TRAVEL DEMAND VOLUME OBSERVATIONS
Section 4 considered various indicators of traffic demand and observed that they are all up; therefore, one would expect
traffic and congestion to also be on the rise in London. However, in order to complete the picture, it is also important to
analyse whether the increase in demand indicators actually led to increased traffic demand.
The best way to capture actual driving levels is with traffic counts and an assessment of vehicle miles travelled. This
section addresses these directly by analyzing DfT and TfL traffic counts from 2012 to 2015.
London Traffic Count Data
In contrast to what might be expected, based on several different sources of vehicle traffic data, the overall level of
traffic volume in Central London is slightly declining, whereas traffic volume in Outer London is slightly increasing during
the period of 2012 to 2015.
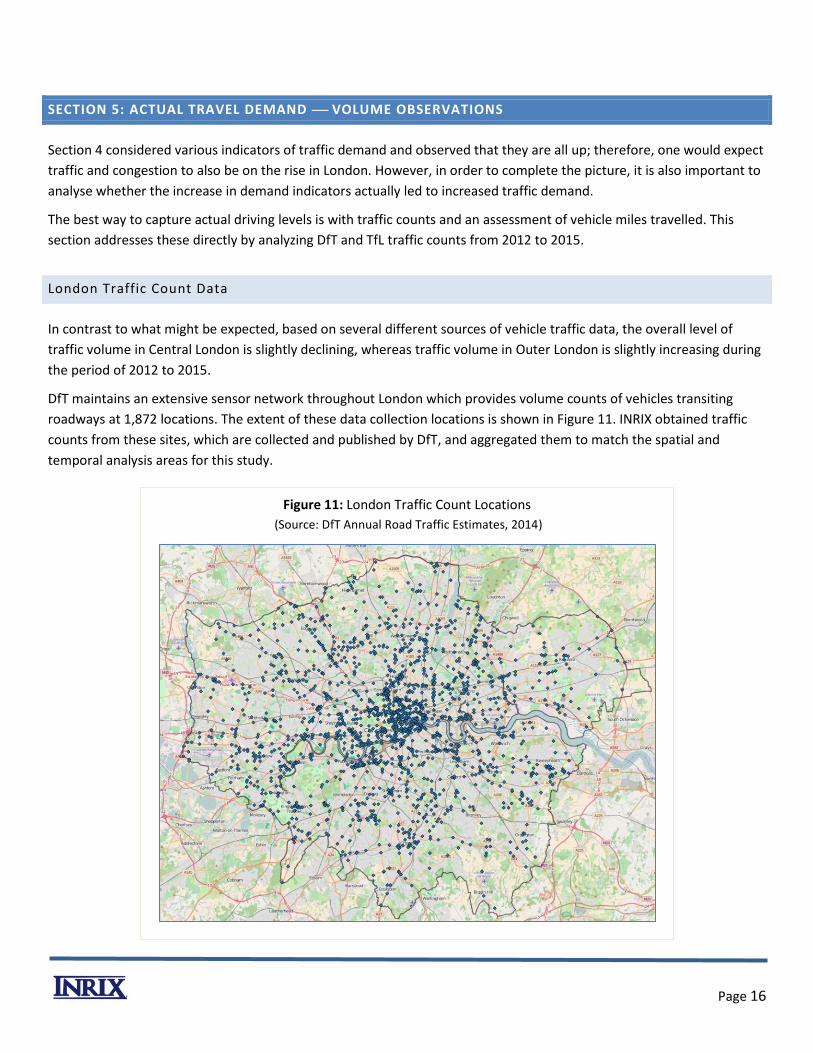
DfT maintains an extensive sensor network throughout London which provides volume counts of vehicles transiting
roadways at 1,872 locations. The extent of these data collection locations is shown in Figure 11. INRIX obtained traffic
counts from these sites, which are collected and published by DfT, and aggregated them to match the spatial and
temporal analysis areas for this study.
Figure 11: London Traffic Count Locations
(Source: DfT Annual Road Traffic Estimates, 2014)
Page 17
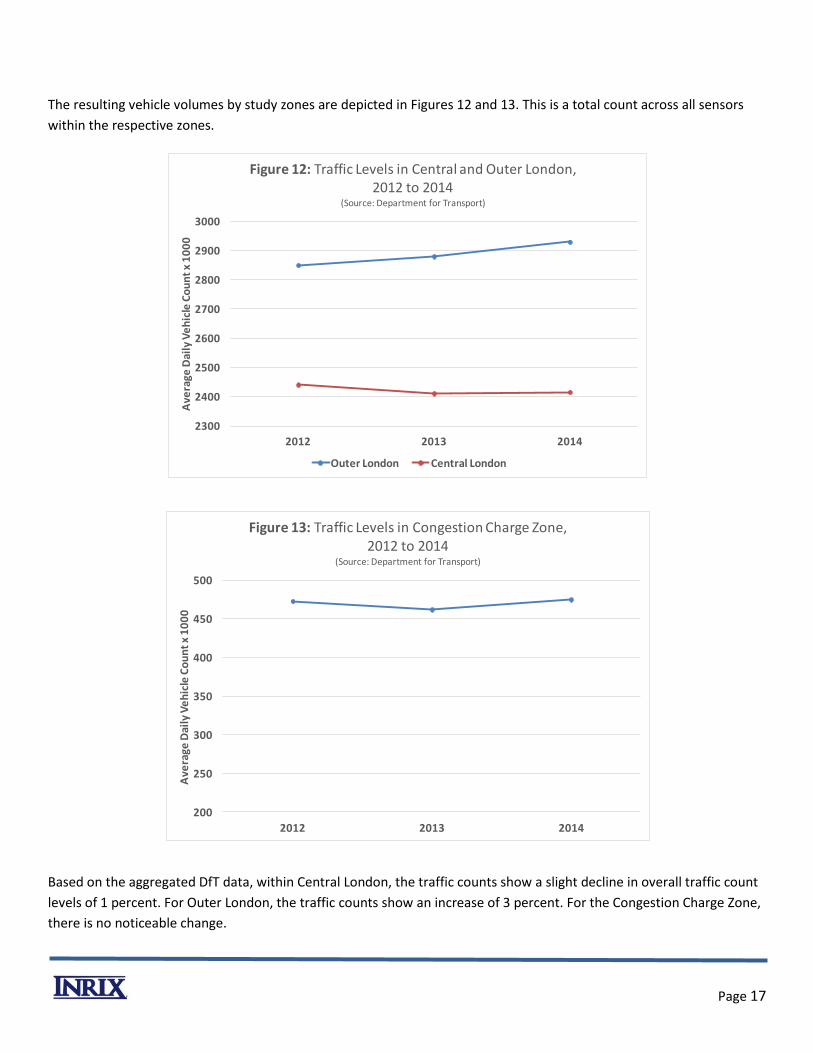
The resulting vehicle volumes by study zones are depicted in Figures 12 and 13. This is a total count across all sensors
within the respective zones.
Based on the aggregated DfT data, within Central London, the traffic counts show a slight decline in overall traffic count
levels of 1 percent. For Outer London, the traffic counts show an increase of 3 percent. For the Congestion Charge Zone,
there is no noticeable change.
2300
2400
2500
2600
2700
2800
2900
3000
2012 2013 2014
Ave
rage
Dai
ly V
eh
icle
Co
un
t x
10
00
Figure 12: Traffic Levels in Central and Outer London,2012 to 2014
(Source: Department for Transport)
Outer London Central London
200
250
300
350
400
450
500
2012 2013 2014
Ave
rage
Dai
ly V
eh
icle
Co
un
t x
10
00
Figure 13: Traffic Levels in Congestion Charge Zone,2012 to 2014
(Source: Department for Transport)
Page 18
Transport for London Traffic Volumes
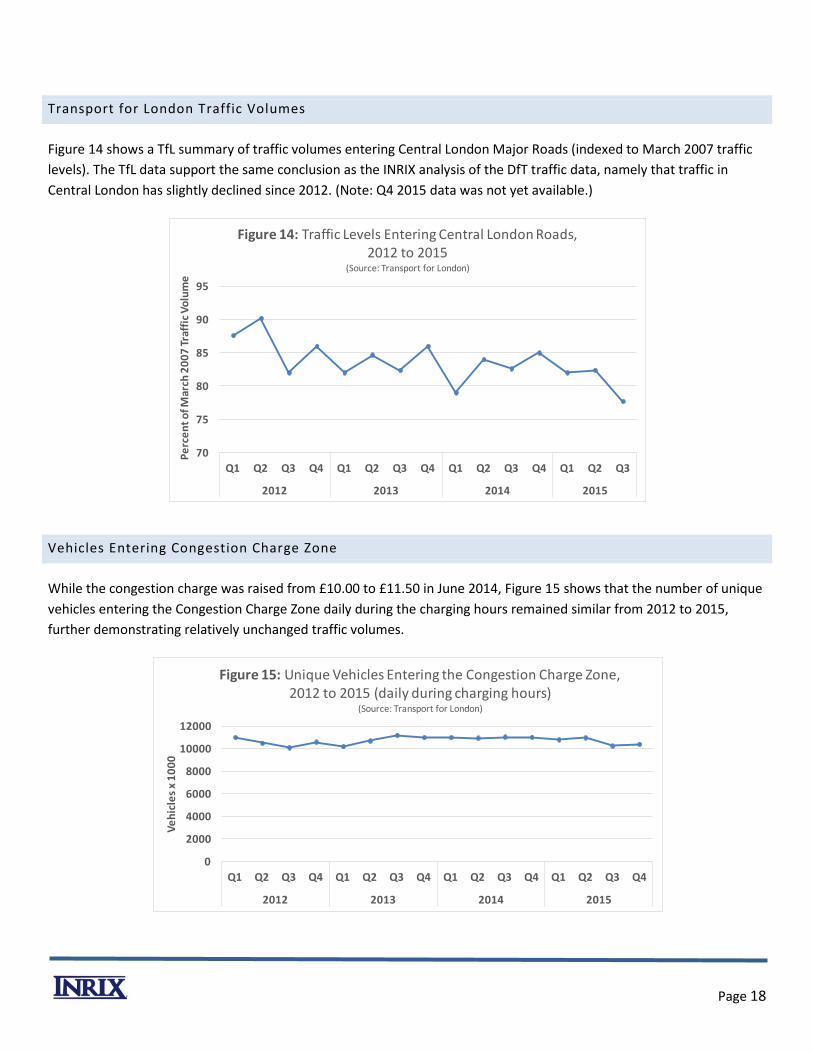
Figure 14 shows a TfL summary of traffic volumes entering Central London Major Roads (indexed to March 2007 traffic
levels). The TfL data support the same conclusion as the INRIX analysis of the DfT traffic data, namely that traffic in
Central London has slightly declined since 2012. (Note: Q4 2015 data was not yet available.)
Vehicles Entering Congestion Charge Zone
While the congestion charge was raised from £10.00 to £11.50 in June 2014, Figure 15 shows that the number of unique
vehicles entering the Congestion Charge Zone daily during the charging hours remained similar from 2012 to 2015,
further demonstrating relatively unchanged traffic volumes.
70
75
80
85
90
95
Q1 Q2 Q3 Q4 Q1 Q2 Q3 Q4 Q1 Q2 Q3 Q4 Q1 Q2 Q3
2012 2013 2014 2015
Pe
rce
nt
of M
arch
20
07
Tra
ffic
Vo
lum
e
Figure 14: Traffic Levels Entering Central London Roads,2012 to 2015
(Source: Transport for London)
0
2000
4000
6000
8000
10000
12000
Q1 Q2 Q3 Q4 Q1 Q2 Q3 Q4 Q1 Q2 Q3 Q4 Q1 Q2 Q3 Q4
2012 2013 2014 2015
Ve
hic
les
x 1
00
0
Figure 15: Unique Vehicles Entering the Congestion Charge Zone,2012 to 2015 (daily during charging hours)
(Source: Transport for London)
Page 19
SECTION 6: INFLUENCE OF MODE AND VEHICLE TYPE ON TRAVEL DEMAND
With the uptick in indicators that usually increase travel demand, and the flat to declining traffic volumes in Central
London, consideration of other modes of travel is relevant to understanding the overall congestion picture. The mixture
of vehicle types on the roadway is also evaluated for potential impact on travel demand.
Travel by Other Modes
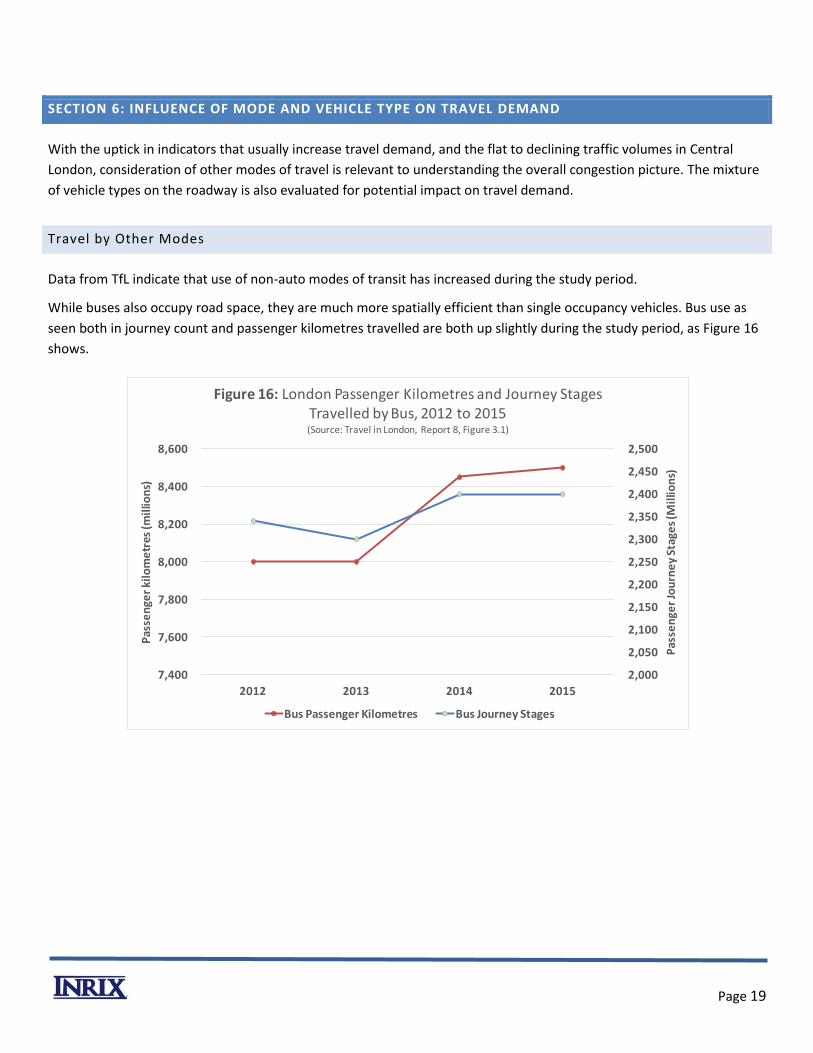
Data from TfL indicate that use of non-auto modes of transit has increased during the study period.
While buses also occupy road space, they are much more spatially efficient than single occupancy vehicles. Bus use as
seen both in journey count and passenger kilometres travelled are both up slightly during the study period, as Figure 16
shows.
2,000
2,050
2,100
2,150
2,200
2,250
2,300
2,350
2,400
2,450
2,500
7,400
7,600
7,800
8,000
8,200
8,400
8,600
2012 2013 2014 2015
Pas
sen
ger
Jou
rne
y St
age
s (M
illio
ns)
Pas
sen
ger
kilo
me
tres
(m
illio
ns)
Figure 16: London Passenger Kilometres and Journey Stages Travelled by Bus, 2012 to 2015(Source: Travel in London, Report 8, Figure 3.1)
Bus Passenger Kilometres Bus Journey Stages
Page 20
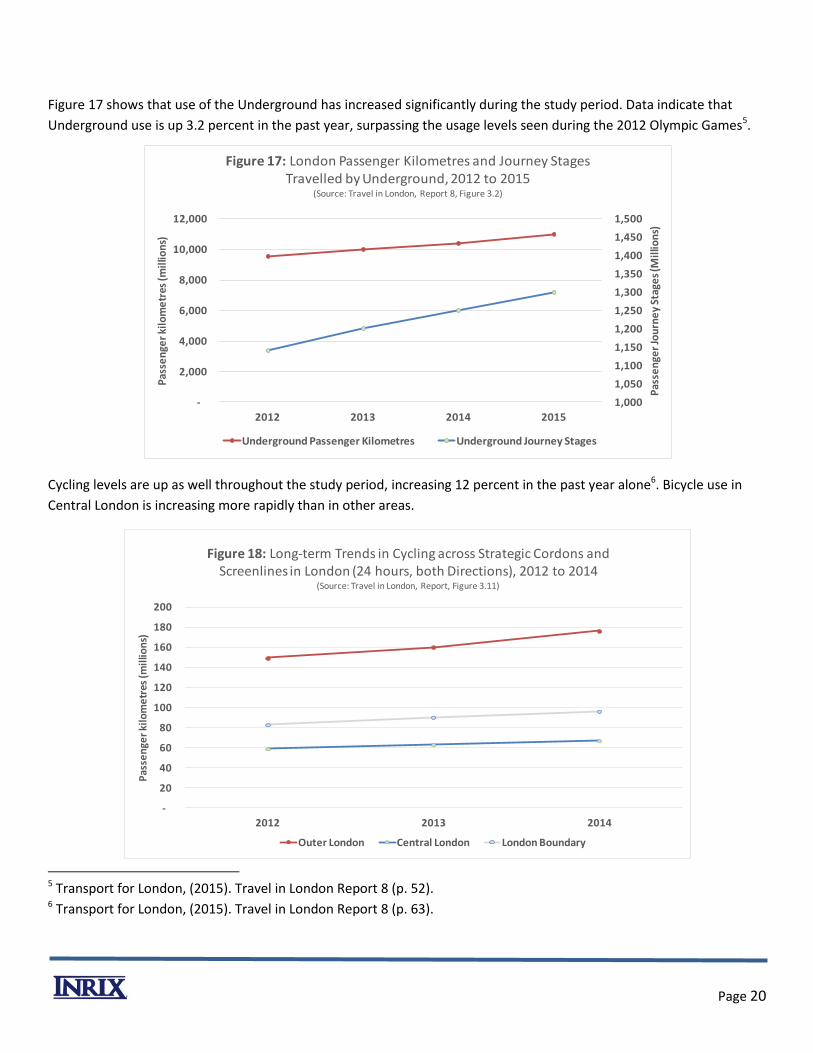
Figure 17 shows that use of the Underground has increased significantly during the study period. Data indicate that
Underground use is up 3.2 percent in the past year, surpassing the usage levels seen during the 2012 Olympic Games5.
Cycling levels are up as well throughout the study period, increasing 12 percent in the past year alone6. Bicycle use in
Central London is increasing more rapidly than in other areas.
5 Transport for London, (2015). Travel in London Report 8 (p. 52). 6 Transport for London, (2015). Travel in London Report 8 (p. 63).
1,000
1,050
1,100
1,150
1,200
1,250
1,300
1,350
1,400
1,450
1,500
-
2,000
4,000
6,000
8,000
10,000
12,000
2012 2013 2014 2015
Pas
sen
ger
Jou
rne
y St
age
s (M
illio
ns)
Pas
sen
ger
kilo
me
tres
(m
illio
ns)
Figure 17: London Passenger Kilometres and Journey Stages Travelled by Underground, 2012 to 2015
(Source: Travel in London, Report 8, Figure 3.2)
Underground Passenger Kilometres Underground Journey Stages
-
20
40
60
80
100
120
140
160
180
200
2012 2013 2014
Pas
sen
ger
kilo
me
tres
(m
illio
ns)
Figure 18: Long-term Trends in Cycling across Strategic Cordons and Screenlines in London (24 hours, both Directions), 2012 to 2014
(Source: Travel in London, Report, Figure 3.11)
Outer London Central London London Boundary
Page 21
Vehicle Type Trends
Changes in the mix of vehicle types on the roadways could impact congestion as cars and trucks utilise roadways
differently.
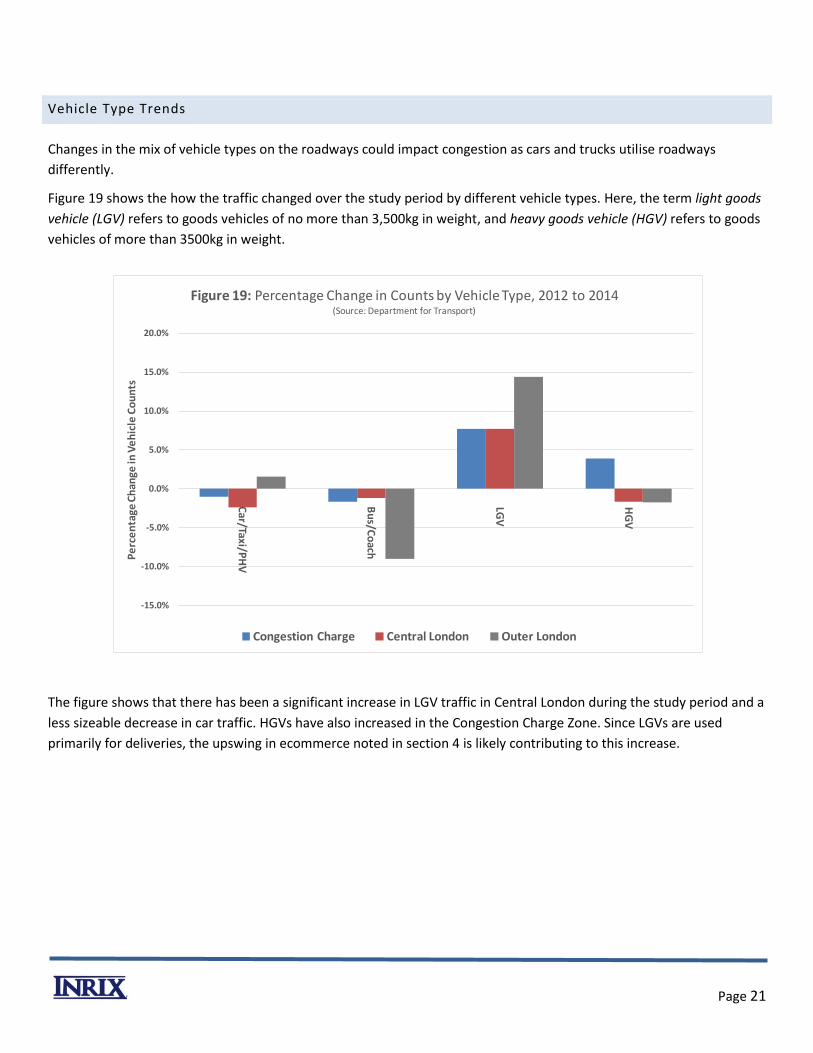
Figure 19 shows the how the traffic changed over the study period by different vehicle types. Here, the term light goods
vehicle (LGV) refers to goods vehicles of no more than 3,500kg in weight, and heavy goods vehicle (HGV) refers to goods
vehicles of more than 3500kg in weight.
The figure shows that there has been a significant increase in LGV traffic in Central London during the study period and a
less sizeable decrease in car traffic. HGVs have also increased in the Congestion Charge Zone. Since LGVs are used
primarily for deliveries, the upswing in ecommerce noted in section 4 is likely contributing to this increase.
-15.0%
-10.0%
-5.0%
0.0%
5.0%
10.0%
15.0%
20.0%
Car/Taxi/P
HV
Bu
s/Co
ach
LGV
HG
V
Pe
rce
nta
ge C
han
ge in
Ve
hic
le C
ou
nts
Figure 19: Percentage Change in Counts by Vehicle Type, 2012 to 2014(Source: Department for Transport)
Congestion Charge Central London Outer London
Page 22
Private Hire Vehicles Entering Congestion Charge Zone
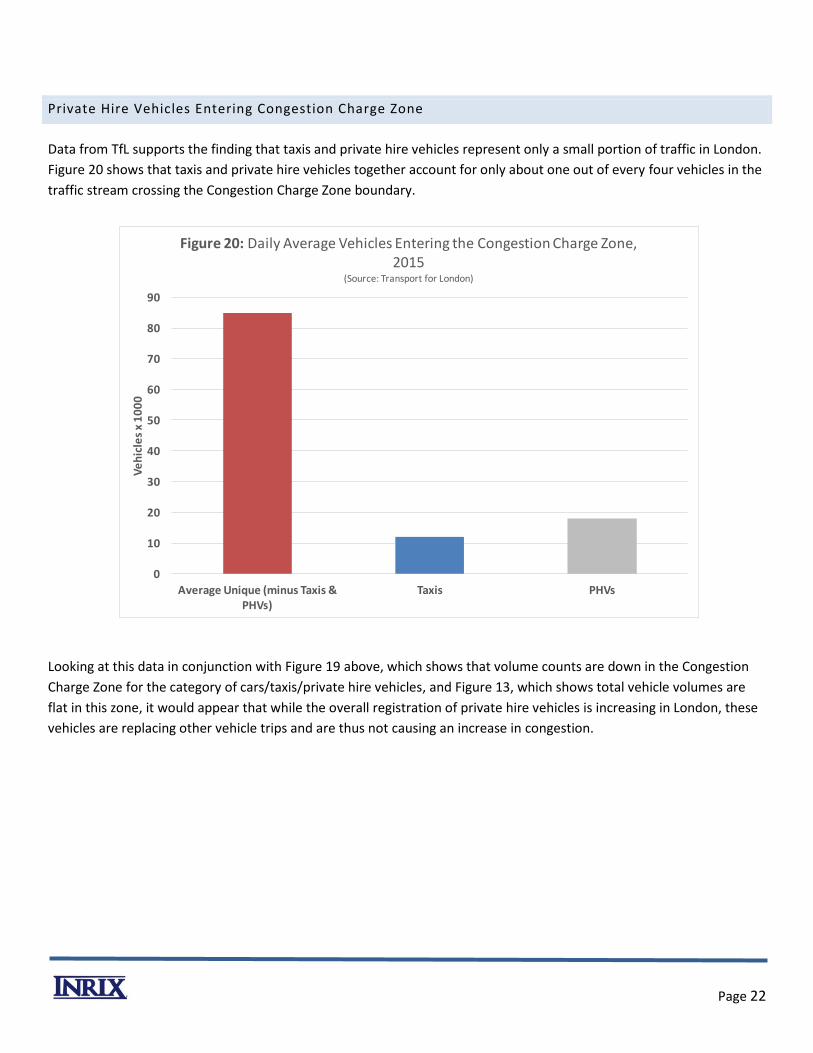
Data from TfL supports the finding that taxis and private hire vehicles represent only a small portion of traffic in London.
Figure 20 shows that taxis and private hire vehicles together account for only about one out of every four vehicles in the
traffic stream crossing the Congestion Charge Zone boundary.
Looking at this data in conjunction with Figure 19 above, which shows that volume counts are down in the Congestion
Charge Zone for the category of cars/taxis/private hire vehicles, and Figure 13, which shows total vehicle volumes are
flat in this zone, it would appear that while the overall registration of private hire vehicles is increasing in London, these
vehicles are replacing other vehicle trips and are thus not causing an increase in congestion.
0
10
20
30
40
50
60
70
80
90
Average Unique (minus Taxis & PHVs)
Taxis PHVs
Ve
hic
les
x 1
00
0
Figure 20: Daily Average Vehicles Entering the Congestion Charge Zone, 2015
(Source: Transport for London)
Page 23
SECTION 7: PRIVATE HIRE VEHICLES IMPACT ON CONGESTION
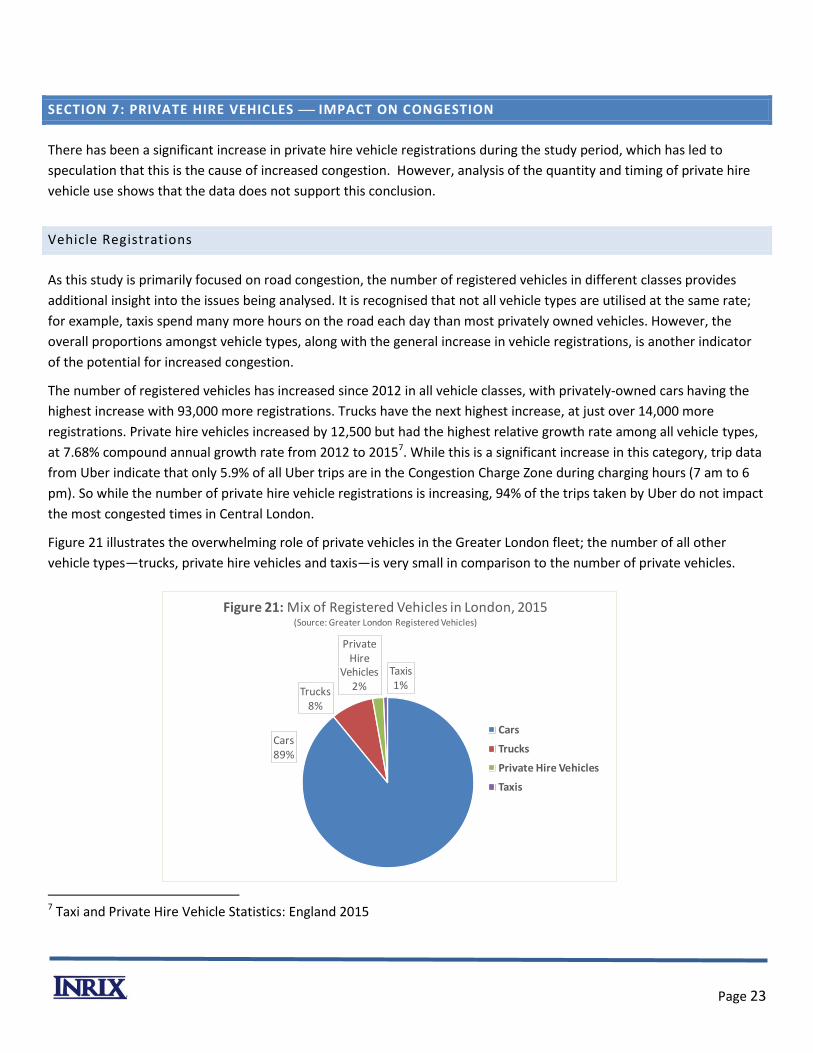
There has been a significant increase in private hire vehicle registrations during the study period, which has led to
speculation that this is the cause of increased congestion. However, analysis of the quantity and timing of private hire
vehicle use shows that the data does not support this conclusion.
Vehicle Registrations
As this study is primarily focused on road congestion, the number of registered vehicles in different classes provides
additional insight into the issues being analysed. It is recognised that not all vehicle types are utilised at the same rate;
for example, taxis spend many more hours on the road each day than most privately owned vehicles. However, the
overall proportions amongst vehicle types, along with the general increase in vehicle registrations, is another indicator
of the potential for increased congestion.
The number of registered vehicles has increased since 2012 in all vehicle classes, with privately-owned cars having the
highest increase with 93,000 more registrations. Trucks have the next highest increase, at just over 14,000 more
registrations. Private hire vehicles increased by 12,500 but had the highest relative growth rate among all vehicle types,
at 7.68% compound annual growth rate from 2012 to 20157. While this is a significant increase in this category, trip data
from Uber indicate that only 5.9% of all Uber trips are in the Congestion Charge Zone during charging hours (7 am to 6
pm). So while the number of private hire vehicle registrations is increasing, 94% of the trips taken by Uber do not impact
the most congested times in Central London.
Figure 21 illustrates the overwhelming role of private vehicles in the Greater London fleet; the number of all other
vehicle types—trucks, private hire vehicles and taxis—is very small in comparison to the number of private vehicles.
7 Taxi and Private Hire Vehicle Statistics: England 2015
Cars89%
Trucks8%
PrivateHire
Vehicles2%
Taxis1%
Figure 21: Mix of Registered Vehicles in London, 2015(Source: Greater London Registered Vehicles)
Cars
Trucks
Private Hire Vehicles
Taxis
Page 24
INRIX Private Hire Vehicle Analysis
In order to assess the actual contribution of private hire vehicles to overall London congestion, INRIX obtained data from
Uber related to total trips by time of day and location to further analyse possible impact. Since the overall numbers of
cars in the Congestion Charge Zone is flat or decreasing, the only way private hire vehicles could be significantly
impacting congestion in this area would be if the PHV trips were disproportionately occurring during the most congested
periods of the day.
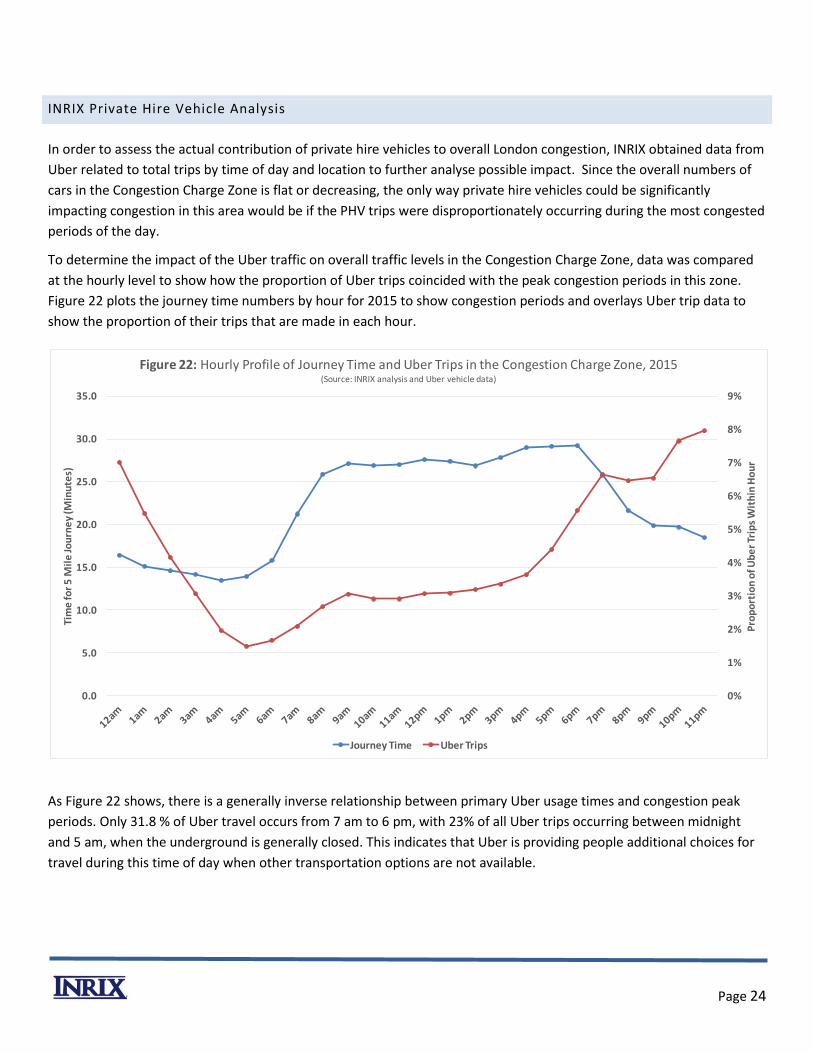
To determine the impact of the Uber traffic on overall traffic levels in the Congestion Charge Zone, data was compared
at the hourly level to show how the proportion of Uber trips coincided with the peak congestion periods in this zone.
Figure 22 plots the journey time numbers by hour for 2015 to show congestion periods and overlays Uber trip data to
show the proportion of their trips that are made in each hour.
As Figure 22 shows, there is a generally inverse relationship between primary Uber usage times and congestion peak
periods. Only 31.8 % of Uber travel occurs from 7 am to 6 pm, with 23% of all Uber trips occurring between midnight
and 5 am, when the underground is generally closed. This indicates that Uber is providing people additional choices for
travel during this time of day when other transportation options are not available.
0%
1%
2%
3%
4%
5%
6%
7%
8%
9%
0.0
5.0
10.0
15.0
20.0
25.0
30.0
35.0
Pro
po
rtio
n o
f Ub
er
Trip
s W
ith
in H
ou
r
Tim
e fo
r 5
Mil
e Jo
urn
ey
(Min
ute
s)
Figure 22: Hourly Profile of Journey Time and Uber Trips in the Congestion Charge Zone, 2015(Source: INRIX analysis and Uber vehicle data)
Journey Time Uber Trips
Page 25
SECTION 8: TRAVEL SUPPLY PLANNED AND UNPLANNED DISRUPTIONS
While increased reliance on public transport may explain the flat line traffic volume numbers in light of increased
economic activity, it does not assist in explaining the increasing congestion in London. The other variable in the
congestion equation is the supply of roadway.
Several roadway improvement projects that are components of the £4 billion Road Modernization Plan (2014 to 2022)
will transform junctions, bridges, tunnels and public spaces. These infrastructure improvements are expected to deliver
significant long-term benefits to the city. However, the Cycle Superhighways as well as the Crossrail project have caused
construction on key roads in London.8 It is typical for a road improvement programme of this magnitude to create short-
term disruption of travel during the construction period.
Both TfL and INRIX data clearly point to a sharp increase in traffic disruptions in 2014 and 2015, and in particular,
planned traffic disruptions like roadworks. This correlates strongly with increased congestion that is observed during this
time period.
Disruptions by Time
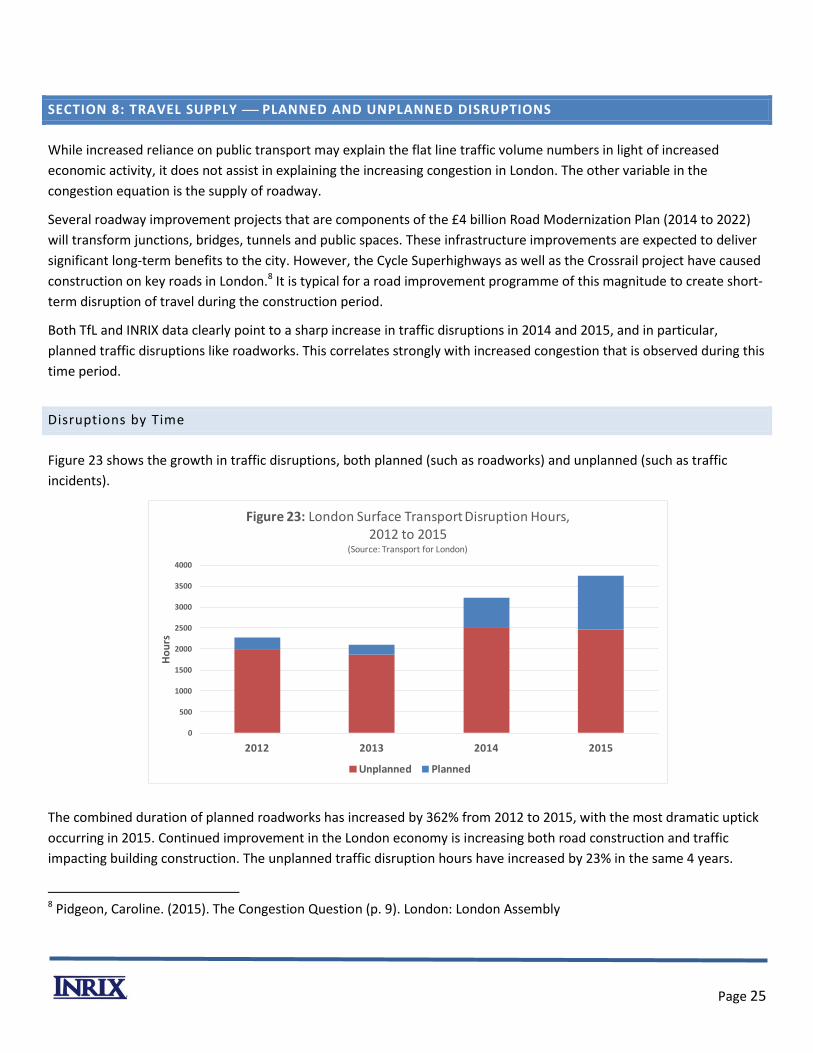
Figure 23 shows the growth in traffic disruptions, both planned (such as roadworks) and unplanned (such as traffic
incidents).
The combined duration of planned roadworks has increased by 362% from 2012 to 2015, with the most dramatic uptick
occurring in 2015. Continued improvement in the London economy is increasing both road construction and traffic
impacting building construction. The unplanned traffic disruption hours have increased by 23% in the same 4 years.
8 Pidgeon, Caroline. (2015). The Congestion Question (p. 9). London: London Assembly
0
500
1000
1500
2000
2500
3000
3500
4000
2012 2013 2014 2015
Ho
urs
Figure 23: London Surface Transport Disruption Hours, 2012 to 2015
(Source: Transport for London)
Unplanned Planned
Page 26
Unplanned Disruptions
In order to evaluate this variable, INRIX analysed its historical archive of incident data (both planned roadworks and
unplanned incidents such as accidents). INRIX employs a team of 70 staff dedicated to collating traffic incident data and
publishing it to its numerous media partners worldwide. This archive, combined with data from TfL, was investigated to
determine if these factors might provide additional insights. Unlike congestion, which can be directly measured,
incidents are only recorded if reported. Therefore, for unplanned incidents, changes in rate of reporting may also impact
trends.
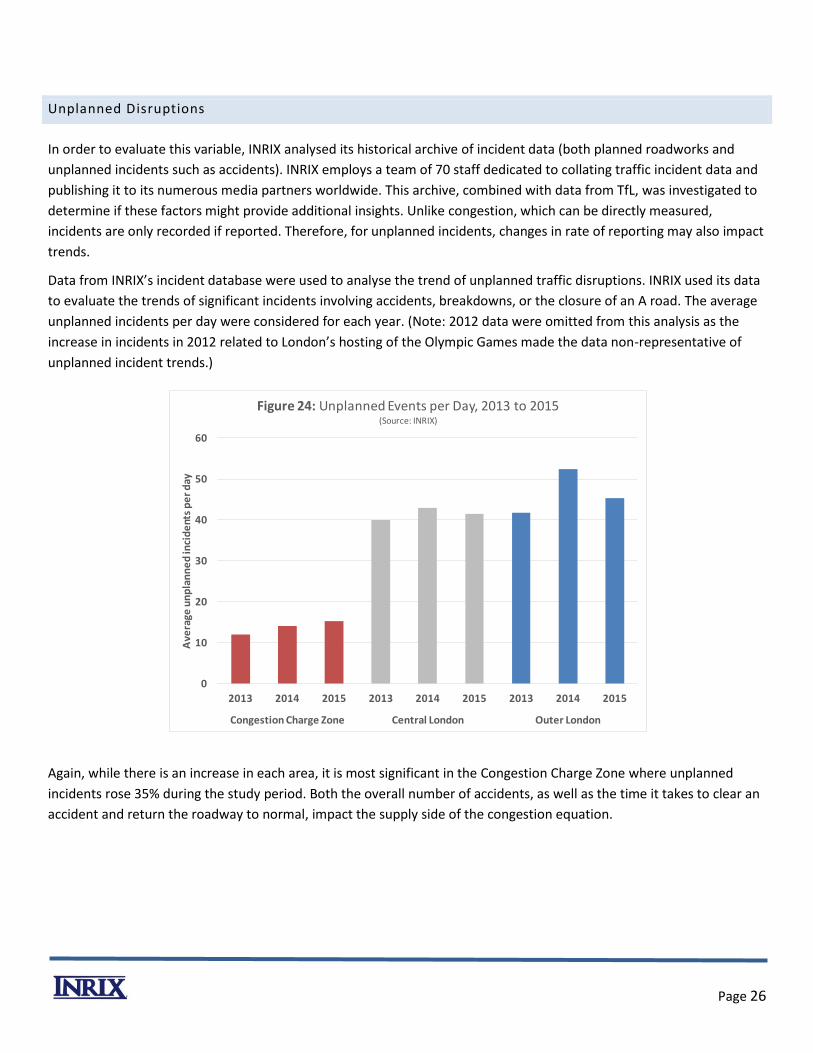
Data from INRIX’s incident database were used to analyse the trend of unplanned traffic disruptions. INRIX used its data
to evaluate the trends of significant incidents involving accidents, breakdowns, or the closure of an A road. The average
unplanned incidents per day were considered for each year. (Note: 2012 data were omitted from this analysis as the
increase in incidents in 2012 related to London’s hosting of the Olympic Games made the data non-representative of
unplanned incident trends.)
Again, while there is an increase in each area, it is most significant in the Congestion Charge Zone where unplanned
incidents rose 35% during the study period. Both the overall number of accidents, as well as the time it takes to clear an
accident and return the roadway to normal, impact the supply side of the congestion equation.
0
10
20
30
40
50
60
2013 2014 2015 2013 2014 2015 2013 2014 2015
Congestion Charge Zone Central London Outer London
Ave
rage
un
pla
nn
ed
inci
de
nts
pe
r d
ay
Figure 24: Unplanned Events per Day, 2013 to 2015(Source: INRIX)
Page 27
SECTION 9: SUMMARY AND CONCLUSION
Multiple data sources confirm what most people intuitively feel: congestion is getting worse every year in London. With
a growing economy and increased population, this is expected. While it has been posited that private hire vehicles are a
primary cause of increased congestion, the data do not support this conclusion.
Considering each component of travel in turn has enabled a clearer picture of the sources of London’s congestion to
emerge. The flat line traffic volumes indicate that the cause of increased congestion is not more vehicles on the
roadways, and in fact car traffic (including taxis and private hire vehicles) are decreasing in Central London. Exploring
other variables reveals that the use of public transport and cycling is up, which may be what is absorbing new travel
demand caused by economic prosperity. In the Congestion Charge Zone, car traffic has decreased while light goods
vehicles, generally used for deliveries, have increased. This is consistent with the uptick in ecommerce seen in the UK.
The remaining factor in the equation is supply, and data indicate that roadworks and incidents related to accidents are
the largest factor contributing to increased congestion in London.
Key Conclusions
Congestion in London has risen noticeably between the years of 2012 and 2015 with journey times in Central
London increasing by 12% annually.
Car traffic, including taxis and private hire vehicles (PHVs), is decreasing in Central London and the Congestion
Charge Zone (CCZ); thus, as a category, cars are not causing an increase in congestion in these area
Roadway travel demand, as seen in vehicle counts, is flat or decreasing in Central London and increasing only
slightly in Outer London; increased use of alternate modes of transit may explain why roadway traffic volumes
remain flat.
Truck (LGV) traffic is increasing in Central London, possibly related to the rise in ecommerce. This is the only
vehicle type to show more roadway volume in all three zones of London.
One of the most significant drivers of increased congestion in London is roadworks, increasing 362% during the
study period.