Embed Size (px)
Citation preview

London Borough of
Redbridge Borough
Profile
(November 2015)

London Borough of Redbridge Borough Profile
2

London Borough of Redbridge Borough Profile
3
Table of Contents
Executive Summary
1 Introduction
1.1 What are we trying to achieve
2 Redbridge Borough Context
2.1 Physical Characteristics of the Borough
Important Open Space:
Recreation
3 Population
3.1 The Current Situation
Population Density
Age Structure
Gender Split
Ethnic/ Faith group
Ethnicity
White
British Asian or Asian: Indian
British Asian or Asian: Pakistani:
3.2 Future Change and Policy Implications
4 Housing
4.1 The Current Situation
Analysis of the Housing stock
Type of Ownership
Temporary Accommodation and Gypsies and Travellers Sites
Household Composition
4.2 Future Change and Policy Review
London Borough of Redbridge Borough Profile
4
Housing Completions
5 Health and Wellbeing
5.1 The Current Situation
Life Expectancy
Major Diseases Causing Premature Death
Cardiovascular disease
Cancer
Preventative Measures
Screening
Immunisation
Lifestyle Related Risk Factors
Obesity
Smoking
Alcohol
Environmental Factors: Air Quality
5.2 Future Change
Delivering Healthy Outcomes
5.3 Policy Review
6 Economy
6.1 Borough Overview
6.2 Retail in Redbridge
7 Education
7.1 The Current Situation
8 Environment and Transportation
8.1 Environment - The Current Situation
Carbon Emissions

London Borough of Redbridge Borough Profile
5
Minerals
8.2 Transportation - The Current Situation
8.3 Future Change
9 Crime
9.1 The Current Situation
10 Summary
10.1 Overview
Borough Context
10.2 Population
Housing
Economy
Education
Environment and Transport
Crime
London Borough of Redbridge Borough Profile
6
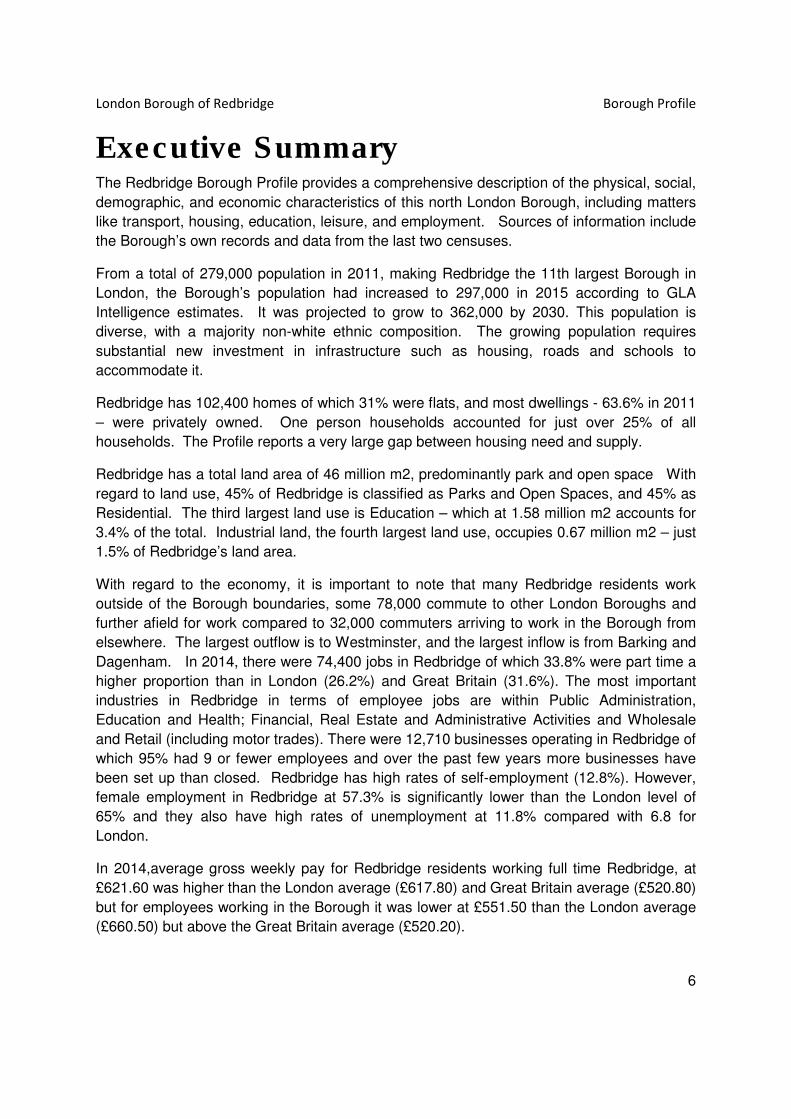
Executive Summary The Redbridge Borough Profile provides a comprehensive description of the physical, social,
demographic, and economic characteristics of this north London Borough, including matters
like transport, housing, education, leisure, and employment. Sources of information include
the Borough’s own records and data from the last two censuses.
From a total of 279,000 population in 2011, making Redbridge the 11th largest Borough in
London, the Borough’s population had increased to 297,000 in 2015 according to GLA
Intelligence estimates. It was projected to grow to 362,000 by 2030. This population is
diverse, with a majority non-white ethnic composition. The growing population requires
substantial new investment in infrastructure such as housing, roads and schools to
accommodate it.
Redbridge has 102,400 homes of which 31% were flats, and most dwellings - 63.6% in 2011
– were privately owned. One person households accounted for just over 25% of all
households. The Profile reports a very large gap between housing need and supply.
Redbridge has a total land area of 46 million m2, predominantly park and open space With
regard to land use, 45% of Redbridge is classified as Parks and Open Spaces, and 45% as
Residential. The third largest land use is Education – which at 1.58 million m2 accounts for
3.4% of the total. Industrial land, the fourth largest land use, occupies 0.67 million m2 – just
1.5% of Redbridge’s land area.
With regard to the economy, it is important to note that many Redbridge residents work
outside of the Borough boundaries, some 78,000 commute to other London Boroughs and
further afield for work compared to 32,000 commuters arriving to work in the Borough from
elsewhere. The largest outflow is to Westminster, and the largest inflow is from Barking and
Dagenham. In 2014, there were 74,400 jobs in Redbridge of which 33.8% were part time a
higher proportion than in London (26.2%) and Great Britain (31.6%). The most important
industries in Redbridge in terms of employee jobs are within Public Administration,
Education and Health; Financial, Real Estate and Administrative Activities and Wholesale
and Retail (including motor trades). There were 12,710 businesses operating in Redbridge of
which 95% had 9 or fewer employees and over the past few years more businesses have
been set up than closed. Redbridge has high rates of self-employment (12.8%). However,
female employment in Redbridge at 57.3% is significantly lower than the London level of
65% and they also have high rates of unemployment at 11.8% compared with 6.8 for
London.
In 2014,average gross weekly pay for Redbridge residents working full time Redbridge, at
£621.60 was higher than the London average (£617.80) and Great Britain average (£520.80)
but for employees working in the Borough it was lower at £551.50 than the London average
(£660.50) but above the Great Britain average (£520.20).

London Borough of Redbridge Borough Profile
7
For education, Redbridge has 98 schools including 54 state primary and 18 state secondary.
Attending these were 50,900 pupils, with only 4,200 attending private schools. Given the
large number of new residents expected over the period 2015-20 (65,000) it is projected that
15,700 new places will be required. Further information is provided for childrens’ centres
and childcare places, as well as the languages spoken by residents aged 3 and over.
The broad picture for Redbridge with regard to health is quite good, with life expectancy
higher than the London and national averages. There are however pockets with poorer
health and disability problems like Clayhall and Loxford and life expectancy is 5.7 years
lower for men in the most deprived areas of Redbridge than in the least deprived areas and
the difference for women is 2.1 years.
With regard to transport a number of figures in the report show the main transport networks
in the Borough, plus public transport accessibility, and deficiency, in different areas. Ilford is
confirmed as the busiest station with 7.6 million entries and exits, up 11% on the previous
year. Possible improvements are listed.
A short section at the end of the report deals with crime. The annual crime count has been
declining in recent years from 22,424 in 2012/13 to 20,123 in 2014/15. Redbridge has been
successful in exceeding targets set for reducing crimes included in the Mayor of London’s
Police and Crime Plan which have a high impact on victims including burglary, criminal
damage, robbery and thefts. However, numbers of crimes involving violence with injury have
increased in Redbridge from 1,549 reported crimes in March 2012 to 1,976 in the latest year.
London Borough of Redbridge Borough Profile
8
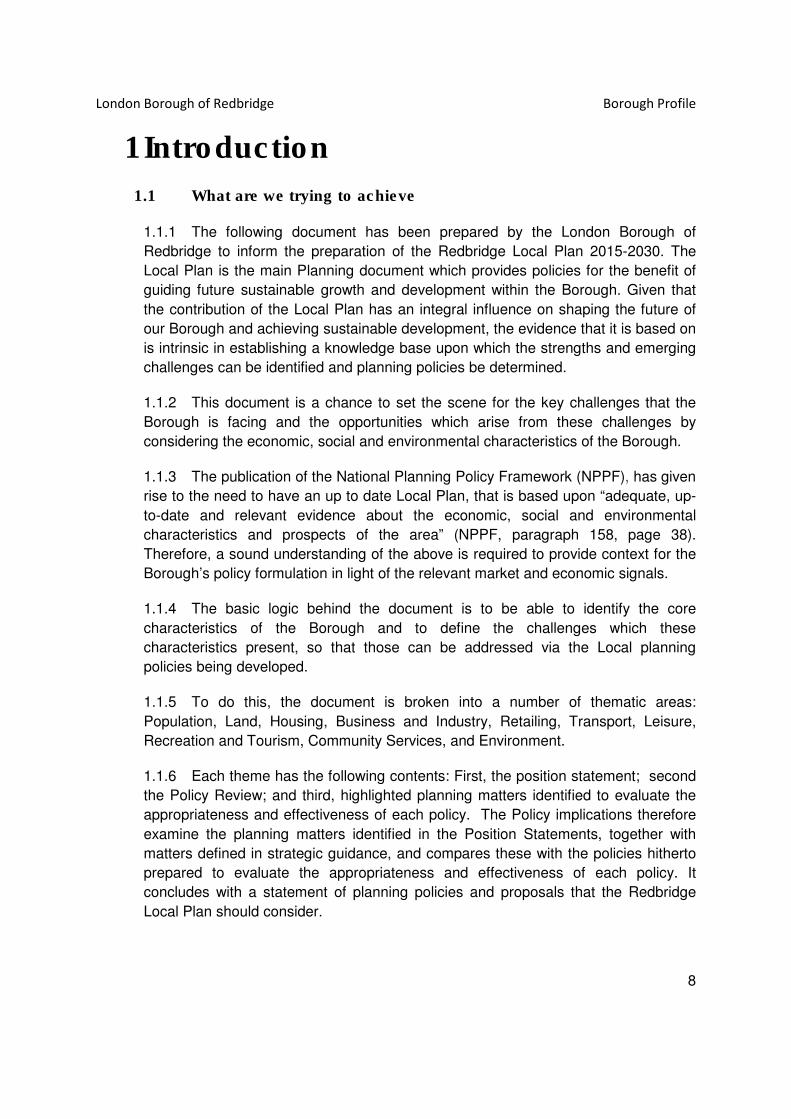
1 Introduction
1.1 What are we trying to achieve
1.1.1 The following document has been prepared by the London Borough of
Redbridge to inform the preparation of the Redbridge Local Plan 2015-2030. The
Local Plan is the main Planning document which provides policies for the benefit of
guiding future sustainable growth and development within the Borough. Given that
the contribution of the Local Plan has an integral influence on shaping the future of
our Borough and achieving sustainable development, the evidence that it is based on
is intrinsic in establishing a knowledge base upon which the strengths and emerging
challenges can be identified and planning policies be determined.
1.1.2 This document is a chance to set the scene for the key challenges that the
Borough is facing and the opportunities which arise from these challenges by
considering the economic, social and environmental characteristics of the Borough.
1.1.3 The publication of the National Planning Policy Framework (NPPF), has given
rise to the need to have an up to date Local Plan, that is based upon “adequate, up-
to-date and relevant evidence about the economic, social and environmental
characteristics and prospects of the area” (NPPF, paragraph 158, page 38).
Therefore, a sound understanding of the above is required to provide context for the
Borough’s policy formulation in light of the relevant market and economic signals.
1.1.4 The basic logic behind the document is to be able to identify the core
characteristics of the Borough and to define the challenges which these
characteristics present, so that those can be addressed via the Local planning
policies being developed.
1.1.5 To do this, the document is broken into a number of thematic areas:
Population, Land, Housing, Business and Industry, Retailing, Transport, Leisure,
Recreation and Tourism, Community Services, and Environment.
1.1.6 Each theme has the following contents: First, the position statement; second
the Policy Review; and third, highlighted planning matters identified to evaluate the
appropriateness and effectiveness of each policy. The Policy implications therefore
examine the planning matters identified in the Position Statements, together with
matters defined in strategic guidance, and compares these with the policies hitherto
prepared to evaluate the appropriateness and effectiveness of each policy. It
concludes with a statement of planning policies and proposals that the Redbridge
Local Plan should consider.
London Borough of Redbridge Borough Profile
9
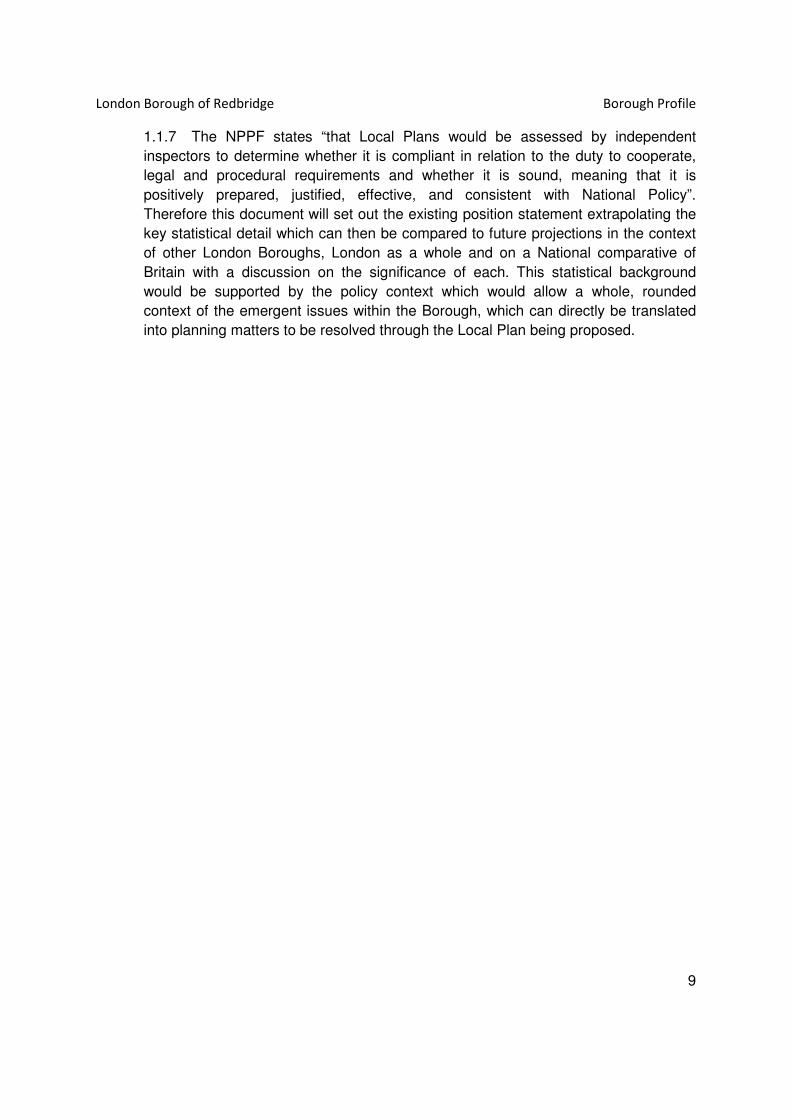
1.1.7 The NPPF states “that Local Plans would be assessed by independent
inspectors to determine whether it is compliant in relation to the duty to cooperate,
legal and procedural requirements and whether it is sound, meaning that it is
positively prepared, justified, effective, and consistent with National Policy”.
Therefore this document will set out the existing position statement extrapolating the
key statistical detail which can then be compared to future projections in the context
of other London Boroughs, London as a whole and on a National comparative of
Britain with a discussion on the significance of each. This statistical background
would be supported by the policy context which would allow a whole, rounded
context of the emergent issues within the Borough, which can directly be translated
into planning matters to be resolved through the Local Plan being proposed.

London Borough of Redbridge Borough Profile
10
2 Redbridge Borough Context
2.1 Physical Characteristics of the Borough
2.1.1 A narrative for the existing situation of London Borough of Redbridge, 1 of the
33 London Boroughs, which is situated to the north east of London within the south-
eastern region of the UK. The document aims to highlight the most important
planning, matters to be resolved through the emerging Local Plan. The area
concerned is the London Borough of Redbridge located on the south-east region of
England, and to the north-eastern part of London, bordering Essex and is shown in
context in Figure 2.1.
Figure 2.1 London Borough of Redbridge Characterisation Study, the Borough in its Context

London Borough of Redbridge Borough Profile
11
© Crown copyright and database rights 2015 Ordnance Survey. LB Redbridge 100017755
Source: London Borough of Redbridge, Information Management

London Borough of Redbridge Borough Profile
12
2.1.2 Redbridge occupies a total site area of 5,626 ha. For the purpose of this
assessment, the Council has aimed to provide analysis at different spatial scales,
such as at a larger geographical scale (regional and national) and at a lower super
output level as well as ward level in order to provide a more detailed understanding
of the make-up of the Borough.
2.1.3 There are fundamental challenges that have been identified as part of this
analysis and it can be demonstrated that these are concerning issues, such as
population, housing, business and industry, retail, transportation, leisure, recreation
and tourism, environment, and health and wellbeing.
2.1.4 Figure 2.2 shows the ward administrative boundaries within the Borough.
Figure 2.2- Map of London Borough of Redbridge, showing the Administrative Boundaries
© Crown copyright and database rights 2015 Ordnance Survey. LB Redbridge 100017755
Source: London Borough of Redbridge, Information Management.

London Borough of Redbridge Borough Profile
13
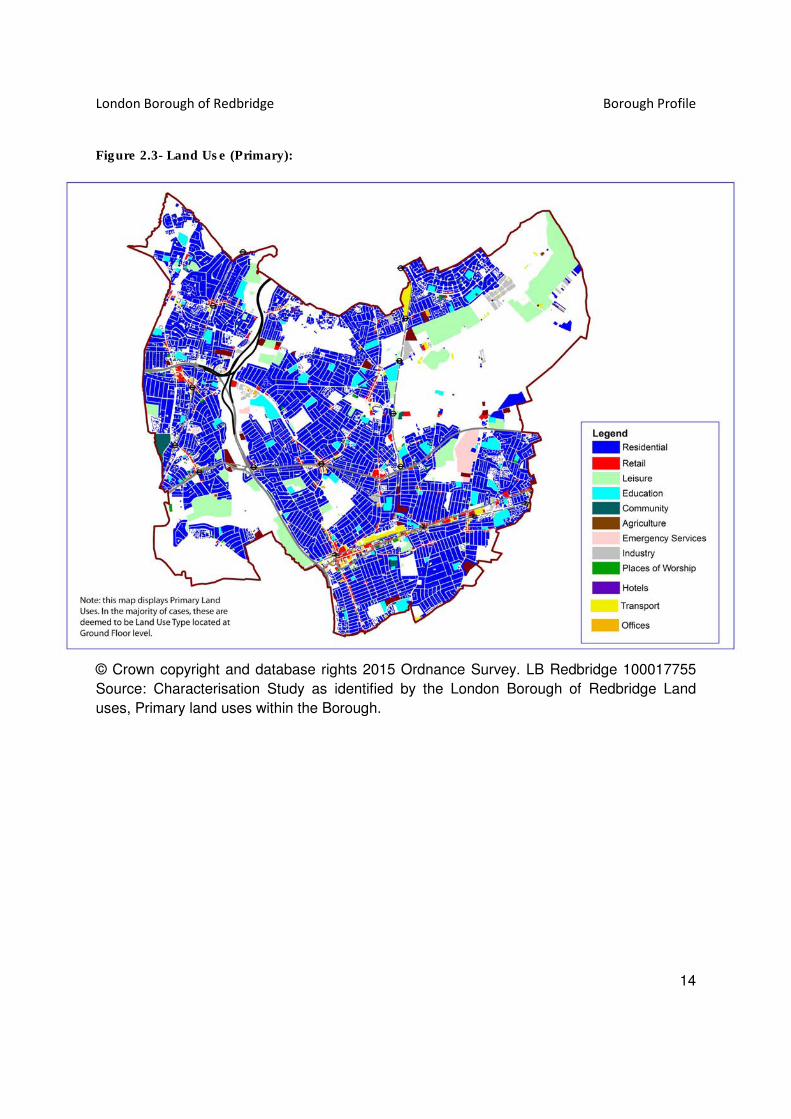
2.1.5 Redbridge is a predominantly residential borough Figure 2.3 shows the
spatial distribution of land uses across the Borough, and Table 2.1 provides the
statistical data.
Table 2.1 Major Land Uses in Redbridge by Area and Percentage Spatial Distribution
Primary Land Use Area (sq m) Percentage Occupation
Education 1,581,455 3.44
Emergency Services and
Clinics
452,400 0.98
Places of Worship 175,619 0.38
Transport 431,119 0.94
Retail 834,663 1.82
Industrial 669,174 1.46
Hotels 48,736 0.11
Leisure 156,946 0.34
Offices 220,919 0.48
Community 35,567 0.08
Parks and Open Spaces 20,699,410 45.03
Residential 20,662,613 44.95
Total Area 45,968,621 100
London Borough of Redbridge Borough Profile
14
Figure 2.3- Land Use (Primary):
© Crown copyright and database rights 2015 Ordnance Survey. LB Redbridge 100017755
Source: Characterisation Study as identified by the London Borough of Redbridge Land
uses, Primary land uses within the Borough.

London Borough of Redbridge Borough Profile
15
2.1.6 Excluding Ilford Metropolitan Centre there are 11 Shopping Areas, 38 key
retail parades and 1 retail park within the Borough, and under the following hierarchy:
Metropolitan
● Ilford Metropolitan Centre
District
● Barkingside
● Chadwell Heath (part)
● Gants Hill
● South Woodford
● Wanstead
Local
● Goodmayes
● Ilford Lane
● Manford Way Newbury Park
● Seven Kings
● Woodford Bridge
● Woodford Broadway/ Snakes Lane
Key Retail Parades
● AldBorough
114-132 Horns Road
● Barkingside
1-3 Beattyville Gardens/ 779-793 Cranbrook Road
552-586, 685-713 Cranbrook Road
165-173 Longwood Gardens/ 1-15 Longwood Place
● Chadwell Heath

London Borough of Redbridge Borough Profile
16
64-70, 65-77, 105 Chadwell Heath Lane
● Clayhall
45-55 Atherton Road
1-14 Claybury Broadway
227-239 Clayhall Avenue
1-6 Fullwell Parade
● Gants Hill
1-35, 2-18 Beehive Lane, 439-461 Cranbrook Road
243-251 Beehive Lane- 1-11 Redbridge Lane East
1-14 Highview Parade, Woodford Avenue/ Redbridge Lane East
1-8 Spurway Parade, Woodford Avenue
● Goodmayes
561-567 Longbridge Road
● Hainault
109-127 Fencepiece Road
158-168 Fencepiece Road
358-368 Manford Way
194-204, 206-218 New North Road
593-603 New North Road
● Ilford
76-94, 73-89b Belgrave Road
103-127 Belgrave Road
123-143 Gordon Road
19-59, 96-98 Green lane
309-365 Ley Street
119-141, 122-132 Woodlands Road

London Borough of Redbridge Borough Profile
17
● Newbury Park
80-90 Leyswood Drive
● Redbridge
115-129 eastern Avenue
214-226 Redbridge Lane East/ 2-6 Roding Lane South
● Seven Kings
110-122, 217-229, 249-261, 265-273 AldBorough Road South
232-353, 357-371, 390-430 Green Lane
37-59, 74-74a, 98-100 Meads Lane
● South Woodford
126-140 Hermon Hill
211-249, 16-218 High Road
● Wanstead
89-95 Aldersbrook Road
● Woodford Bridge
341-347 Chigwell Road
524-542 Chigwell Road
● Woodford Green
352-384, 397-401, 405-475 High Road
Retail Park: Chadwell Heath
2.1.7 The following is a list of the business areas within the Borough.
Chadwell Heath Business Park
Forest Road
Hainault Business Park (Strategic Industrial Location)
New North Road

London Borough of Redbridge Borough Profile
18
Hainault Works
Newton Industrial Estate
Raven Road
Southend Road (Strategic Industrial Location)
2.1.8 The locations of Redbridge Town Centres are shown in Figure 2.4:

London Borough of Redbridge Borough Profile
19
Figure 2.4 Location of Town Centres
© Crown copyright and database rights 2015 Ordnance Survey. LB Redbridge 100017755
Source: London Borough of Redbridge Characterisation Study, Town Centre Locations.
London Borough of Redbridge Borough Profile
20
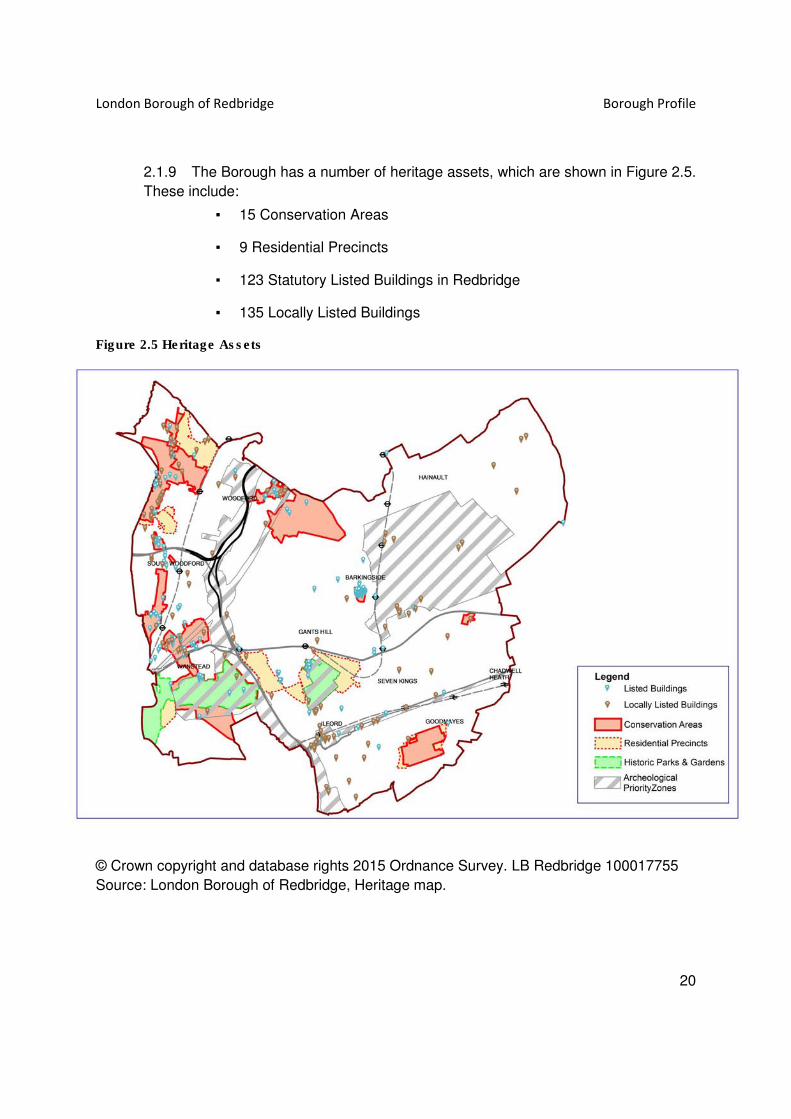
2.1.9 The Borough has a number of heritage assets, which are shown in Figure 2.5.
These include:
▪ 15 Conservation Areas
▪ 9 Residential Precincts
▪ 123 Statutory Listed Buildings in Redbridge
▪ 135 Locally Listed Buildings
Figure 2.5 Heritage Assets
© Crown copyright and database rights 2015 Ordnance Survey. LB Redbridge 100017755
Source: London Borough of Redbridge, Heritage map.

London Borough of Redbridge Borough Profile
21
2.1.10 Approximately one third of the Borough is made up of open space including
land which is Green Belt. These open spaces are shown in Figure 2.6 below.
Figure 2.6 - Open spaces
© Crown copyright and database rights 2015 Ordnance Survey. LB Redbridge 100017755
Source: Redbridge Characterisation Study
Important Open Space:
AldBorough
1. War Memorial Gardens
2. William Torbitt Primary School Playing Field
3. Fullwood Primary School Playing Field
4. St. Peters Churchyard
5. Queen Victoria House Grounds

London Borough of Redbridge Borough Profile
22
6. Barley Mow Sports Ground
7. Newbury Park Primary School Playing Field
8. Barnados Village gardens, Horns Road
Barkingside
9. Parham Drive Playground
10. Stratford Newtown Wesleyan Sports Ground
Bridge
11. Upper Green
12. Latchindon Gardens Open Space
13. Woodford Town Football Ground
14. Vicarage Road Open Space
15. Stanford Close
16. Lowe Green
Chadwell
17. The Green, Little heath
18. Grove Road Gardens
19. Redbridge College of Further Education Playing Field
20. Open Space at Corner of Essex Road/ Cross Road
21. Grove Primary School Playing Field
22. Percival Gardens
23. St Bedes Primary School Field
Church End
24. Churchfield Gardens
25. Open Space at Grove Road and Buckingham Road
26. Churchfields Junior and Infants School
27. Open Space at Grove Road and Lincoln
London Borough of Redbridge Borough Profile
23
28. Open Space at Grove Road and Stanley Road
29. Queen Mary and Westfield College Playing Field
30. Salway Gardens Open Space
Clayhall
31. Clayhall Park
32. Parkhill Primary School Playing Field
33. Redbridge Junior and Infants School Playing Field
34. Redbridge Roundabout
Clementswood
35. Open Space and car park, Off Winston Way
36. Buckingham Road Cemetery
37. T.A. Centre
38. At. Mary’s Churchyard
39. Cricklefields Athletic Ground
Cranbrook
40. Valentines Park
41. Entrance to Wanstead Park Recreation Ground
42. Valentines High School Playing Fields
43. PLA Sports Ground
Fairlop
44. The Square, Tutor Square
45. Fairlop School Playing Field
46. Gilbert Primary school
47. Barkingside Garden of Rest
48. Glade Primary School Playing Field
49. Barkingside Cemetery
London Borough of Redbridge Borough Profile
24
50. Ilford CH Boys School Playing Field
51. Caterham High School Playing Field
52. Coked Hat Plantation (including Hurstleigh Gardens)
53. Barkingside Recreational Ground
54. Mossford lane Allotments
Goodmayes
55. Goodmayes Park
56. Goodmayes Park Extension
57. Mayfield High School Playing Field
58. Goodmayes Allotments
Hainault
59. Woodman Path Open Space
60. Staggart Green North
61. Coppice Primary School Playing Field
62. Manford School Playing Field
Loxford
63. Loxford Park
64. Land by Sainsbury’s facing Roden Street
65. Uphall School Playing Field
66. Woodlands Infants and Junior School Playing Field
Mayfield
67. South Park
68. Knox Sports Field
69. St. Peter and St. Paul’s RC Primary School Field
70. Goodmayes College Playing Field
71. Loxford High School Playing Field

London Borough of Redbridge Borough Profile
25
72. Loxford Lane Allotments
73. Open Space, Loxford Lane
74. Gordon School Playground
75. South Park Drive Playing Field
Monkhams
76. Woodford Wells (Crostyx) Sports Ground
77. Pankhurst Green
78. Worchester Crescent Open Space
79. Bancroft’s School Playing Field
80. Woodford Green Bowls Club
81. Woodford Green Preparatory School Playing Field
82. Links Road Green
83. Trinity catholic School (Upper) Playing Field
84. Mayfair Gardens Green
85. Chestnut Walk Pond
86. Upper Green, High Road
87. Trinity Catholic High School (Lower) Playing Field
88. St. Aubyn’s Preparatory School Playing Field
89. Allotment gardens, Broadmead Road
90. Broomhill Court
Newbury Park

London Borough of Redbridge Borough Profile
26
Recreation
2.1.11 Redbridge has two public leisure centres and one public swimming pool. The Borough also has two athletics tracks, two skate parks, the Redbridge Cycling Centre at Hog Hill and eight outdoor/green gyms. There are a total of 44 sites across the Borough which have Sports Halls available for use; these are a combination of school, leisure and community sites. There are five privately run leisure centres in Redbridge. There is unmet demand for a swimming pool within the Borough.
2.1.12 Table 2.2 shows Redbridge Borough’s provision for outdoor sporting pitch
provision. The Borough also has:
● Golf complexes at Fairlop Waters and Hainault Forest Country Park.
● Athletics grounds at Cricklefields and Ashton Playing Fields.
● Cycle circuits in Loxford Park, Goodmayes Park and Forest Park Playing Fields
and a new cycleway at Hog Hill.
● Skate parks at Seven Kings Park and Forest Road Playing Fields.
● A dual use water sports facility incorporating the Fairlop Sailing Centre at Fairlop
Waters.
● Eight multi use games areas (MUGAs).
● 35 formally designated children’s playgrounds (primarily for under 14 use),
covering a total of 6 hectares
Table 2.2 Redbridge Outdoor Sporting Pitch Provision
Redbridge Outdoor Sporting Pitch Provision
Facility Number Area of Pitch
(ha)
Total (ha)
Bowling Greens 9 0.1 0.9
Football Pitches 131a 0.7 28
Cricket Pitches 17b 1.2 20.4
Rugby Pitches 12.5c
Total 72
NB. a. Football Pitches in Redbridge for secured community use, this includes sites in Redbridge that are leased from the borough and also sites that fall within Redbridge but managed by the Corporation of London. b. Redbridge provides 17 cricket pitches for secured community use, other pitches, provided by other clubs are available to be hired privately. c. There are 12.5 rugby pitches in Redbridge Borough, all of which are provided for privately rather than by the Borough.

London Borough of Redbridge Borough Profile
27
Source: London Borough of Redbridge, Community Infrastructure Plan 2015 – 2030, March
2014 with updates from Vision Redbridge Culture and Leisure November 2015
2.1.13 The Sport England Facilities Planning Calculator (version June 12) was used
to assess the leisure requirements for an additional 65,054 people in Redbridge and
the results are as follows:
● Pools: 717.40 square metres, 13.50 Lanes, 3.38 Pools.
● Halls: 19.19 Courts, 4.80 Halls.
● Indoor Bowls: 3.29 Rinks, 0.55 Centres.
● Artificial Turf Pitches (Third Generation): 2.28 Pitches.
2.1.14 The Sport England Costs Calculator (2012) estimates the costs for the new
facilities set out in Table 2.3. The land costs have been calculated using the
standards £5.630 million per hectare. It is assumed that the artificial grass pitch will
be accommodated within the existing Council owned areas of land around the
Borough and the indoor bowls rink will be provided as part of an upgrade to an
existing facility, and so there is no land cost associated with these facilities.

London Borough of Redbridge Borough Profile
28
Table 2.3 Costs of New Leisure Facilities Required to Meet Needs of Redbridge’s Growing
Population
Costs of New Leisure Facilities
Facility Details Area (m2) Capital Cost Land Cost
(£5.630
million/ha).
TOTAL
£million
Swimming
Pools
13.50 Lanes,
3.38 Pools
717.40 £10,054,542 £0.403 million £10.46
million
Sports Halls 4.80 Halls,
19.19 Courts
(15 Courts:
64.05m x
40.6m,
4 Courts:
34.5mX 20m)
3,290.43 £13,287,569 £1.85 million £15.14
million
Indoor Bowls 3.29 Rinks,
0.55 Centres.
N/A £932,079 N/A £0.932
million
Artificial Turf
Pitches
2.28 Pitches. N/A £1,953,228 N/A £1.95
million
TOTAL £26.22 million £2.26 million £28.48
million
Source: London Borough of Redbridge, Community Infrastructure Plan 2015 – 2030, March
2014
2.1.15 Some of the Green Belt land identified also falls within areas of potential
minerals extraction that are situated to the north east of the Borough. These areas
are shown in Figure 2.7.

London Borough of Redbridge Borough Profile
29
Figure 2.7 Minerals Extraction Sites
Source: Minerals Local Plan.

London Borough of Redbridge Borough Profile
30
2.1.16 Figure2.8 breaks down the geology of the Borough and identifies key
minerals that can be found within the Borough.
Figure 2.8 Redbridge Drift Geology
© Crown copyright and database rights 2015 Ordnance Survey. LB Redbridge 100017755
Source: Minerals Local Plan.

London Borough of Redbridge Borough Profile
31
2.1.17 The Borough Topography map, see Figure 2.9, shows that the high land
within the Borough is located to the north in Woodford, Chigwell and Hainault and low
lying land is to the south of the Borough.
Figure 2.9 Borough Topography
© Crown copyright and database rights 2015 Ordnance Survey. LB Redbridge 100017755
Source: London Borough of Redbridge Characterisation Study, Topography.
London Borough of Redbridge Borough Profile
32
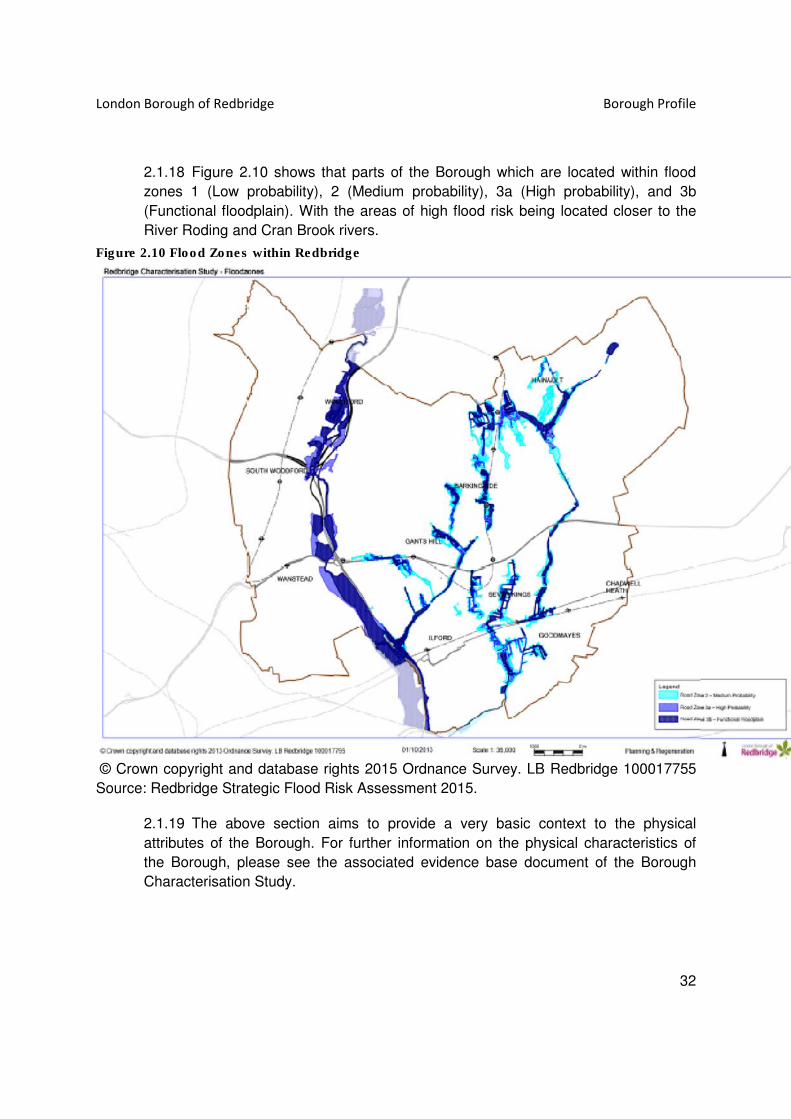
2.1.18 Figure 2.10 shows that parts of the Borough which are located within flood
zones 1 (Low probability), 2 (Medium probability), 3a (High probability), and 3b
(Functional floodplain). With the areas of high flood risk being located closer to the
River Roding and Cran Brook rivers.
Figure 2.10 Flood Zones within Redbridge
© Crown copyright and database rights 2015 Ordnance Survey. LB Redbridge 100017755
Source: Redbridge Strategic Flood Risk Assessment 2015.
2.1.19 The above section aims to provide a very basic context to the physical
attributes of the Borough. For further information on the physical characteristics of
the Borough, please see the associated evidence base document of the Borough
Characterisation Study.

London Borough of Redbridge Borough Profile
33

London Borough of Redbridge Borough Profile
34
3 Population
3.1 The Current Situation
3.1.1 One of the key factors that influences planning policy is changes to the
population of the Borough as this has implications on the need for housing, schools
and other necessary infrastructure to be able to accommodate people in a
sustainable manner. To help determine the types of services that are most needed
by Redbridge’s population we look at how the population in terms of age, ethnicity,
religion and gender.
3.1.2 Across England and Wales, the population has been rising and is projected to
continue to l past the end of the plan period of 2030. Between 2001 and 2011, the
population of England and Wales increased by 4.03 million (8%) to reach 56.08
million on Census day 2011. (Source: GLA Intelligence, Census Information Scheme,
July 2012).
3.1.3 National population projections show the UK population increasing by 4.3
million over the next 10 years1, from an estimated 63.7 million in mid-2012 to 68.0 in
mid-2022. The growth rate would be an increase of 0.6 % each year between mid-
2012 and mid-2022. By 2037, the population is expected to have grown by 9.6 million
people. (Source: Office of National Statistics).
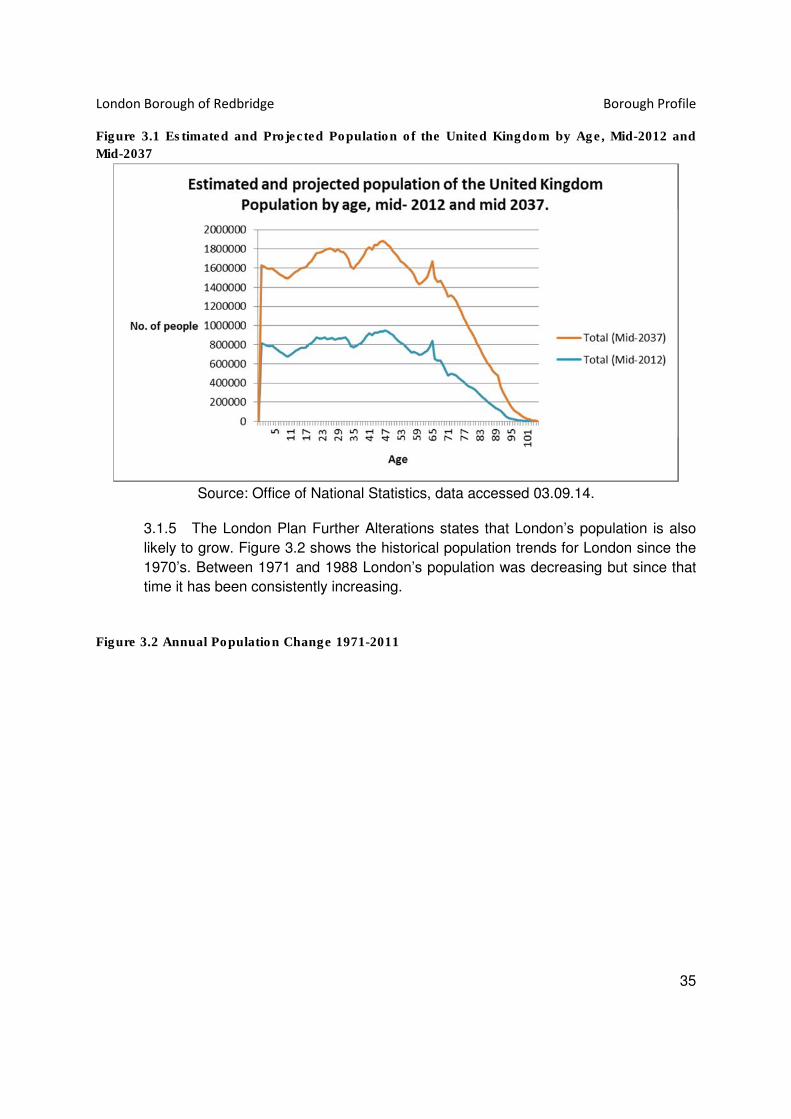
3.1.4 Figure 3.1 shows the projected UK population increase up until the year 2037
by age.
1 Population projections at a national level are based on the assumptions on family size (2.5 children per
woman), morality rate and net migration. This is based on the fact that nationally the average numbers of
children per women are increasing, the life expectancy of UK residents is increasing and the long term
assumption for net migration to the UK is +165, 000 each year.
London Borough of Redbridge Borough Profile
35
Figure 3.1 Estimated and Projected Population of the United Kingdom by Age, Mid-2012 and
Mid-2037
Source: Office of National Statistics, data accessed 03.09.14.
3.1.5 The London Plan Further Alterations states that London’s population is also
likely to grow. Figure 3.2 shows the historical population trends for London since the
1970’s. Between 1971 and 1988 London’s population was decreasing but since that
time it has been consistently increasing.
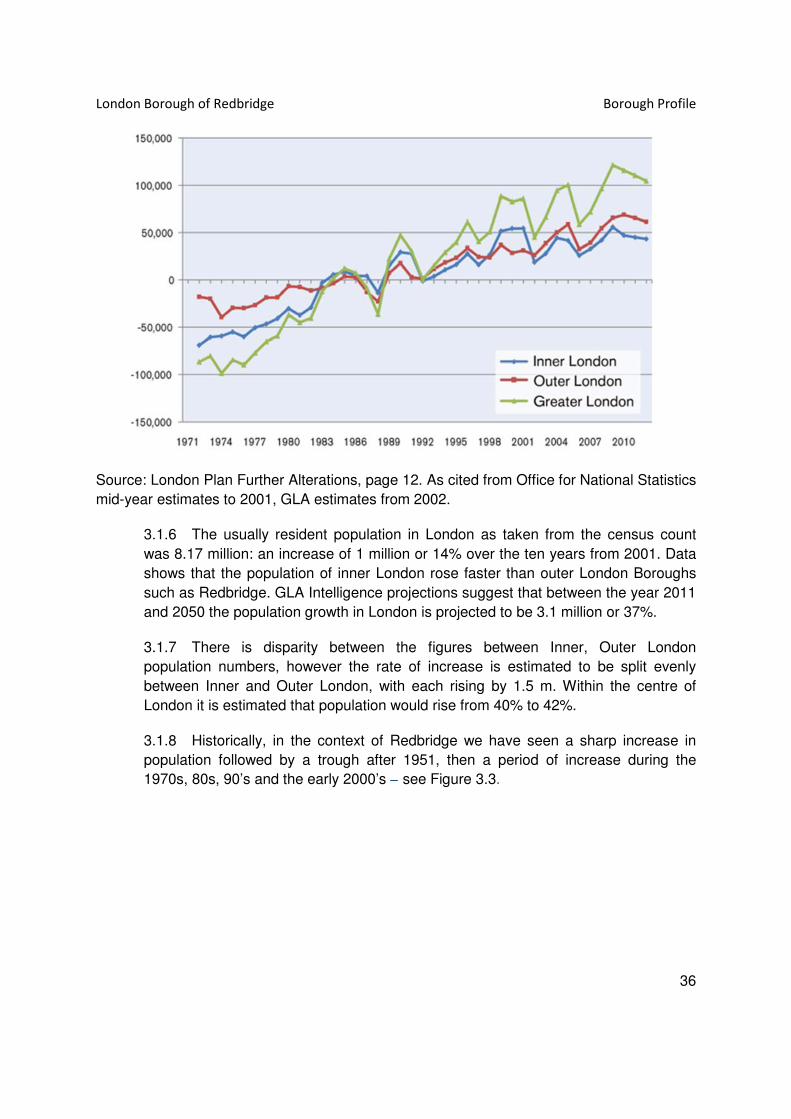
Figure 3.2 Annual Population Change 1971-2011
London Borough of Redbridge Borough Profile
36
Source: London Plan Further Alterations, page 12. As cited from Office for National Statistics
mid-year estimates to 2001, GLA estimates from 2002.
3.1.6 The usually resident population in London as taken from the census count
was 8.17 million: an increase of 1 million or 14% over the ten years from 2001. Data
shows that the population of inner London rose faster than outer London Boroughs
such as Redbridge. GLA Intelligence projections suggest that between the year 2011
and 2050 the population growth in London is projected to be 3.1 million or 37%.
3.1.7 There is disparity between the figures between Inner, Outer London
population numbers, however the rate of increase is estimated to be split evenly
between Inner and Outer London, with each rising by 1.5 m. Within the centre of
London it is estimated that population would rise from 40% to 42%.
3.1.8 Historically, in the context of Redbridge we have seen a sharp increase in
population followed by a trough after 1951, then a period of increase during the
1970s, 80s, 90’s and the early 2000’s – see Figure 3.3.

London Borough of Redbridge Borough Profile
37
Figure 3.3 Graph showing the Population Trends in Redbridge from 1801 to 2011
Source: Greater London Authority, London.gov.uk

London Borough of Redbridge Borough Profile
38
3.1.9 The 2011 census indicates that with a population of 278,979, Redbridge
remained the 11th largest Borough in London and has been estimated to have risen
to 297,447 in 2015.
3.1.10 Table 3.1 shows the population in Redbridge and its neighbouring Boroughs
on the day of the 2011 census and for more recent mid-year projections in 2015.
Table 3.1 Population Figures for Redbridge and Neighbouring London Boroughs, 2011-2014
Borough Estimated
population 2011
2011 Census Estimated population
mid-2015
Redbridge 276,000 279,000 297,447
Waltham Forest 236,200 258,200 273,934
Newham 279,800 308,000 332,583
Barking and Dagenham 187,300 185,900 203,060
Havering 238,000 237,200 247,058
Source: ONS Census data and GLA 2014 round Trend-based population projections: Short-
term migration scenario
3.1.11 The population of Redbridge is expected to continue growing from a
population of
297,000 in 2015 to 362,000 by 2030. Figure 3.4 shows Redbridge’s projected population.

London Borough of Redbridge Borough Profile
39
Figure 3.4 Redbridge Population Projections to 2041
Source: GLA 2014 round Trend-based population projections: Short-term migration scenario
.

London Borough of Redbridge Borough Profile
40
3.1.12 Table 3.2 shows the population projections on annual basis from 2015 to
2030.
Table 3.2 Projected Population Increase 2014-2030
Year Projected Population
Increase
Percentage Increase
(%)
2015 297,447
2016 302,047 1.5
2017 306,668 1.5
2018 311,318 1.5
2019 315,993 1.5
2020 320,658 1.5
2021 325,268 1.4
2022 329,801 1.4
2023 334,243 1.3
2024 338,565 1.3
2025 342,747 1.2
2026 346,785 1.2
2027 350,708 1.1
2028 354,513 1.1
2029 358,197 1.0
2030 361,763 1.0
Source: GLA 2014 round Trend-based population projections: Short-term migration scenario
London Borough of Redbridge Borough Profile
41
3.1.13 The spatial distribution of population increase between the years 2001 and
2011 across the Borough is shown in Figure 3.6 below.. This map provides a
gradient which shows the wards which were highly populated, and go from the
warmer colours of red and orange to represent a high population to colours of light
blue and dark blue to show a less dense population. It can be immediately seen that
wards to the south of the Borough have a higher level of population increase.
3.1.14 Census records also show that the average percentage change of population
within the Borough overall since the last census data collected in 2001, is an average
of 17 %. The fastest growing ward was the Clementswood ward, which has grown at
a rate of 29.9 % followed by Loxford (21.8 %) also situated to the south of the
Borough. In contrast, the slowest growing ward is Wanstead, which grew at a rate of
0.3 %. Comparatively, population to the east of the Borough is growing more rapidly
(20-30 % in between 2001 and 2011) than that in the west which is 15 %.
3.1.15 The above information in relation to the extent and speed of growth is
important as this issue of high population growth at a fast rate poses a major
challenge for the development within the Borough in the future.

London Borough of Redbridge Borough Profile
42
Figure 3.5 Map showing the Percentage of Population Increase (2001-2011)
Contains National Statistics data © Crown copyright and database rights 2015
Source: Adapted from data from the Office for National Statistics licensed under the Open
Government License v3.0.
London Borough of Redbridge Borough Profile
43
Population Density
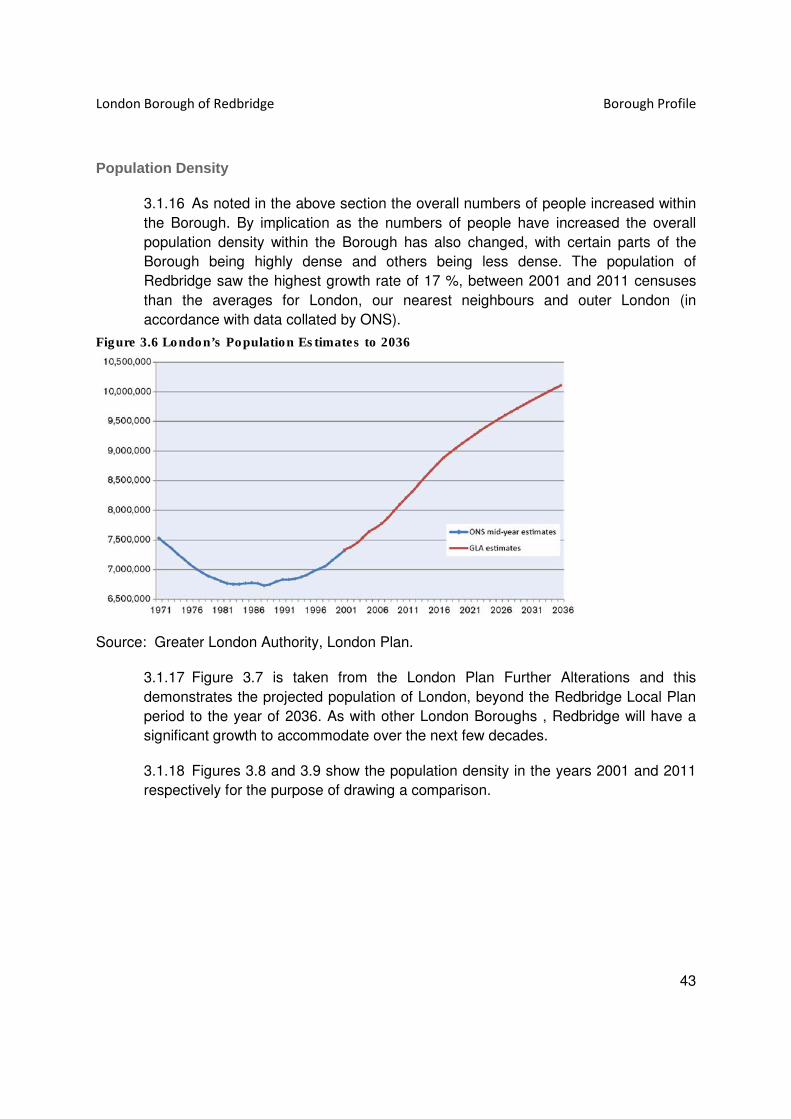
3.1.16 As noted in the above section the overall numbers of people increased within
the Borough. By implication as the numbers of people have increased the overall
population density within the Borough has also changed, with certain parts of the
Borough being highly dense and others being less dense. The population of
Redbridge saw the highest growth rate of 17 %, between 2001 and 2011 censuses
than the averages for London, our nearest neighbours and outer London (in
accordance with data collated by ONS).
Figure 3.6 London’s Population Estimates to 2036
Source: Greater London Authority, London Plan.
3.1.17 Figure 3.7 is taken from the London Plan Further Alterations and this
demonstrates the projected population of London, beyond the Redbridge Local Plan
period to the year of 2036. As with other London Boroughs , Redbridge will have a
significant growth to accommodate over the next few decades.
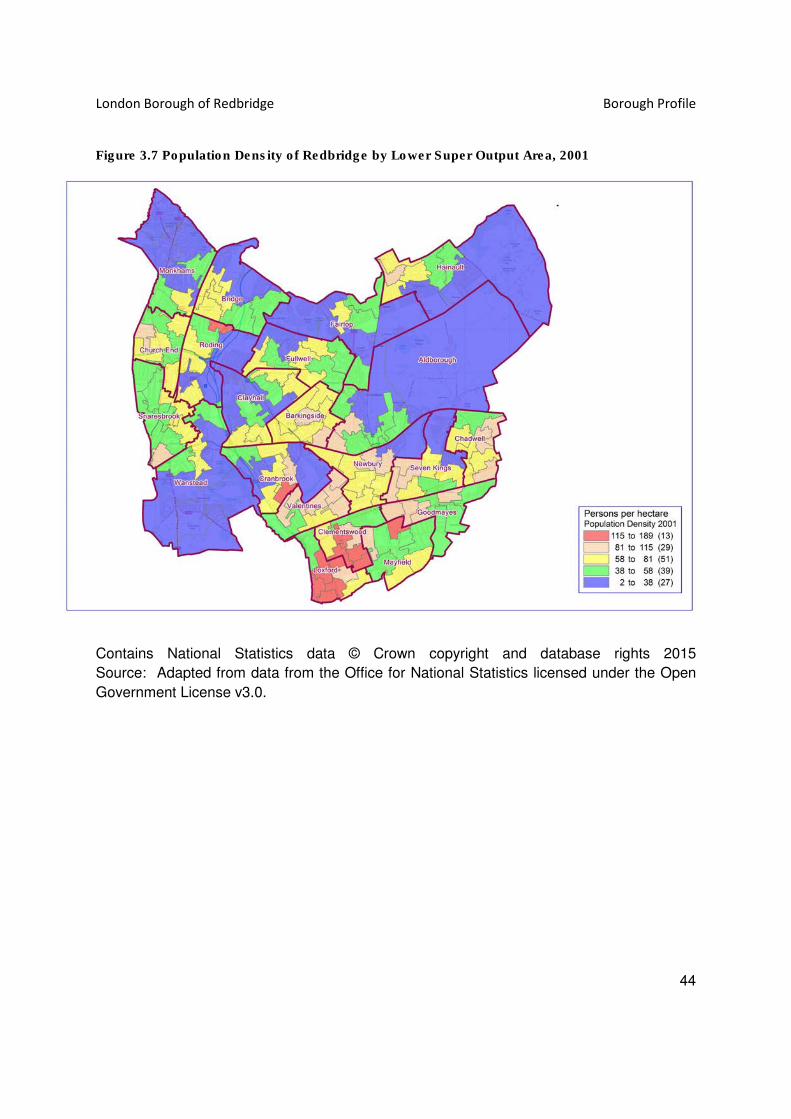
3.1.18 Figures 3.8 and 3.9 show the population density in the years 2001 and 2011
respectively for the purpose of drawing a comparison.
London Borough of Redbridge Borough Profile
44
Figure 3.7 Population Density of Redbridge by Lower Super Output Area, 2001
Contains National Statistics data © Crown copyright and database rights 2015
Source: Adapted from data from the Office for National Statistics licensed under the Open
Government License v3.0.

London Borough of Redbridge Borough Profile
45
Figure 3.8 Population Density of Redbridge by Lower Super Output Area, 2011
Contains National Statistics data © Crown copyright and database rights 2015
Source: Adapted from data from the Office for National Statistics licensed under the Open
Government License v3.0.

London Borough of Redbridge Borough Profile
46
Age Structure
3.1.19 Redbridge has a relatively young population, with a higher proportion of
children aged between 0-15 (22.5%) than London (19.9 %) and England and Wales
(18.9 %), see Figure 3.10.
Figure 3.9 Comparative Data Showing the Borough Age Profile in National and Regional
Context
Source: ONS data from 2001 and 2011.

London Borough of Redbridge Borough Profile
47
3.1.20 The actual break down of age groups are shown in Table 3.3 below.
3.1.21 Table 3.3 and Figure 3.11 show the age structure of Redbridge taken at the
two census dates of 2001 and 2011.
Table 3.3 Age Profile of Redbridge, London and Neighbouring Boroughs in 2011.
Source : ONS data, 2011.
London Borough of Redbridge Borough Profile
48
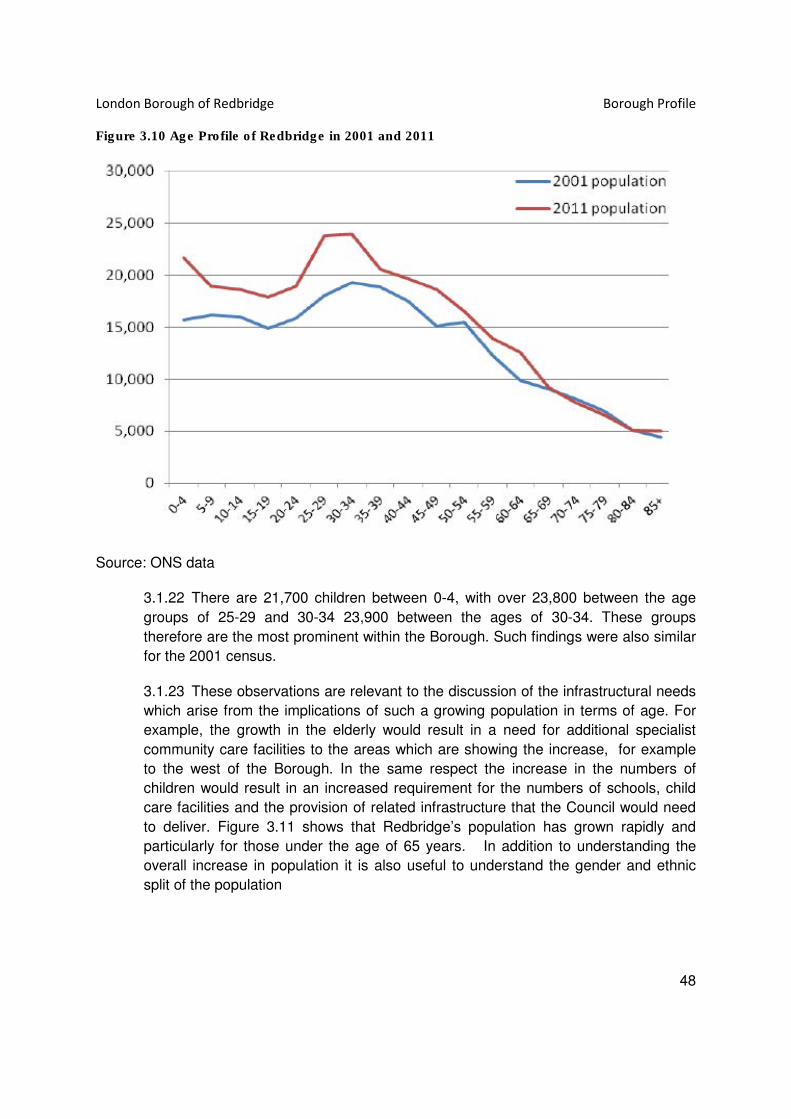
Figure 3.10 Age Profile of Redbridge in 2001 and 2011
Source: ONS data
3.1.22 There are 21,700 children between 0-4, with over 23,800 between the age
groups of 25-29 and 30-34 23,900 between the ages of 30-34. These groups
therefore are the most prominent within the Borough. Such findings were also similar
for the 2001 census.
3.1.23 These observations are relevant to the discussion of the infrastructural needs
which arise from the implications of such a growing population in terms of age. For
example, the growth in the elderly would result in a need for additional specialist
community care facilities to the areas which are showing the increase, for example
to the west of the Borough. In the same respect the increase in the numbers of
children would result in an increased requirement for the numbers of schools, child
care facilities and the provision of related infrastructure that the Council would need
to deliver. Figure 3.11 shows that Redbridge’s population has grown rapidly and
particularly for those under the age of 65 years. In addition to understanding the
overall increase in population it is also useful to understand the gender and ethnic
split of the population
London Borough of Redbridge Borough Profile
49
Gender Split
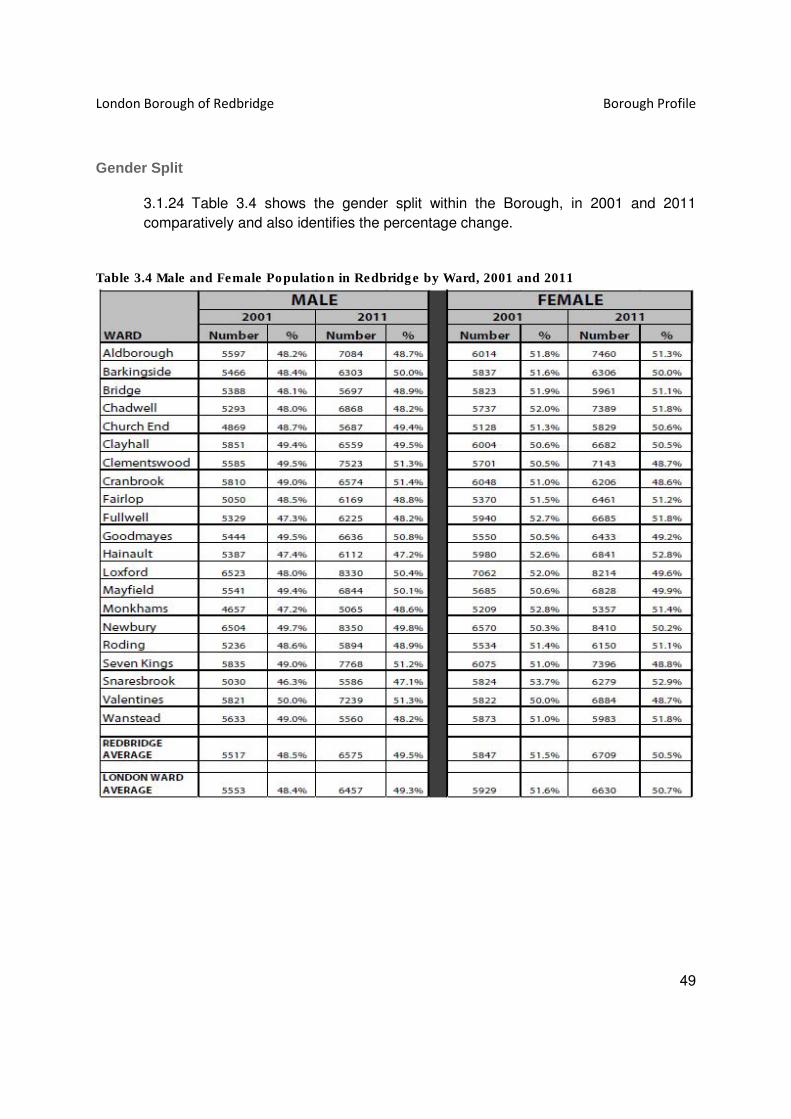
3.1.24 Table 3.4 shows the gender split within the Borough, in 2001 and 2011
comparatively and also identifies the percentage change.
Table 3.4 Male and Female Population in Redbridge by Ward, 2001 and 2011
London Borough of Redbridge Borough Profile
50
3.1.25 By looking at the Borough as a whole it can be seen that the percentage of
males has increased between the 2001 and 2011 censuses while the percentage of
females has decreased. The wards of Clementswood, Cranbrook, Goodmayes,
Loxford, Mayfield, Seven Kings and Valentines have a higher proportion of males
than females. There are particularly higher percentages of females in the wards of
Snaresbrook and Hainault wards at nearly 6 % higher than the proportion of males.
Ethnic/ Faith group
3.1.26 The London Plan (2011) states that eight London Boroughs (Harrow,
Redbridge, Tower Hamlets, Ealing, Hounslow, Croydon, Brent and Newham) are
likely to have a majority of their population from Black, Asian and other ethnic groups.
The London Plan Further Alterations (2014) states that London’s Black, Asian and
other minority ethnic minority community population are expected to grow strongly as
a result of natural growth and continued migration from overseas (point 1.12 quotes
on page 16). Of all London Boroughs, Redbridge has the 6th highest number
(85,014) of people whose stated that there country of birth is outside of the EU
countries (including EU Accession states). Redbridge ranked 9th highest in England
and Wales.
3.1.27 Despite this growth in the numbers of ethnic minority groups, trends over the
past 10 years show that the largest faith group within Redbridge is of the Christian
faith (36.8%). Christians are highest represented in Wanstead and Woodford,
Hainault and Chadwell Heath. The fastest growing faith group is the Muslim religion
(23.3%), with the highest rates of growth in South Ilford, particularly in Loxford and
Clementswood wards and in areas close to Ilford High Road and up to Cranbrook
and Clayhall.
3.1.28 Table 3.5 shows a breakdown of the number and percentage of people by
religion on a ward basis and also provides a comparative of the Redbridge and
London Average of each data set.

London Borough of Redbridge Borough Profile
51
Table 3.5 Number and Percentage of different religions in Redbridge by Ward, 2001
and 2011
Source: Census data, London Borough of Redbridge, Corporate Policy and
Performance.
London Borough of Redbridge Borough Profile
52
3.1.29 The percentage of groups on a sub-ethnic basis within the Borough are
shown in Table 3.6. Redbridge has a lower percentage of residents from a white
British ethnicity than the London average and has many more residents who are from
Asian ethnicities including Indian, Pakistani and Bangladeshi than the London
average. There are also fewer residents from Black African and Black Caribbean
ethnicities.
3.1.30 Table 3.7 shows that the ethnic mix of Redbridge has changed substantially
between 2001 and 2011 with a decline of White residents of 21% and an increase in
Asian residents of 16% and of Black residents of 9%. The wards of Clayhall,
Chadwell and Mayfield have seen particularly large changes in the ethnic
background of their residents.

London Borough of Redbridge Borough Profile
53
Table 3.6 Ethnicity of Redbridge Residents by Ward, 2011
Source: 2011 Census data, London Borough of Redbridge, Corporate Policy and
Performance.

London Borough of Redbridge Borough Profile
54
Table 3.7 Change in Ethnicity of Redbridge Residents between 2001 and 2011
Source: 2011 Census data, London Borough of Redbridge, Corporate Policy
and Performance.

London Borough of Redbridge Borough Profile
55
3.1.31 Table 3.8 and Figure 3.9 show the three largest ethnic groups per Redbridge
ward in 2001 and 2011.

London Borough of Redbridge Borough Profile
56
Table 3.8 Three Largest Ethnic Groups per Ward in Redbridge, 2001 and 2011
Source: 2001 and 2011 Census, London Borough of Redbridge, Corporate
Policy and Performance.

London Borough of Redbridge Borough Profile
57
Figure 3.11 Three Foremost Ethnic Group Proportions in each Ward of the
Borough 2011
Source: Produced by London Borough of Redbridge, Planning and Environment based on
Census data, ONS.
London Borough of Redbridge Borough Profile
58
3.1.32 Figures 3.13 to 3.18 show the spatial distribution of Redbridge residents by
their religious affiliation. The majority of residents of the Borough are Christians and
are resident primarily to the west, north and to the east of the Borough which is
similar trend to those with no religion. Those from a Buddhist background are more
likely to live in the centre of the Borough; Hindus and Sikhs are more likely to live in
the south and east of the Borough; Jews are more likely to live in the north, east and
west of the Borough; Muslims are more likely to live in the southern part of the
Borough. Those who regard themselves not from any of the mainstream religions
mentioned and qualify as those of “no particular religion” are spatially disseminated
across the entire Borough and are not situated in clusters as are other religious
groups.

London Borough of Redbridge Borough Profile
59

London Borough of Redbridge Borough Profile
60
Figure 3.12 Spatial Distributions of Christians in Redbridge
Source: Map based on census records 2011 produced by London
Borough of Redbridge, Corporate Policy and Performance.
Figure 3.13 Spatial Distributions of People with no Religion
Redbridge
Source: Map based on census records 2011 produced by London
Borough of Redbridge, Corporate Policy and Performance
Figure 3.14 Spatial Distribution of the Buddhists in Redbridge Figure 3.15 Spatial Distribution of the Hindus in Redbridge

London Borough of Redbridge Borough Profile
61
Source: Map based on census records 2011 produced by London
Borough of Redbridge, Corporate Policy and Performance.
Source: Map based on census records 2011 produced by London
Borough of Redbridge, Corporate Policy and Performance.

London Borough of Redbridge Borough Profile
62
Figure 3.16 Spatial Distribution of Sikhs in Redbridge
Source: Map based on census records 2011 produced by London
Borough of Redbridge, Corporate Policy and Performance.
Figure 3.17 Spatial Distribution of Jews in Redbridge
Source: Map based on census records
Borough of Redbridge, Corporate Policy and Performance.
Figure 3.18 Spatial Distributions of People with Other religion in
Redbridge Figure 3.19 Spatial Distribution of Muslims in Redbridge

London Borough of Redbridge Borough Profile
63
Source: Map based on census records 2011 produced by London
Borough of Redbridge, Corporate Policy and Performance Source: Map based on census records 2011 produced by London
Borough of Redbridge, Corporate Policy and Performance

London Borough of Redbridge Borough Profile
64
Ethnicity
3.1.33 Key trends in relation to Redbridge’s resident’s ethnicity are:
White
3.1.34 The dominant ethnic group of the Borough in 2011 was the white ethnicity
(36.8 %) but this has declined significantly in recent years as it was just over half of
the population (50.7 %) in 2001.
3.1.35 The wards which had the greatest percentage changes in white ethnic
population were Chadwell (-34.9 %), Clayhall (-30 %), AldBorough (-29.3 %) and the
Mayfield (-28.3 %). With the least amount of change occurring in Monkhams (-10.2
%), Church End (-11.6 %), Wanstead (-11.7 %) and Snaresbrook (-12.4 %) wards.
3.1.36 In both 2001 and 2011, Redbridge had a lower percentage of White residents
than the London average. The White ethnicity in London declined from 71.1% in
2001 to 59.8% in 2011 but Redbridge has experienced a more rapid decline from
63.5% in 2001 to 42.5% in 2011.
British Asian or Asian: Indian
3.1.37 16.4% of Redbridge residents were British Indian in 2011 up from 14% in
2001. Redbridge has a far greater proportion of British Asian or Asian (Indian) than
for London as a whole.
3.1.38 It can be seen the wards predominantly to the south of the Borough, such as
Clementswood (25.2 %), Goodmayes (24.5 %) and Valentines (25.0 %) have the
highest percentage of residents that are British Indian. Comparatively the wards of
Bridge (4.3 %), Hainault (4.7 %) and Fairlop (5.0 %) are showing the least amount of
people within this ethnic group, primarily to the north of the Borough.
British Asian or Asian: Pakistani:
3.1.39 Redbridge has a higher proportion of residents from a Pakistani ethnicity (
11.1 %) than the London average (2.9%) and the proportion has grown, increasing
from 6.2 % in 2001. There is a greater concentration of this ethnic minority group
within the wards of Clementswood (25.2 %), Loxford (24.0 %) and Cranbrook
(20.1%).
3.1.40 With regard to the types of people within the Borough and the ethnic
breakdown Table 3.16 and Figure 3.22 below show the changes in the numbers of
people born outside of the UK, in accordance with census records of 2011-21.

London Borough of Redbridge Borough Profile
65
Table 3.9 Redbridge Residents Born Outside UK per Ward in 2001 and 2011
Ward 2001 2011 Percentage
Change
AldBorough 22.1 38.4 16.3
Barkingside 24.7 40.5 15.7
Bridge 12.8 21.6 8.8
Chadwell 13.6 31.6 18.1
Church End 14.8 22.1 7.3
Clayhall 24.8 38.8 4.0
Clementswood 43.5 55.6 12.0
Cranbrook 33.4 44.5 11.1
Fairlop 12.7 25.1 12.4
Fullwell 16.0 29.6 13.6
Goodmayes 32.1 46.3 14.2
Hainault 9.0 22.2 13.2
Loxford 41.1 53.2 12.1
Mayfield 27.8 41.1 13.3
Monkhams 12.7 18.8 6.1
Newbury 35.0 47.5 12.6
Roding 17.0 28.2 11.2
Seven Kings 33.2 47.6 14.4
Snaresbrook 17.3 27.2 9.9
Valentines 38.9 50.3 11.4
Wanstead 16.1 22.8 6.7
Redbridge Average 24.2 36.9 12.7
London Average 27.1 36.7 9.6
Source: 2011, OSN data.
Migration
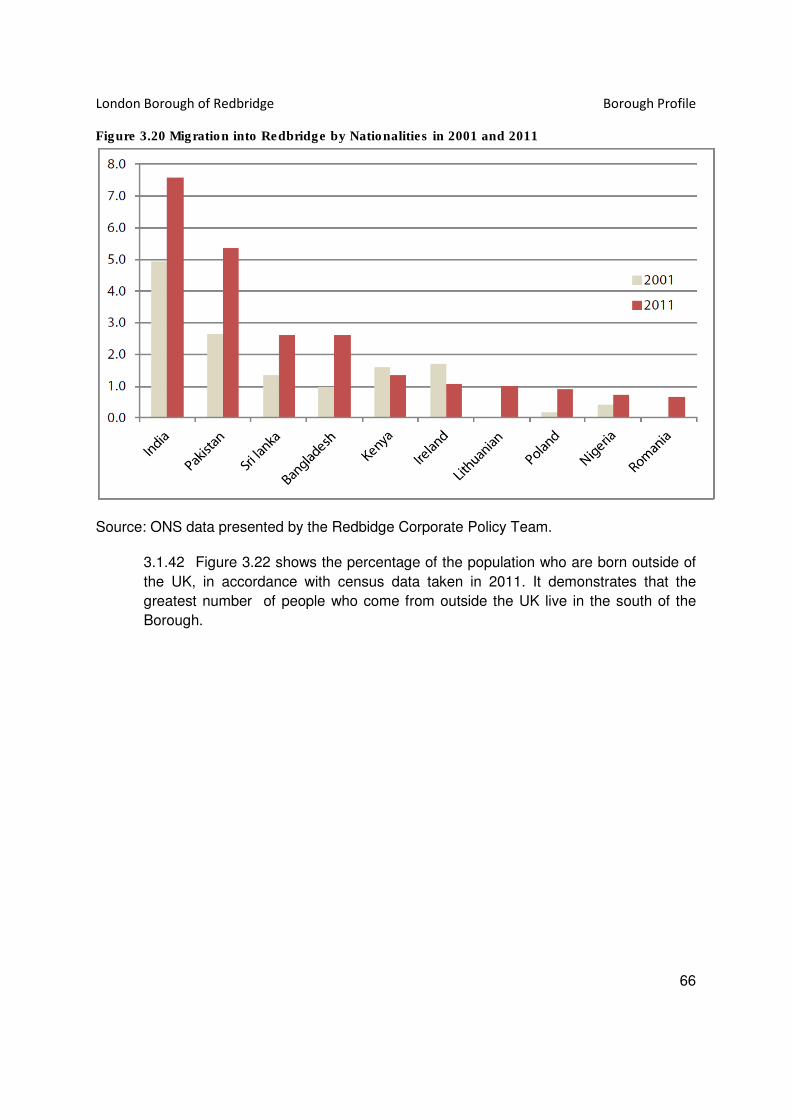
3.1.41 Figure 3.21 shows a snapshot of migration for 2001 and 2011 in to
Redbridge. This demonstrates that the Borough had a high number of migrants of
Indian, Pakistani, and Sri Lankan and Bangladeshi people in 2001 but substantial
numbers of Kenyans and Irish in 2011. The top countries of origin of migrants in 2011
were India, Pakistan, Sri Lanka and Bangladesh.
London Borough of Redbridge Borough Profile
66
Figure 3.20 Migration into Redbridge by Nationalities in 2001 and 2011
Source: ONS data presented by the Redbidge Corporate Policy Team.
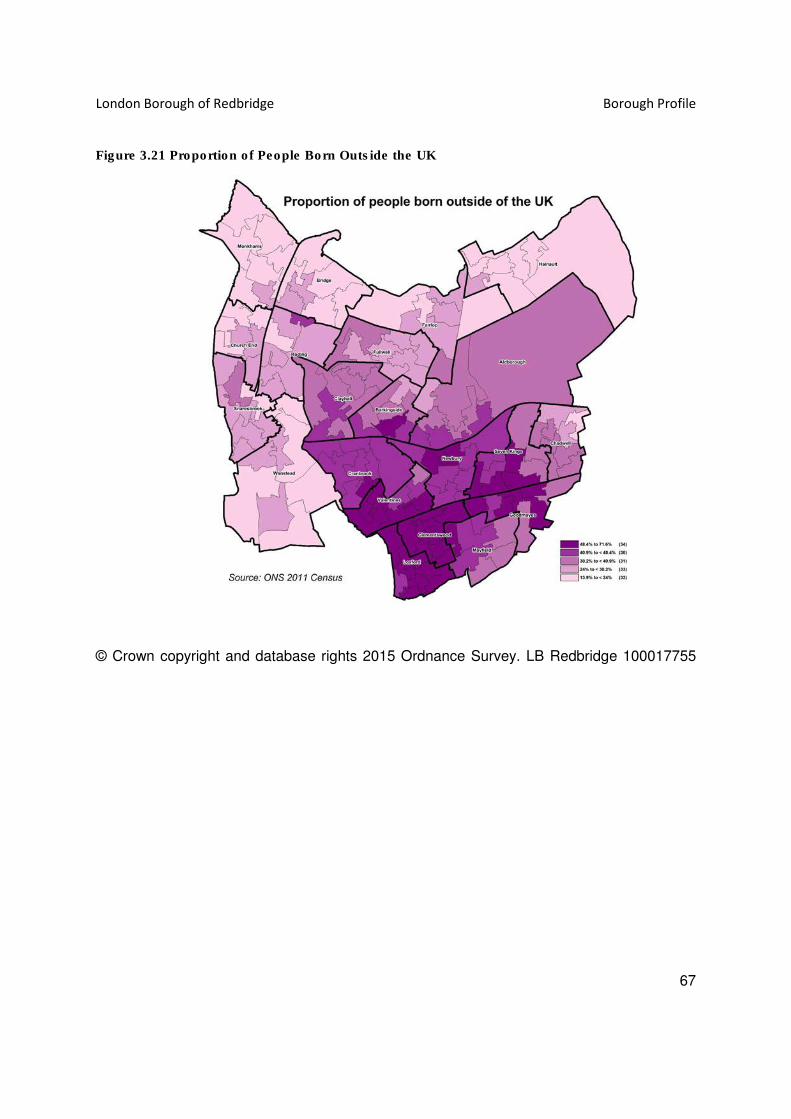
3.1.42 Figure 3.22 shows the percentage of the population who are born outside of
the UK, in accordance with census data taken in 2011. It demonstrates that the
greatest number of people who come from outside the UK live in the south of the
Borough.
London Borough of Redbridge Borough Profile
67
Figure 3.21 Proportion of People Born Outside the UK
© Crown copyright and database rights 2015 Ordnance Survey. LB Redbridge 100017755

London Borough of Redbridge Borough Profile
68
3.2 Future Change and Policy Implications
3.2.1 By knowing the extent of the population increase, there is an understanding of
the implications of the increase that the Local Plan must deal with in order to manage
this growth in a sustainable manner. To accommodate an increase in population in a
sustainable manner there are implications on the provision of housing, education
services, infrastructural provision (among other factors). By having such an
understanding projections can be made as to what the responsibilities of the Borough
translate into in terms of the monetary value of infrastructure. This is highlighted in
Table 3.17 , which is taken from the Boroughs Community Infrastructure Plan during
the plan period of 2015-2030.
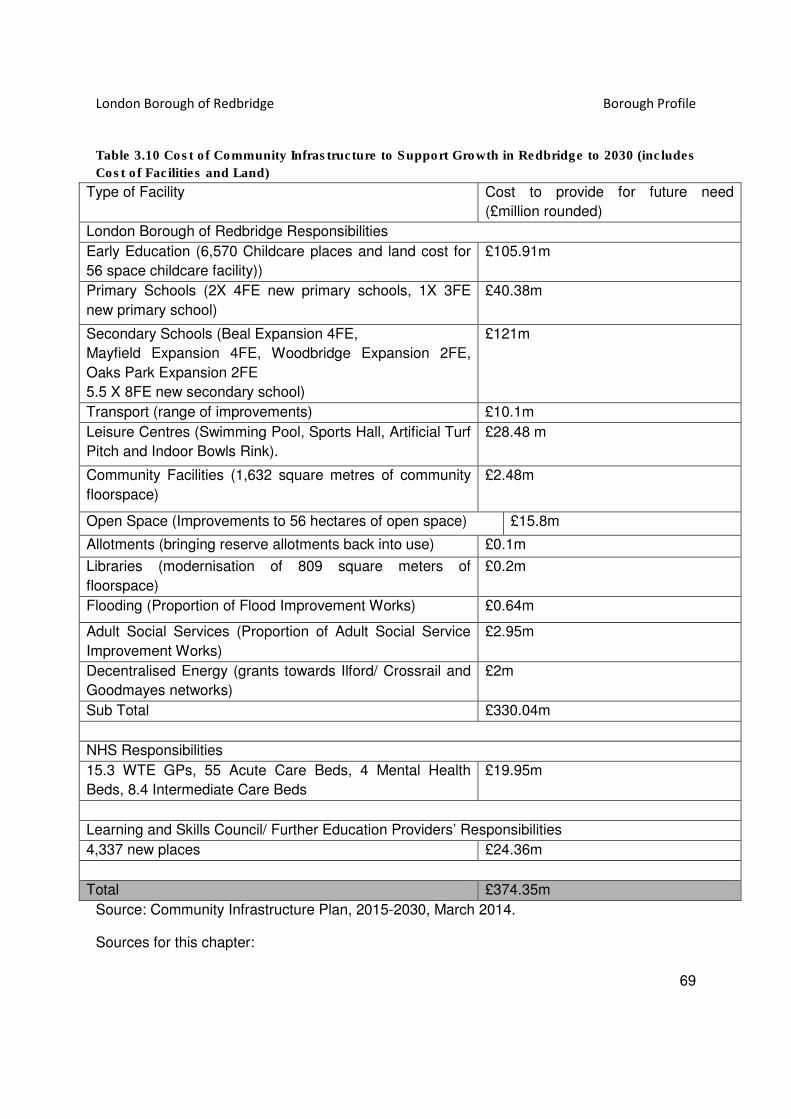
3.2.2 Table 3.17 shows the amount of funds that are required to meet the demands
for the existing population, as extrapolated from the Community Infrastructure Plan
2015-2030. The area of development which would require the most amount of
investment would be for early, secondary schools, primary schools and leisure
centres within the Borough. With the smaller amounts required being for the
purposes of being un-used allotments back in to use, the modernisation of libraries
and grants towards decentralised energy.
London Borough of Redbridge Borough Profile
69
Table 3.10 Cost of Community Infrastructure to Support Growth in Redbridge to 2030 (includes
Cost of Facilities and Land)
Type of Facility Cost to provide for future need
(£million rounded)
London Borough of Redbridge Responsibilities
Early Education (6,570 Childcare places and land cost for
56 space childcare facility))
£105.91m
Primary Schools (2X 4FE new primary schools, 1X 3FE
new primary school)
£40.38m
Secondary Schools (Beal Expansion 4FE,
Mayfield Expansion 4FE, Woodbridge Expansion 2FE,
Oaks Park Expansion 2FE
5.5 X 8FE new secondary school)
£121m
Transport (range of improvements) £10.1m
Leisure Centres (Swimming Pool, Sports Hall, Artificial Turf
Pitch and Indoor Bowls Rink).
£28.48 m
Community Facilities (1,632 square metres of community
floorspace)
£2.48m
Open Space (Improvements to 56 hectares of open space) £15.8m
Allotments (bringing reserve allotments back into use) £0.1m
Libraries (modernisation of 809 square meters of
floorspace)
£0.2m
Flooding (Proportion of Flood Improvement Works) £0.64m
Adult Social Services (Proportion of Adult Social Service
Improvement Works)
£2.95m
Decentralised Energy (grants towards Ilford/ Crossrail and
Goodmayes networks)
£2m
Sub Total £330.04m
NHS Responsibilities
15.3 WTE GPs, 55 Acute Care Beds, 4 Mental Health
Beds, 8.4 Intermediate Care Beds
£19.95m
Learning and Skills Council/ Further Education Providers’ Responsibilities
4,337 new places £24.36m
Total £374.35m
Source: Community Infrastructure Plan, 2015-2030, March 2014.
Sources for this chapter:
London Borough of Redbridge Borough Profile
70
National population statistics projection and estimation by age (2012 and 2037)- Office of
National Statistics: http://www.ons.gov.uk/ons/rel/npp/national-population-projections/2012-
based-reference-volume--series-pp2/executive-summary.html#tab-Underlying-Assumptions,
accessed 03.09.14.

London Borough of Redbridge Borough Profile
71

London Borough of Redbridge Borough Profile
72
4 Housing
4.1 The Current Situation
Analysis of the Housing stock
4.1.1 In 2015, the Department of Communities and Local Government recorded
102,400 housing units in Redbridge, this includes 4,560 which are owned by Local
Authorities (some of which may be owned by Local Authorities other than Redbridge
Borough).
4.1.2 In order to provide details of change and greater information about tenure the
following sections use data from the Censuses of 2001 and 2011. Table 4.1 shows
that housing tenure in Redbridge is predominantly owner occupied (63.6%), followed
by private rented (22.9%) with 11.4% in social rented accommodation.
Table 4.1 Housing Stock by Ownership, Redbridge Borough 2011
Type of ownership (All categories) Percentage within the
Borough
Total owned 63.6 %
- Owned outright 28.2 %
- Owned with a mortgage or loan 35.4 %
- Shared ownership part owned and part rented 1.0 %
Total social rented 11.4 %
- Social rented from council (LA) 6.3 %
- Social rented: Other social rented 5.1 %
Total private rented 22.9 %
- Private land or letting agency 21.6 %
- Private rented: Employer of a household member 0.1 %
- Private rented 0.3 %
- Living Rent Free 1.2 %
Source: ONS Census 2011, Redbridge Corporate Policy Team
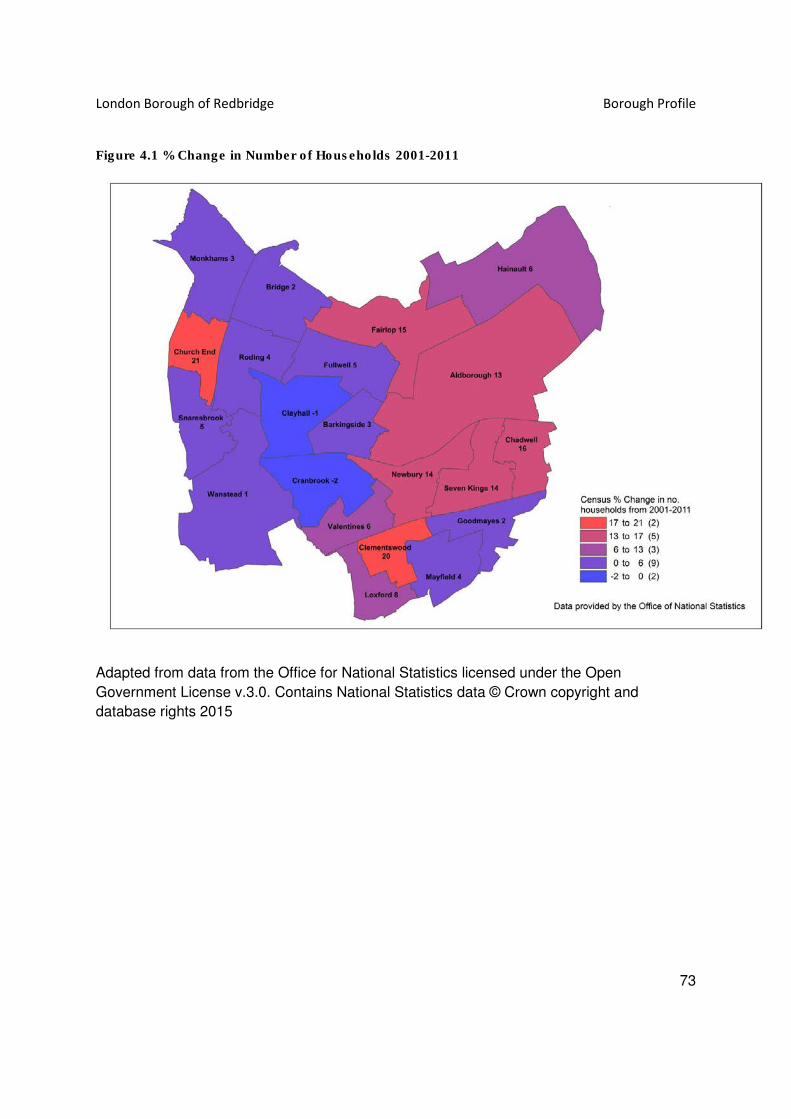
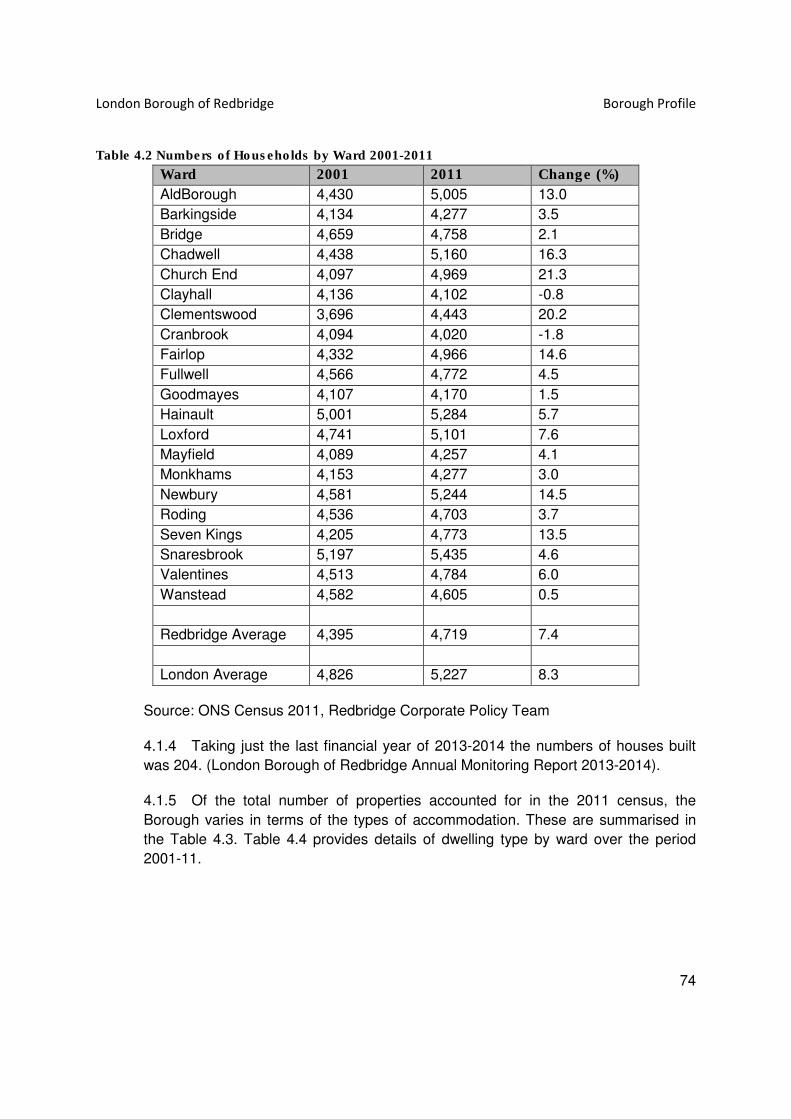
4.1.3 The number of housing units has increased by 8.3 % between 2001 and
2011. This is illustrated by Figure 4.1 and Table 4.2.
London Borough of Redbridge Borough Profile
73
Figure 4.1 % Change in Number of Households 2001-2011
Adapted from data from the Office for National Statistics licensed under the Open
Government License v.3.0. Contains National Statistics data © Crown copyright and
database rights 2015
London Borough of Redbridge Borough Profile
74
Table 4.2 Numbers of Households by Ward 2001-2011
Ward 2001 2011 Change (%)
AldBorough 4,430 5,005 13.0
Barkingside 4,134 4,277 3.5
Bridge 4,659 4,758 2.1
Chadwell 4,438 5,160 16.3
Church End 4,097 4,969 21.3
Clayhall 4,136 4,102 -0.8
Clementswood 3,696 4,443 20.2
Cranbrook 4,094 4,020 -1.8
Fairlop 4,332 4,966 14.6
Fullwell 4,566 4,772 4.5
Goodmayes 4,107 4,170 1.5
Hainault 5,001 5,284 5.7
Loxford 4,741 5,101 7.6
Mayfield 4,089 4,257 4.1
Monkhams 4,153 4,277 3.0
Newbury 4,581 5,244 14.5
Roding 4,536 4,703 3.7
Seven Kings 4,205 4,773 13.5
Snaresbrook 5,197 5,435 4.6
Valentines 4,513 4,784 6.0
Wanstead 4,582 4,605 0.5
Redbridge Average 4,395 4,719 7.4
London Average 4,826 5,227 8.3
Source: ONS Census 2011, Redbridge Corporate Policy Team
4.1.4 Taking just the last financial year of 2013-2014 the numbers of houses built
was 204. (London Borough of Redbridge Annual Monitoring Report 2013-2014).
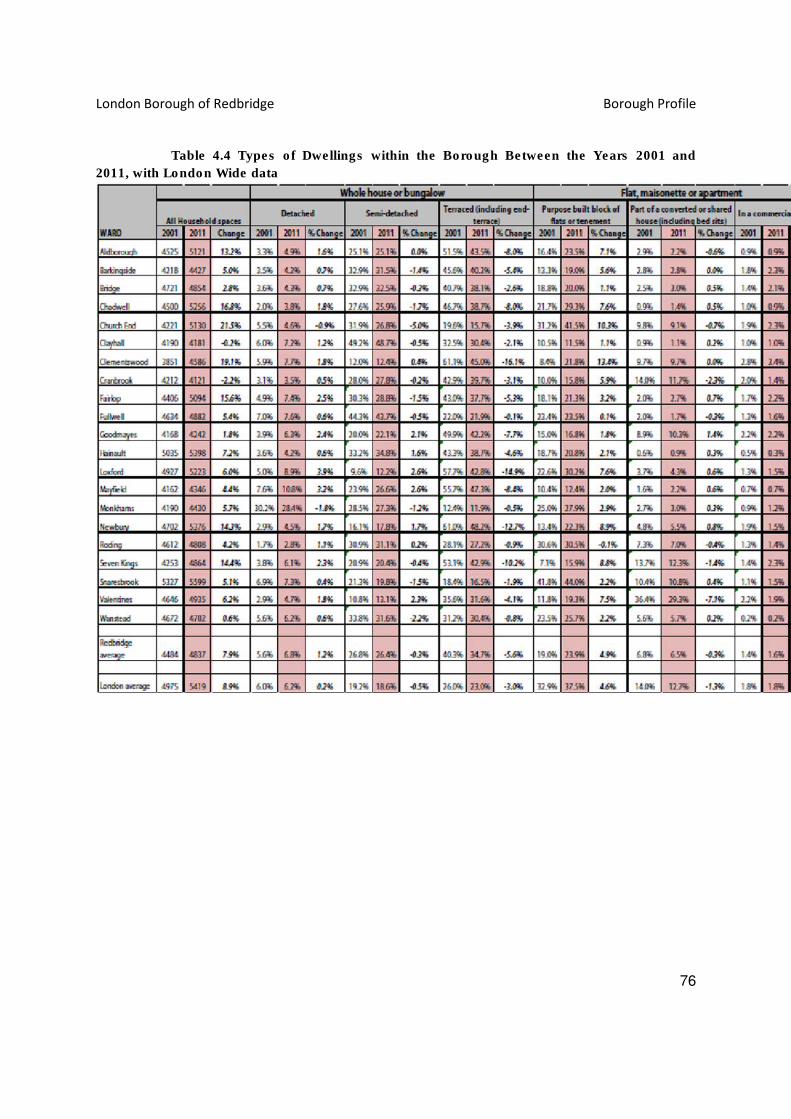
4.1.5 Of the total number of properties accounted for in the 2011 census, the
Borough varies in terms of the types of accommodation. These are summarised in
the Table 4.3. Table 4.4 provides details of dwelling type by ward over the period
2001-11.

London Borough of Redbridge Borough Profile
75
Table 4.3 Redbridge, London and National Distribution of Dwelling Types
Dwelling Type Percentage
within
Redbridge
Number
within
Redbridge
Number
within
London
Number
within
England
Total 99,105 3,266,173 22,063,368
Unshared dwelling total 99.7 % 98,787 3,230,665 21,985,413
Total numbers of unshared
dwellings, of which are:
- Detached:
- Semi-detached:
- Terraced (including end of
terrace)
68.3 %
6.8 %
26.6 %
35 %
67,736
6,774
26,384
34,578
1,179,008
205,088
617,324
756,596
17,235,610
4,949,216
6,889,935
5,396,459
Total number of flats,
maisonette or apartment, of
which are:
- Purpose built flats or
tenement:
- Part of a converted or shared
house (including bed sits)
-In commercial building:
31.3 %
23.7 %
6.2 %
1.4 %
30,986
23,462
6,122
1,402
1,649,118
1,211,075
382,826
55,217
4,668,839
3,624,359
834,083
210,397
Total number of flats unshared
/dwelling caravan or other
mobile or temporary structure:
0.1 % 65 2,539 80,964
Shared dwelling: 0.3 % 318 35,508 77,955
Source: The total percentage of housing stock in accordance with housing type, based on
ONS data collated in 2011 as well as data compiled from the NOMIS (last updated in 2011).
London Borough of Redbridge Borough Profile
76
Table 4.4 Types of Dwellings within the Borough Between the Years 2001 and
2011, with London Wide data

London Borough of Redbridge Borough Profile
77
4.1.6 Statistics taken from the ordinance survey map shows that the average
density per hectare is 49.5 units per hectare. The variation in density is shown in
Figure 4.2.
Figure 4.2 Dwellings per Hectare by Local Super Output Area
© Crown copyright and database rights 2015 Ordnance Survey. LB Redbridge 100017755

London Borough of Redbridge Borough Profile
78
4.1.7 Figure 4.3 shows the spatial distribution of housing types across the Borough. It can
be understood from the map and also exemplified by the statistics that the most
prominent house type are terrace properties which are predominantly located to the
south of the Borough. With the least prominent being the Houses in Multiple
Occupation and other house types (that include caravan or other mobile temporary
structure), which cannot be clearly defined on the Borough map in graphical terms as
they are not strictly situated in one particular region.
Figure 4.3 Spatial Distribution of Housing Types across the Borough
© Crown copyright and database rights 2015 Ordnance Survey. LB Redbridge 100017755
Source: Redbridge Characterisation Study, House Type
London Borough of Redbridge Borough Profile
79
4.1.8 The number of empty properties recorded from council tax records in October
2013 was 1,513 homes an increase from 930 in 2012/2013. At 1.51% of the housing
stock this is the lowest empty homes rate of the East London Boroughs. (London
Borough of Redbridge Annual Monitoring Report, 2013-2014).
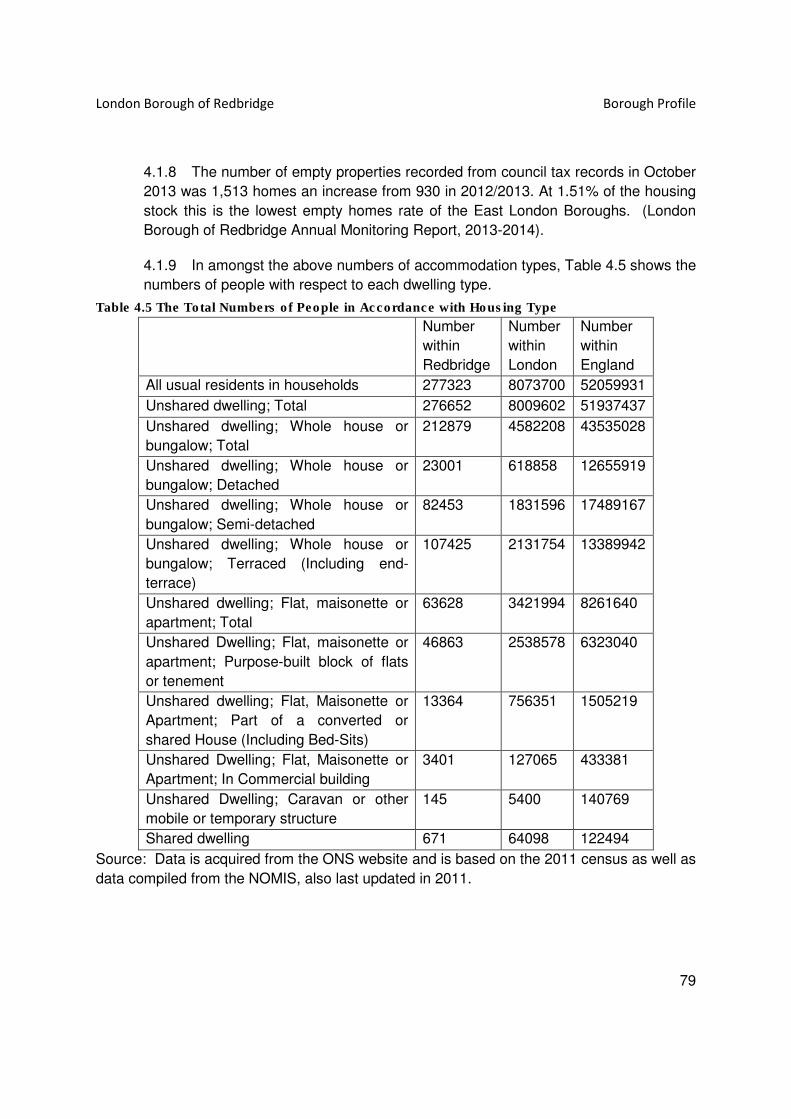
4.1.9 In amongst the above numbers of accommodation types, Table 4.5 shows the
numbers of people with respect to each dwelling type.
Table 4.5 The Total Numbers of People in Accordance with Housing Type
Number
within
Redbridge
Number
within
London
Number
within
England
All usual residents in households 277323 8073700 52059931
Unshared dwelling; Total 276652 8009602 51937437
Unshared dwelling; Whole house or
bungalow; Total
212879 4582208 43535028
Unshared dwelling; Whole house or
bungalow; Detached
23001 618858 12655919
Unshared dwelling; Whole house or
bungalow; Semi-detached
82453 1831596 17489167
Unshared dwelling; Whole house or
bungalow; Terraced (Including end-
terrace)
107425 2131754 13389942
Unshared dwelling; Flat, maisonette or
apartment; Total
63628 3421994 8261640
Unshared Dwelling; Flat, maisonette or
apartment; Purpose-built block of flats
or tenement
46863 2538578 6323040
Unshared dwelling; Flat, Maisonette or
Apartment; Part of a converted or
shared House (Including Bed-Sits)
13364 756351 1505219
Unshared Dwelling; Flat, Maisonette or
Apartment; In Commercial building
3401 127065 433381
Unshared Dwelling; Caravan or other
mobile or temporary structure
145 5400 140769
Shared dwelling 671 64098 122494
Source: Data is acquired from the ONS website and is based on the 2011 census as well as
data compiled from the NOMIS, also last updated in 2011.

London Borough of Redbridge Borough Profile
80
4.1.10 It is also important to note that properties within Redbridge have mean
property values that are below the London average but are higher than the national
average for all types of dwellings . Details of specific types of ownership, dwelling
types, are shown in Table 4.6 (NOMIS, 2009).

London Borough of Redbridge Borough Profile
81
Table 4.6 Changes in Dwelling Ownership by Transaction type, 2009 (£)
Number
within
Redbridge
Number
within
London
Number
within
England
Transactions by Dwelling Type; Total Sales 2506 74977 586894
Transactions by Dwelling Type; Detached 101 3602 138715
Transactions by Dwelling Type; Flat 893 37087 110676
Transactions by Dwelling Type; Semi-detached 430 12135 168854
Transactions by Dwelling Type; Terraced 1081 22135 168427
Transactions by Dwelling Type; Not Known 1 18 222
Type of Sale; Cash 585 19606 186938
Type of Sale; Cash 23.3 26.1 31.9
Type of Sale; Mortgage 1921 55371 399956
Type of Sale; Mortgage 76.7 73.9 68.1
Price Indicators for All Dwellings; Two
Percentile
107000 110000 56000
Price Indicators for All Dwellings; Lower
Quartile
175000 195167 123000
Price Indicators for All Dwellings; Median 230000 250000 170000
Price Indicators for All Dwellings; Upper
Quartile
300000 390000 247000
Price Indicators for All Dwellings; Ninety eight
Percentile
654300 1400000 715000
Price Indicators for All Dwellings; Mean 256857 363043 216493
Price Indicators by Dwelling Type; Detached -
Median
499950 493500 249995
Price Indicators by Dwelling Type; Detached -
Mean
537078 682414 314681
Price Indicators by Dwelling Type; Flat -
Median
170000 240000 150000
Price Indicators by Dwelling Type; Flat - Mean 179514 310228 197370
Price Indicators by Dwelling Type; Semi-
detached - Median
305000 295000 160000
Price Indicators by Dwelling Type; Semi-
detached - Mean
332846 385784 188212
Price Indicators by Dwelling Type; Terraced -
Median
247500 250000 143500
Price Indicators by Dwelling Type; Terraced -
Mean
264468 387082 176539
Number of Outliers; less than £1000 0 0 4
Number of Outliers; less than £10000 0 2 20

London Borough of Redbridge Borough Profile
82
Number of Outliers; more than £20m 0 1 1
Source: Land Registry
London Borough of Redbridge Borough Profile
83
Type of Ownership
4.1.11 By looking at Tables 4.5 and 4.6 it can be seen that the most common type of
accommodation are unshared terrace (34.9 %) properties. Of the overall number of
dwelling types with the highest percentage of ownership was for ownership with a
mortgage or loan (35.4%). With the least common type of permanent accommodation
being occupation of commercial building (1.4 %). And the least common type of
ownership of the total being private rented accommodation where the residential
accommodation is provided by the employer.
4.1.12 If looking at the type of ownership in detail, Redbridge saw a decrease in the
proportion of households living in terraced housing and an increase in those living in
purpose-built flats since 2001. However, residents were more likely to live in houses
and less likely to live in flats that the London average.
4.1.13 The proportion of flats of total household being referred to above is depicted
in Figure 4.4.

London Borough of Redbridge Borough Profile
84
Figure 4.4 Proportion of Flats of Total Households
© Crown copyright and database rights 2015 Ordnance Survey. LB Redbridge 100017755
Source: London Borough of Redbridge, Percentage of flats to household per LSOA.

London Borough of Redbridge Borough Profile
85

London Borough of Redbridge Borough Profile
86
4.1.14 There has been a decline in the number of residents living in a communal
establishment in the Borough (These are facilities that provide managed residential
accommodation, such as hospitals and care homes, sheltered housing with shared
kitchens and hotels). In 2011, 1,647 people lived in a communal establishment, a
decrease of 2,462 of people from 2001.
4.1.15 In Redbridge, ownership with a mortgage or loan decreased by more than 9
percentage points. This was a similar trend for London where ownership with a
mortgage or loan fell by seven percentage points from 34% in 2001 to 27% in 2011.
Redbridge ranked 6th highest in terms of the reduction of ownership with a mortgage
or loan of all London Boroughs to just under 6 thousand households.
4.1.16 Renting with private landlords or letting agency increased in Redbridge by the
same margin of more than 9 percentage points. Again, this was a similar trend for
London where renting with private landlords or letting agency increased by 10
percentage points from 14% in 2001 to 24% in 2011. Therefore, this means an
overall decrease in people renting their accommodation from the Council. Figures 4.5
and 4.6 show household tenure across the Borough. Figure 4.5 shows the properties
which are part owned and part rented. Figure 4.6 shows the percentage of privately
rented properties.
Figure 4.5 Percentages of Part Owned/Part Rented Properties by Lower Super Output Area

London Borough of Redbridge Borough Profile
87
© Crown copyright and database rights 2015 Ordnance Survey. LB Redbridge 100017755
Source: Redbridge Characterisation Study, Percentage of part owned part rented.
Figure 4.6 Percentages of Privately Rented Properties by Lower Super Output Area
© Crown copyright and database rights 2015 Ordnance Survey. LB Redbridge 100017755
Source: Redbridge characterisation study, percentage of socially rented properties.
4.1.17 Figure 4.7 shows the 2015 rank percentage of multiple deprivation by Lower
Super Output area. Eleven Lower Super Output Areas within Redbridge fall within the
most deprived 20% of LSOAs across England and Wales. At the other extreme, a
different 11 LSOAs in Redbridge fall among the least deprived 20% of LSOAs across
England and Wales.

London Borough of Redbridge Borough Profile
88
Figure 4.7 Rank of Multiple Deprivation – Percentage Indices by Lower Super Output Area,
2015

London Borough of Redbridge Borough Profile
89
Adapted from data from the Office for National Statistics licensed under the Open
Government License v.3.0. Contains National Statistics data © Crown copyright and
database rights 2015
Temporary Accommodation and Gypsies and Travellers Sites
4.1.18 There were around 2,171 households in temporary accommodation in
Redbridge as at August 2014. (London Borough of Redbridge, Annual Monitoring
Report 2013 - 2014).
4.1.19 A provision of 16 pitches was made for gypsies and travellers. (London
Borough of Redbridge, Annual Monitoring Report 2013 - 2014).
4.1.20 The document has identified a number of key points: These are the physical
attributes of the Borough, the people living within the Borough and the types of
houses that are primarily occupied within the Borough. The text that follows looks
further into the existing housing stock and seeks to define the make-up of
households in detail, and household composition.
Household Composition
4.1.21 From looking at recent trends of household composition from the 2001
Census it can be seen that in amongst all the various types of households the overall
number of people residing within the Borough has increased. Family sizes and the
one person households have also increased. One person households accounted for
approximately one quarter (25.2 %) of Redbridge households with a total of 99,105,
which is below the London average 101,931. With the highest proportion of one
person households being situated in the Snaresbrook and Monkhams wards.
Furthermore, lone parent households in Redbridge with dependent children
increased by nearly two percentage points (from 3.6 % to 8.3 %) between the
census. However compared with the London average (8.6 %), Redbridge was slightly
lower. With the Loxford ward at 16.6 %, which is the third highest in amongst all
wards in London.
4.1.22 There have been changes to household composition within the Borough.
23.3% of Redbridge households consisted of a married or same sex civil partnership
or cohabiting couple with dependent children. This was higher than the London
average, which was 17.8 %. With Newbury raking the fifth highest of all London
wards at 28.2 %, and other wards of Clayhall, AldBorough, Chadwell, Clementswood,
Mayfield and Valentines.

London Borough of Redbridge Borough Profile
90
4.1.23 Figure 4.8 shows housing occupancy levels in terms of residents per
household. Average household size increased to 2.8 persons per household. With
wards to the south of the Borough, having the highest number of people per
household, exceeding the average figure for London, which is 2.5 persons per
household. The Clementswood ward has the highest rate of 3.3 person per
household in the Borough with the lowest being the Snaresbrook ward, with 2.2
persons per household.

London Borough of Redbridge Borough Profile
91
Figure 4.8 Housing Occupancy Levels – Residents per Household by LSOA, 2001
© Crown copyright and database rights 2015 Ordnance Survey. LB Redbridge 100017755
Source: London Borough of Redbridge, Housing Occupancy Levels.

London Borough of Redbridge Borough Profile
92
4.1.24 Figure 4.9 shows the average household sizes in the Borough in 2011. The
map shows that there would be some parts of the Borough which would be of low
density to the north and the west of the Borough.
Figure 4.9 Housing Occupancy Levels by LSOA in 2011
© Crown copyright and database rights 2015 Ordnance Survey. LB Redbridge 100017755
Source: London Borough of Redbridge, Housing Occupancy Levels.
London Borough of Redbridge Borough Profile
93
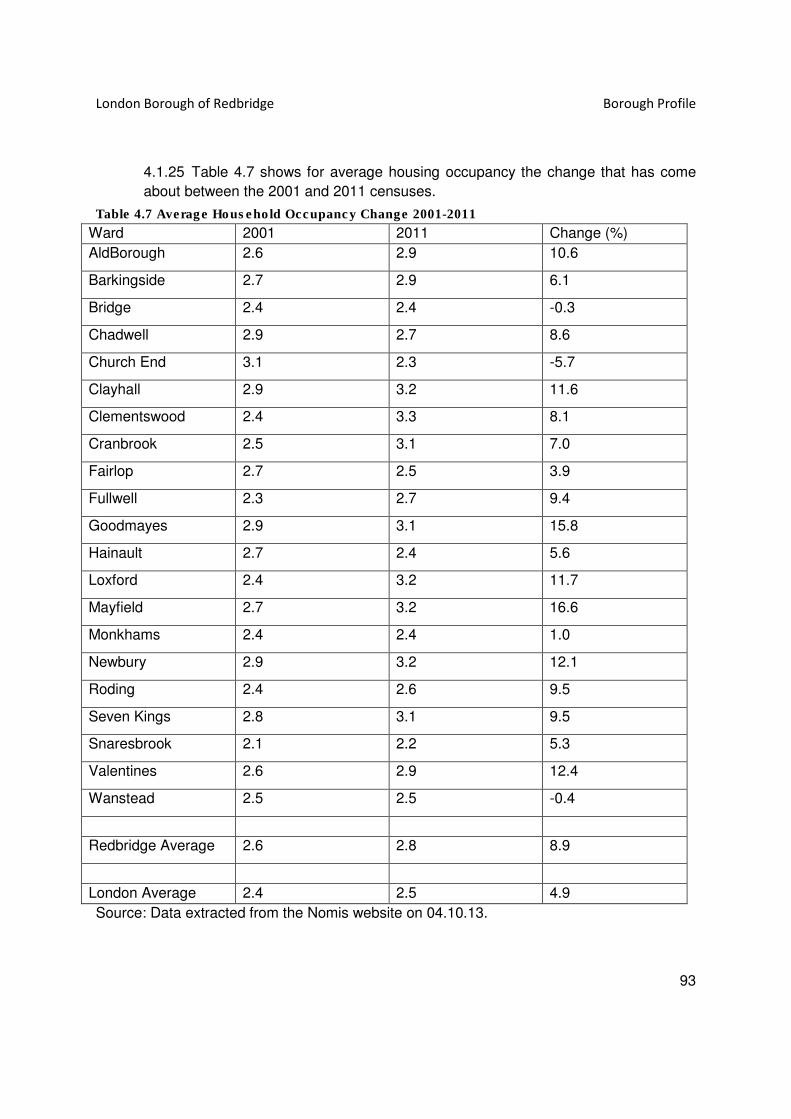
4.1.25 Table 4.7 shows for average housing occupancy the change that has come
about between the 2001 and 2011 censuses.
Table 4.7 Average Household Occupancy Change 2001-2011
Ward 2001 2011 Change (%)
AldBorough 2.6 2.9 10.6
Barkingside 2.7 2.9 6.1
Bridge 2.4 2.4 -0.3
Chadwell 2.9 2.7 8.6
Church End 3.1 2.3 -5.7
Clayhall 2.9 3.2 11.6
Clementswood 2.4 3.3 8.1
Cranbrook 2.5 3.1 7.0
Fairlop 2.7 2.5 3.9
Fullwell 2.3 2.7 9.4
Goodmayes 2.9 3.1 15.8
Hainault 2.7 2.4 5.6
Loxford 2.4 3.2 11.7
Mayfield 2.7 3.2 16.6
Monkhams 2.4 2.4 1.0
Newbury 2.9 3.2 12.1
Roding 2.4 2.6 9.5
Seven Kings 2.8 3.1 9.5
Snaresbrook 2.1 2.2 5.3
Valentines 2.6 2.9 12.4
Wanstead 2.5 2.5 -0.4
Redbridge Average 2.6 2.8 8.9
London Average 2.4 2.5 4.9
Source: Data extracted from the Nomis website on 04.10.13.

London Borough of Redbridge Borough Profile
94
4.1.26 As can be seen from the above statistics and graphs the average household
occupancy levels have increased between the censuses. In addition to this data,
statistics taken from the NOMIS website demonstrates that in the year 2001 the
percentage overcrowding was 46.5 % and the percentage of under crowding was 11.3
% with 42.8 % of housing being up to capacity. By comparison, the 2011 percentage
rate of overcrowding was at 16.8 % with 61.0 % of households being under occupied
with 22% being up to capacity. The general trend between these censuses
demonstrate an overall increase in the levels of overcrowding and under crowding,
with the level of under occupied housing raising at a higher rate of 18 % between
censuses.
4.1.27 It is important to note that during this year 2012/13 there were 549 long-term empty
homes in Redbridge with vacancy of longer than 6 months, comprising of 0.54 % of the
stock (information acquired from Council tax data).
4.2 Future Change and Policy Review
4.2.1
4.2.2 From the changes to the numbers in households, the type of housing and tenements,
there is a net housing requirement (surplus), a summary of five year housing
requirements by tenure type, as cited in the London Borough of Redbridge Annual
Monitoring Report 2013-2014, originally sourced from ORS Housing Market Model,
2010. See Table 4.8.
Table 4.8 Expectations of housing need/capacity and supply
London Borough of Redbridge Borough Profile
95
4.2.3 The Council as part of the London Wide Strategic Land Availability
Assessment have been able to identify housing capacity for 12,636 units on large
sites within the Borough. The Further Alterations of the London Plan states the
following revised figures further to the SHLAA process, which demonstrate a
minimum ten year figure of 11,232 and an Annual Monitoring Target of 1,123
between the years of 2012/2025. (Page 91 of the London Plan Further Alterations).
See Table 4.9.
Table 4.9 Housing Targets for London Boroughs from London Plan

London Borough of Redbridge Borough Profile
96
4.2.4 The target for net additional dwellings per annum in Redbridge was 760
between 2009/10 to 2014/15 from 2015/16 onwards, Redbridge’s target will increase
to 1,260 dwellings per annum. The number of net additional dwellings achieved per
year as given in the Annual Monitoring Reports are:
09/10: 885
10/11: 348
11/12: 515
12/13: 273

London Borough of Redbridge Borough Profile
97
13/14: 204
4.2.5 The increasing population numbers in Redbridge are not yet being matched
by an increase in the supply of new housing units.
4.2.6 The gap between housing need and supply is illustrated in Figure 4.10 which
shows that the SHLAA development trajectory in Redbridge provides insufficient new
dwellings to keep pace with recent population trends.
Figure 4.10 Difference in projected populations between SHLAA and Trend based projections
Source: London Borough of Redbridge, Community Infrastructure Plan 2015-2030, originally
sourced from GLA Intelligence update- 05/2013.
London Borough of Redbridge Borough Profile
98
Housing Completions
4.2.7 There is a need to measure the type and tenure mix of completions in order to
understand the actual level of housing provision made as compared to the
requirement. In accordance with figures recorded in the London Development
Database and further cited in the Council’s Annual Monitoring Report, 2013 - 2014,
since the year 2010/2011: the following figures should be noted. Trends demonstrate
that the total number of units in 10/11 were 348, in 11/12 there were 515 units and
this figure declined to a total of 271 units in 2012/2013 with a further decline in
2013/14 to 204 units.
4.2.8 The National Planning Policy Framework, in the chapter entitled, “delivering a
wide choice of high quality homes” states, that to boost significantly the supply of
housing, Local Planning Authorities should use their evidence base to ensure that
their Local Plan meets the full and objectively assessed needs for market and
affordable housing in the housing market area, as far as is consistent with the
policies set out in this framework, including identifying key sites, which are critical to
the delivery of the housing strategy over the plan period.
4.2.9 At a regional context the London Plan Further Alterations sets out annual
minimum housing targets for each Borough until 2026, in recognising the need for
more homes in London to help boost the supply of housing. These targets are
informed by the need for housing as evidence by the GLA’s 2013 Strategic Housing
Market Assessment (SHMA) and London’s housing land capacity as identified
through its 2013 Strategic Housing Land Availability Assessment (SHLAA).
Consistent with the National Planning Policy Framework, this approach takes into
account of London’s locally distinct circumstances of pressing housing need and
limited land availability and aims to deliver sustainable development.

London Borough of Redbridge Borough Profile
99

London Borough of Redbridge Borough Profile
100
5 Health and Wellbeing
5.1 The Current Situation
Life Expectancy
5.1.1 According to the 2001 Census, a lower percentage of residents of Redbridge
(1.1%) consider themselves to be in very bad health than residents across London
(1.2%) and England and Wales (1.3%). Using life expectancy as the best overall
objective measure of health, the health of Redbridge residents has steadily improved
over time. As can be seen in Figures 5.1 and 5.2 male residents have a life
expectancy of 80.7 years up from 74.6 years in 1991-1993. Female residents have a
life expectancy of 84.2 years up from 80.2 years in 1991 - 1993.
Source: Life Expectancy at Birth, Office for National Statistics, November 2014
Figure STYLEREF 1 \s 5. SEQ Figure \* ARABIC \s 1 1 Life Expectancy at Birth for Male
Residents of Redbridge, London and England from 1991 to 2013

London Borough of Redbridge Borough Profile
101
Source: Life Expectancy at Birth, Office for National Statistics, November 2014
5.1.2 Male residents of Redbridge have a longer life expectancy than males living
in London and England overall. Female residents of Redbridge have a similar life
expectancy to females living in London overall but longer than females living in
England overall.
5.1.3 Women continue to outlive men but life expectancy has increased more for
male residents than female residents. In 2011-13 male life expectancy was 80.7
years and for females was 84.2years, but the gap of 3.5 years in 2011-2013 had
narrowed from 5.6 years back in 1991-1993. Life expectancy also varies with where
people live. Life expectancy is 5.7 years lower for men in the most deprived areas of
Redbridge than in the least deprived areas and the difference for women is 2.1 years.
Deprivation in Redbridge compared to England can be seen in Figure 5.3
Figure STYLEREF 1 \s 5. SEQ Figure \* ARABIC \s 1 2 Life Expectancy at Birth for Female
Residents of Redbridge, London and England from 1991 to 2013

London Borough of Redbridge Borough Profile
102
Figure 5.3 Deprivation in Redbridge and England by Quintile
Source: Redbridge Health Profile 2015 (Public Health England)
5.1.4 Census results also back up the above picture of unequal outcomes across
the Borough. The wards of Clayhall, Clementswood, Loxford, Mayfield and Newbury
are all ranked within the highest five per cent of London wards for the proportion of
households with dependent children where one person had a long-term health
problem or disability. At 10.8 %, Hainault was in the highest 4 % of London wards for
the proportion of people aged 16 to 64 with activity limitations.
Major Diseases Causing Premature Death
Cardiovascular disease
5.1.5 Cardiovascular disease (which includes coronary heart disease and stroke) is
the leading cause of premature death. Coronary heart disease is continuing to
steadily decline as a cause of premature death, although men are twice as likely to
die from it as are women.
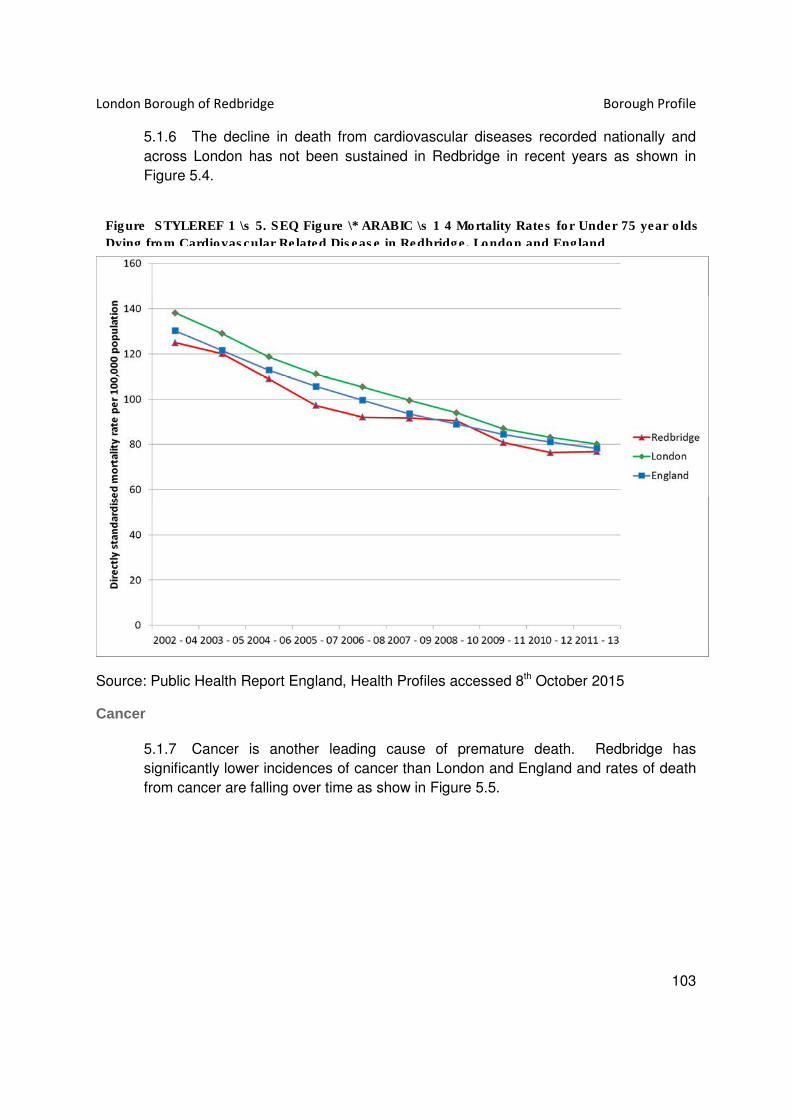
London Borough of Redbridge Borough Profile
103
5.1.6 The decline in death from cardiovascular diseases recorded nationally and
across London has not been sustained in Redbridge in recent years as shown in
Figure 5.4.
Source: Public Health Report England, Health Profiles accessed 8th October 2015
Cancer
5.1.7 Cancer is another leading cause of premature death. Redbridge has
significantly lower incidences of cancer than London and England and rates of death
from cancer are falling over time as show in Figure 5.5.
Figure STYLEREF 1 \s 5. SEQ Figure \* ARABIC \s 1 4 Mortality Rates for Under 75 year olds
Dying from Cardiovascular Related Disease in Redbridge, London and England

London Borough of Redbridge Borough Profile
104
Source: Public Health Report England, Health Profiles accessed 8th October 2015
Preventative Measures
Figure STYLEREF 1 \s 5. SEQ Figure \* ARABIC \s 1 5 Mortality Rates for under 75 Year Olds
Dying from Cancer Related Disease in Redbridge, London and England

London Borough of Redbridge Borough Profile
105
Screening
5.1.8 Early detection through screening of some common types can significantly
improve outcomes for cancer sufferers. Screening for breast cancer in women aged
53-70 years has steadily risen to reach 73.9% in 2014.
5.1.9 Screening for cervical cancer reached a high point of 77.6% of women aged
25-64 years in 2008/2009 but has since tailed off to 71.2% in 2014. The national
programme of bowel cancer screening for all people aged 60-69 years was first
implemented locally in 2007. Uptake reached a high point of only 48% in 2010 and
then fell to 44.6% in 2011.
Immunisation
5.1.10 Childhood immunisation is a critical part of the public health response to a
range of communicable diseases. Immunisation rates are shown below (Figure 5.6)
for common vaccines used to prevent whooping cough, diphtheria, tetanus, polio,
meningococcal serogroup C, haemophillus influenza B, measles, mumps, rubella and
pneumococcal disease.
Figure 5.6 Percentage of Redbridge Children Immunised by their 5th Birthday
Source: Health and Social Care Information Centre downloaded 30th October 2015
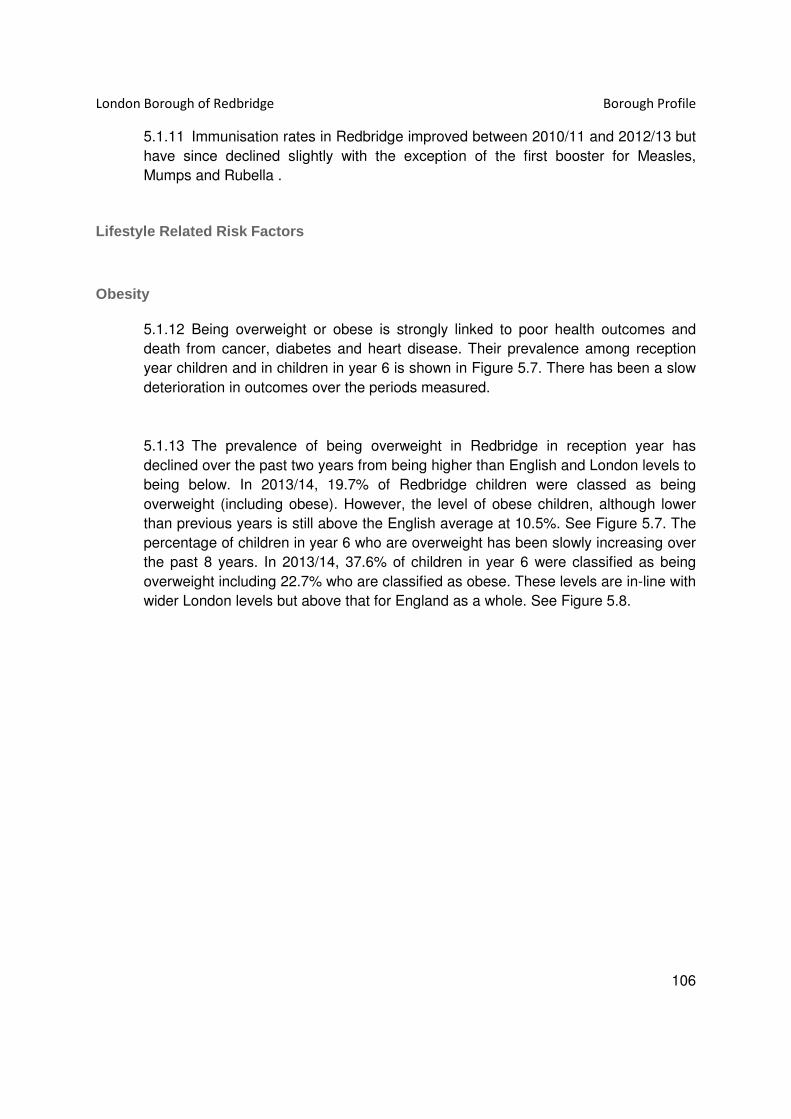
London Borough of Redbridge Borough Profile
106
5.1.11 Immunisation rates in Redbridge improved between 2010/11 and 2012/13 but
have since declined slightly with the exception of the first booster for Measles,
Mumps and Rubella .
Lifestyle Related Risk Factors
Obesity
5.1.12 Being overweight or obese is strongly linked to poor health outcomes and
death from cancer, diabetes and heart disease. Their prevalence among reception
year children and in children in year 6 is shown in Figure 5.7. There has been a slow
deterioration in outcomes over the periods measured.
5.1.13 The prevalence of being overweight in Redbridge in reception year has
declined over the past two years from being higher than English and London levels to
being below. In 2013/14, 19.7% of Redbridge children were classed as being
overweight (including obese). However, the level of obese children, although lower
than previous years is still above the English average at 10.5%. See Figure 5.7. The
percentage of children in year 6 who are overweight has been slowly increasing over
the past 8 years. In 2013/14, 37.6% of children in year 6 were classified as being
overweight including 22.7% who are classified as obese. These levels are in-line with
wider London levels but above that for England as a whole. See Figure 5.8.

London Borough of Redbridge Borough Profile
107
Source: Public Health Report England, Health Profiles accessed 12th October 2015
Figure STYLEREF 1 \s 5. SEQ Figure \* ARABIC \s 1 7 The Percentage of Children in
Reception Year and Year 6 Who Are Overweight (Including Obese) in Redbridge, London
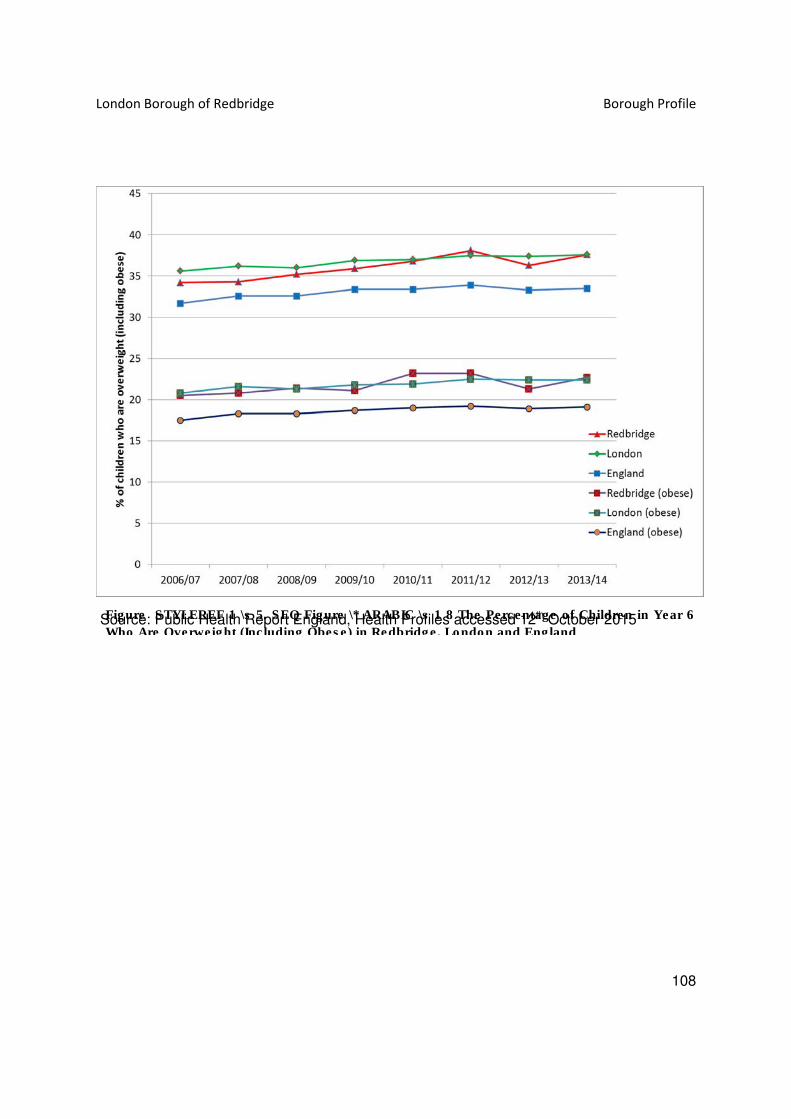
London Borough of Redbridge Borough Profile
108
Source: Public Health Report England, Health Profiles accessed 12th October 2015 Figure STYLEREF 1 \s 5. SEQ Figure \* ARABIC \s 1 8 The Percentage of Children in Year 6
Who Are Overweight (Including Obese) in Redbridge, London and England

London Borough of Redbridge Borough Profile
109
5.1.14 In 2012, 55.4% of Redbridge adult residents are overweight compared with
57.3% of London residents and 63.8% of British residents. Of these 20.5% were
classified as obese in Redbridge compared with 19.6% of London residents and 23%
of British residents
Smoking
5.1.15 In 2013 an estimated 13.5% of Redbridge adults smoked and the
standardised rate of smoking related deaths was 220 per 100,000 population.. This
was significantly lower than the national average of 289 per 100,000 population. The
crude rate of adults successfully quitting smoking confirmed by biochemical
validation was 71.8%, slightly higher than the London and England rates of 70.1%. 2
Alcohol
5.1.16 Excessive alcohol consumption appears less of a problem in Redbridge than
it does across England as a whole. The alcohol-specific mortality rate for males in
Redbridge was 10.6 per 100,000 and for females 1.9 per 100,000 residents.
Nevertheless alcohol remains a significant cause of ill health. In 2012 there were
1,168 hospital stays for alcohol related harm in Redbridge adults and 15 stays for
under 18 year olds3.
Environmental Factors: Air Quality
5.1.17 Despite declines in air pollution from most sources across London, levels of
nitrogen dioxide and particulate matter continue to have a major impact on public
health. Emissions of these pollutants are largely associated with road transport as is
immediately evident from Figures 5.9 and 5.10
Figure 5.9 Nitrogen Dioxide Levels in Redbridge, 2011
2 Public Health Report England, Health Profiles accessed 12
th October 2015
3 Public Health Report England, Health Profiles accessed 12
th October 2015
London Borough of Redbridge Borough Profile
110
Source: Air Quality in Redbridge: A Guide for Public Health Professionals (Mayor of London
2012)
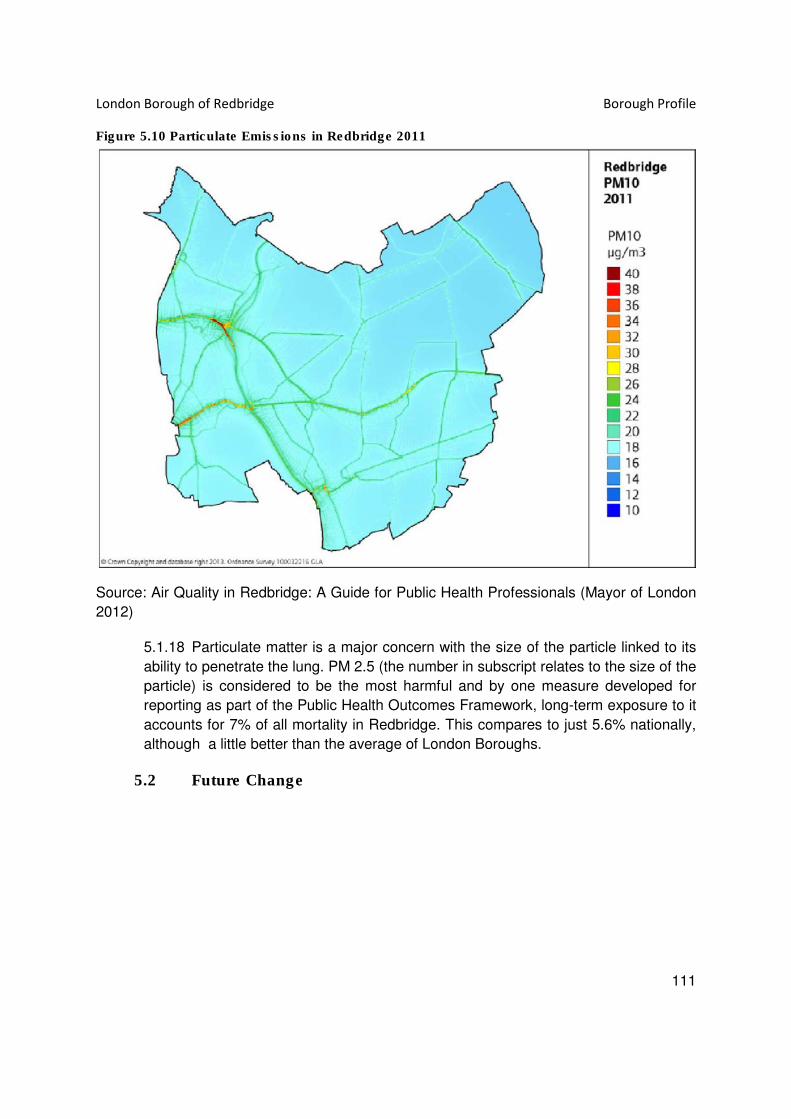
London Borough of Redbridge Borough Profile
111
Figure 5.10 Particulate Emissions in Redbridge 2011
Source: Air Quality in Redbridge: A Guide for Public Health Professionals (Mayor of London
2012)
5.1.18 Particulate matter is a major concern with the size of the particle linked to its
ability to penetrate the lung. PM 2.5 (the number in subscript relates to the size of the
particle) is considered to be the most harmful and by one measure developed for
reporting as part of the Public Health Outcomes Framework, long-term exposure to it
accounts for 7% of all mortality in Redbridge. This compares to just 5.6% nationally,
although a little better than the average of London Boroughs.
5.2 Future Change

London Borough of Redbridge Borough Profile
112
Delivering Healthy Outcomes
5.2.1 The Redbridge Health and Wellbeing Board (established under the Health
and Social Care Act 2012) brings together a range of public services including adult
social services, GPs, public health, children’s services, housing and community
safety organisations. It has produced the Redbridge Health and Wellbeing Strategy
2013-2016, Joint Strategic Needs Assessment 2012 and the Pharmaceutical Needs
Assessment. These identify what services are needed to improve people’s health
and set the local framework for the commissioning of healthcare, social care, public
health services and other Council services. Social care and health partners across
Redbridge, Barking and Dagenham and Havering also work together to improve
services for local people.
5.3 Policy Review
5.3.1 The priorities of the Redbridge Health and Wellbeing Board are set out in
Table 5.1.

London Borough of Redbridge Borough Profile
113
Table 5.1 Redbridge Health and Wellbeing Board Priorities 2013 – 2016
Source: NHS and London Borough of Redbridge, Health and Wellbeing Strategy 2013 -
2016

London Borough of Redbridge Borough Profile
114
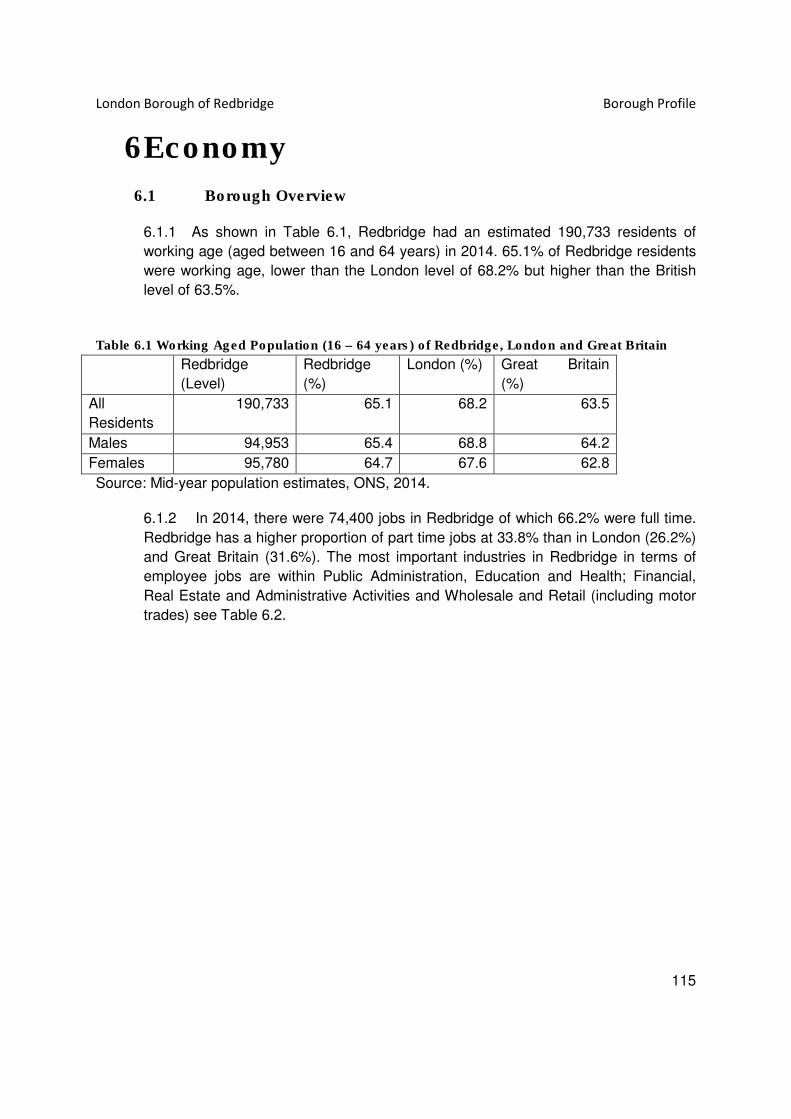
London Borough of Redbridge Borough Profile
115
6 Economy
6.1 Borough Overview
6.1.1 As shown in Table 6.1, Redbridge had an estimated 190,733 residents of
working age (aged between 16 and 64 years) in 2014. 65.1% of Redbridge residents
were working age, lower than the London level of 68.2% but higher than the British
level of 63.5%.
Table 6.1 Working Aged Population (16 – 64 years) of Redbridge, London and Great Britain
Redbridge
(Level)
Redbridge
(%)
London (%) Great Britain
(%)
All
Residents
190,733 65.1 68.2 63.5
Males 94,953 65.4 68.8 64.2
Females 95,780 64.7 67.6 62.8
Source: Mid-year population estimates, ONS, 2014.
6.1.2 In 2014, there were 74,400 jobs in Redbridge of which 66.2% were full time.
Redbridge has a higher proportion of part time jobs at 33.8% than in London (26.2%)
and Great Britain (31.6%). The most important industries in Redbridge in terms of
employee jobs are within Public Administration, Education and Health; Financial,
Real Estate and Administrative Activities and Wholesale and Retail (including motor
trades) see Table 6.2.

London Borough of Redbridge Borough Profile
116
Table 6.2 Employee Jobs by Industry in Redbridge
Redbridge London Great Britain
Number % % %
Agriculture And
Mining)
0 0.0 0.1 0.4
Energy And
Water
200 0.3 0.5 1.1
Manufacturing 1,800 2.4 2.4 8.5
Construction 4,000 5.4 3.1 4.5
Wholesale And
Retail, Including
Motor Trades
11,800 15.9 12.6 15.9
Transport
Storage
2,700 3.7 4.8 4.5
Accommodation
and Food
Services
4,200 5.7 7.6 7.1
Information And
Communication
4,000 5.4 7.9 4.1
Financial And
Other Business
Services
14,700 19.8 33.0 22.2
Public Admin,
Education And
Health
27,400 36.8 23.0 27.4
Other Services 3,500 4.7 5.1 4.4
Source: ONS, Business Register and Employment Survey 2014
6.1.3 In 2015, there were 11,575 businesses operating in Redbridge of which only
20 were large employers (employing more than 250 employees) see Table 6.3. The
industries with the largest number of companies in Redbridge fall within the
Professional, scientific and technical services, Information and Communication and
Construction see Table 6.4.
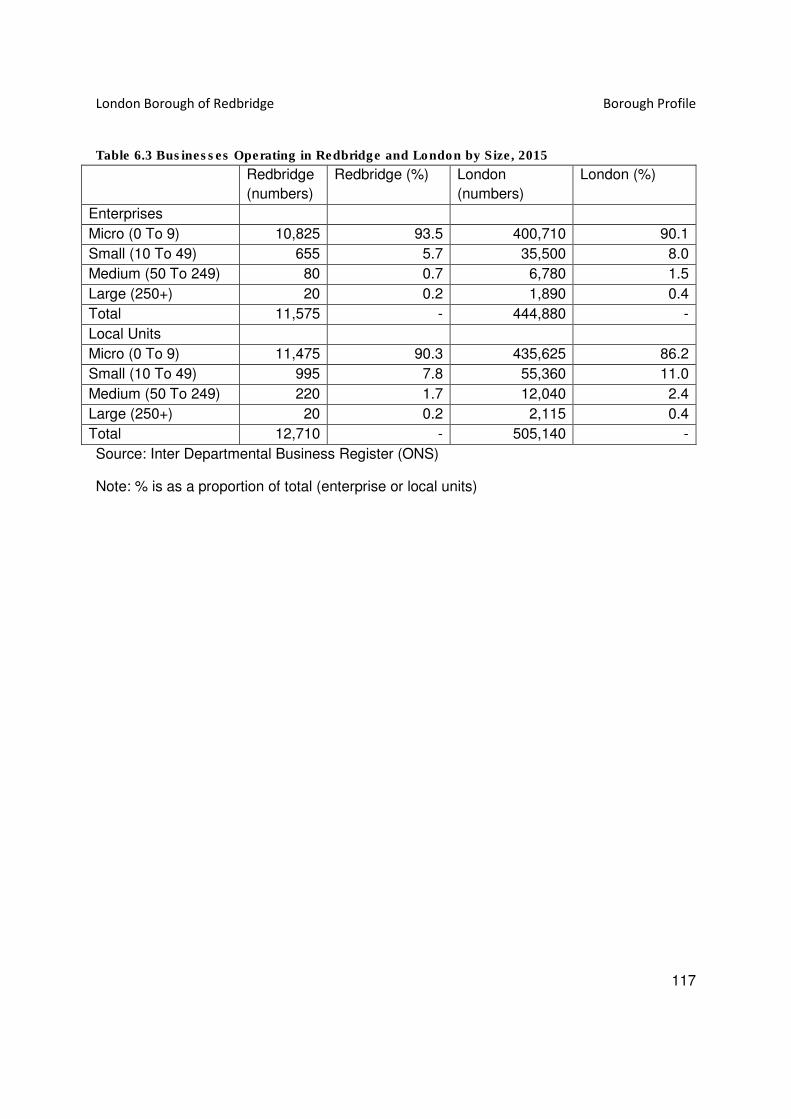
London Borough of Redbridge Borough Profile
117
Table 6.3 Businesses Operating in Redbridge and London by Size, 2015
Redbridge
(numbers)
Redbridge (%) London
(numbers)
London (%)
Enterprises
Micro (0 To 9) 10,825 93.5 400,710 90.1
Small (10 To 49) 655 5.7 35,500 8.0
Medium (50 To 249) 80 0.7 6,780 1.5
Large (250+) 20 0.2 1,890 0.4
Total 11,575 - 444,880 -
Local Units
Micro (0 To 9) 11,475 90.3 435,625 86.2
Small (10 To 49) 995 7.8 55,360 11.0
Medium (50 To 249) 220 1.7 12,040 2.4
Large (250+) 20 0.2 2,115 0.4
Total 12,710 - 505,140 -
Source: Inter Departmental Business Register (ONS)
Note: % is as a proportion of total (enterprise or local units)

London Borough of Redbridge Borough Profile
118
Table 6.4 Enterprises by Broad Industry Group for Redbridge, London and Britain
Redbridge London Great Britain
Industry Number % % %
Agriculture, forestry & fishing 10 0.1 0.1 5.4
Mining, quarrying & utilities 30 0.3 0.4 0.5
Manufacturing 310 2.7 2.8 5.3
Construction 1,445 12.5 9.0 11.6
Motor trades 230 2.0 1.4 2.9
Wholesale 540 4.7 4.3 4.2
Retail 975 8.4 7.2 7.8
Transport & storage (inc postal) 285 2.5 2.1 3.4
Accommodation & food services 505 4.4 4.8 6.0
Information & communication 1,865 16.1 13.2 8.0
Financial & insurance 165 1.4 2.9 2.0
Property 460 4.0 4.8 3.6
Professional, scientific & technical 2,305 19.9 23.9 18.1
Business administration & support
services
925 8.0 9.7 8.1
Public administration & defence 0 0.0 0.0 0.3
Education 230 2.0 1.6 1.7
Health 680 5.9 4.5 4.3
Arts, entertainment, recreation &
other services
615 5.3 7.4 6.8
Total 11,575 100 100 100
Source: Inter-departmental business register, March 2015, ONS
6.1.4 New business registrations are referred to as business births and businesses
that have ceased to trade are referred to as business deaths. Redbridge has
experienced a net increase in businesses year on year between 2004 and 2013
unlike London and Great Britain which both saw reductions following the recession in
2009. At a national level there were also net decreases in businesses in 2010 and
2012. In 2013, there were 2,430 business births in Redbridge and 1,525 business
deaths creating a net increase of 905 businesses over the year see Table 6.5.
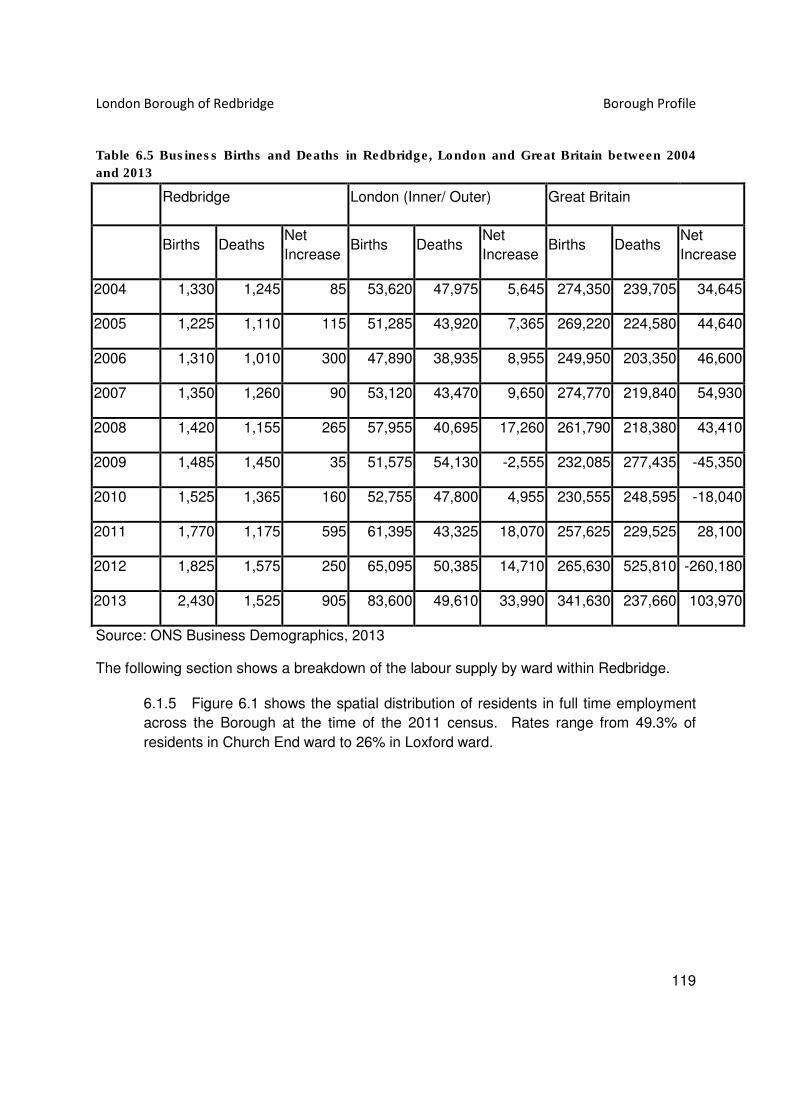
London Borough of Redbridge Borough Profile
119
Table 6.5 Business Births and Deaths in Redbridge, London and Great Britain between 2004
and 2013
Redbridge London (Inner/ Outer) Great Britain
Births Deaths Net
Increase Births Deaths
Net
Increase Births Deaths
Net
Increase
2004 1,330 1,245 85 53,620 47,975 5,645 274,350 239,705 34,645
2005 1,225 1,110 115 51,285 43,920 7,365 269,220 224,580 44,640
2006 1,310 1,010 300 47,890 38,935 8,955 249,950 203,350 46,600
2007 1,350 1,260 90 53,120 43,470 9,650 274,770 219,840 54,930
2008 1,420 1,155 265 57,955 40,695 17,260 261,790 218,380 43,410
2009 1,485 1,450 35 51,575 54,130 -2,555 232,085 277,435 -45,350
2010 1,525 1,365 160 52,755 47,800 4,955 230,555 248,595 -18,040
2011 1,770 1,175 595 61,395 43,325 18,070 257,625 229,525 28,100
2012 1,825 1,575 250 65,095 50,385 14,710 265,630 525,810 -260,180
2013 2,430 1,525 905 83,600 49,610 33,990 341,630 237,660 103,970
Source: ONS Business Demographics, 2013
The following section shows a breakdown of the labour supply by ward within Redbridge.
6.1.5 Figure 6.1 shows the spatial distribution of residents in full time employment
across the Borough at the time of the 2011 census. Rates range from 49.3% of
residents in Church End ward to 26% in Loxford ward.
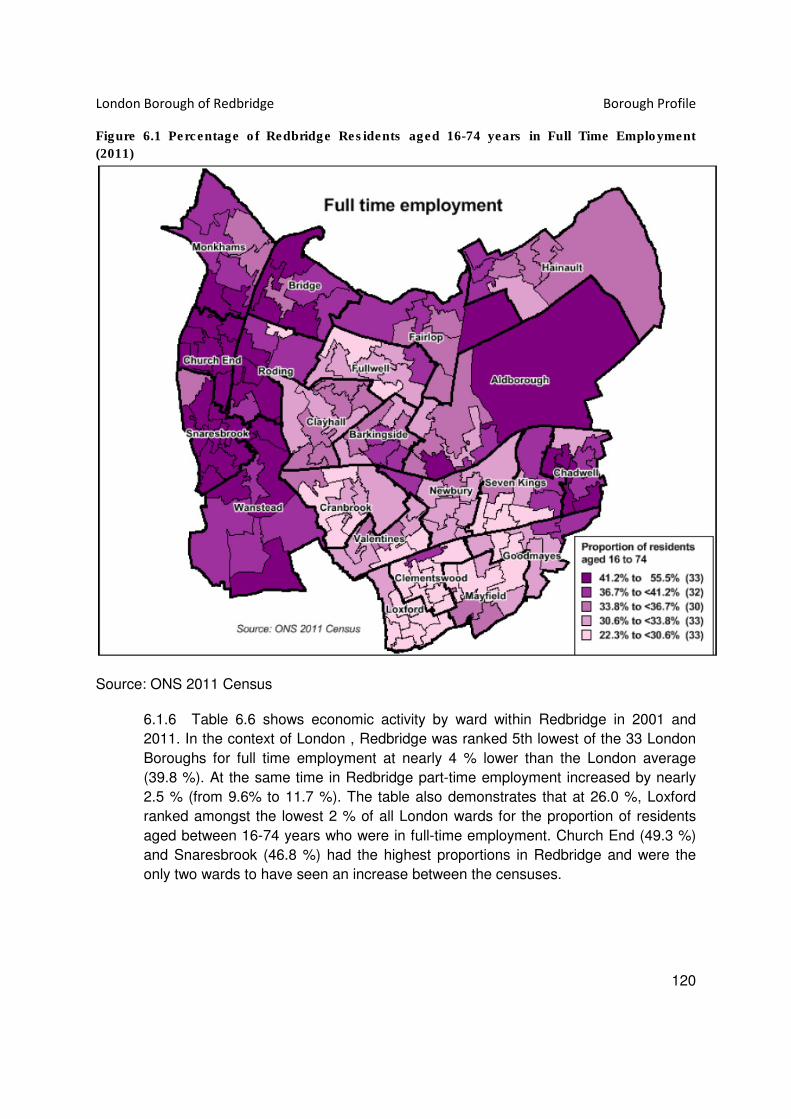
London Borough of Redbridge Borough Profile
120
Figure 6.1 Percentage of Redbridge Residents aged 16-74 years in Full Time Employment
(2011)
Source: ONS 2011 Census
6.1.6 Table 6.6 shows economic activity by ward within Redbridge in 2001 and
2011. In the context of London , Redbridge was ranked 5th lowest of the 33 London
Boroughs for full time employment at nearly 4 % lower than the London average
(39.8 %). At the same time in Redbridge part-time employment increased by nearly
2.5 % (from 9.6% to 11.7 %). The table also demonstrates that at 26.0 %, Loxford
ranked amongst the lowest 2 % of all London wards for the proportion of residents
aged between 16-74 years who were in full-time employment. Church End (49.3 %)
and Snaresbrook (46.8 %) had the highest proportions in Redbridge and were the
only two wards to have seen an increase between the censuses.

London Borough of Redbridge Borough Profile
121
Table 6.6 Economic Activity by Ward in Redbridge, 2001 and 2011
Source: ONS figures dated 2011 (London Borough of Redbridge Corporate Policy Team).
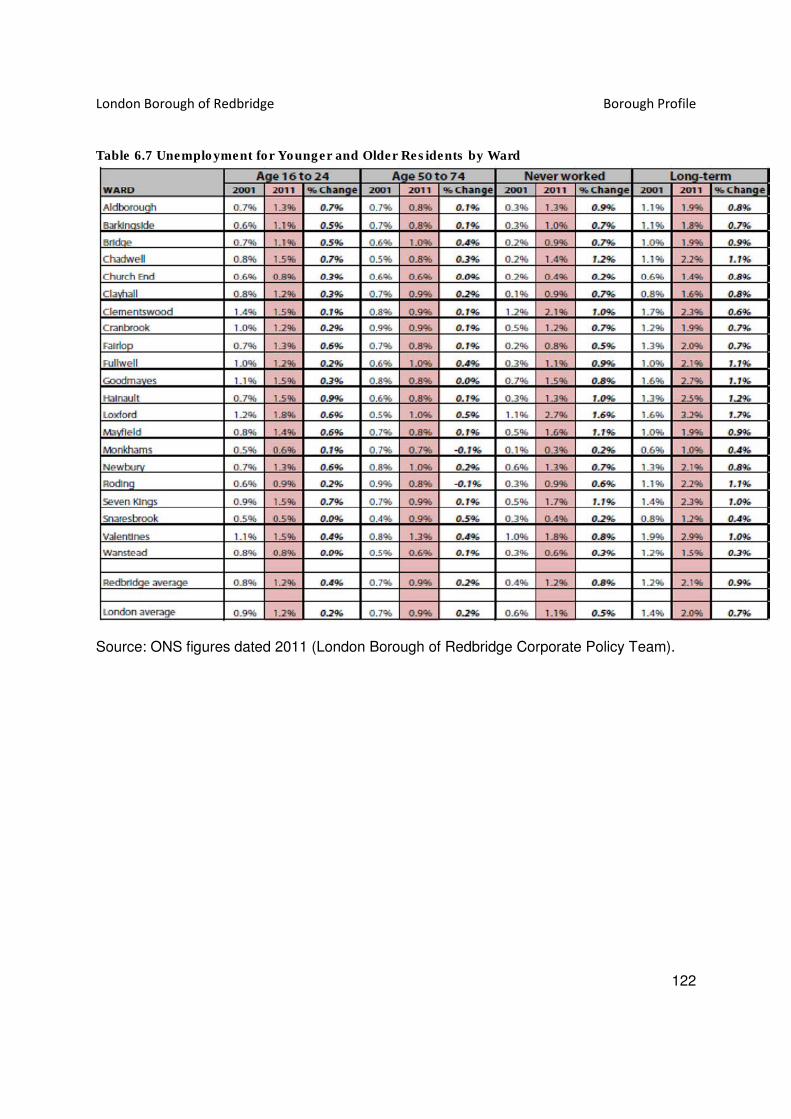
London Borough of Redbridge Borough Profile
122
Table 6.7 Unemployment for Younger and Older Residents by Ward
Source: ONS figures dated 2011 (London Borough of Redbridge Corporate Policy Team).

London Borough of Redbridge Borough Profile
123
6.1.7 Table 6.7 shows a breakdown of unemployment by age and shows that
Loxford ward ranked 4th highest of all London wards for the poportion of residents
aged between 16 and 74 who had never worked (2.7 %). Loxford also ranked the
highest for the numbers of 16 to 24 year olds in long-term unemployment. Table 6.8
shows the main reasons for economic inactivity at ward level.
6.1.8 In 2011, Fullwell and Wanstead wards had the highest percentage of retired
residents at 11.8%. Loxford ward had the highest percentage of students and people
looking after home/family. Hainault ward had the highest percentage of people who
are permanently sick/disabled at 6.6% compared to a Borough average of 3.3% .
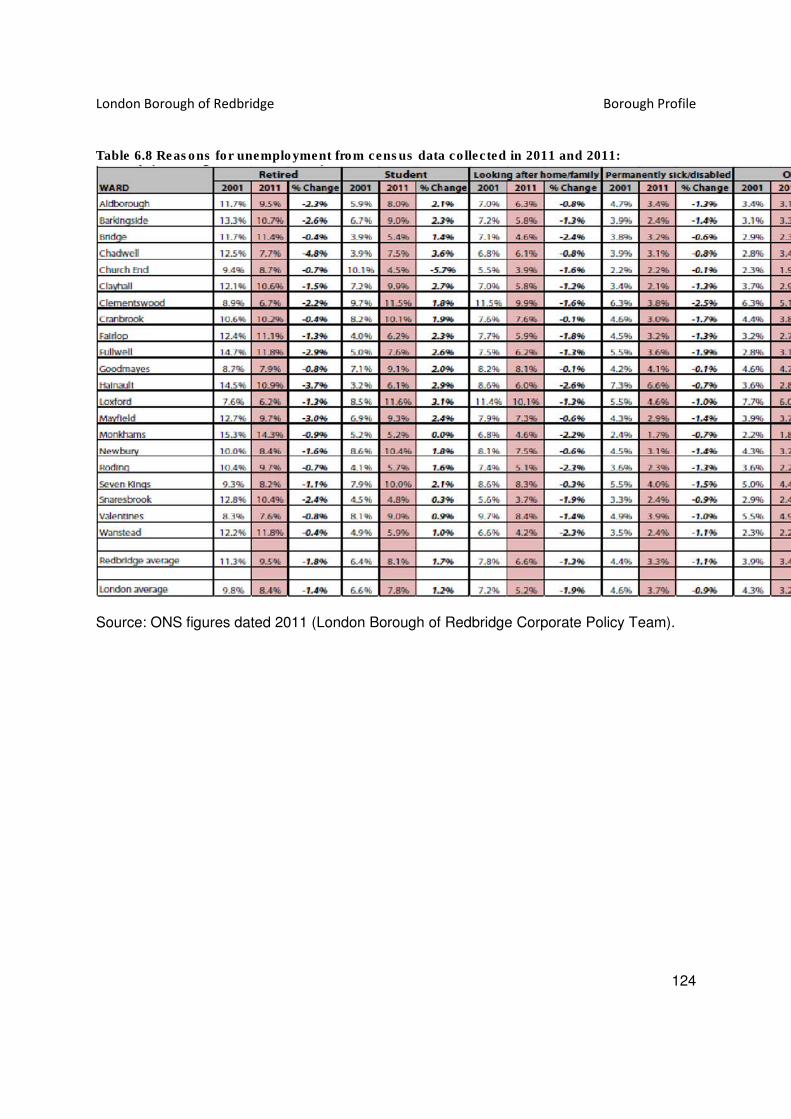
London Borough of Redbridge Borough Profile
124
Table 6.8 Reasons for unemployment from census data collected in 2011 and 2011:
Source: ONS figures dated 2011 (London Borough of Redbridge Corporate Policy Team).
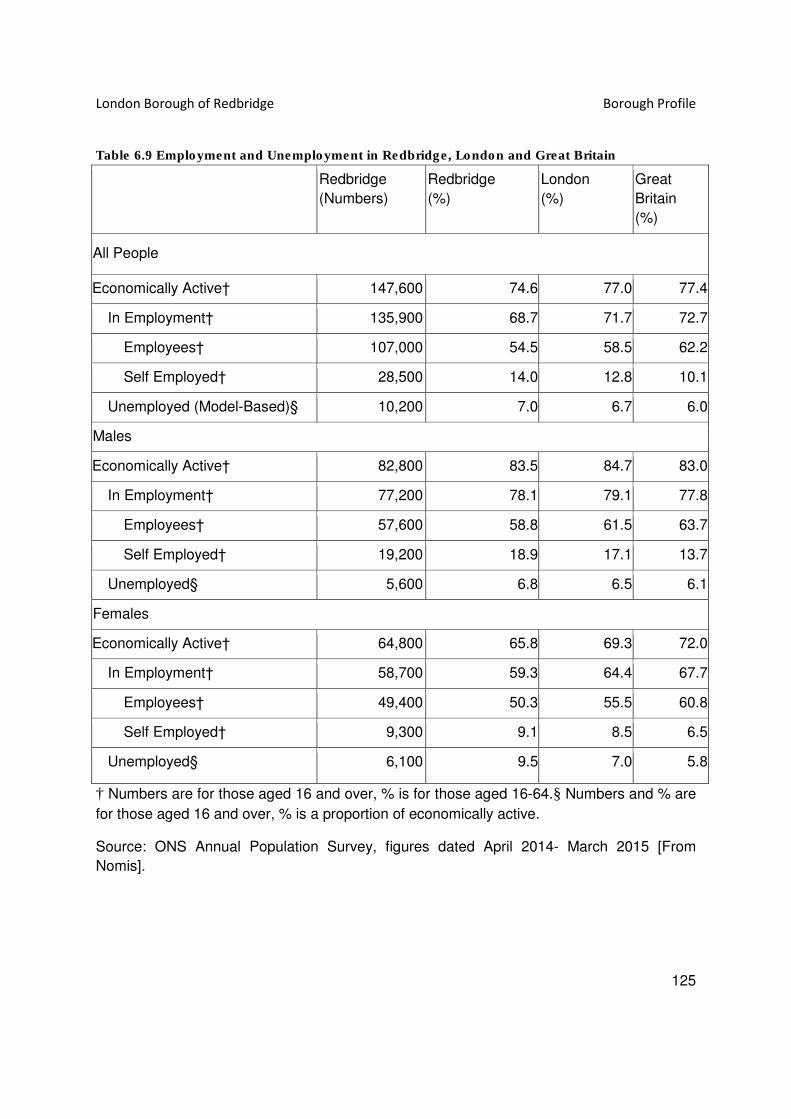
London Borough of Redbridge Borough Profile
125
Table 6.9 Employment and Unemployment in Redbridge, London and Great Britain
Redbridge
(Numbers)
Redbridge
(%)
London
(%)
Great
Britain
(%)
All People
Economically Active† 147,600 74.6 77.0 77.4
In Employment† 135,900 68.7 71.7 72.7
Employees† 107,000 54.5 58.5 62.2
Self Employed† 28,500 14.0 12.8 10.1
Unemployed (Model-Based)§ 10,200 7.0 6.7 6.0
Males
Economically Active† 82,800 83.5 84.7 83.0
In Employment† 77,200 78.1 79.1 77.8
Employees† 57,600 58.8 61.5 63.7
Self Employed† 19,200 18.9 17.1 13.7
Unemployed§ 5,600 6.8 6.5 6.1
Females
Economically Active† 64,800 65.8 69.3 72.0
In Employment† 58,700 59.3 64.4 67.7
Employees† 49,400 50.3 55.5 60.8
Self Employed† 9,300 9.1 8.5 6.5
Unemployed§ 6,100 9.5 7.0 5.8
† Numbers are for those aged 16 and over, % is for those aged 16-64.§ Numbers and % are
for those aged 16 and over, % is a proportion of economically active.
Source: ONS Annual Population Survey, figures dated April 2014- March 2015 [From
Nomis].

London Borough of Redbridge Borough Profile
126
6.1.9 Table 6.9 shows that Redbridge has lower levels of economically active
residents (74.6%) than London (77%) and Britain (77.4%). This difference is larger
due to fewer females being economically active (65.8%) than their counterparts in
London (69.3%) and Britain (72%). Females in Redbridge also have higher
unemployment levels (9.5%) then their counterparts in London (7%) and in Britain
(5.8%). Redbridge has more residents who are self-employed (14%) than elsewhere
in London (12.8%) and Britain (10.1%) and subsequently a lower proportion of
residents who are employees. The reasons for economic inactive are given in Table
6.10. Only 21.8% of Redbridge residents who are economically inactive want a job
compared to 26% of London’s economically inactive and 24.5% of British
economically inactive people. The most common reasons Redbridge residents state
that they are economically inactive are that they are looking after family/home
(31.7%), they are a student (31.1%) and for Other reasons (14.6%).
Table 6.10 Reasons for Economic Inactivity, Redbridge, London and Great Britain
Redbridge
(number)
Redbridge
(%)
London (%) Great Britain
(%)
All People
Total 48,000 25.4 23 22.6
Student 14,900 31.1 32.2 26.5
Looking after family / home 15,200 31.7 31.0 25.4
Temporary sick # # 1.9 2.2
Long-term sick 6,700 13.9 16.1 21.6
Discouraged ! ! 0.6 0.5
Retired 3,500 7.3 7.1 14.3
Other 7,000 14.6 11.2 9.5
Wants a job 10,500 21.8 26.0 24.5
Does not want a job 37,600 78.2 74.0 75.5
Source: ONS Annual Population Survey, April 2014 – March 2015.
# Sample size too small for reliable estimate.
! Estimate is not available since sample size is disclosive.
Notes: Numbers are for those aged 16-64 % is a proportion of those economically inactive,
except total, which is a proportion of those aged 16-64.

London Borough of Redbridge Borough Profile
127
6.1.10 Table 6.11 shows that for employed Redbridge residents, the most common
occupations between the period of April 2014 – March 2015, are within Professional
(22.6%), Associate Professional and Technical (16.01%) and Administrative and
Secretarial (12.8%). The occupational profile of Redbridge residents is similar to the
profile for London overall.

London Borough of Redbridge Borough Profile
128
Table 6.11 Employment by Occupation for Redbridge, London and Great Britain
Redbridge
(Level)
Redbridge
(%)
London (%) Great Britain
(%)
Soc 2010 Major Group 1-3 68,600 50.9 53.2 44.3
1 Managers, Directors And
Senior Officials 16,100 11.9 11.6 10.3
2 Professional Occupations 30,700 22.6 23.4 19.7
3 Associate Professional &
Technical 21,800 16.0 17.8 14.1
Soc 2010 Major Group 4-5 26,800 19.9 17.9 21.4
4 Administrative &
Secretarial 17,400 12.8 10.3 10.6
5 Skilled Trades
Occupations 9,400 6.9 7.4 10.7
Soc 2010 Major Group 6-7 20,600 15.3 14.8 17.1
6 Caring, Leisure And Other
Service Occupations 9,200 6.8 7.8 9.2
7 Sales And Customer
Service Occupations 11,400 8.4 6.9 7.8
Soc 2010 Major Group 8-9 18,800 14.0 14.1 17.2
8 Process Plant & Machine
Operatives 8,000 5.9 4.3 6.3
9 Elementary Occupations 10,800 8.0 9.7 10.9
Source: ONS Annual Population Survey, April 2014-March 2015.
Notes: level and % are for those aged 16+
% is a proportion of all persons in employment.
6.1.11 Table 6,12. shows that Redbridge residents hold higher levels of
qualifications than their British counterparts but have not yet reached the levels for
London as a whole. 45% of Redbridge residents have reached NVQ4 level and
above (this includes HND, Degree and Higher Degree level qualifications or
equivalent) compared to 49.1% of Londoners and 36% across Great Britain.
Redbridge residents are more likely to hold Other qualifications (including foreign
qualifications and professional qualitifcations) (9.3%) than London as a whole
(8.0%) or those living in Great Britain (6.2%).

London Borough of Redbridge Borough Profile
129
Table 6.12 Qualification Levels for Redbridge, London and Great Britain
Redbridge
(Numbers)
Redbridge
(%)
London (%) Great Britain
(%)
Individual Levels
NVQ4 And Above 84,800 45.0 49.1 36.0
NVQ3 And Above 116,100 61.6 64.7 56.7
NVQ2 And Above 137,400 72.9 76.4 73.3
NVQ1 And Above 154,100 81.8 84.2 85.0
Other Qualifications 17,600 9.3 8.0 6.2
No Qualifications 16,700 8.9 7.8 8.8
Source: ONS Annual Population Survey, Jan 2014-Dec 2014.
Notes: Number and % are for those aged 16-64
6.1.12 Table 6.13 shows that the average gross weekly pay for full time employees
in Redbridge (£621.60) is greater than the average weekly pay across London
(£617.80) and Great Britain (£520.80). There is a substantial gender pay gap with
male Redbridge residents earning 9% more per hour than female residents.
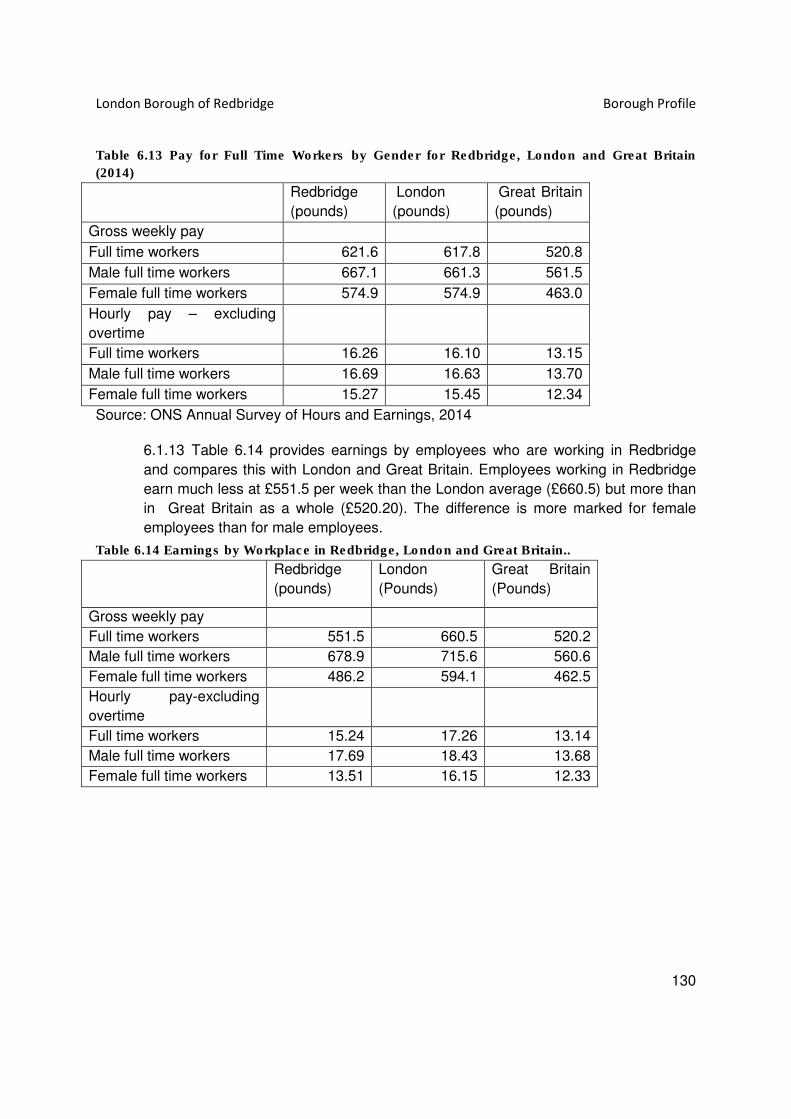
London Borough of Redbridge Borough Profile
130
Table 6.13 Pay for Full Time Workers by Gender for Redbridge, London and Great Britain
(2014)
Redbridge
(pounds)
London
(pounds)
Great Britain
(pounds)
Gross weekly pay
Full time workers 621.6 617.8 520.8
Male full time workers 667.1 661.3 561.5
Female full time workers 574.9 574.9 463.0
Hourly pay – excluding
overtime
Full time workers 16.26 16.10 13.15
Male full time workers 16.69 16.63 13.70
Female full time workers 15.27 15.45 12.34
Source: ONS Annual Survey of Hours and Earnings, 2014
6.1.13 Table 6.14 provides earnings by employees who are working in Redbridge
and compares this with London and Great Britain. Employees working in Redbridge
earn much less at £551.5 per week than the London average (£660.5) but more than
in Great Britain as a whole (£520.20). The difference is more marked for female
employees than for male employees.
Table 6.14 Earnings by Workplace in Redbridge, London and Great Britain..
Redbridge
(pounds)
London
(Pounds)
Great Britain
(Pounds)
Gross weekly pay
Full time workers 551.5 660.5 520.2
Male full time workers 678.9 715.6 560.6
Female full time workers 486.2 594.1 462.5
Hourly pay-excluding
overtime
Full time workers 15.24 17.26 13.14
Male full time workers 17.69 18.43 13.68
Female full time workers 13.51 16.15 12.33
London Borough of Redbridge Borough Profile
131
Source: ONS annual survey of hours and earnings – workplace analysis
Note: Median earnings in pounds for employees working in the area.
6.1.14 Table 6.15 shows that in August 2014 Redbridge had lower rates of residents
claiming Job Seekers Allowance (JSA) (1.5%) than London (1.9%) and Great Britain
(1.7%). However, the rate of young people claiming JSA for less than 6 months was
higher at 2.1% than in London and Great Britain.

London Borough of Redbridge Borough Profile
132
Table 6.15 Job Seekers Allowance Claimants in Redbridge, London and Great Britain (August
2015)
Redbridge
(Numbers)
Redbridge (%) London (%) Great Britain
(%)
All People 2,924 1.5 1.9 1.7
Males 1,615 1.7 2.2 2.1
Females 1,309 1.4 1.6 1.2
Source: ONS claimant count with rates and proportions
Note: % is a proportion of resident population of Borough aged 16-64 and gender.
Table 6.16 Job Seekers Allowance Claimants by Age and Duration (August 2015)
Redbridge
(Numbers)
Redbridge (%) London (%) Great Britain
(%)
All ages
Total 2,900 1.5 1.9 1.7
Up to 6 months 1,885 1.0 1.1 0.9
Over 6 and up
to 12 months 425 0.2 0.3 0.3
Over 12 months 585 0.3 0.5 0.5
Aged 18 to 24
Total 620 2.5 2.4 2.4
Up to 6 months 525 2.1 1.8 1.6
Over 6 and up
to 12 months 65 0.3 0.4 0.4
Over 12 months 30 0.1 0.2 0.3
Aged 25 to 49
Total 1,620 1.4 1.8 1.8
Up to 6 mpnths 1,005 0.9 1.0 1.0
Over 6 and up
to 12 months 270 0.2 0.3 0.3
Over 12 months 345 0.3 0.4 0.5
Aged 50 to 64
Total 660 1.5 2.1 1.3
Total Up to 6
months 360 0.8 0.9 0.6
Over 6 and up
to 12 months 95 0.2 0.3 0.2
Over 12 Months 210 0.5 0.8 0.5
Source: ONS Claimant count – age duration wih proportions
Note: % is number of persons claiming JSA as a proportion of resident population of the
same age

London Borough of Redbridge Borough Profile
133
6.1.15 Table 6.16 shows claimant rates for key benefits for residents of working age.
Redbridge has lower claimant rates overall (9.5%) compared with London (11.1%)
and Great Britain (12.5%). Table 6.17 shows key benefit claimants by working age
group.
Table 6.17 Working Age Client Group – Key Benefit Claimants (February 2015)
Redbridge
(numbers)
Redbridge (%) London (%) Great Bitain (%)
Total Claimants 18,160 9.5 11.1 12.5
By Statistical
group
Job Seekers 3,190 1.7 2.1 2.0
ESA And
Incapacity Benefits 8,390 4.4 5.5 6.3
Lone Parents 1,590 0.8 1.2 1.1
Carers 2,500 1.3 1.1 1.5
Others On Income
Related Benefits 440 0.2 0.3 0.3
Disabled 1,710 0.9 0.8 1.1
Bereaved 340 0.2 0.1 0.2
Key out of work
benefits+
13,610 7.1 9.0 9.7
Source: DWP benefit claimants – working age client group
† Key out of work benefits includes the groups: job seekers, ESA and incapcity
benefits, lone parents and others on income related benefits.
Note: % is a proportion of resident population of area aged 16-64.
Table 6.18 Job Density in Redbridge, London and Great Britain, 2013
Redbridge
(Jobs)
Redbridge
(Density)
London
(Density)
Great Britain
(Density)
Jobs density 84,000 0.45 0.93 0.80
Source: ONS jobs density, 2013
Notes: The density figures represent the ratio of total jobs to population 16-64. Total jobs
includes employees, self-employed, government-supported trainees and HM Forces.
6.1.16 Table 6.18 shows that Redbridge has a low job density compared with
London and Great Britain, meaning that many of Redbridge’s employees are
commuting outside of the Borough to work.
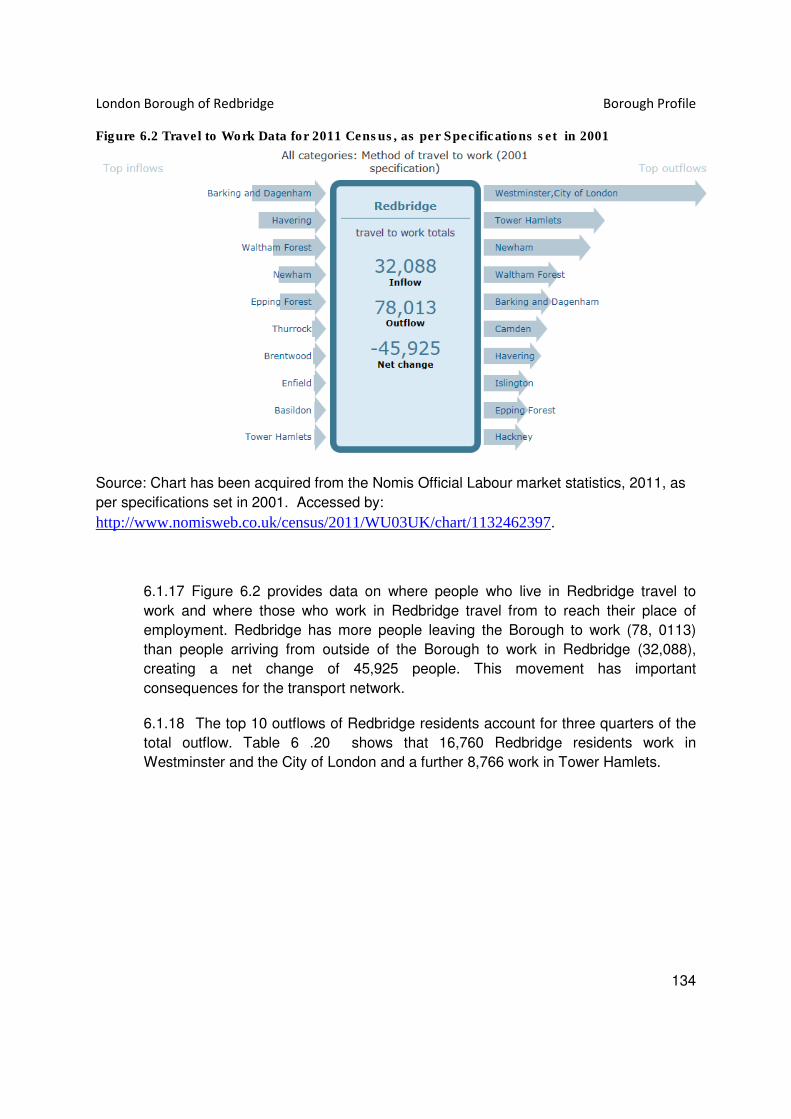
London Borough of Redbridge Borough Profile
134
Figure 6.2 Travel to Work Data for 2011 Census, as per Specifications set in 2001
Source: Chart has been acquired from the Nomis Official Labour market statistics, 2011, as
per specifications set in 2001. Accessed by:
http://www.nomisweb.co.uk/census/2011/WU03UK/chart/1132462397.
6.1.17 Figure 6.2 provides data on where people who live in Redbridge travel to
work and where those who work in Redbridge travel from to reach their place of
employment. Redbridge has more people leaving the Borough to work (78, 0113)
than people arriving from outside of the Borough to work in Redbridge (32,088),
creating a net change of 45,925 people. This movement has important
consequences for the transport network.
6.1.18 The top 10 outflows of Redbridge residents account for three quarters of the
total outflow. Table 6 .20 shows that 16,760 Redbridge residents work in
Westminster and the City of London and a further 8,766 work in Tower Hamlets.
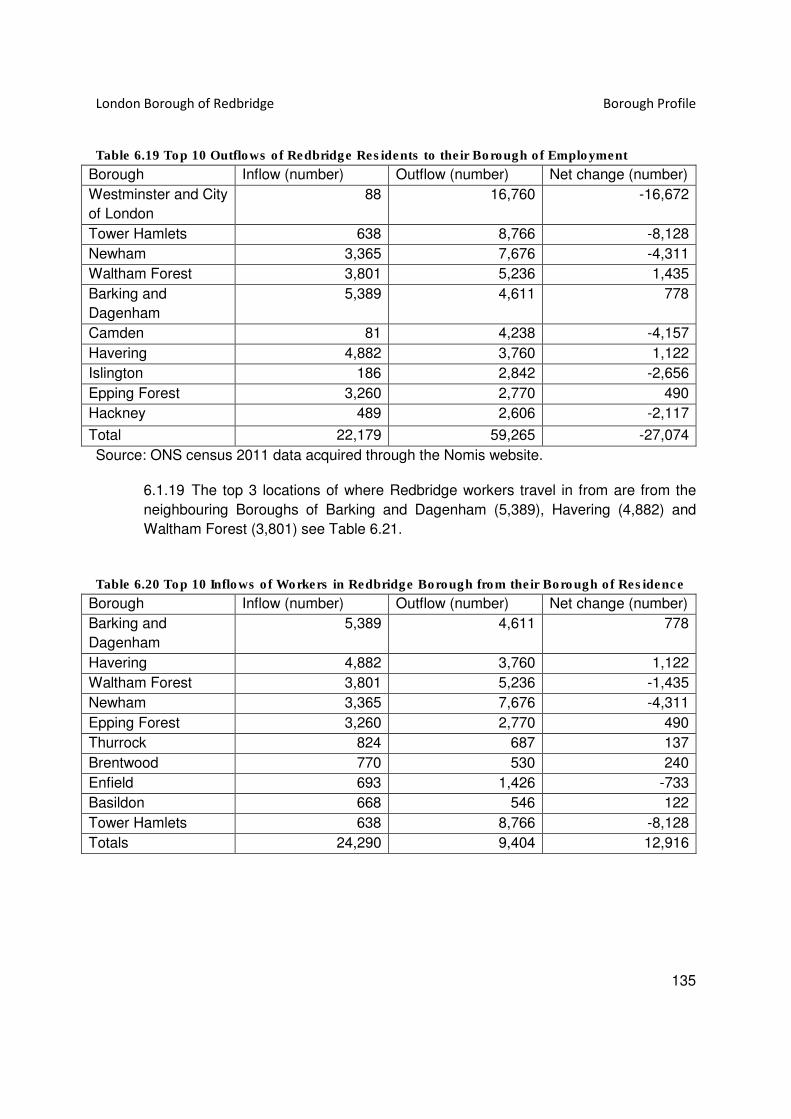
London Borough of Redbridge Borough Profile
135
Table 6.19 Top 10 Outflows of Redbridge Residents to their Borough of Employment
Borough Inflow (number) Outflow (number) Net change (number)
Westminster and City
of London
88 16,760 -16,672
Tower Hamlets 638 8,766 -8,128
Newham 3,365 7,676 -4,311
Waltham Forest 3,801 5,236 1,435
Barking and
Dagenham
5,389 4,611 778
Camden 81 4,238 -4,157
Havering 4,882 3,760 1,122
Islington 186 2,842 -2,656
Epping Forest 3,260 2,770 490
Hackney 489 2,606 -2,117
Total 22,179 59,265 -27,074
Source: ONS census 2011 data acquired through the Nomis website.
6.1.19 The top 3 locations of where Redbridge workers travel in from are from the
neighbouring Boroughs of Barking and Dagenham (5,389), Havering (4,882) and
Waltham Forest (3,801) see Table 6.21.
Table 6.20 Top 10 Inflows of Workers in Redbridge Borough from their Borough of Residence
Borough Inflow (number) Outflow (number) Net change (number)
Barking and
Dagenham
5,389 4,611 778
Havering 4,882 3,760 1,122
Waltham Forest 3,801 5,236 -1,435
Newham 3,365 7,676 -4,311
Epping Forest 3,260 2,770 490
Thurrock 824 687 137
Brentwood 770 530 240
Enfield 693 1,426 -733
Basildon 668 546 122
Tower Hamlets 638 8,766 -8,128
Totals 24,290 9,404 12,916
London Borough of Redbridge Borough Profile
136
6.2 Retail in Redbridge
6.2.1 Continuing a sustained period of year-on-year growth, the volume of retail
sales in the UK in August 2015 is estimated to have increased by 3.7% compared
with August 2014. This was the 29th consecutive month of year-on-year growth.
There has also been an increase in internet sales across the UK and in August 2015,
12.2% of all retail sales were made online up from 11.5% a year before.4 Year on
year estimates of the quantity bought in the retail industry showed an increase of
3.7% compared with August 2015. As prices of goods have fallen, this is an increase
in spend of 0.2% compared with August 2014.Redbridge has a number of shopping
areas which include Ilford Metropolitan Area, District Centres, Local Centres, and
Key Retail Parades. As well as these the Borough has a number of business areas
that are in the Chadwell Heath Business Park, Forest Road, Hainault Business Park
(Strategic Industrial Location), New North Road, Hainault Works, Newton Industrial
Estate, Raven Road, Southend Road (Strategic Industrial Location).
6.2.2 Table 6.21 shows the breakdown of the number of units and floor space by
the type of retail within the Borough.
4 ONS, Retail Sales, August 2015 released 17 September 2015

London Borough of Redbridge Borough Profile
137
Table 6.21 Retail Units and Total Floorspace in Redbridge, November 2012:
Total gross retail floorspace (sqm)
Centre Borough Classification Comparison
goods
(sqm)
Convenience
goods (sqm)
Service
retail
(sqm)
Vacant
retail
stores
(sqm)
Ilford Redbridge Metropolitan 80,280 12,578 6,271 22,939
Chadwell
Heath
Barking and
Dagenham/Redbridge
District 3,373 5,667 1,708 492
Green
Lane
Barking and
Dagenham/Redbridge
District 2,956 1,524 1,217 818
Barkingsid
e
Redbridge District 5,155 11,565 2,803 1,085
Gants Hill Redbridge District 2,943 2,779 4,265 3,370
South
Woodford
Redbridge District 5,936 8,499 3,990 1,411
Wanstead Redbridge District 3,540 2,163 1,662 1,701
Data Source: GLA – London Wide Town Centre Health Check, November 2012.

London Borough of Redbridge Borough Profile
138
6.2.3 From Table 6.21 we can see that Redbridge has around 104,000 square
meters of comparison goods floorspace of which the Ilford accounts for 77%.
Comparison goods include items such as clothing, shoes, furniture, household
appliances, tools, medical goods, games and toys, books and stationery, jewellery
and other personal effects. There is nearly 45,000 square meters of floorspace for
convenience goods which includes food and beverages, tobacco, newspapers and
periodicals and non-durable household goods. Nearly 22,000 square meters of retail
floorspace is used for service provision. 15% of retail floorspace was vacant in 2012.
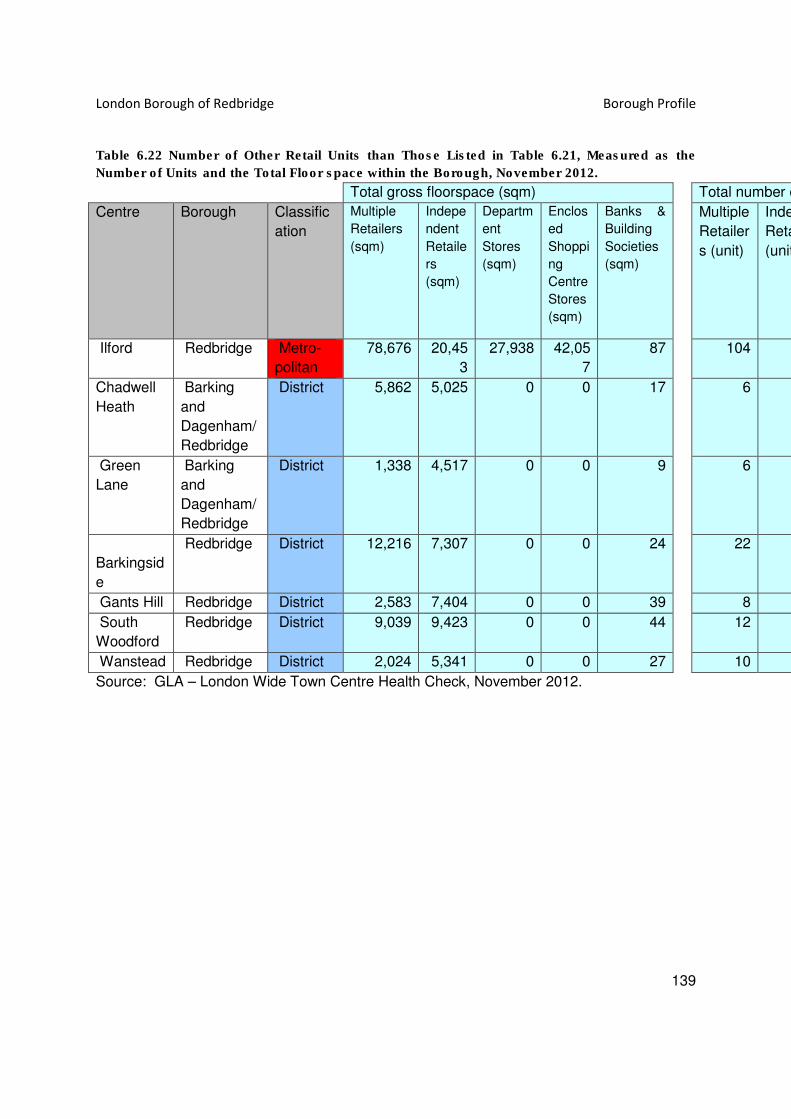
London Borough of Redbridge Borough Profile
139
Table 6.22 Number of Other Retail Units than Those Listed in Table 6.21, Measured as the
Number of Units and the Total Floor space within the Borough, November 2012.
Total gross floorspace (sqm) Total number of units
Centre Borough Classific
ation
Multiple
Retailers
(sqm)
Indepe
ndent
Retaile
rs
(sqm)
Departm
ent
Stores
(sqm)
Enclos
ed
Shoppi
ng
Centre
Stores
(sqm)
Banks &
Building
Societies
(sqm)
Multiple
Retailer
s (unit)
Independent
Retailers
(unit)
Ilford Redbridge Metro-
politan
78,676 20,45
3
27,938 42,05
7
87 104
Chadwell
Heath
Barking
and
Dagenham/
Redbridge
District 5,862 5,025 0 0 17 6
Green
Lane
Barking
and
Dagenham/
Redbridge
District 1,338 4,517 0 0 9 6
Barkingsid
e
Redbridge District 12,216 7,307 0 0 24 22
Gants Hill Redbridge District 2,583 7,404 0 0 39 8
South
Woodford
Redbridge District 9,039 9,423 0 0 44 12
Wanstead Redbridge District 2,024 5,341 0 0 27 10
Source: GLA – London Wide Town Centre Health Check, November 2012.

London Borough of Redbridge Borough Profile
140
6.2.4 Table 6.23 shows the amount of floor space that is occupied across the
various types of retail users within the main shopping centres in the Borough.
Multiple retailers take up the most retail floorspace followed by independent retailers.
Table 6.24 provides details of retail units by type of retailer and Table 6.25 the
number of retail units by specific use.
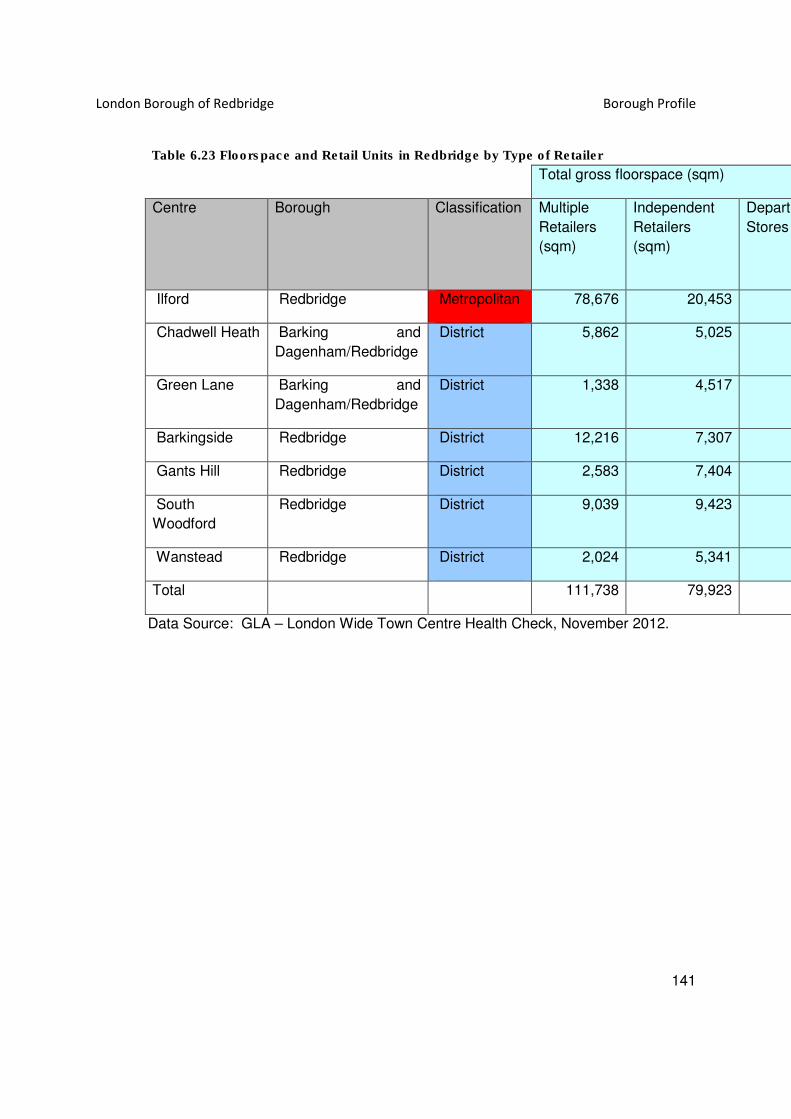
London Borough of Redbridge Borough Profile
141
Table 6.23 Floorspace and Retail Units in Redbridge by Type of Retailer
Total gross floorspace (sqm)
Centre Borough Classification Multiple
Retailers
(sqm)
Independent
Retailers
(sqm)
Department
Stores (sqm)
Ilford Redbridge Metropolitan 78,676 20,453 27,938
Chadwell Heath Barking and
Dagenham/Redbridge
District 5,862 5,025
Green Lane Barking and
Dagenham/Redbridge
District 1,338 4,517
Barkingside Redbridge District 12,216 7,307
Gants Hill Redbridge District 2,583 7,404
South
Woodford
Redbridge District 9,039 9,423
Wanstead Redbridge District 2,024 5,341
Total 111,738 79,923 27,938
Data Source: GLA – London Wide Town Centre Health Check, November 2012.

London Borough of Redbridge Borough Profile
142
Table 6.24 Total Number of Retail Units by Use
Centre Bakers Butchers Fish-
mongers
Post
Office
Herbalists Discount
Store
Charity
Shops
Super-
markets
Pawn
brokers
Ilford 7 1 1 2 6 5 7
Chadwell
Heath
2 1
Green Lane 1 1 1 2 3 1
Barkingside 5 1 1 1 2 7 6
Gants Hill 2 1 4
South
Woodford
2 1 5 4
Wanstead 2 1 1 3 2
Total 19 3 2 5 2 11 25 25
Source: GLA – London Wide Town Centre Health Check, November 2012.

London Borough of Redbridge Borough Profile
143
6.2.4 Figure 6.3 shows London’s town centre network, illustrating the position of Ilford
centre
Figure 6.3 London’s Town Centre Network
Source: GLA, Town Centre Health Check, 2013
London Borough of Redbridge Borough Profile
144
6.2.5 The figure shows Ilford as the single Metropolitan Centre within Redbridge.
This Centre contains 80,771 sq m of comparison goods retail floorspace, that is 81
%of the total retail floor space.
6.2.6 Over the period from 2009 to 2012, retail rents in some Metropolitan and
Major centres and Central Activities Zone frontages have either declined or shown
little growth, including Ilford.
6.2.7 Data taken at the last census demonstrates that 4,963 residents and had
2,018 households lived within 25m of a town centre in Redbridge. (Source: Experian
GOAD centre data, 2012).
6.2.8 A list of the various retail outlets within the Borough is given in Table 6.24 . 5
showing for example that within Ilford Metropolitan Centre, there are 12 bookmakers.
5 Source: Experian GOAD centre data, 2012.

London Borough of Redbridge Borough Profile
145
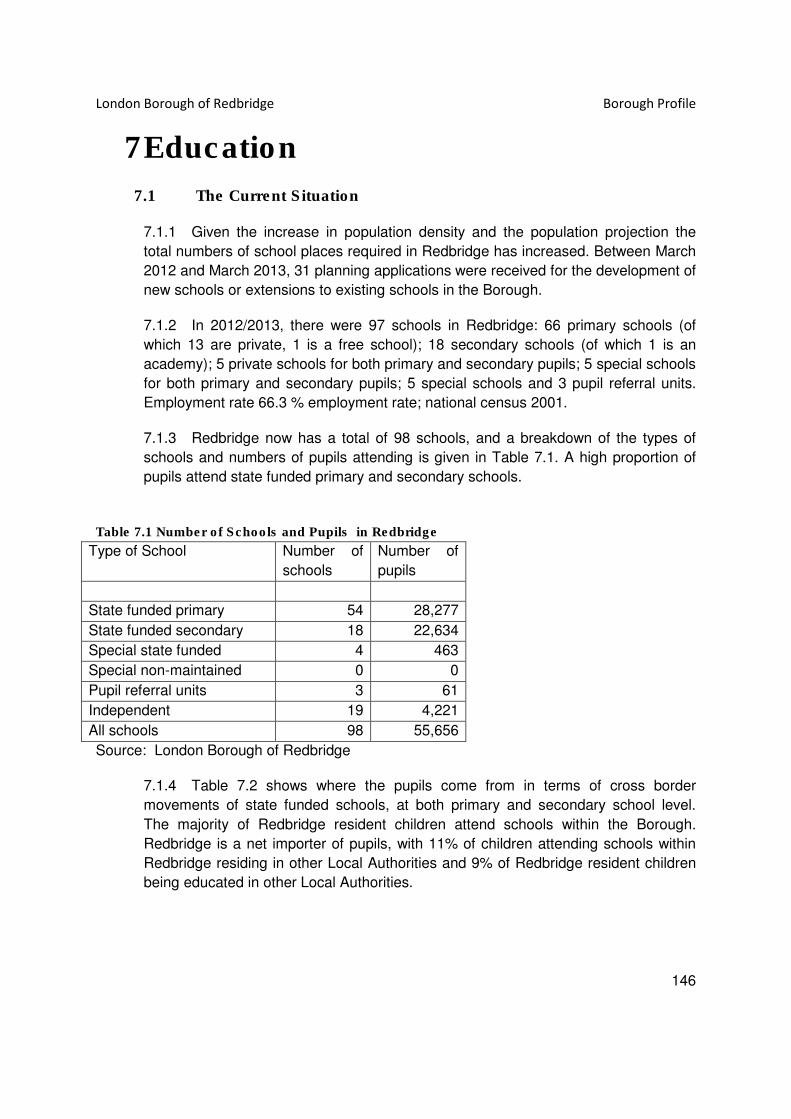
London Borough of Redbridge Borough Profile
146
7 Education
7.1 The Current Situation
7.1.1 Given the increase in population density and the population projection the
total numbers of school places required in Redbridge has increased. Between March
2012 and March 2013, 31 planning applications were received for the development of
new schools or extensions to existing schools in the Borough.
7.1.2 In 2012/2013, there were 97 schools in Redbridge: 66 primary schools (of
which 13 are private, 1 is a free school); 18 secondary schools (of which 1 is an
academy); 5 private schools for both primary and secondary pupils; 5 special schools
for both primary and secondary pupils; 5 special schools and 3 pupil referral units.
Employment rate 66.3 % employment rate; national census 2001.
7.1.3 Redbridge now has a total of 98 schools, and a breakdown of the types of
schools and numbers of pupils attending is given in Table 7.1. A high proportion of
pupils attend state funded primary and secondary schools.
Table 7.1 Number of Schools and Pupils in Redbridge
Type of School Number of
schools
Number of
pupils
State funded primary 54 28,277
State funded secondary 18 22,634
Special state funded 4 463
Special non-maintained 0 0
Pupil referral units 3 61
Independent 19 4,221
All schools 98 55,656
Source: London Borough of Redbridge
7.1.4 Table 7.2 shows where the pupils come from in terms of cross border
movements of state funded schools, at both primary and secondary school level.
The majority of Redbridge resident children attend schools within the Borough.
Redbridge is a net importer of pupils, with 11% of children attending schools within
Redbridge residing in other Local Authorities and 9% of Redbridge resident children
being educated in other Local Authorities.
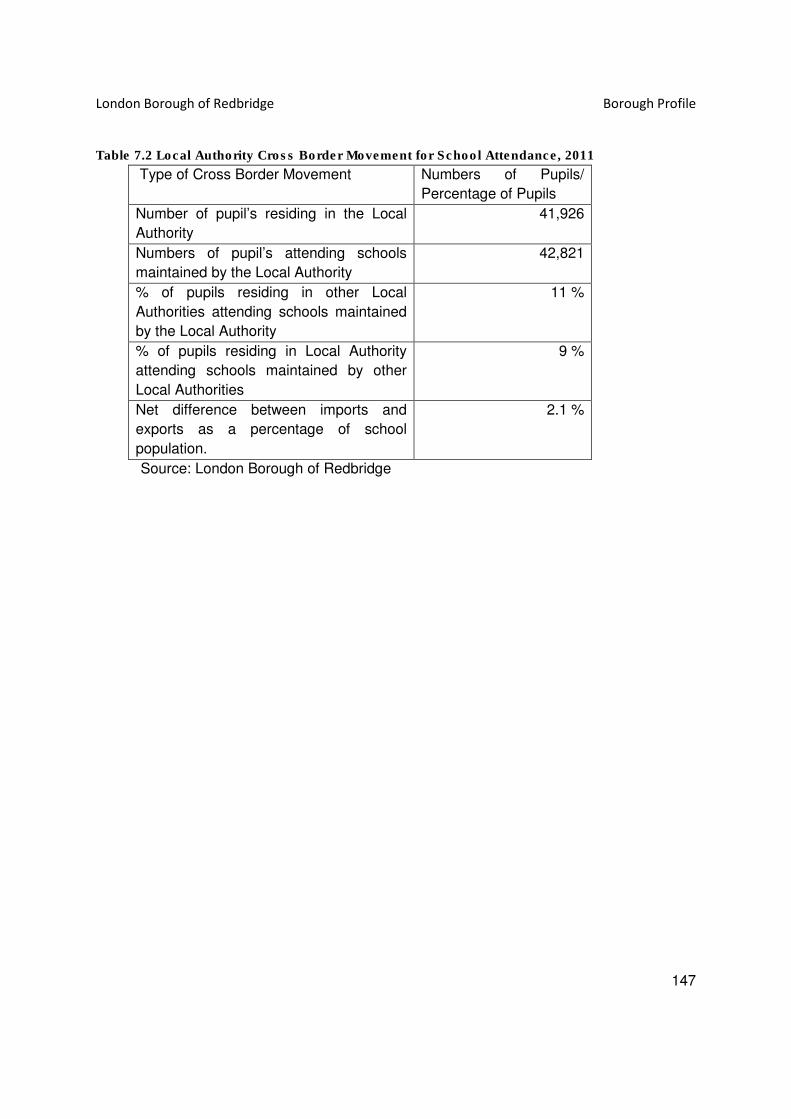
London Borough of Redbridge Borough Profile
147
Table 7.2 Local Authority Cross Border Movement for School Attendance, 2011
Type of Cross Border Movement Numbers of Pupils/
Percentage of Pupils
Number of pupil’s residing in the Local
Authority
41,926
Numbers of pupil’s attending schools
maintained by the Local Authority
42,821
% of pupils residing in other Local
Authorities attending schools maintained
by the Local Authority
11 %
% of pupils residing in Local Authority
attending schools maintained by other
Local Authorities
9 %
Net difference between imports and
exports as a percentage of school
population.
2.1 %
Source: London Borough of Redbridge
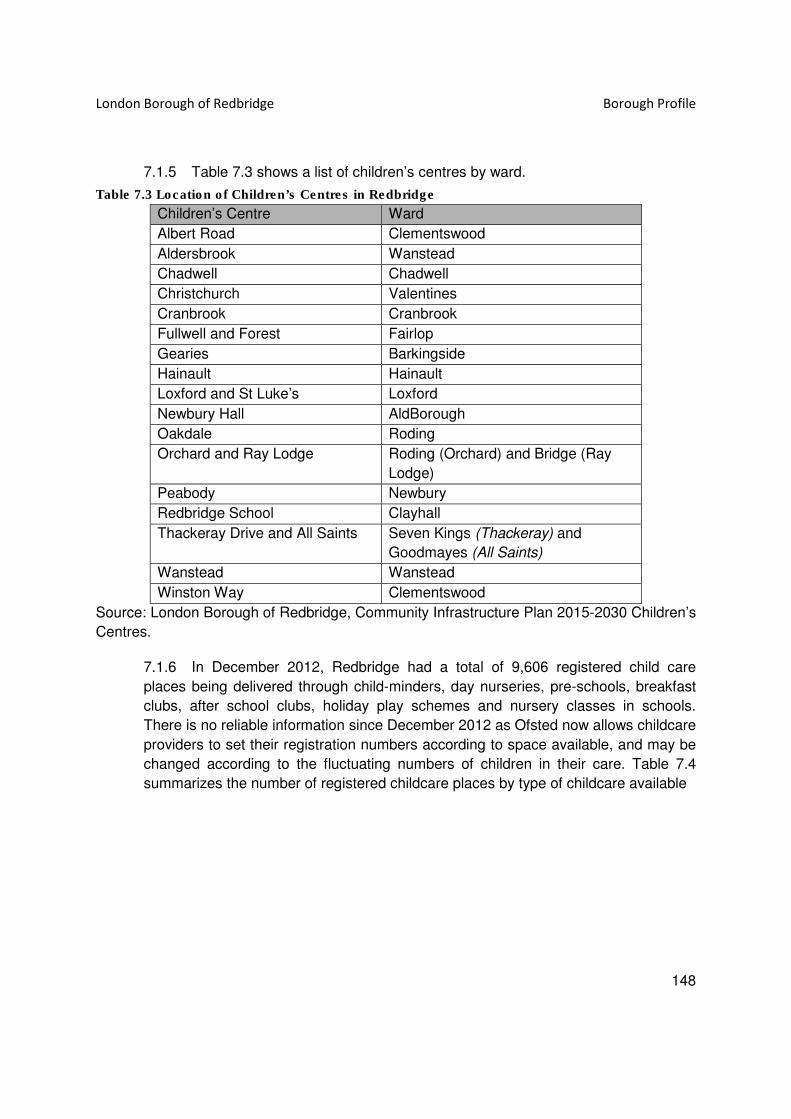
London Borough of Redbridge Borough Profile
148
7.1.5 Table 7.3 shows a list of children’s centres by ward.
Table 7.3 Location of Children’s Centres in Redbridge
Children’s Centre Ward
Albert Road Clementswood
Aldersbrook Wanstead
Chadwell Chadwell
Christchurch Valentines
Cranbrook Cranbrook
Fullwell and Forest Fairlop
Gearies Barkingside
Hainault Hainault
Loxford and St Luke’s Loxford
Newbury Hall AldBorough
Oakdale Roding
Orchard and Ray Lodge Roding (Orchard) and Bridge (Ray
Lodge)
Peabody Newbury
Redbridge School Clayhall
Thackeray Drive and All Saints Seven Kings (Thackeray) and
Goodmayes (All Saints)
Wanstead Wanstead
Winston Way Clementswood
Source: London Borough of Redbridge, Community Infrastructure Plan 2015-2030 Children’s
Centres.
7.1.6 In December 2012, Redbridge had a total of 9,606 registered child care
places being delivered through child-minders, day nurseries, pre-schools, breakfast
clubs, after school clubs, holiday play schemes and nursery classes in schools.
There is no reliable information since December 2012 as Ofsted now allows childcare
providers to set their registration numbers according to space available, and may be
changed according to the fluctuating numbers of children in their care. Table 7.4
summarizes the number of registered childcare places by type of childcare available

London Borough of Redbridge Borough Profile
149
Table 7.4 Number and Type of Registered Childcare Places and Future Requirements at
December 2012
Type of Registered Childcare
Number of
Registered
Places at Dec
2012
Full time childcare for children
aged under 2 years
1243
Sessional childcare places for
children aged 2 years
1136
Full time childcare places for
children aged 2 years
1341
Sessional childcare places for
children aged 3 and 4 years
4872
Registered childcare places
outside sessional hours (more
than 4 hours)
1850
Registered childcare places
outside sessional hours (less than
4 hours)
1258
Source: London Borough of Redbridge, Community Infrastructure Plan, 2015-2030

London Borough of Redbridge Borough Profile
150
7.1.7 As part of the 2010 Spending Review, the Government announced that the
free entitlement of 15 hours of nursery education will be gradually extended to every
disadvantaged two-year-old. It is intended that the 20% of the most disadvantaged
two year olds receive 15 hours of free early years education a week from 2013 and
40% of two year olds from 2014. For Redbridge it was estimated that an additional
828 places would be required for September 2013, which has now been met. Figures
for 2014 have been set at 1,671 places (based on national economic data).
7.1.8 The number of three and four year olds accessing free funding early years
education has been increasing year on year and is forecast to continue increasing. In
the summer term 2013 (term of greatest demand) 6,530 children three and four year
olds were accessing their free early year’s education; a growth of 4.3%.
7.1.9 A number of children’s centres cover a wide area and as such make use of
outreach points or service delivery points in order that every community within their
catchment reach area has appropriate provision. The number of children aged 0- 5
within a reach area vary dependent on the local geography and deprivation scores
7.1.10 Table 7.5 shows the overall pupil product ratio is the number of children who
are produced by the by the newly built dwellings across Redbridge, i.e. child yield.
The top level results Borough wide for pre-school children was assessed to be 0.39
which varies in accordance with the size of the dwelling built, type and tenure of the
dwelling created.
Table 7.5 Pupil Product Ratio (PPR) by Number of Bedrooms in Newly Built Dwellings
No of
Bedrooms in
Dwellings
1 2 3 4 5
PPR across
all sizes of
dwelling
0.31 0.45 0.37 0.39 0.38
PPR across
all sizes of
flat
0.31 0.45 0.38 0.35 2.00
PPR across
all sizes of
house
0.00 0.46 0.37 0.41 0.25
Source: London Borough of Redbridge, Community Infrastructure Plan 2015-2030.
London Borough of Redbridge Borough Profile
151
7.1.11 As it is not possible to predict the type and tenure of the houses which will be
completed in the Borough in future, the average child yield of 0.39 is used. However,
it is acknowledged that the figure is likely to vary depending on the nature of units
completed. The housing target for Redbridge included within the London Plan is for
1,123 new dwellings per year which over the fifteen year Local Plan (2015- 2030)
time frame would be 16,845 new dwellings. If, on average, each of these dwellings
accommodated an average of 0.39 children of pre-school age this would lead to an
additional 6,570 pre-school children. These children do not all necessarily require
childcare provision.
7.1.12 Therefore, for the anticipated child yield from new units developed the total
cost is estimated to be £105,625,890 between 2015 and 2030. The SureStart Early
Years and Childcare Centre Example Model Brief for a 56 place childcare facility sets
out the approximate floorspace requirement of 513m². Based on the standard land
cost of £5.6 million per hectare this would cost £287,280. Whilst this would not
completely satisfy the anticipated demand from the new housing it is likely that some
of the demand will be satisfied through alternative ways to manage the increase in
demand for places. This can include extensions to existing provision, improvements
to the staffing structures to increase registered places, and training and
encouragement for accreditation for childminders. Furthermore, not every child will
require childcare; some parents will not work or will use relatives to look after their
children. Therefore, the overall cost would be £105,913,170 (including capital and
land costs). Table 7.6 shows the existing provision of schools.

London Borough of Redbridge Borough Profile
152
Table 7.6 Redbridge Schools (Academic Year 2013/14)
Type of School Number of
Schools
Number of
School Places
Percentage of
Total Places
Average
School Size
Infants 6 1740 3.53 290
Juniors 5 2240 4.55 448
Primary 40 21,916 44.5 548
Secondary 11 15,753 32 1432
Free School (Primary) 1 240 0.49 240
Academies (Secondary) 6 5055 10.3 842
Academy (All Through) 1 1890 3.84 1890
Academy(Primary) 1 420 0.85 420
Total 71 49,254 100
Source: London Borough of Redbridge, Community Infrastructure Plan 2015-2030.
7.1.13 Figure 7.1 shows the existing major educational facilities within the Borough
Figure 7.1 Major Educational Facilities in Redbridge
© Crown copyright and database rights 2015 Ordnance Survey. LB Redbridge 100017755
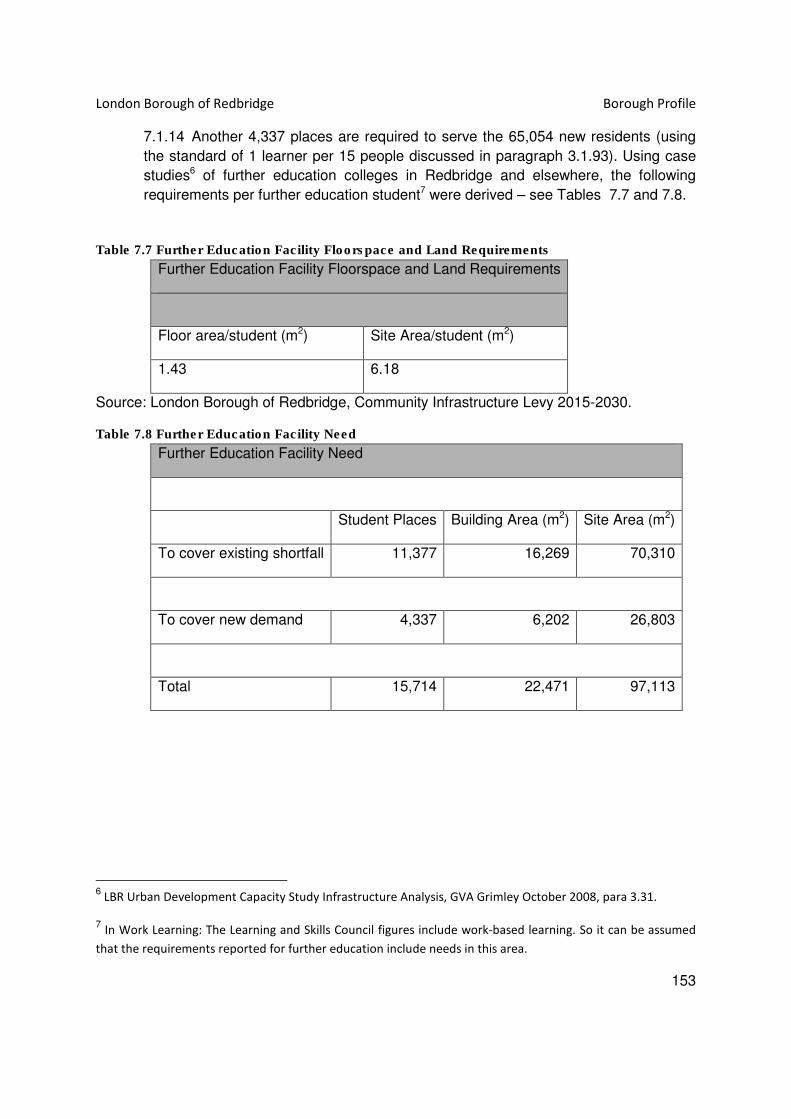
London Borough of Redbridge Borough Profile
153
7.1.14 Another 4,337 places are required to serve the 65,054 new residents (using
the standard of 1 learner per 15 people discussed in paragraph 3.1.93). Using case
studies6 of further education colleges in Redbridge and elsewhere, the following
requirements per further education student7 were derived – see Tables 7.7 and 7.8.
Table 7.7 Further Education Facility Floorspace and Land Requirements
Further Education Facility Floorspace and Land Requirements
Floor area/student (m2) Site Area/student (m2)
1.43 6.18
Source: London Borough of Redbridge, Community Infrastructure Levy 2015-2030.
Table 7.8 Further Education Facility Need
Further Education Facility Need
Student Places Building Area (m2) Site Area (m2)
To cover existing shortfall 11,377 16,269 70,310
To cover new demand 4,337 6,202 26,803
Total 15,714 22,471 97,113
6 LBR Urban Development Capacity Study Infrastructure Analysis, GVA Grimley October 2008, para 3.31.
7 In Work Learning: The Learning and Skills Council figures include work-based learning. So it can be assumed
that the requirements reported for further education include needs in this area.

London Borough of Redbridge Borough Profile
154
7.1.15 The Council undertook a Child Yield study 2013. As part of this study
households containing children aged under 5 years and not in full time education
were asked what form of child care they used. In total 465 children were identified in
this category, with 50 % of respondents indicating that none of the identified child
care options were applicable. A quarter of respondents identified Day Nursery. Figure
7.2 illustrates the above.
Figure 7.2 Redbridge Households Childcare Arrangements
7.1.16 Three quarters (75.4%) of Redbridge residents aged 3 and over spoke
English as their main language. This was slightly lower than the London average
(77.9%) and significantly lower than England and Wales (92 %). 3.9 % of Redbridge
residents aged 3 and over, had a main language other than English and could not
speak English well, 0.7 % could not speak English at all, this is very similar to the
averages for London. Clementswood (at 57.4 %) had the lowest proportion of
residents ages 3 and over with English as their main language, followed by Loxford,
Clementswood, Goodmayes; and Loxford had the highest proportion of residents
with a main language other than English who could not speak English at all. Table
7.9 provides a breakdown in each ward of the proportions that could not speak
English well or at all. The three foremost languages spoken in Redbridge as a first
language, after English, were Urdu (3.8 %), Punjabi (3.1 %) and Tamil (2.6 %). In
London they were Polish (1.9%), Bengali with Sylheti and Chatgaya (1.5 %) and
Gujarati (1.3 %). Nationally, they were Polish (1 %), Punjabi (0.5 %) and Urdu (0.5
%).

London Borough of Redbridge Borough Profile
155
Table 7.9 Redbridge Language Position by Ward
Source: Census Data, as interpreted by London Borough of Redbridge, Corporate Policy
and Performance.
7.1.17 Figure 7.3 below illustrates the spatial distribution of the proportion of
residents ages 3 or above who could not speak English well or at all at the time of the
last census 2011.

London Borough of Redbridge Borough Profile
156
Figure 7.3Residents Aged 3 and Over with Difficulty Speaking English
© Crown copyright and database rights 2015 Ordnance Survey. LB Redbridge 100017755

London Borough of Redbridge Borough Profile
157

London Borough of Redbridge Borough Profile
158
8 Environment and Transportation
8.1 Environment - The Current Situation
Note - This chapter should be read with reference to Chapter 2 Redbridge Borough Context,
in relation to physical characteristics of the Borough.

London Borough of Redbridge Borough Profile
159
Carbon Emissions
8.1.1 Redbridge Borough Carbon Dioxide Emissions 3.5 tonnes C02 per capita (2012) -
there has been a reduction in the per capita emissions (tonnes/ capita) 2010 – 3.7
tonnes, as per the Boroughs Annual Monitoring Report of 2013-2014.
8.1.2 The Borough-wide carbon emissions in Redbridge were 3.5 tonnes per capita
in 2012, the year for which the most recent data is available. This represents a
decrease of 20.5% from the 4.4 tonnes per capita in 2005, the first year data at
Borough level was available. It however does represent a 2.9% increase from the
previous year (2011). The figures at a London-wide level are 5.2 tonnes per capita in
2012, compared to 6.2 tonnes per capita in 2005, representing a 16.1% decrease.
Consequently, whilst Redbridge’s figures have increased in the most recent year
data is available, the increase has been less than London in both numerical and
percentage terms and the overall borough reduction since 2005 is greater than for
London. The Boroughs Annual Monitoring Report notes that this increase is
attributed to the significant increase in the numbers of persons per household within
the Borough and may in part be attributed to increased economic activity as the
country/borough recovered from the economic downturn. (London Borough of
Redbridge, Annual Monitoring Report, 2013 - 2014).
8.1.3 The Council is part of the Carbon Reduction Commitment Energy Efficiency
Scheme (CRC) which is a mandatory scheme aimed at improving energy efficiency
and cutting emissions in large public and private sector organisations. As part of this
the Council has to purchase carbon credits depending on the amount of carbon it
produces and performance is recorded in a league table. Under the CRC scheme,
Redbridge reported 27,520 tonnes of carbon dioxide as a result of energy usage by
its building and schools in 2013/14, down from 28,826 tonnes in 2012/13 – a 4.5%
reduction. In 2011 (the first year of the CRC) the boroughs emissions were 31,407
tonnes, meaning the council has reduced its carbon emissions by 12.4% since
2010/11. In the past two years Redbridge Council has worked to improved energy
efficiency in 23 heating and lighting systems and in 2012/13 invested in the latest
energy efficiency lighting that uses LED technology to reduce the carbon footprint
further. (London Borough of Redbridge, Annual Monitoring Report, 2013-2014).
8.1.4 Schools make up over 60% of the Council’s carbon emissions profile under
CRC and Redbridge has offered financial assistance to help improve energy
efficiency in schools. It should be noted that the CRC scheme does not cover all of
the council’s emission and that changes to the scheme (Phase 2 runs from 1 April
2014 to 31 March 2019) in the near future will change the reportable emissions.
(London Borough of Redbridge, Annual Monitoring Report, 2013-2014).

London Borough of Redbridge Borough Profile
160
8.1.5 A carbon Reduction study at the Borough-wide level, the study found that
carbon emissions have already been reduced by 11% (2005-2012). New
development is however projected to increase emissions by 3 % between 2012-
2020. National action (particularly the decarbonisation of the electricity grid) is
expected to reduce emissions by 8.5 % during the same period, with regional
initiatives (transport decarbonisation) reducing emissions by a further 1.5 %. The net
reduction from previous actions and those proposed at a national and regional level
is therefore 18 % by 2020 from a 2005 baseline. (London Borough of Redbridge,
Annual Monitoring Report, 2013 - 2014).
Minerals
8.1.6 Although Redbridge has a large amount of minerals supply to the east of the
Borough there is not a lot of extraction taking place.
8.2 Transportation - The Current Situation
8.2.1 This section assesses the current status of transportation and travel pattern
statistics, which would help inform policies relating to transportation. Figure 8.1
shows the transportation network within the Borough, namely the railway and arterial
road network routes.
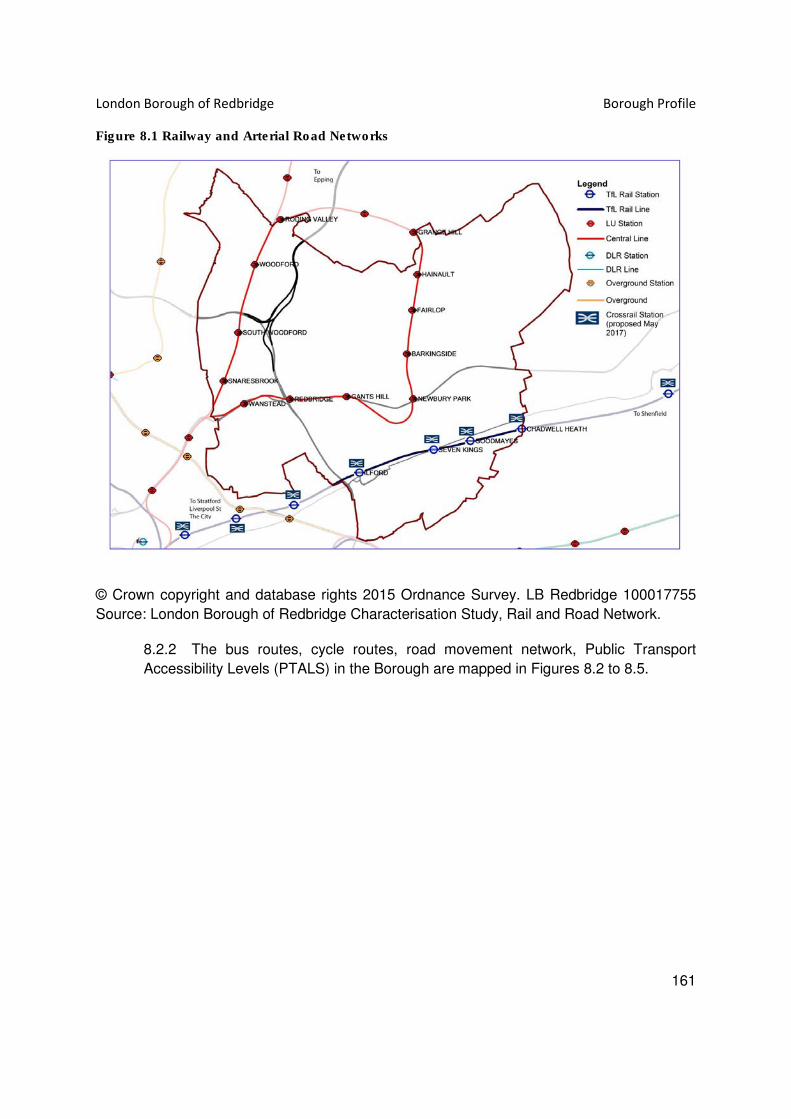
London Borough of Redbridge Borough Profile
161
Figure 8.1 Railway and Arterial Road Networks
© Crown copyright and database rights 2015 Ordnance Survey. LB Redbridge 100017755
Source: London Borough of Redbridge Characterisation Study, Rail and Road Network.
8.2.2 The bus routes, cycle routes, road movement network, Public Transport
Accessibility Levels (PTALS) in the Borough are mapped in Figures 8.2 to 8.5.

London Borough of Redbridge Borough Profile
162
Figure 8.2 Bus Routes within Redbridge
© Crown copyright and database rights 2015 Ordnance Survey. LB Redbridge 100017755
Source: London Borough of Redbridge Bus Routes Network.

London Borough of Redbridge Borough Profile
163
Figure 8.3 Cycle Routes
© Crown copyright and database rights 2015 Ordnance Survey. LB Redbridge 100017755
Source: London Borough of Redbridge Cycle Routes Network.

London Borough of Redbridge Borough Profile
164
Figure 8.4 Redbridge Road Network
© Crown copyright and database rights 2015 Ordnance Survey. LB Redbridge 100017755
Source: London Borough of Redbridge, Road Movement Network.

London Borough of Redbridge Borough Profile
165
Figure 8.5 Public Transport Accessibility Levels (PTALs) in Redbridge
© Crown copyright and database rights 2015 Ordnance Survey. LB Redbridge 100017755
Source: London Borough of Redbridge, PTAL rating across the Borough.
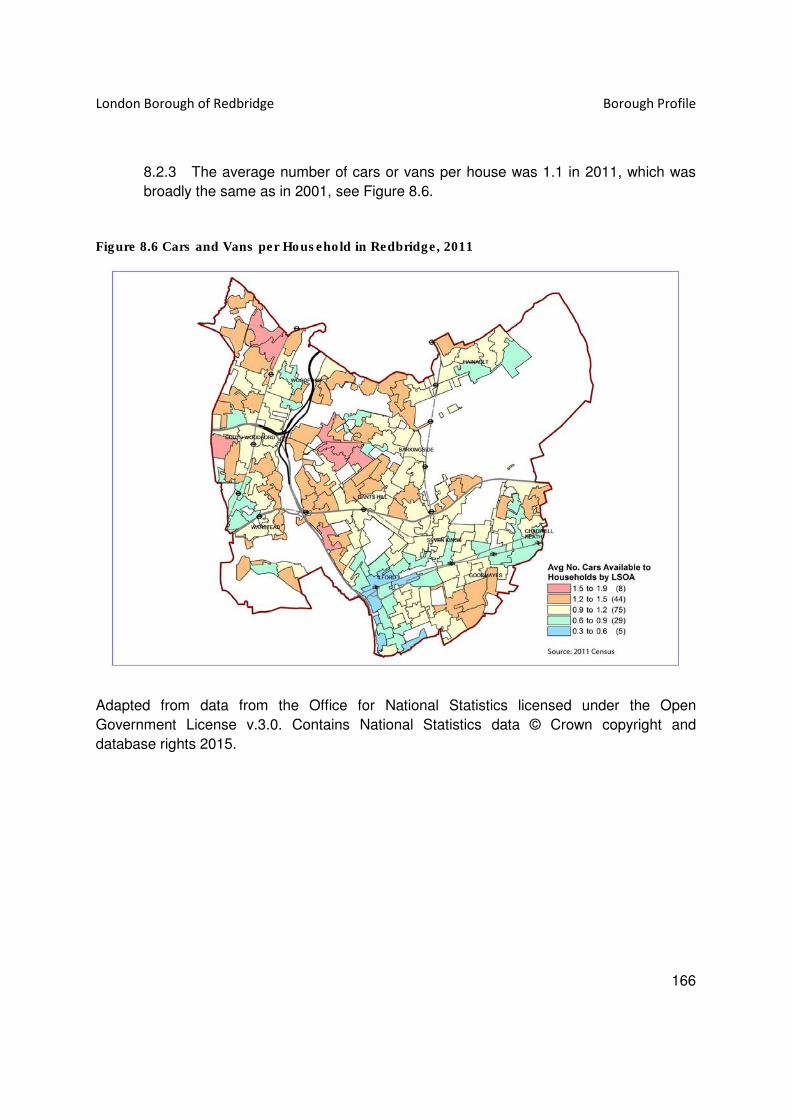
London Borough of Redbridge Borough Profile
166
8.2.3 The average number of cars or vans per house was 1.1 in 2011, which was
broadly the same as in 2001, see Figure 8.6.
Figure 8.6 Cars and Vans per Household in Redbridge, 2011
Adapted from data from the Office for National Statistics licensed under the Open
Government License v.3.0. Contains National Statistics data © Crown copyright and
database rights 2015.

London Borough of Redbridge Borough Profile
167
8.2.4 There was a slight increase in households that did not have a car at 27.9% in 2011 up
from 26.2 % in 2001. Households with one car decreased from 46.6 % in 2001 to 45.0
% in 2011; households with 2 cars decreased from 21.8 % in 2001 to 20.9 %;
households with 3 cars/ vans rose from 4.2 % in 2001 to 4.8 % in 2011.
8.2.5 At 1.43 cars or vans per household, Clayhall was within the highest 3 per cent
of all London wards for the average numbers of cars or vans per household.
8.2.6 8.2.6 The Office of Rail Regulation statistics show that Ilford train station is
the 47th busiest station in the country and in 2013/14 had just over 7.6 million entries
and exits, up 11% on the previous year.
8.2.7 8.2.7 In 2012, 14.9 % of children attending secondary school in Redbridge
and 7.75 % of those attending primary school in the Borough did not actually live in
the Borough, demonstrating a lot of inward migration to the Borough. Similarly 13.8
% of secondary school age children living in Redbridge went to school outside the
Borough.
8.2.8 The proportion of pupils travelling by car decreased from 30.8 % in 2008/09 to
26.0% in 2011/12, although increased in 2012/13. Similarly over the same period of
time, cycling to school increased from 1% to 2.1 % and then again disappointingly
reduced in 2012/13.
8.2.9 Redbridge has been collecting the modes of transport data for schools since
2008/09. The mode of travel data for academic years 2011/2012 and 2012/13 shows
the following. Most recent figures suggest that 46.61 % of people either travel by
walking/ scooter/ buggy, 32.22 % travel by car, 1.94 % travel by train/ tram, 17.44 %
travel by bus, and 1.79% travel by cycle. The breakdown for modal split from 2012/13
is as follows: car: 11,430, car share: 1,658, park and stride: 3,363, DLR: 37, rail: 319,
tram public bus: 8,113, school bus: 789, cycle: 915, buggy: 64, scooter, 723 and
walking: 23,006. Equating to 50,417 in total.
8.2.10 By looking at census data and data that relates to year specific sources for
the year 2012, it can be understood that the lower the PTAL rating the greater the
percentage likelihood for the ownership of cars and the greater the likelihood of such
areas to be identified as areas of public transport deficiency as identified within the
character areas appraisal produced by the Borough – see Figure 8.7.

London Borough of Redbridge Borough Profile
168
Figure 8.7 Public Transport Deficiency in Redbridge
© Crown copyright and database rights 2015 Ordnance Survey. LB Redbridge 100017755
Source: London Borough of Redbridge, Public Transport Deficiency Map.
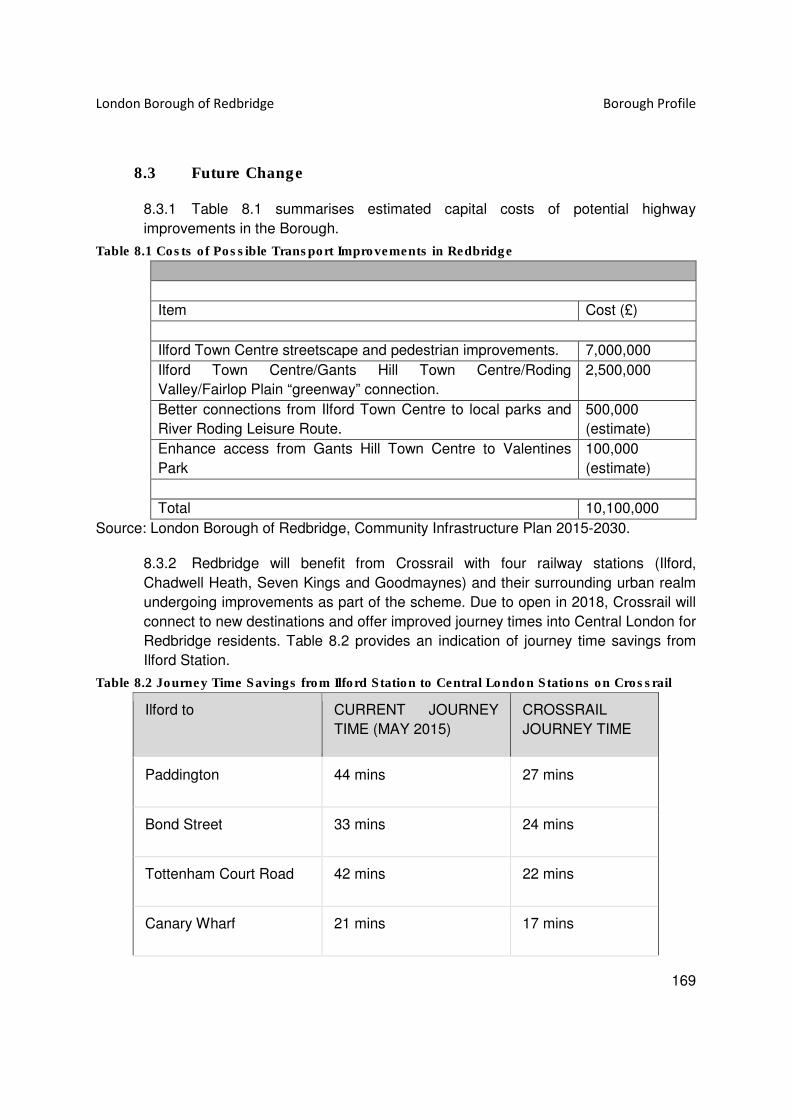
London Borough of Redbridge Borough Profile
169
8.3 Future Change
8.3.1 Table 8.1 summarises estimated capital costs of potential highway
improvements in the Borough.
Table 8.1 Costs of Possible Transport Improvements in Redbridge
Item Cost (£)
Ilford Town Centre streetscape and pedestrian improvements. 7,000,000
Ilford Town Centre/Gants Hill Town Centre/Roding
Valley/Fairlop Plain “greenway” connection.
2,500,000
Better connections from Ilford Town Centre to local parks and
River Roding Leisure Route.
500,000
(estimate)
Enhance access from Gants Hill Town Centre to Valentines
Park
100,000
(estimate)
Total 10,100,000
Source: London Borough of Redbridge, Community Infrastructure Plan 2015-2030.
8.3.2 Redbridge will benefit from Crossrail with four railway stations (Ilford,
Chadwell Heath, Seven Kings and Goodmaynes) and their surrounding urban realm
undergoing improvements as part of the scheme. Due to open in 2018, Crossrail will
connect to new destinations and offer improved journey times into Central London for
Redbridge residents. Table 8.2 provides an indication of journey time savings from
Ilford Station.
Table 8.2 Journey Time Savings from Ilford Station to Central London Stations on Crossrail
Ilford to CURRENT JOURNEY
TIME (MAY 2015)
CROSSRAIL
JOURNEY TIME
Paddington 44 mins 27 mins
Bond Street 33 mins 24 mins
Tottenham Court Road 42 mins 22 mins
Canary Wharf 21 mins 17 mins

London Borough of Redbridge Borough Profile
170
Heathrow 1, 2, 3 68 mins 52 mins
Source: www.crossrail.co.uk accessed 29th October 2015

London Borough of Redbridge Borough Profile
171

London Borough of Redbridge Borough Profile
172
9 Crime
9.1 The Current Situation
9.1.1 In August 2015, the crime rate in Redbridge was 5.75 per 1,000 population
lower than the London average of 7.28 per 1,000 population. The annual crime count
has been declining in recent years from 22,424 in 2012/13 to 20,123 in 2014/15.
Table 9.1 highlights that the most common types of crime reported in Redbridge
relate to anti-social behaviour followed by violence against the person.
Table 9.1 Crime Counts and Rates by Type of Crime, August 2015
Crime type Crime count Crime rate
Total notifiable offences 1464 5.25
Residential burglary 84 0.30
Burglary other 46 0.16
Theft of motor vehicle 59 0.21
Theft from motor vehicle 159 0.57
Robbery business 4 0.01
Robbery personal 49 0.18
Violence against the person 466 1.67
Most serious violence 47 0.17
Anti-social behaviour 559 2.00
Source: Metropolitan police crime mapping website accessed 14/10/2015
9.1.2 As shown in Table 9.2, crime rates vary widely across the Borough with the
highest rates in Clementswood ward with a crime rate of 10.98 largely attributable to
anti-social behaviour , of which 90 crimes were reported and violence against the
person of which 56 crimes were reported in the month of August 2015. The ward with
the lowest crime rate is Monkhams with a crime rate of 2.21

London Borough of Redbridge Borough Profile
173
Table 9.2 Crime Counts and Rates for Wards in Redbridge, August 2015
Ward Crime count Crime rate
Aldborough 76 5.23
Barkingside 71 5.63
Bridge 45 3.86
Chadwell 61 4.28
Church End 64 5.56
Clayhall 68 5.14
Clementswood 161 10.98
Cranbrook 77 6.03
Fairlop 57 4.51
Fullwell 44 3.41
Goodmayes 67 5.13
Hainault 46 3.55
Loxford 112 6.77
Mayfield 57 4.17
Monkhams 23 2.21
Newbury 69 4.12
Roding 42 3.49
Seven Kings 108 7.12
Snaresbrook 40 3.37
Valentines 100 7.08
Wanstead 45 3.75
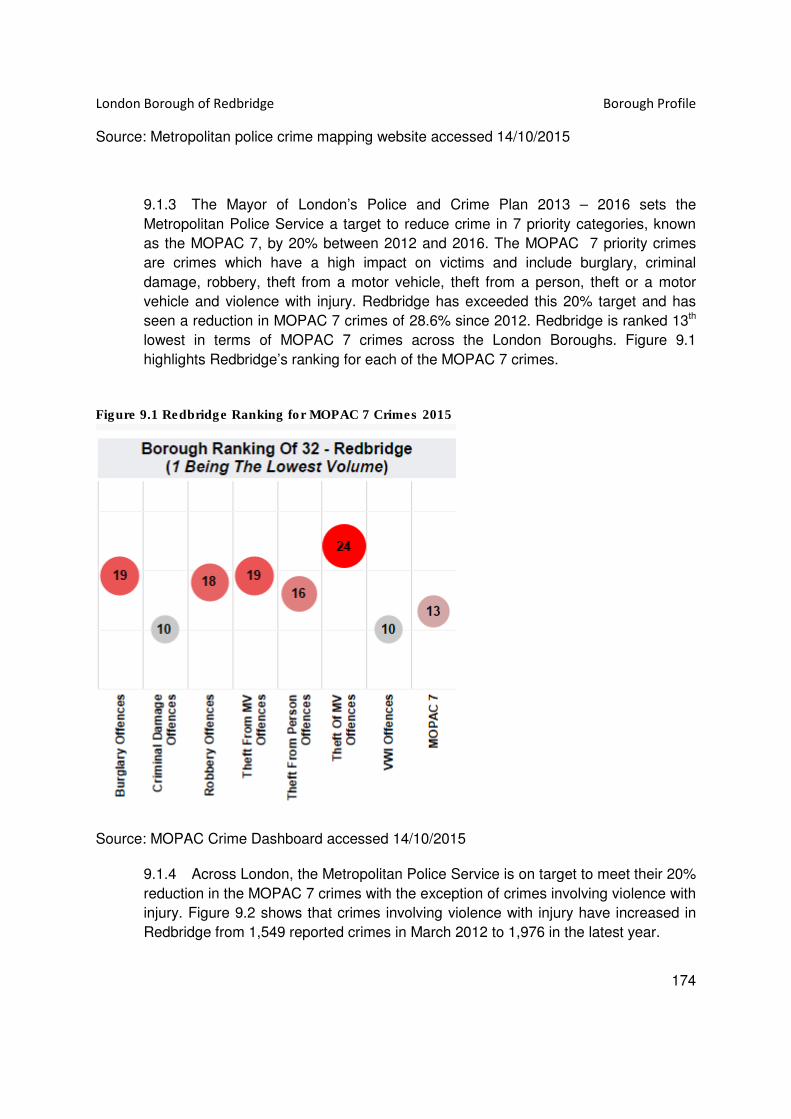
London Borough of Redbridge Borough Profile
174
Source: Metropolitan police crime mapping website accessed 14/10/2015
9.1.3 The Mayor of London’s Police and Crime Plan 2013 – 2016 sets the
Metropolitan Police Service a target to reduce crime in 7 priority categories, known
as the MOPAC 7, by 20% between 2012 and 2016. The MOPAC 7 priority crimes
are crimes which have a high impact on victims and include burglary, criminal
damage, robbery, theft from a motor vehicle, theft from a person, theft or a motor
vehicle and violence with injury. Redbridge has exceeded this 20% target and has
seen a reduction in MOPAC 7 crimes of 28.6% since 2012. Redbridge is ranked 13th
lowest in terms of MOPAC 7 crimes across the London Boroughs. Figure 9.1
highlights Redbridge’s ranking for each of the MOPAC 7 crimes.
Figure 9.1 Redbridge Ranking for MOPAC 7 Crimes 2015
Source: MOPAC Crime Dashboard accessed 14/10/2015
9.1.4 Across London, the Metropolitan Police Service is on target to meet their 20%
reduction in the MOPAC 7 crimes with the exception of crimes involving violence with
injury. Figure 9.2 shows that crimes involving violence with injury have increased in
Redbridge from 1,549 reported crimes in March 2012 to 1,976 in the latest year.
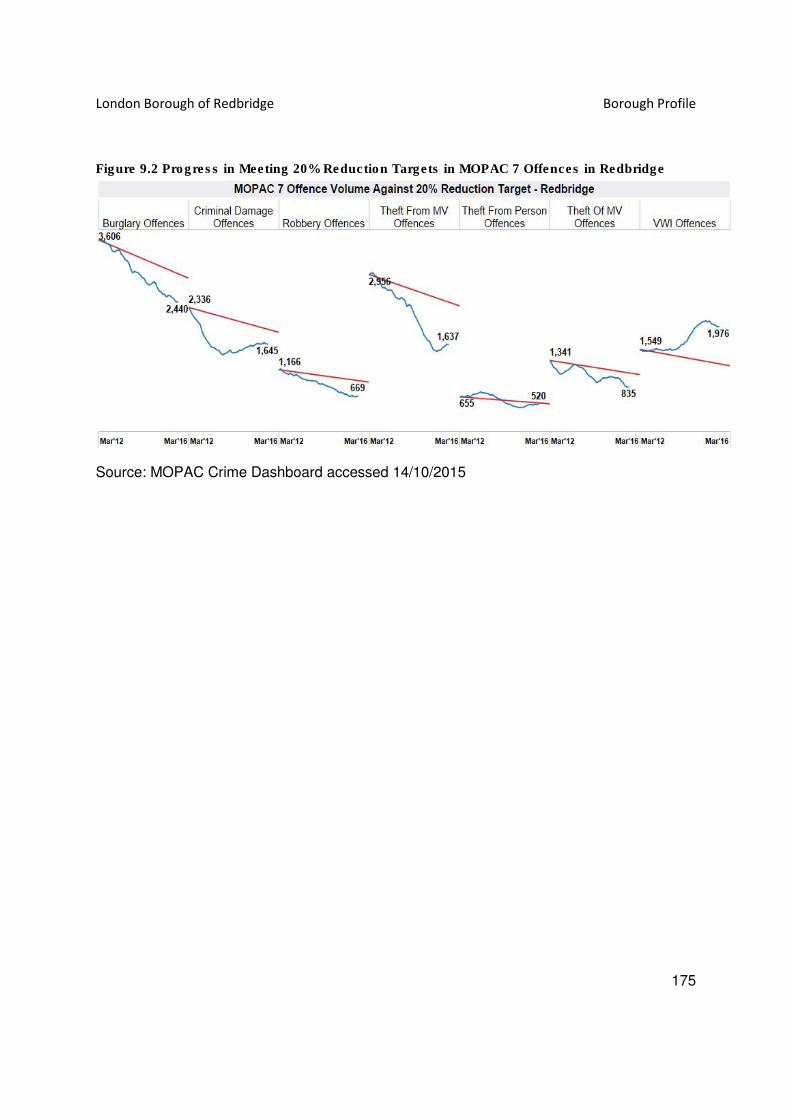
London Borough of Redbridge Borough Profile
175
Figure 9.2 Progress in Meeting 20% Reduction Targets in MOPAC 7 Offences in Redbridge
Source: MOPAC Crime Dashboard accessed 14/10/2015
London Borough of Redbridge Borough Profile
176
10 Summary
10.1 Overview
Borough Context
10.1.1 The Redbridge Borough Context chapter provides a comprehensive overview
of the characteristics of the London Borough of Redbridge as a contribution to the
preparation of the Redbridge Local Plan 2015-2030. It examined the physical make-
up of the Borough, covering land use, town centre characteristics etc, and looks in
detail at the current population, housing profile, community health, the economy,
education, and environment and transport. This enables the challenges which the
Borough faces to be identified, providing an important information base for the Local
Plan.
10.1.2 Statistics are acquired from details within the 2011 census records and GLA
population projections, and is also integrated to the characterisation study.
Redbridge has a growing population with 297,000 residents in 2015. Areas of denser
population are in the south of the Borough where there are larger numbers of smaller
housing units.
10.1.3 The Borough as a whole is the 9th largest London Borough by area at 5641
ha, and the demographic, deprivation levels of the people living within the Borough
has been examined and demonstrates that the Borough is very diverse in terms of its
resident demographic population. In addition to these social attributes to the Borough
the physical built form (housing stock) has also been looked into.
10.2 Population
10.2.1 The Borough’s population is described (Chapter 3) in terms of its current
level, historic change, future projections, and characteristics relating to age structure,
household structure, ethnicity, etc, set within a national and local context. The
current Borough population of 297,000 is projected to grow to 321,000 by 2020 and
362,000 by 2030. Most of the growth over 2001-11 has taken place in the east of the
Borough, with significant growth also taking place in some northern and southern
wards. Clementswood and Loxford have been the fastest growing wards over this
period.
10.2.2 Chapter 3 details population characteristics including density, age structure,
gender split, ethnicity by area etc. Redbridge’s population age structure is close to
the London average but it is one of only eight London Boroughs which are
considered to have a majority ethnic population.
London Borough of Redbridge Borough Profile
177
10.2.3 One of the main issues arising from population change is the need for
increased additional community infrastructure. A table of proposed community
infrastructure provision over 2015-2030 which highlights this shows the major
increase in costs of future education provision - £267.3 million to 2010. In
comparison transport investment is estimated at just £10.1 million.
Housing
10.2.4 In 2015 total housing stock in Redbridge was 102,140. The 2011 census
showed that 63.6% dwellings were privately owned, the Council and social rented
proportion was 11.4% and privately rented 22.9%. Just over 31% of the housing
units were flats. One person households accounted for just over 25% of the total,
and average household size was 2.8 - exceeding the London average of 2.5.
10.2.5 The Redbridge Annual Monitoring Report 2013-14 estimated that the gross
housing requirement in the Borough was 47,459 – mentioning 24,280 market
housing, 14,459 social rented housing, and 8,434 intermediate housing. Market
housing supply was close to the requirement but social rented and intermediate
supply fell considerably short – respectively 3,895 and 5,335. Overall capacity was
estimated to be some 12,987, with an annual monitoring target of 1,123 over the
years 2012-2025.
10.2.6 With regard to household composition, most categories of households have
increased in the Borough, along with family sizes and one person households. The
latter accounted for just over 25% of total households, a little below the London
average. Detailed figures in the housing chapter show the distribution of housing and
household characteristics across the Borough, including housing occupancy and
dwelling type.
10.2.7 In general, residents were more likely to live in houses and less likely to live in
flats than the London average. Ownership with a mortgage or loan decreased by
over 9%, a similar trend to that occurring generally in London. Renting with private
landlords or letting agencies increased by a similar margin, also following a general
London trend. Average household size increased to 2.8 persons per household, the
highest proportion found in Clementswood ward at 3.3 and the lowest at Snaresbrook
ward at 2.2. The Borough does have a higher than London average proportion of
households of married or same sex civil partnership.
London Borough of Redbridge Borough Profile
178
10.2.8 The result of the increased numbers of people is that the gap between
housing need and supply has widened, with Redbridge having the largest potential
gap of any London Borough. Housing completions (204 units) and approvals (701)
were low in 2013/14 and below the London Plan target of 1,123 units. This is due to
broader market conditions and availability of finance and reflects the London wide
picture. However there are still 1,543 net residential units in the pipeline in the
Borough, which could be a significant source of supply.
Health and Wellbeing
10.2.9 Chapter 6 considered health and wellbeing under a number of headings
covering life expectancy, major diseases, lifestyle, and other relevant issues. Life
expectancy for Redbridge residents has steadily increased over time, being higher
than the London and England average. Health profiles across the Borough were
uneven however, with certain wards like Clayhall and Loxford having higher long
term health and disability problems.
10.2.10 Mortality rates in respect of most diseases have been falling as
nationally, but Redbridge has had differing experiences with poorer outcomes for
certain conditions and better for others – e.g. cancer. Information is provided for
screening and immunisation in the Borough and statistics are provided for the relative
progress compared to national rates for a variety of conditions like obesity, and
alcohol and smoking related conditions.
10.2.11 Environmental impacts on health like air quality are summarised, the
concern with the levels of nitrogen oxide and particulate emissions being noted.
These are not surprisingly more acute in London than average. This is described
within a range of public services relating to health care, and the Borough Health and
Wellbeing Strategy 2013-16. Priorities over 2013-16 are set out in an overall table
with headings including “Improving life chances for children”, “Prevention and early
intervention” etc.
10.2.12 The Chapter concludes with a note about the importance of policies to
reduce environmental risks and encourage healthy lifestyles, e.g. pursuit of transport
policy which promotes walking and cycling, and retail policy which restricts hot food
take-away, and identification of sites for health facilities. Health and wellbeing
“should be seen as a cross-cutting issue to be reflected across a wide range of policy
areas”.
Economy

London Borough of Redbridge Borough Profile
179
10.2.13 Chapter 7 provides information on the local economy. In 2014 there
were an estimated 74,400 jobs in Redbridge, of which 66.2% were full time. The
Borough had a notably higher proportion of part time jobs (33.8%) than the London
average (26.2%) and Great Britain average (31.6%). In 2014 the largest sectors were
Public Administration, Education and Health, Financial and Real Estate,
Administrative Activities, and Wholesale and Retail.
10.2.14 The number of businesses operating in Redbridge (in 2015) were
11,575, although only 20 of those employed 250 or more. The position has been
healthier in the Borough than in London and Great Britain, with a net increase in
businesses over the 2004-13 period.
10.2.15 Redbridge has lower levels of economically active residents (74.6%)
than the London (77%) or Great Britain average (77.4%), this is mostly due to fewer
women being economically active (65.8%). On the other hand the Borough has more
self-employed people – 14% compared with 12.8% in London as a whole and 10.1%
in Britain. For full time workers, average weekly pay in 2014 was £621.6 in Redbridge
compared with £617.8 in London and £520.8 in Great Britain. Fewer economically
active are claiming Job Seekers Allowance than the London and GB averages.
10.2.16 The report provides details of travel to work patterns, the primary
feature for Redbridge being a substantial net outflow – 59,265 travelling out of the
Borough and 22,179 travelling into the Borough in 2011. The main outward
destinations were the City and Westminster, with large numbers also commuting to
Tower Hamlets.
10.2.17 The last main part of the chapter deals with retail activity. In
Redbridge as a whole a London Wide Town Health Check in 2012 reported gross
retail floorspace levels of 104,000 m2 comparison goods, and 45,000 m2 of
convenience goods. Much the largest centre is Ilford, the only Metropolitan Centre in
the Borough, which had 77% of the Borough’s comparison floorspace. The chapter
provides a detailed breakdown of floorspace characteristics, including division into
multiples, independents, and shop type like department stores. Of the seven centres
with summary details provided, the largest after Ilford was Barkingside. For the
seven main centres data is provided for retail characteristics such as – food shops,
supermarkets etc – and numbers of service outlets, like estate agents and betting
shops. The chapter states that turnover has reduced in the Borough.
Education
10.2.18 Redbridge has a total of 98 schools, of which 54 are state funded
primary, 18, state funded secondary and 19 are independent. There are also a small
number of special schools. In total some 55,656 pupils attend the schools, of which
28,300 go to state funded primary and 22,600 go to state funded secondary
establishments. The number of pupils attending private schools is given as 4,221.

London Borough of Redbridge Borough Profile
180
10.2.19 For the academic year 2013/14 a table shows an update of this
distribution, plus figures for average school sizes. For primary schools, the average
size is 548, and for secondary schools 1,432. Average infants school size is given as
290, and All Through Academies 1,890, with Secondary Academies having an
average of 842 pupils and Primary Academies 420 pupils. Further data is provided
for the 17 Childrens Centres in Redbridge including their ward location. There were
9,606 registered childcare places in December 2012, delivered through a variety of
outlets including childminders, day nurseries, pre-school breakfast clubs, etc.
10.2.20 Future facility needs for further education in Redbridge are assessed
for the period 2015-20, when the Borough will expect some 65,000 new residents.
Some 15,700 new places will be required, to cover existing shortfall in addition to
new demand, and these are projected to require a building area of 22,500 m2 and a
site area of 97,100 m2.
10.2.21 The education section goes on to consider the response of Redbridge
households containing pre-school age children to a study looking at childcare
arrangements. It was found that 39% of the pre-school age group did not attend
nurseries, another 39% used private nurseries, and 22% used local authority
provided nurseries.
10.2.22 With regard to language, 75.4% of Redbridge residents aged 3 and
over spoke English as their main language, slightly lower than the London average of
77.9% and significantly lower than the England and Wales average of 92%. 3.9% of
residents aged 3 and over had a main language other than English and o.7% could
not speak English at all. After English the three most widely spoken languages
spoken as a first language were Urdu (3.8%), Punjabi (3.1%) and Tamil (2.6%).
Environment and Transport
10.2.23 Transport issues comprise the main part of the Environment and
Transport chapter. The chapter describes, with figures, the main transport networks
in Redbridge, covering:
- rail and arterial road network
- bus routes
- cycle routes
- more detailed road network routes
and concludes with a figure showing with public transport accessibility levels (PTALS) by
area within the Borough.
London Borough of Redbridge Borough Profile
181
10.2.24 Average cars per house in Redbridge in 2011 was 1.1, which was
apparently unchanged since 2001. There was in fact little change in the proportions
of households who had no car, 1 car, 2 cars or 3 or more cars.
10.2.25 With regard to rail transport, Ilford is the 30th busiest station in London,
with more than 5 million entries and exits per year. The level has however
decreased by over 12% over the last 3 years. Further information is given with
regard to a miscellany of movement matters including proportions of schoolchildren
travelling by car and by cycle, and general modal split for educational trips. A
summary figure of public transport deficiency is provided.
10.2.26 The transport chapter concludes with a table setting out estimated
capital costs of possible transport improvements in the Borough over the period
2015-20. The schemes listed include a variety of possible improvements including
Ilford centre streetscape improvements and better connections from Ilford town
centre to local parks, totalling £10.1 million in all, but do not appear to itemise clearly
major highway and other travel infrastructure projects.
Crime
10.2.27 The final chapter of the report covers crime. This lists crime counts
by type in 2015, noting a decline from 2012/13 to 2015/15. Antisocial behaviour is the
most commonly reported crime, and crime counts and rates are tabulated by ward for
2015. The Borough ranking is also shown. Finally the progress made in exceeding a
20% crime reduction target is shown with regard to different offences with the
exception of crimes of violence with injury which have been increasing across the
Borough.