Embed Size (px)
Citation preview
London Borough of Hammersmith & Fulham
FULL COUNCIL
21 February 2018
TREASURY MANAGEMENT STRATEGY STATEMENT 2018/19
Report of the Cabinet Member for Finance – Councillor Max Schmid
Open Report
Classification: For Decision Key Decision: Yes
Wards Affected: All
Accountable Director: Hitesh Jolapara, Strategic Finance Director
Report Author: Phil Triggs, Director of Treasury and Pensions
Contact Details: Tel: 0207 641 4136 E-mail: [email protected]
1. EXECUTIVE SUMMARY
1.1 The Local Government Act 2003 requires the Council to:
set out a statement of its treasury management strategy for borrowing, having regard to the Prudential Code and setting out Prudential Indicators for the next three years to ensure that the Council’s capital investment plans are affordable, prudent and sustainable.
prepare an Annual Investment Strategy, setting out the Council’s policies for managing its investments and for giving priority to the security and liquidity of those investments.
The Treasury Management Strategy Statement and Annual Investment Strategy must both have regard to guidance issued by the Department of Communities and Loval Government (DCLG) and must be approved by the full Council.
1.2 This report sets out the Council’s proposed Treasury Management Strategy and Annual Investment Strategy for 2018/19, and authorises the Strategic Finance Director to deliver the treasury management activities set out in the report.
1.3 The report is also designed to demonstrate compliance with the Local Government Act 2003, other regulations and statutory guidance for ensuring that the Council’s borrowing and investment plans are prudent, affordable and sustainable, and comply with statutory requirements.
2. RECOMMENDATIONS
2.1 That approval is given to the future borrowing and investment strategies as outlined in this report and that the Strategic Finance Director, in consultation with the Cabinet Member for Finance, be authorised to manage the Council’s cash flow, borrowing and investments in 2018/19 in line with this report.
2.2 In relation to the Council’s overall borrowing for the financial year, to note the comments and the Prudential Indicators as set out in this report and the revised Annual Investment Strategy set out in Appendix E.
3. BACKGROUND
3.1 The Council is required to set a balanced budget, which means that income raised during the year is budgeted to meet expenditure. Part of the treasury management operation is to ensure that:
The Council’s capital programme and corporate investment plans are adequately funded;
Cash flow is adequately planned, with cash being available when needed to discharge the Council’s legal obligations and to deliver Council services;
Surplus monies are invested wisely, in counterparties or financial instruments commensurate with the Council’s low risk appetite, providing security of capital and adequate liquidity before considering investment return.
3.2 Treasury Management Strategies provide a guide to the borrowing needs of the Council, essentially longer term cash flow planning, to ensure that the Council can meet its capital spending obligations. This management of longer term cash may involve arranging long or short term loans, using cash flow surpluses, or restructuring any debts previously entered into to meet Council risk or cost objectives.
3.3 The Council has formally adopted CIPFA’s Code of Practice on Treasury Management. The Code of Practice and Cross Sectoral Guidance Notes issued in 2009 and 2011 require that each Local Authority has a Treasury Management Policy Statement that is approved by the Full Council, and this is set out in Appendix A.
3.4 The Council also follows other key requirements of the Code as set out in Appendix B.
3.5 Prospects for interest rate changes and investment returns have been considered in developing and updating the Council’s Treasury Management Strategies. Market commentators are forecasting an increase in interest rates across all maturities, but a limited increase rather than a material change. The Council’s treasury management advisors, Link Asset Services (formerly Capita Asset Services), are currently forecasting a modest increase in rates to 0.75% by the end of 2018 from the current 0.50% base rate (see Appendix C for more details).
3.6 The importance of external economic factors is also a key driver in external parties setting rates and also availability of instruments in which to invest and borrow. Appendix D sets out the present views of our Treasury Consultants, Link Asset Services.
3.7 Sections 4 to 6 of this report comprise the Council’s Treasury Management Strategy which covers three main areas as summarised below:
1. Borrowing
Overall borrowing strategy
Limits on external borrowing
Maturity structure of borrowing
CFR projections
Affordability
The Minimum Revenue Provision (MRP) policy
Policy on borrowing in advance of need
Debt rescheduling
2. Capital spending plans
Capital spending plans
Housing Revenue Account borrowing needs.
Other investment opportunities
3. Managing cash balances and investments
The current cash position
Cash flow forecast
Prospects for investment returns
Council policy on investing and managing risk
Balancing short and longer term investments
Annual Investment Strategy
3.8 Section 7 of the report summarises the key prudential indicators. These provide a reference point or “dashboard” so that senior officers and Members can easily identify whether approved treasury management policies are being applied correctly in practice and take corrective action as required.
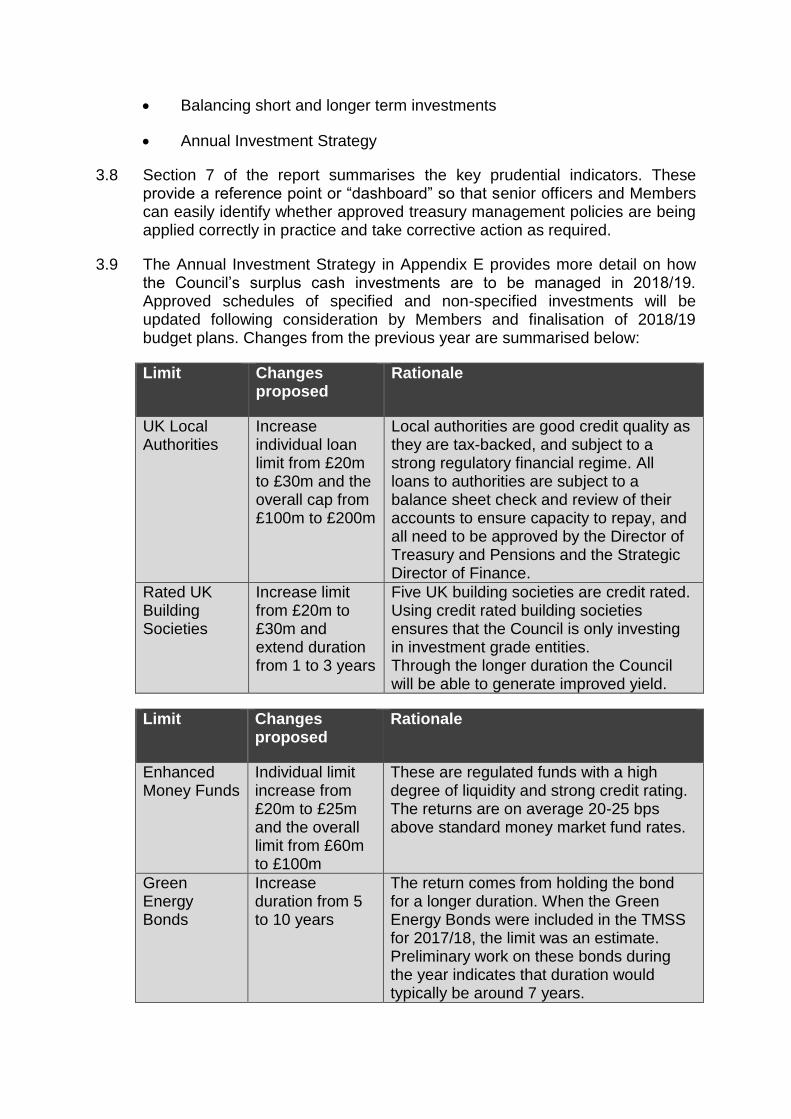
3.9 The Annual Investment Strategy in Appendix E provides more detail on how the Council’s surplus cash investments are to be managed in 2018/19. Approved schedules of specified and non-specified investments will be updated following consideration by Members and finalisation of 2018/19 budget plans. Changes from the previous year are summarised below:
Limit Changes proposed
Rationale
UK Local Authorities
Increase individual loan limit from £20m to £30m and the overall cap from £100m to £200m
Local authorities are good credit quality as they are tax-backed, and subject to a strong regulatory financial regime. All loans to authorities are subject to a balance sheet check and review of their accounts to ensure capacity to repay, and all need to be approved by the Director of Treasury and Pensions and the Strategic Director of Finance.
Rated UK Building Societies
Increase limit from £20m to £30m and extend duration from 1 to 3 years
Five UK building societies are credit rated. Using credit rated building societies ensures that the Council is only investing in investment grade entities. Through the longer duration the Council will be able to generate improved yield.
Limit Changes proposed
Rationale
Enhanced Money Funds
Individual limit increase from £20m to £25m and the overall limit from £60m to £100m
These are regulated funds with a high degree of liquidity and strong credit rating. The returns are on average 20-25 bps above standard money market fund rates.
Green Energy Bonds
Increase duration from 5 to 10 years
The return comes from holding the bond for a longer duration. When the Green Energy Bonds were included in the TMSS for 2017/18, the limit was an estimate. Preliminary work on these bonds during the year indicates that duration would typically be around 7 years.

3.10 These elements cover the requirements of the Local Government Act 2003, the CIPFA Prudential Code, the CIPFA Treasury Management Code and CLG Investment Guidance.
BORROWING
Overall borrowing strategy
4.1 The General Fund has a debt strategy of no new borrowing and where borrowing has fallen due for repayment it has not been replaced. This means that the capital borrowing need (the Capital Financing Requirement) has not been fully funded with borrowing, as cash balances and cash flow has been used as a temporary measure instead. This strategy is prudent as investment returns are very low and counterparty risk is high. The HRA’s funding requirements differ from the General Fund’s and internal borrowing in the HRA may be required in the future.
4.2 The Council’s main objective when borrowing money is to strike an appropriate balance between securing low interest costs and achieving cost certainty over the period for which funds are required.
4.3 Given the significant cuts to public expenditure and, in particular, to local government funding, the Council’s borrowing strategy continues to address the key issue of affordability without compromising the long-term stability of the debt portfolio. The key factors influencing the 2018/19 strategy are:
forecast borrowing requirements;
the current economic and market environment; and
interest rate forecasts.
4.4 The Council is currently maintaining an under-borrowed position. This means that capital expenditure has not been fully funded from loan debt as other funding streams (such as government grants and third party contributions, use of Council reserves and cash balances and capital receipts) have been employed where a vailable. This policy has served the Council well over the last few years while investment returns have been low and counterparty risk has been relatively high.
Limits on external borrowing
4.5 The Prudential Code requires the Council to set two limits on its total external debt, as set out in Table 1 below. The limits have remained at the same level compared with the 2017/18 Treasury Management Strategy Statement (TMSS) to reflect slippage in the capital programme from previous years. The limits are:
Authorised Limit for External Debt (Prudential Indicator 7a): This is the limit prescribed by section 3(1) of the Local Government Act 2003, representing the maximum level of borrowing which the Council may
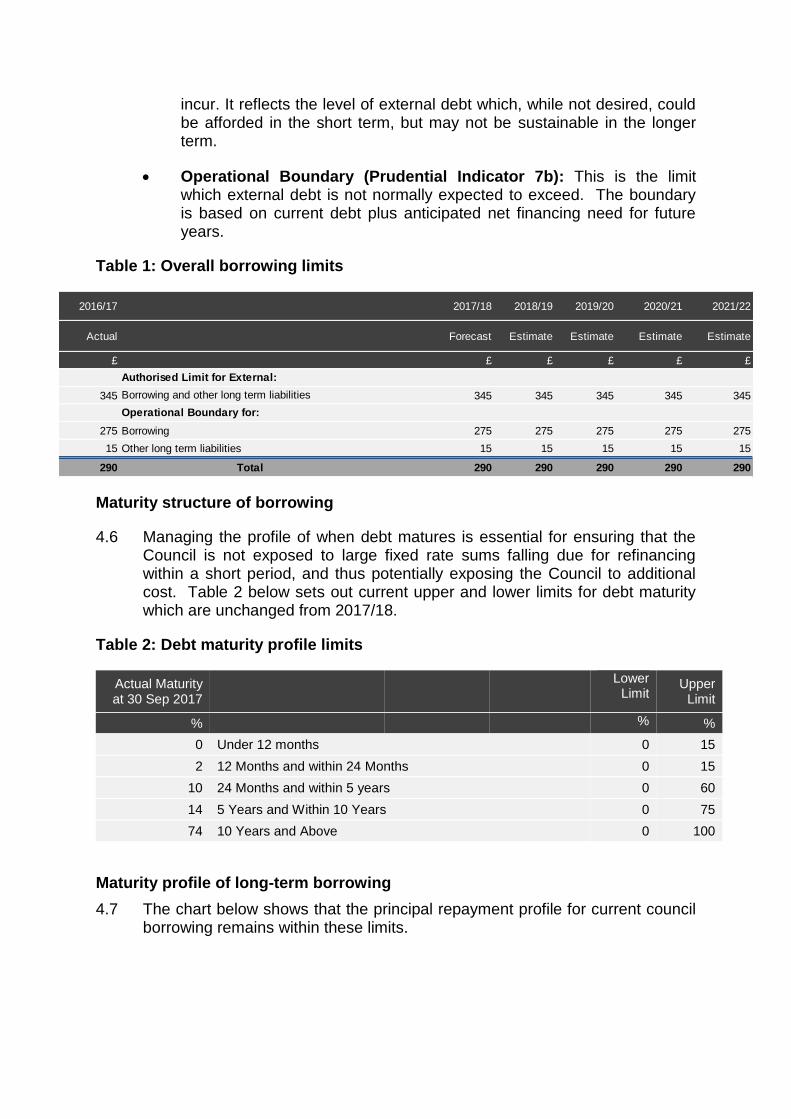
incur. It reflects the level of external debt which, while not desired, could be afforded in the short term, but may not be sustainable in the longer term.
Operational Boundary (Prudential Indicator 7b): This is the limit which external debt is not normally expected to exceed. The boundary is based on current debt plus anticipated net financing need for future years.
Table 1: Overall borrowing limits
Maturity structure of borrowing
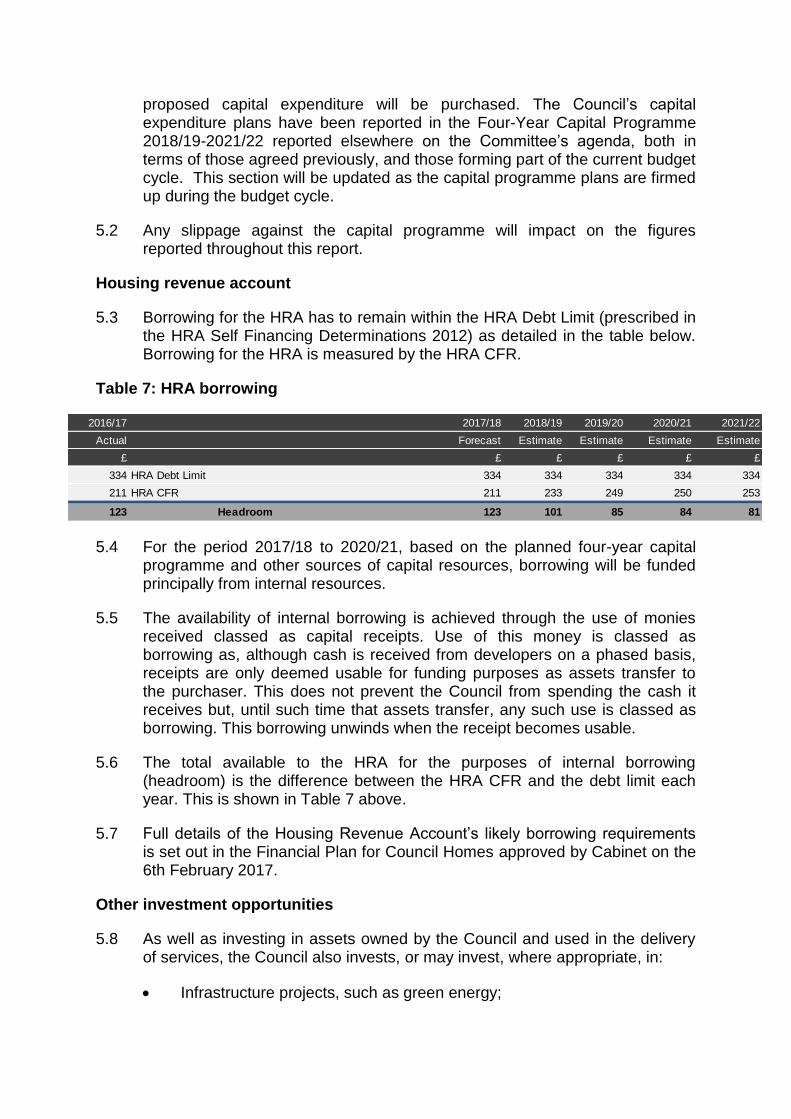
4.6 Managing the profile of when debt matures is essential for ensuring that the Council is not exposed to large fixed rate sums falling due for refinancing within a short period, and thus potentially exposing the Council to additional cost. Table 2 below sets out current upper and lower limits for debt maturity which are unchanged from 2017/18.
Table 2: Debt maturity profile limits
Actual Maturity at 30 Sep 2017
Lower
Limit Upper
Limit
% % %
0 Under 12 months 0 15
2 12 Months and within 24 Months 0 15
10 24 Months and within 5 years 0 60
14 5 Years and Within 10 Years 0 75
74 10 Years and Above 0 100
Maturity profile of long-term borrowing
4.7 The chart below shows that the principal repayment profile for current council borrowing remains within these limits.
2016/17 2017/18 2018/19 2019/20 2020/21 2021/22
Actual Forecast Estimate Estimate Estimate Estimate
£ £ £ £ £ £
345 345 345 345 345 345
275 Borrowing 275 275 275 275 275
15 Other long term liabilities 15 15 15 15 15
290 Total 290 290 290 290 290
Operational Boundary for:
Borrowing and other long term liabilities
Authorised Limit for External:

Capital Financing Requirement (CFR)
4.8 The CFR measures the extent to which capital expenditure has not yet been financed from either revenue or capital resources. Essentially, it measures the Council’s underlying borrowing need. Each year, the CFR will increase by the amounts of new capital expenditure not immediately financed.
4.9 Table 3 shows that the CFR will increase over the medium term. Consequently, the capital financing charge to revenue will increase, reflecting the capital spending plans.
Table 3a: Capital Financing Requirement forecast
2016/17 2017/18 2018/19 2019/20 2020/21 2021/22
Actual Forecast Estimate Estimate Estimate Estimate
£m £m £m £m £m £m
CFR as at 31 March
62 General Fund Closing CFR (detail in Table 3b)
65 87 85 86 88
211 Closing Forecast HRA CFR (including deferred costs of disposal)
211 233 249 250 253
273 TOTAL 276 320 334 336 341
Annual Change
51 General Fund 3 22 (2) 1 2
11 HRA 0 22 16 1 3
62 TOTAL 3 44 14 2 5
4.10 A more detailed analysis of the closing Forecast CFR is shown below:

Table 3b: General Fund Capital Financing Requirement forecast (detailed)
2016/17 2017/18 2018/19 2019/20 2020/21 2021/22
Actual Forecast Estimate Estimate Estimate Estimate
£m £m £m £m £m £m
47 General Fund CFR excluding DSG funded borrowing
47 57 55 58 61
4 DSG funded borrowing for schools windows
7 19 19 18 17
11 PFI and Finance lease liabilities 11 11 10 10 10
62 TOTAL 65 87 84 86 88
4.11 The schools window replacement programme is a £20m programme. The increase in MRP arising from this spend is to be met by top-slicing the schools DSG allocation.
4.12 The current capital programme does not include provision for the King Street Regeneration and Town Hall refurbishment developments and therefore the CFR forecasts above exclude the impact of these schemes.
4.13 Table 4 below confirms that the Council’s gross debt does not exceed the total of the CFR in the preceding year plus the estimates of any additional CFR for current year and the following two financial years. This allows some flexibility for limited early borrowing for future years, but ensures that borrowing is not undertaken for revenue purposes.
Table 4: Borrowing compared to the Capital Financing Requirement
2016/17 2017/18 2018/19 2019/20 2020/21 2021/22
Actual Forecast Estimate Estimate Estimate Estimate
£m £m £m £m £m £m
225 Gross Projected Debt 217 213 203 192 192
255 Capital Financing Requirement 276 320 334 336 341
30 Under / (over) borrowing 59 107 131 144 149
Affordability
4.14 The objective of the affordability indicators is to ensure that the level of investment in capital assets proposed remains within sustainable limits and, in particular, the impact on the Council’s “bottom line” as reflected in the impact on council tax and rent levels. Table 5 below sets out the expected ratio of capital financing costs to income for both General Fund and HRA activities:

Table 5: Ratio of capital financing costs to income
4.15 For 2017/18 and 2018/19, gross capital financing charges (loan interest, MRP and finance and PFI payments) for the General Fund capital programme are largely outweighed or balanced by income from investments and the commercial property portfolio.
4.16 The capital financing charges arising from the HRA capital programme increase in line with the forecast increased income, hence capital charges as a proportion of the HRA net revenue stream will remain fairly steady.
4.17 Table 6 below sets out the incremental impact of the capital programme (by itself) on the council tax requirement and housing rents.
Table 6: Impact of capital investment decisions on council tax requirement and housing rents
4.18 For the General Fund capital programme, the ratio of capital financing costs to income is relatively low as shown in Table 6 above, and there is a limited impact on council tax reflecting the relatively modest capital programme.
4.19 Similarly, there is limited impact on housing rents from the HRA capital programme as shown in Table 6.
Minimum Revenue Provision (MRP) Policy
4.20 Capital expenditure is generally defined as expenditure on assets that have a life expectancy of more than one year. The accounting approach is to spread the cost over the estimated useful life of the asset. The mechanism for spreading these costs is through an annual MRP. The MRP is the means by which capital expenditure, which is financed by borrowing or credit arrangements, is funded by Council Tax.
4.21 Regulation 28 of the Local Authorities (Capital Finance and Accounting) (England) Regulations 2003, as amended (Statutory Instrument (SI) 3146/2003) requires full Council to approve a Minimum Revenue Provision (MRP) Statement setting out the policy for making MRP and the amount of MRP to be calculated which the Council considers to be prudent. In setting a level which the Council considers to be prudent, the Guidance states that the
2016/17 2017/18 2018/19 2019/20 2020/21 2021/22
Actual Forecast Estimate Estimate Estimate Estimate
% % % % % %
0.56 0.10 0.14 0.45 0.41 0.50
31.25 30.93 29.25 27.05 26.17 25.65
General Fund
HRA
2016/17 2017/18 2018/19 2019/20 2020/21 2021/22
Actual Forecast Estimate Estimate Estimate Estimate
£ £ £ £ £ £
(13.63) 8.43 12.33 0.00 5.87 5.73
(1.19) (0.01) 0.00 0.00 0.00 0.00Increase / (Decrease) in housing rent per week
Increase / (Decrease) in Council Tax(band D) per annum

broad aim is to ensure that debt is repaid over a period reasonably commensurate with that over which the capital expenditure provides benefits to the Council.
4.22 The Council’s proposed MRP policy for 2018/19 is reported at Appendix 4 of the Four Year Capital Programme 2018/19 – 2021/22.
Borrowing in advance of need
4.23 The Council has the power to borrow in advance of need in line with its future borrowing requirements under the Local Authorities (Capital Finance and Accounting) (England) Regulations 2003, as amended. Any decision to borrow in advance will be within forward approved Capital Financing Requirement estimates, and will be considered carefully to ensure that value for money can be demonstrated, and that the Council can ensure the security of such funds. Currently, there are no plans to incur any additional external borrowing in the medium term.
4.24 Risks associated with any borrowing in advance of activity will be subject to prior appraisal and subsequent reporting through the mid-year or annual reporting mechanism.
Debt rescheduling
4.25 As short term borrowing rates will be considerably cheaper than longer term fixed interest rates, there may be opportunities to generate savings by switching from long term debt to short term debt. However, these savings will need to be considered in the light of the current treasury position and the cost of debt repayment (premiums incurred).
4.26 The reasons for any rescheduling to take place will include:
generating cash savings and / or discounted cash flow savings;
helping to fulfil the treasury strategy; and
enhancing the balance of the portfolio by amending the maturity profile and/or the balance of volatility.
4.27 Consideration will also be given to identifying the potential for making savings by running down investment balances to repay debt prematurely as short term rates on investments are likely to be lower than rates paid on current debt.
4.28 Any rescheduling will be reported to the Stragetic Finance Director and the lead cabinet Member.
CAPITAL
Capital spending plans
5.1 The Prudential Code requires that any borrowing and investment decisions are taken in the light of capital spending plans and consideration of how that
proposed capital expenditure will be purchased. The Council’s capital expenditure plans have been reported in the Four-Year Capital Programme 2018/19-2021/22 reported elsewhere on the Committee’s agenda, both in terms of those agreed previously, and those forming part of the current budget cycle. This section will be updated as the capital programme plans are firmed up during the budget cycle.
5.2 Any slippage against the capital programme will impact on the figures reported throughout this report.
Housing revenue account
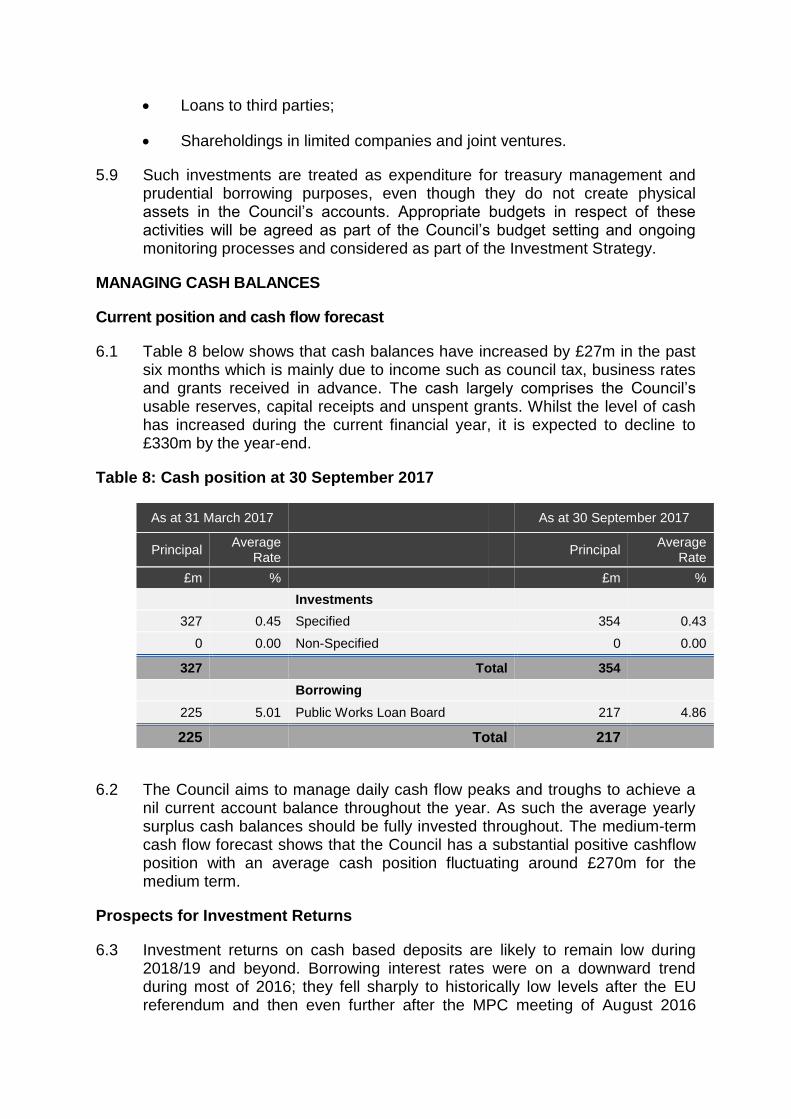
5.3 Borrowing for the HRA has to remain within the HRA Debt Limit (prescribed in the HRA Self Financing Determinations 2012) as detailed in the table below. Borrowing for the HRA is measured by the HRA CFR.
Table 7: HRA borrowing
5.4 For the period 2017/18 to 2020/21, based on the planned four-year capital programme and other sources of capital resources, borrowing will be funded principally from internal resources.
5.5 The availability of internal borrowing is achieved through the use of monies received classed as capital receipts. Use of this money is classed as borrowing as, although cash is received from developers on a phased basis, receipts are only deemed usable for funding purposes as assets transfer to the purchaser. This does not prevent the Council from spending the cash it receives but, until such time that assets transfer, any such use is classed as borrowing. This borrowing unwinds when the receipt becomes usable.
5.6 The total available to the HRA for the purposes of internal borrowing (headroom) is the difference between the HRA CFR and the debt limit each year. This is shown in Table 7 above.
5.7 Full details of the Housing Revenue Account’s likely borrowing requirements is set out in the Financial Plan for Council Homes approved by Cabinet on the 6th February 2017.
Other investment opportunities
5.8 As well as investing in assets owned by the Council and used in the delivery of services, the Council also invests, or may invest, where appropriate, in:
Infrastructure projects, such as green energy;
2016/17 2017/18 2018/19 2019/20 2020/21 2021/22
Actual Forecast Estimate Estimate Estimate Estimate
£ £ £ £ £ £
334 HRA Debt Limit 334 334 334 334 334
211 HRA CFR 211 233 249 250 253
123 Headroom 123 101 85 84 81
Loans to third parties;
Shareholdings in limited companies and joint ventures.
5.9 Such investments are treated as expenditure for treasury management and prudential borrowing purposes, even though they do not create physical assets in the Council’s accounts. Appropriate budgets in respect of these activities will be agreed as part of the Council’s budget setting and ongoing monitoring processes and considered as part of the Investment Strategy.
MANAGING CASH BALANCES
Current position and cash flow forecast
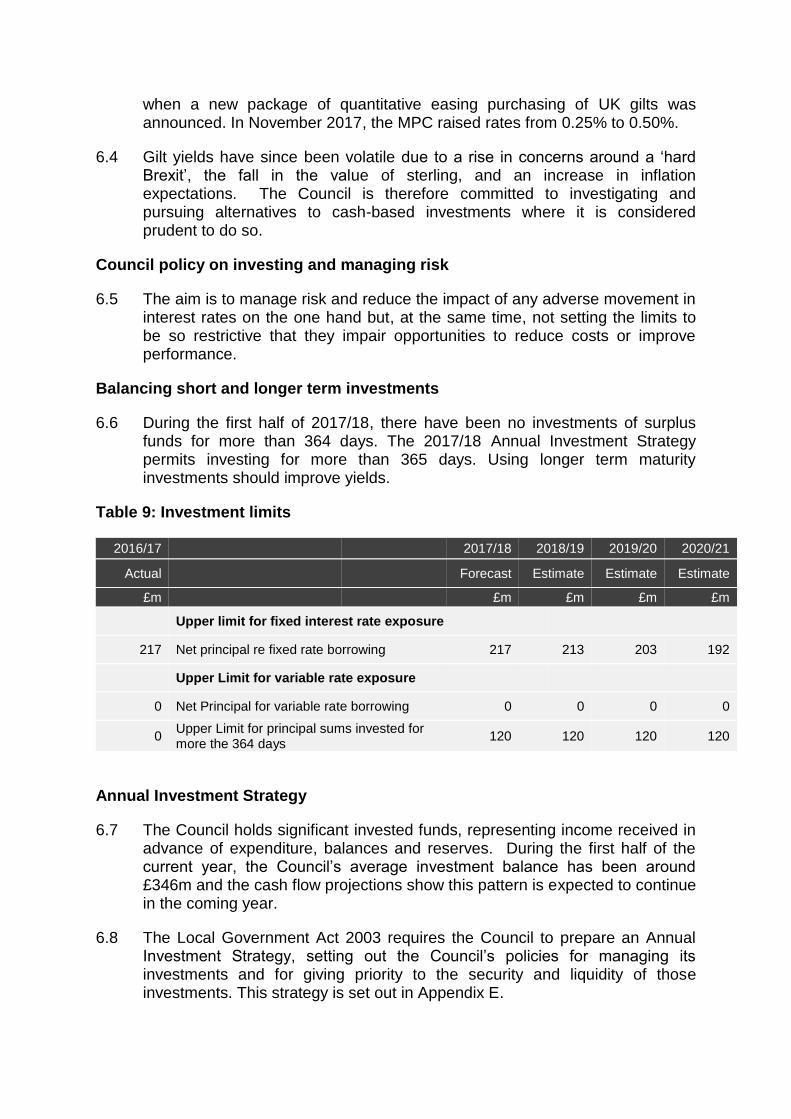
6.1 Table 8 below shows that cash balances have increased by £27m in the past six months which is mainly due to income such as council tax, business rates and grants received in advance. The cash largely comprises the Council’s usable reserves, capital receipts and unspent grants. Whilst the level of cash has increased during the current financial year, it is expected to decline to £330m by the year-end.
Table 8: Cash position at 30 September 2017
As at 31 March 2017 As at 30 September 2017
Principal Average
Rate Principal
Average Rate
£m % £m %
Investments
327 0.45 Specified 354 0.43
0 0.00 Non-Specified 0 0.00
327
Total 354
Borrowing
225 5.01 Public Works Loan Board 217 4.86
225 Total 217
6.2 The Council aims to manage daily cash flow peaks and troughs to achieve a nil current account balance throughout the year. As such the average yearly surplus cash balances should be fully invested throughout. The medium-term cash flow forecast shows that the Council has a substantial positive cashflow position with an average cash position fluctuating around £270m for the medium term.
Prospects for Investment Returns
6.3 Investment returns on cash based deposits are likely to remain low during 2018/19 and beyond. Borrowing interest rates were on a downward trend during most of 2016; they fell sharply to historically low levels after the EU referendum and then even further after the MPC meeting of August 2016
when a new package of quantitative easing purchasing of UK gilts was announced. In November 2017, the MPC raised rates from 0.25% to 0.50%.
6.4 Gilt yields have since been volatile due to a rise in concerns around a ‘hard Brexit’, the fall in the value of sterling, and an increase in inflation expectations. The Council is therefore committed to investigating and pursuing alternatives to cash-based investments where it is considered prudent to do so.
Council policy on investing and managing risk
6.5 The aim is to manage risk and reduce the impact of any adverse movement in interest rates on the one hand but, at the same time, not setting the limits to be so restrictive that they impair opportunities to reduce costs or improve performance.
Balancing short and longer term investments
6.6 During the first half of 2017/18, there have been no investments of surplus funds for more than 364 days. The 2017/18 Annual Investment Strategy permits investing for more than 365 days. Using longer term maturity investments should improve yields.
Table 9: Investment limits
2016/17 2017/18 2018/19 2019/20 2020/21
Actual Forecast Estimate Estimate Estimate
£m £m £m £m £m
Upper limit for fixed interest rate exposure
217 Net principal re fixed rate borrowing 217 213 203 192
Upper Limit for variable rate exposure
0 Net Principal for variable rate borrowing 0 0 0 0
0 Upper Limit for principal sums invested for more the 364 days
120 120 120 120
Annual Investment Strategy
6.7 The Council holds significant invested funds, representing income received in advance of expenditure, balances and reserves. During the first half of the current year, the Council’s average investment balance has been around £346m and the cash flow projections show this pattern is expected to continue in the coming year.
6.8 The Local Government Act 2003 requires the Council to prepare an Annual Investment Strategy, setting out the Council’s policies for managing its investments and for giving priority to the security and liquidity of those investments. This strategy is set out in Appendix E.

6.9 Investments are made with reference to the core balance, future cash flow requirements and the outlook for interest rates. The Council’s investment priorities will always be security first, liquidity second, then return.
SUMMARY OF PRUDENTIAL INDICATORS (PIs)
7.1 The purpose of prudential indicators (PIs) is to provide a reference point or “dashboard” so that senior officers and Members can:
easily identify whether approved treasury management policies are being applied correctly in practice; and
take corrective action as required.
7.2 As the Council’s S151 officer, the Strategic Finance Director has a responsibility to ensure that appropriate PIs are set and monitored and that any breaches are reported to Members.
7.3 The Strategic Finance Director has confirmed that the PIs set out below are all expected to be complied with in 2017/18 and he does not envisage at this stage that there will be any difficulty in achieving compliance with the suggested indicators for 2018/19.
PI ref
Para ref 2016/17 actual 2017/18 forecast
2018/19 proposed
1 5.1 Capital expenditure £71m £100m £113m
2 4.9 Capital Financing Requirement (CFR)
£273m £276m £322m
3 4.13 Net debt vs CFR £30m underborrowing
£59m underborrowing
£109m underborrowing
4 4.14 Ratio of financing costs to revenue stream
GF 0.56% HRA 31.25%
GF 0.10% HRA 30.93%
GF 0.14% HRA 29.25%
5 4.17 Incremental impact of new capital investment decisions on council tax
£13.63 decrease in Band D council tax charge per annum
£8.43 increase in Band D council tax charge per annum
£12.33 increase in Band D council tax charge per annum
6 4.17 Impact of new capital investment decisions on housing rents
£1.19 decrease in average rent per week
£0.01 decrease in average rent per week
£0.00 increase in average rent per week
7a 4.5 Authorised limit for external debt
£345m £345m £345m
7b 4.5 Operational debt boundary
£290m £290m £290m
7c 5.3 HRA debt limit £255m £255m £255m
8 6.2 Working capital balance
£0m £0m £0m
9 6.6 Limit on surplus funds invested for more than
£120m £120m £120m

364 days (i.e. non-specified investments)
10 4.6 Maturity structure of borrowing
Upper limit under 12 months - 15% Lower limit 10 years and above - 100%
Upper limit under 12 months - 15% Lower limit 10 years and above - 100%
Upper limit under 12 months - 15% Lower limit 10 years and above - 100%
7.4 CIPFA is currently updating the Prudential Code and Treasury Management Code to take effect for 2018/19. This TMSS has been prepared based on the current versions of these Codes and will be updated when the revised Codes are published.
FINANCIAL IMPLICATIONS
8.1 The comments of the Strategic Finance Director and the Head of Corporate Accountancy and Capital are contained within this report.
8.2 This report is wholly of a financial nature.
8.3 Implications completed by Phil Trigg,s Tri-Borough Director of Treasury and Pensions , 020 7641 4136
LEGAL IMPLICATIONS
9.1 The legal implications are contained within the body of the report.
9.2 Implications completed by Joyce Golder, Principal Solicitor, 020 7361 2181
10. EQUALITY IMPLICATIONS
10.1 There will be no negative implications for protected groups arising from the Treasury Management Strategy.
10.2 Implications completed by Peter Smith, Head of Policy & Strategy, tel. 020 8753 2206.
11. IT IMPLICATIONS
11.1 There are no IT technical implications for the council.
11.2 Implications verified by: Veronica Barella, interim Chief Information officer, Tel 020 8753 2927
IMPLICATIONS FOR BUSINESS
12. There are no business implications for the council.
12.1 Implications for Business completed by: David Burns, Interim Head of Economic Developmeny (Regeneration, Planning and Housing Services)
Appendices
Appendix A: Treasury Management Policy Statement Appendix B: Meeting CIPFA requirements Appendix C: Interest Rate Prospects Appendix D: Economic Update Appendix E: Annual Investment Strategy Appendix F: Credit Ratings Appendix G: Approved countries investment list
LIST OF BACKGROUND PAPERS USED IN PREPARING THIS REPORT
Treasury Management Strategy Statement 2017/18 (approved by Council February 2017)
Local Authorities (Capital Finance and Accounting) (England) Regulations 2003, as amended
DCLG guidance on minimum revenue provision 2003 DCLG guidance on local government investments March 2010 CIPFA Prudential Code for capital finance in local authorities 2011 CIPFA Treasury Management Code of Practice 2011 If you have any queries about this report of wish to inspect any of the background papers please contact: Phil Triggs, Tri-Borough Director of Treasury and Pensions Tel 020 7641 4136 E-mail [email protected],uk
APPENDIX A THE TREASURY MANAGEMENT POLICY STATEMENT The CIPFA recommendations contained in the Code of Practice and Cross Sectoral Guidance Notes issued as a revised version in 2009 and 2011 for Treasury Management in the Public Services require that each Local Authority has a Treasury Management Policy Statement that is approved by the Full Council. CIPFA recommends that the Council’s treasury management policy statement adopts the following form of words below to define the policies and objectives of its treasury management activities. This Council defines its Treasury Management activities as:
The management of the Council’s investments and cash flows, its banking, money market and capital market transactions; the effective control of the risks associated with those activities; and the pursuit of optimum performance consistent with those risks.
This Council regards the successful identification, monitoring and control of risk to be the prime criteria by which the effectiveness of its treasury management activities will be measured. Accordingly, the analysis and reporting of Treasury Management activities will focus on their risk implications for the organisation, and any financial instruments entered into to manage these risks.
This Council acknowledges that effective Treasury Management will provide support towards the achievement of its business and service objectives. It is therefore committed to the principles of achieving value for money in treasury management, and to employing suitable comprehensive performance.
APPENDIX B MEETING CIPFA REQUIREMENTS
The Council has formally adopted CIPFA’s Code of Practice on Treasury Management (updated November 2011) and complies with the requirements of the Code as detailed below:
Maintaining a Treasury Management Policy Statement setting out the policies and objectives of the Council’s treasury management activities
Maintaining a statement of Treasury Management Practices that sets out the manner in which the Council will seek to achieve these policies and objectives
Presenting the Full Council with an annual Treasury Management Strategy Statement, including an annual investment strategy and Minimum Revenue Provision policy for the year ahead (this report), a half year review report and an annual report (stewardship report) covering compliance during the previous year
A statement of delegation for treasury management functions and for the execution and administration of treasury management decisions (see below).
Delegation of the role of scrutiny of treasury management activities and reports to a specific named body. At the London Borough of Hammersmith and Fulham, this role is undertaken by the Audit, Pensions and Standards Committee.
Treasury Management Delegations and Responsibilities
The respective roles of the Council, Cabinet, Audit, Pensions and Standards Committee, and of the Section 151 officer and the Director of Treasury and Pensions are summarised below. Further details are set out in the Statement of Treasury Management Practices. Council Council will approve the annual treasury management strategy statement, including borrowing and investment strategies. In doing so, Council will establish and communicate its appetite for risk within treasury management having regard to the Prudential Code. Cabinet Cabinet will recommend to Council the annual treasury strategy, including borrowing and investment strategies and receive a half-year report and annual outturn report on treasury activities. Cabinet also approves revenue budgets, including those for treasury activities. Audit, Pensions and Standards Committee This committee is responsible for ensuring effective scrutiny of treasury strategy and policies.
Section 151 Officer The role of the Section 151 officer is delegated to the Strategic Director of Finance (the S151 Officer), pursuant to Section 101 of the Local Government Act 1972 and by the Executive under Section 15 of the Local Government Act 2000.
The S151 Officer may authorise officers to exercise on their behalf functions delegated to them. Any decisions taken under this authority shall remain the responsibility of the S151 Officer and must be taken within the guidelines of the Treasury Management Strategy.
The S151 Officer has full delegated powers from the Council and is responsible for the following activities:
Investment management arrangements and strategy;
Borrowing and debt strategy;
Monitoring investment activity and performance;
Overseeing administrative activities;
Ensuring compliance with relevant laws and regulations;
Provision of guidance to officers and members in exercising delegated powers.
Director of Treasury and Pension Fund Has responsibility for the execution and administration of treasury management decisions, acting in accordance with the Council’s Treasury Policy Statement and CIPFA’s ‘Standard of Professional Practice on Treasury Management’. Treasury Team Undertakes day-to-day treasury investment and borrowing activity in accordance with strategy, policy, practices and procedures. Training The CIPFA code requires the S151 officer to ensure that Members with responsibility for making treasury management decisions and for scrutinising treasury functions to receive adequate training. The training needs of all officers are reviewed periodically as part of the Learning and Development programme. Officers attend various seminars, training sessions and conferences during the year and appropriate Member training is offered as and when needs and suitable opportunities are identified.
Monitoring and Reporting
The Treasury Management activities during the year will be included in the monitoring reports to the Audit, Pensions and Standards Committee.
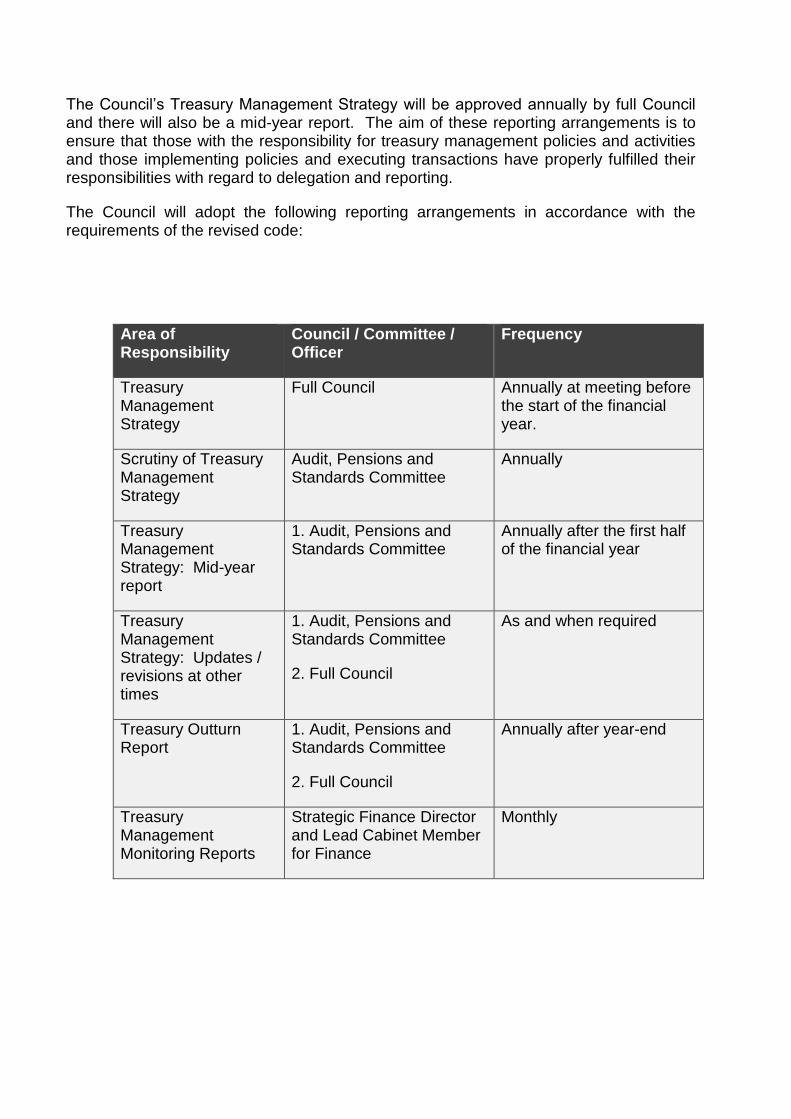
The Council’s Treasury Management Strategy will be approved annually by full Council and there will also be a mid-year report. The aim of these reporting arrangements is to ensure that those with the responsibility for treasury management policies and activities and those implementing policies and executing transactions have properly fulfilled their responsibilities with regard to delegation and reporting.
The Council will adopt the following reporting arrangements in accordance with the requirements of the revised code:
Area of Responsibility
Council / Committee / Officer
Frequency
Treasury Management Strategy
Full Council Annually at meeting before the start of the financial year.
Scrutiny of Treasury Management Strategy
Audit, Pensions and Standards Committee
Annually
Treasury Management Strategy: Mid-year report
1. Audit, Pensions and Standards Committee
Annually after the first half of the financial year
Treasury Management Strategy: Updates / revisions at other times
1. Audit, Pensions and Standards Committee
2. Full Council
As and when required
Treasury Outturn Report
1. Audit, Pensions and Standards Committee
2. Full Council
Annually after year-end
Treasury Management Monitoring Reports
Strategic Finance Director and Lead Cabinet Member for Finance
Monthly

APPENDIX C PROSPECTS FOR INTEREST RATES
1. The Council has appointed Link Asset Services as its treasury advisor and part of their service is to assist the Council to formulate a view on interest rates. The following table gives our central view.
2. Link Asset Services undertook its last review of interest rate forecasts on 9 August 2017 after the quarterly Bank of England Inflation Report. There was no change in MPC policy at that meeting. However, the MPC meeting of 14 September 2017 revealed a sharp change in sentiment whereby a majority of MPC members said they would be voting for an increase in Bank Rate “over the coming months”.
3. The November 2017 MPC meeting increased the Base Rate from 0.25% to 0.50%. Link Asset services have suggested that interest rates may increase by a further 0.25% in the last quarter of 2018.
4. The graph below shows the current UK Gilt curve, together with the one-year forward Gilt curve (i.e. current market expectations for the Gilt rates in twelve months’ time).
Source: Bloomberg 20 October 2017
0
0.5
1
1.5
2
2.5
1 Yr 5 Yr 10 Yr 15 Yr 20 Yr 25 Yr 30 Yr 35 Yr 40 Yr 45 Yr 50 Yr
Yie
ld (
%)
Year
Current and 1 year forward Gilt Yield Curve
Spot 1 Year Forward

5. Against this background and the risks within the economic forecast, caution will be adopted with the 2018/19 treasury operations. The Treasury Management team will continue to monitor interest rates in financial markets and adopt a pragmatic approach to changing circumstances (within their approved remit).
6. If it were considered that there was a significant risk of a sharp fall in long and short term rates (e.g. due to a marked increase of risks around relapse into recession or of risks of deflation), long term borrowings will be postponed, and potential rescheduling from fixed rate funding into short term borrowing will be considered.
7. Because the council existing borrowing is on fixed interest terms the Council is protected from future interest rate raises. However, any new borrowing would reflect current market rates which may fluctuate.
APPENDIX D
ECONOMIC UPDATE
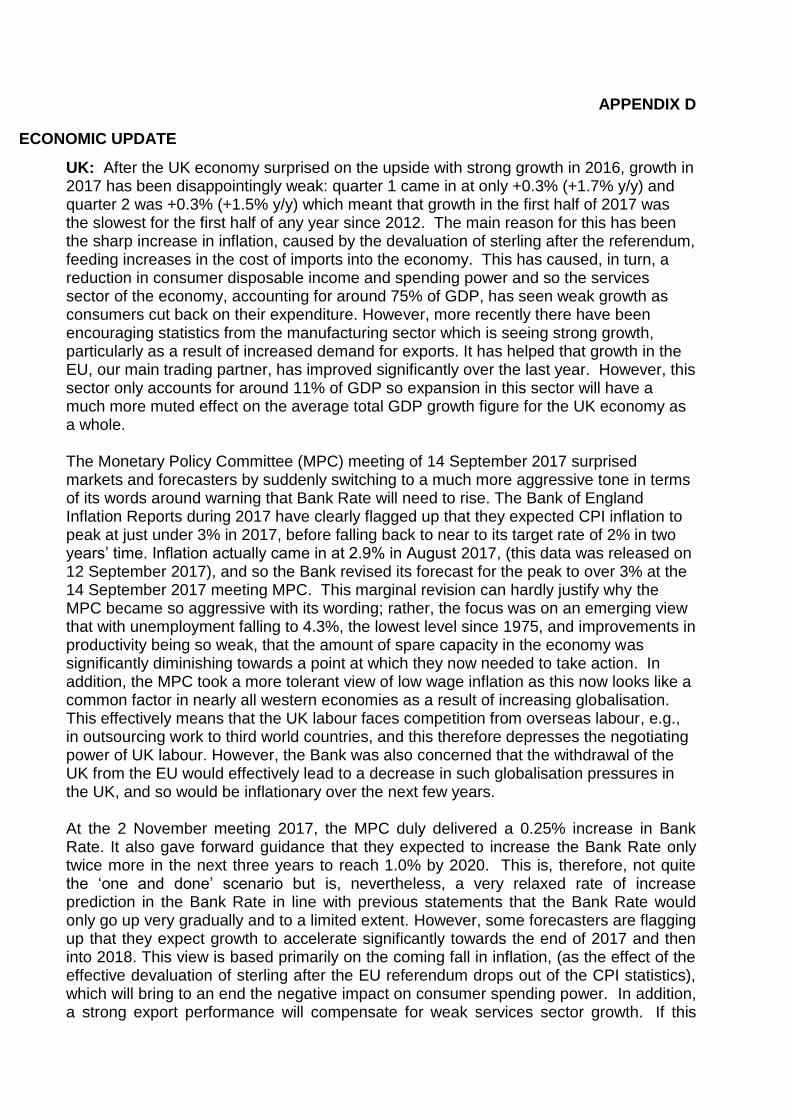
UK: After the UK economy surprised on the upside with strong growth in 2016, growth in 2017 has been disappointingly weak: quarter 1 came in at only +0.3% (+1.7% y/y) and quarter 2 was +0.3% (+1.5% y/y) which meant that growth in the first half of 2017 was the slowest for the first half of any year since 2012. The main reason for this has been the sharp increase in inflation, caused by the devaluation of sterling after the referendum, feeding increases in the cost of imports into the economy. This has caused, in turn, a reduction in consumer disposable income and spending power and so the services sector of the economy, accounting for around 75% of GDP, has seen weak growth as consumers cut back on their expenditure. However, more recently there have been encouraging statistics from the manufacturing sector which is seeing strong growth, particularly as a result of increased demand for exports. It has helped that growth in the EU, our main trading partner, has improved significantly over the last year. However, this sector only accounts for around 11% of GDP so expansion in this sector will have a much more muted effect on the average total GDP growth figure for the UK economy as a whole. The Monetary Policy Committee (MPC) meeting of 14 September 2017 surprised markets and forecasters by suddenly switching to a much more aggressive tone in terms of its words around warning that Bank Rate will need to rise. The Bank of England Inflation Reports during 2017 have clearly flagged up that they expected CPI inflation to peak at just under 3% in 2017, before falling back to near to its target rate of 2% in two years’ time. Inflation actually came in at 2.9% in August 2017, (this data was released on 12 September 2017), and so the Bank revised its forecast for the peak to over 3% at the 14 September 2017 meeting MPC. This marginal revision can hardly justify why the MPC became so aggressive with its wording; rather, the focus was on an emerging view that with unemployment falling to 4.3%, the lowest level since 1975, and improvements in productivity being so weak, that the amount of spare capacity in the economy was significantly diminishing towards a point at which they now needed to take action. In addition, the MPC took a more tolerant view of low wage inflation as this now looks like a common factor in nearly all western economies as a result of increasing globalisation. This effectively means that the UK labour faces competition from overseas labour, e.g., in outsourcing work to third world countries, and this therefore depresses the negotiating power of UK labour. However, the Bank was also concerned that the withdrawal of the UK from the EU would effectively lead to a decrease in such globalisation pressures in the UK, and so would be inflationary over the next few years. At the 2 November meeting 2017, the MPC duly delivered a 0.25% increase in Bank Rate. It also gave forward guidance that they expected to increase the Bank Rate only twice more in the next three years to reach 1.0% by 2020. This is, therefore, not quite the ‘one and done’ scenario but is, nevertheless, a very relaxed rate of increase prediction in the Bank Rate in line with previous statements that the Bank Rate would only go up very gradually and to a limited extent. However, some forecasters are flagging up that they expect growth to accelerate significantly towards the end of 2017 and then into 2018. This view is based primarily on the coming fall in inflation, (as the effect of the effective devaluation of sterling after the EU referendum drops out of the CPI statistics), which will bring to an end the negative impact on consumer spending power. In addition, a strong export performance will compensate for weak services sector growth. If this
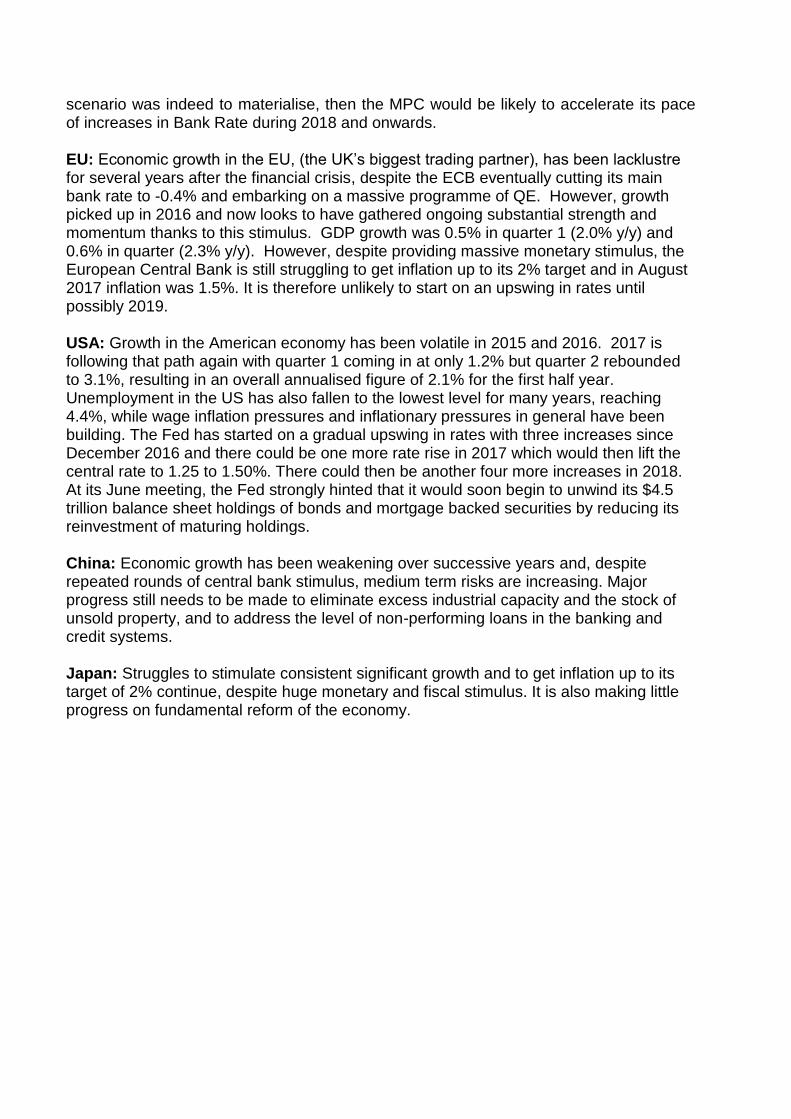
scenario was indeed to materialise, then the MPC would be likely to accelerate its pace of increases in Bank Rate during 2018 and onwards. EU: Economic growth in the EU, (the UK’s biggest trading partner), has been lacklustre for several years after the financial crisis, despite the ECB eventually cutting its main bank rate to -0.4% and embarking on a massive programme of QE. However, growth picked up in 2016 and now looks to have gathered ongoing substantial strength and momentum thanks to this stimulus. GDP growth was 0.5% in quarter 1 (2.0% y/y) and 0.6% in quarter (2.3% y/y). However, despite providing massive monetary stimulus, the European Central Bank is still struggling to get inflation up to its 2% target and in August 2017 inflation was 1.5%. It is therefore unlikely to start on an upswing in rates until possibly 2019. USA: Growth in the American economy has been volatile in 2015 and 2016. 2017 is following that path again with quarter 1 coming in at only 1.2% but quarter 2 rebounded to 3.1%, resulting in an overall annualised figure of 2.1% for the first half year. Unemployment in the US has also fallen to the lowest level for many years, reaching 4.4%, while wage inflation pressures and inflationary pressures in general have been building. The Fed has started on a gradual upswing in rates with three increases since December 2016 and there could be one more rate rise in 2017 which would then lift the central rate to 1.25 to 1.50%. There could then be another four more increases in 2018. At its June meeting, the Fed strongly hinted that it would soon begin to unwind its $4.5 trillion balance sheet holdings of bonds and mortgage backed securities by reducing its reinvestment of maturing holdings. China: Economic growth has been weakening over successive years and, despite repeated rounds of central bank stimulus, medium term risks are increasing. Major progress still needs to be made to eliminate excess industrial capacity and the stock of unsold property, and to address the level of non-performing loans in the banking and credit systems. Japan: Struggles to stimulate consistent significant growth and to get inflation up to its target of 2% continue, despite huge monetary and fiscal stimulus. It is also making little progress on fundamental reform of the economy.
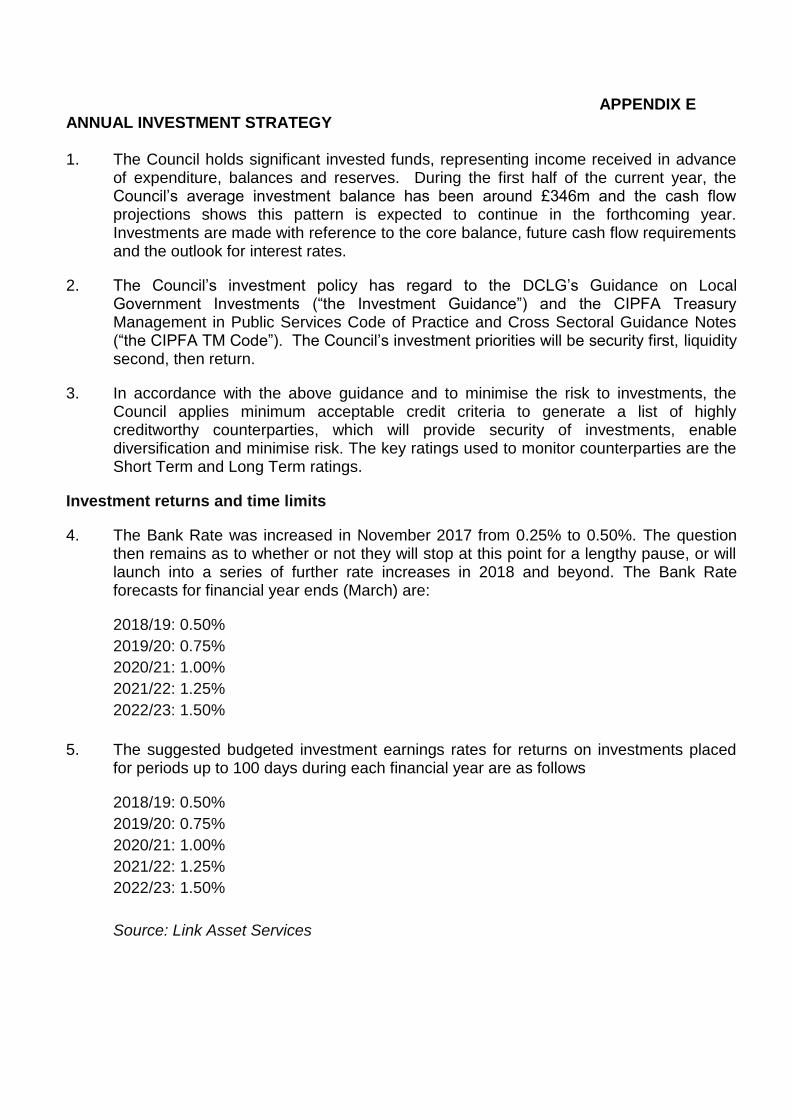
APPENDIX E ANNUAL INVESTMENT STRATEGY 1. The Council holds significant invested funds, representing income received in advance
of expenditure, balances and reserves. During the first half of the current year, the Council’s average investment balance has been around £346m and the cash flow projections shows this pattern is expected to continue in the forthcoming year. Investments are made with reference to the core balance, future cash flow requirements and the outlook for interest rates.
2. The Council’s investment policy has regard to the DCLG’s Guidance on Local Government Investments (“the Investment Guidance”) and the CIPFA Treasury Management in Public Services Code of Practice and Cross Sectoral Guidance Notes (“the CIPFA TM Code”). The Council’s investment priorities will be security first, liquidity second, then return.
3. In accordance with the above guidance and to minimise the risk to investments, the Council applies minimum acceptable credit criteria to generate a list of highly creditworthy counterparties, which will provide security of investments, enable diversification and minimise risk. The key ratings used to monitor counterparties are the Short Term and Long Term ratings.
Investment returns and time limits
4. The Bank Rate was increased in November 2017 from 0.25% to 0.50%. The question then remains as to whether or not they will stop at this point for a lengthy pause, or will launch into a series of further rate increases in 2018 and beyond. The Bank Rate forecasts for financial year ends (March) are:
2018/19: 0.50%
2019/20: 0.75%
2020/21: 1.00%
2021/22: 1.25%
2022/23: 1.50%
5. The suggested budgeted investment earnings rates for returns on investments placed
for periods up to 100 days during each financial year are as follows
2018/19: 0.50%
2019/20: 0.75%
2020/21: 1.00%
2021/22: 1.25%
2022/23: 1.50%
Source: Link Asset Services
Investment time limits
6. This limit is set with regard to the Council’s liquidity requirements and to reduce the need for early sale of an investment. For the year 2018/19, the proposed limit of investments for over 364 days is £120m as set out in table 11 of the TMSS.
Investment Policy
7. The Council’s officers recognise that ratings should not be the sole determinant of the quality of an institution and that it is important to assess continually and monitor the financial sector on both a micro and macro basis and in relation to the economic and political environments in which institutions operate. The assessment will also take account of information that reflects the opinion of the markets. To this end the Council will engage with its advisors to maintain a monitor on market pricing such as “credit default swaps” and overlay that information on top of the credit ratings.
8. Other information sources used will include the financial press, share price and other such information pertaining to the banking sector to establish the most robust scrutiny process on the suitability of potential investment counterparties.
Creditworthiness Policy
9. The primary principle governing the Council’s investment criteria is the security of its investments, although the yield or return on the investment is also a key consideration. After this main principle, the Council will ensure that:
It maintains a policy covering both the categories of investment types it will invest in, criteria for choosing investment counterparties with adequate security and monitoring their security; and
It has sufficient liquidity in its investments. For this purpose it will set out procedures for determining the maximum periods for which funds may prudently be committed. These procedures also apply to the Council’s prudential indicators covering the maximum principal sums invested.
10. The Strategic Finance Director will maintain a counterparty list in compliance with the following criteria and will revise the criteria and submit them to Council for approval as necessary. These criteria are separate to those which determine which types of investment instrument are either specified or non-specified as they provide an overall pool of counterparties considered high quality which the Council may use, rather than defining what types of investment instruments are to be used.
11. The Council takes into account the following relevant matters when proposing counterparties:
the financial position and jurisdiction of the institution;
the market pricing of credit default swaps1 for the institution;
1 Credit Default Swaps (CDS) are tradable instruments where the buyer receives a pay-out from the seller
if the party to whom the CDS refers (often a financial institution) has a “credit event” (e.g. default, bankruptcy, etc.). The price of the CDS gives an indication to the market’s view of likelihood: the higher the price the more likely the credit event.
any implicit or explicit Government support for the institution;
Standard & Poors, Moodys and Fitch short and long term credit ratings;
Sovereign ratings to select counterparties from only the most creditworthy countries; and
Core Tier 1 capital ratios 2.
12. Changes to the credit rating will be monitored and, in the event that a counterparty is downgraded and does not meet the minimum criteria specified in Appendix E, the following action will be taken immediately:
no new investments will be made;
existing investments will be recalled if there are no penalties; and
full consideration will be given to recall or sale existing investments which would be liable to penalty clause.
Specified and Non-specified investments
13. The DCLG Guidance on Local Government Investments made under section 15(1) of the Local Government Act 2003, places restrictions on Local authorities around the use of specified and non-specified investments. A specified investment is defined as an investment which satisfies all of the conditions below:
The investment and any associated cash flows are denominated in sterling;
The investment has a maximum maturity of one year;
The investment is not defined as capital expenditure; and
The investment is made with a body or in an investment scheme of high credit quality; or with the UK Government, a UK Local Authority or parish/community council.
14. Investments with UK local authorities are deemed to be high credit quality because of the strong regulatory financial framework within which local authorities are required to operate and which mitigates against the risk of default, summarised below:
The requirement to set a balanced budget annually under sections 31A and 42A of the Local Government Finance Act 1992;
The requirement to budget for a minimum level of reserves including risk under the Local Government Act 2003;
The requirement for the S151 officer to issue a statutory report in the event that the authority intends to not set an adequate level of reserves or intends to undertake a course of action which he considers to be unlawful;
The requirement for long-term borrowing to be solely for capital expenditure;
2 The Tier 1 capital ratio is the ratio of a bank's core equity capital to its total risk-weighted assets (RWA).
Risk-weighted assets are the total of all assets held by the bank weighted by credit risk according to a formula determined by the Regulator (usually the country's central bank). Most central banks follow the Basel Committee on Banking Supervision (BCBS) guidelines in setting formulae for asset risk weights. The Core Tier 1 ratios for the four UK banks that the Council uses are: Barclays: 10.2%, HSBC: 11.2%, Lloyds: 12.0% and RBS: 10.8%.

The cap on excessive borrowing through the operation of the limits in the Prudential Code;
All borrowing has to be secured on revenues of a local authority rather than assets.
15. A non-specified investment is any investment that does not meet all the conditions above. In addition to the long-term investments listed in the table at the end of Appendix E, the following non-specified investments that the Council may make include:
Green Energy Bonds: Investments in solar farms are a form of Green Energy Bonds that provide a secure enhanced yield. The investments are structured as unrated bonds and secured on the assets and contracts of solar and wind farms. Before proceeding with any such investment, internal and external due diligence will be undertaken in advance of investments covering the financial, planning and legal aspects.
Loans: The Council may consider advancing loans (as a form of investment) to organisations delivering services for the Council where this will lead to the enhancement of services to Council Stakeholders. The Council will undertake due diligence checks to confirm the borrower’s creditworthiness before any sums are advanced and will obtain appropriate levels of security or third party guarantees for loans advanced. The Council would expect a return commensurate with the type and duration of the loan. All loans would need to be in line with the Council’s Scheme of Delegation and Key Decision thresholds levels.
Shareholdings in limited companies and joint ventures: The Council may invest in three forms of company:
Small scale businesses aimed at promoting economic growth in the area. Individual investments are no more than £0.5m and the aim is for these to be self-financing over the medium term. Any such loans will be subject to due diligence and the Council's Scheme of Delegation and Key Decision thresholds levels..
Trading vehicles which the Council has set up to undertake particular functions. Currently the Council has interests in the following companies: Lyric Theatre Hammersmith Ltd, Hammersmith and Fulham Urban Studies Centre, Hammersmith and Fulham Bridge Partnership, HFS Developments LLP, HFS Developments 2 LLP, LBHF Ventures Ltd, LBHF Joint Ventures Ltd and LBHF Family Support Services Ltd. These are not held primarily as investments but to fulfil Council service objectives. Any new proposals will be subject to due diligence as part of the initial business case. As these are not to be held primarily as investment vehicles, then there is an expectation that they will break even.
Trading vehicles held for a commercial purpose where the Council is obliged to undertake transactions via a company vehicle. These will be wholly owned subsidiaries of the Council with the aim of diversifying the investment portfolio risk.
16. For any such investments, specific proposals will be considered by the Director of Treasury and Pensions, and the Strategic Finance Director in consultation with the lead Cabinet Member for Finance and approvals to be in accordance with the Council’s Constitution and governance processes, after taking into account:
cash flow requirements
investment period
expected return
the general outlook for short to medium term interest rates
creditworthiness of the proposed investment counterparty
other investment risks
due diligence review
17. The value of non-specified investments will not exceed their investment allocation.
18. All investments with local authorities will be subject to due diligence review of their accounts and financial health by the Director of Treasury and Pensions.
Country of Domicile
19. The current TMSS allows deposits / investments with financial entities domiciled in the following countries: Australia, Canada, Denmark, Finland, France, Germany, Hong Kong, Luxembourg, Netherlands, Norway, Singapore, Sweden, Switzerland, UK and USA. This list will kept under review and any proposed changes to the policy reported to the next meeting
Schedule of investments
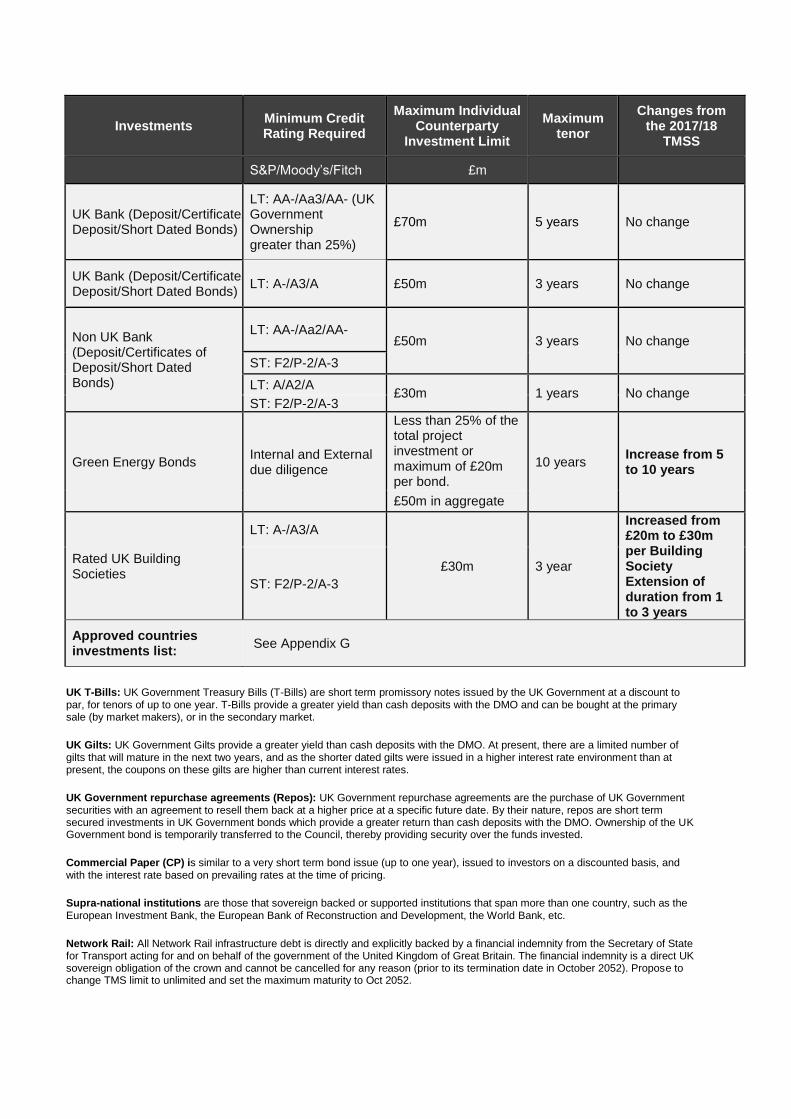
20. The current criteria for providing a pool of high quality short, medium and long-term, cash-based investment counterparties along with the time and monetary limits for institutions on the Council’s counterparty list are in the table below:
21. The counterparties and specific limits, have been reviewed and updated.
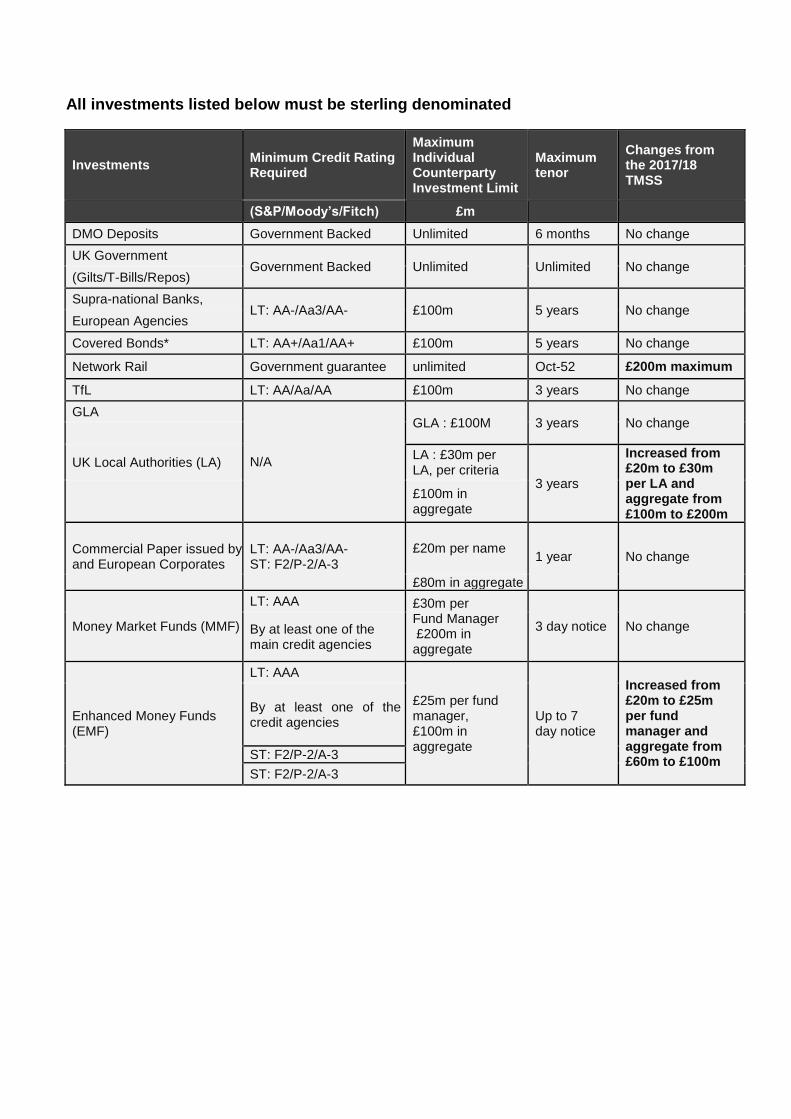
All investments listed below must be sterling denominated
Investments Minimum Credit Rating Required
Maximum Individual Counterparty Investment Limit
Maximum tenor
Changes from the 2017/18 TMSS
(S&P/Moody’s/Fitch) £m
DMO Deposits Government Backed Unlimited 6 months No change
UK Government Government Backed Unlimited Unlimited No change
(Gilts/T-Bills/Repos)
Supra-national Banks, LT: AA-/Aa3/AA- £100m 5 years No change
European Agencies
Covered Bonds* LT: AA+/Aa1/AA+ £100m 5 years No change
Network Rail Government guarantee unlimited Oct-52 £200m maximum
TfL LT: AA/Aa/AA £100m 3 years No change
GLA
N/A
GLA : £100M 3 years No change
UK Local Authorities (LA) LA : £30m per LA, per criteria
3 years
Increased from £20m to £30m per LA and aggregate from £100m to £200m
£100m in aggregate
Commercial Paper issued by UK and European Corporates
LT: AA-/Aa3/AA- ST: F2/P-2/A-3
£20m per name 1 year No change
£80m in aggregate
Money Market Funds (MMF)
LT: AAA £30m per Fund Manager £200m in aggregate
3 day notice No change By at least one of the main credit agencies
Enhanced Money Funds (EMF)
LT: AAA
£25m per fund manager, £100m in aggregate
Up to 7 day notice
Increased from £20m to £25m per fund manager and aggregate from £60m to £100m
By at least one of the main credit agencies
ST: F2/P-2/A-3
ST: F2/P-2/A-3
Investments Minimum Credit Rating Required
Maximum Individual Counterparty
Investment Limit
Maximum tenor
Changes from the 2017/18
TMSS
S&P/Moody’s/Fitch £m
UK Bank (Deposit/Certificates of Deposit/Short Dated Bonds)
LT: AA-/Aa3/AA- (UK Government Ownership greater than 25%)
£70m 5 years No change
UK Bank (Deposit/Certificates of Deposit/Short Dated Bonds)
LT: A-/A3/A £50m 3 years No change
Non UK Bank (Deposit/Certificates of Deposit/Short Dated Bonds)
LT: AA-/Aa2/AA- £50m 3 years No change
ST: F2/P-2/A-3
LT: A/A2/A £30m 1 years No change
ST: F2/P-2/A-3
Green Energy Bonds Internal and External due diligence
Less than 25% of the total project investment or maximum of £20m per bond.
10 years Increase from 5 to 10 years
£50m in aggregate
Rated UK Building Societies
LT: A-/A3/A
£30m 3 year
Increased from £20m to £30m per Building Society Extension of duration from 1 to 3 years
ST: F2/P-2/A-3
Approved countries investments list:
See Appendix G
UK T-Bills: UK Government Treasury Bills (T-Bills) are short term promissory notes issued by the UK Government at a discount to par, for tenors of up to one year. T-Bills provide a greater yield than cash deposits with the DMO and can be bought at the primary sale (by market makers), or in the secondary market.
UK Gilts: UK Government Gilts provide a greater yield than cash deposits with the DMO. At present, there are a limited number of gilts that will mature in the next two years, and as the shorter dated gilts were issued in a higher interest rate environment than at present, the coupons on these gilts are higher than current interest rates.
UK Government repurchase agreements (Repos): UK Government repurchase agreements are the purchase of UK Government securities with an agreement to resell them back at a higher price at a specific future date. By their nature, repos are short term secured investments in UK Government bonds which provide a greater return than cash deposits with the DMO. Ownership of the UK Government bond is temporarily transferred to the Council, thereby providing security over the funds invested.
Commercial Paper (CP) is similar to a very short term bond issue (up to one year), issued to investors on a discounted basis, and with the interest rate based on prevailing rates at the time of pricing.
Supra-national institutions are those that sovereign backed or supported institutions that span more than one country, such as the European Investment Bank, the European Bank of Reconstruction and Development, the World Bank, etc.
Network Rail: All Network Rail infrastructure debt is directly and explicitly backed by a financial indemnity from the Secretary of State for Transport acting for and on behalf of the government of the United Kingdom of Great Britain. The financial indemnity is a direct UK sovereign obligation of the crown and cannot be cancelled for any reason (prior to its termination date in October 2052). Propose to change TMS limit to unlimited and set the maximum maturity to Oct 2052.
APPENDIX F
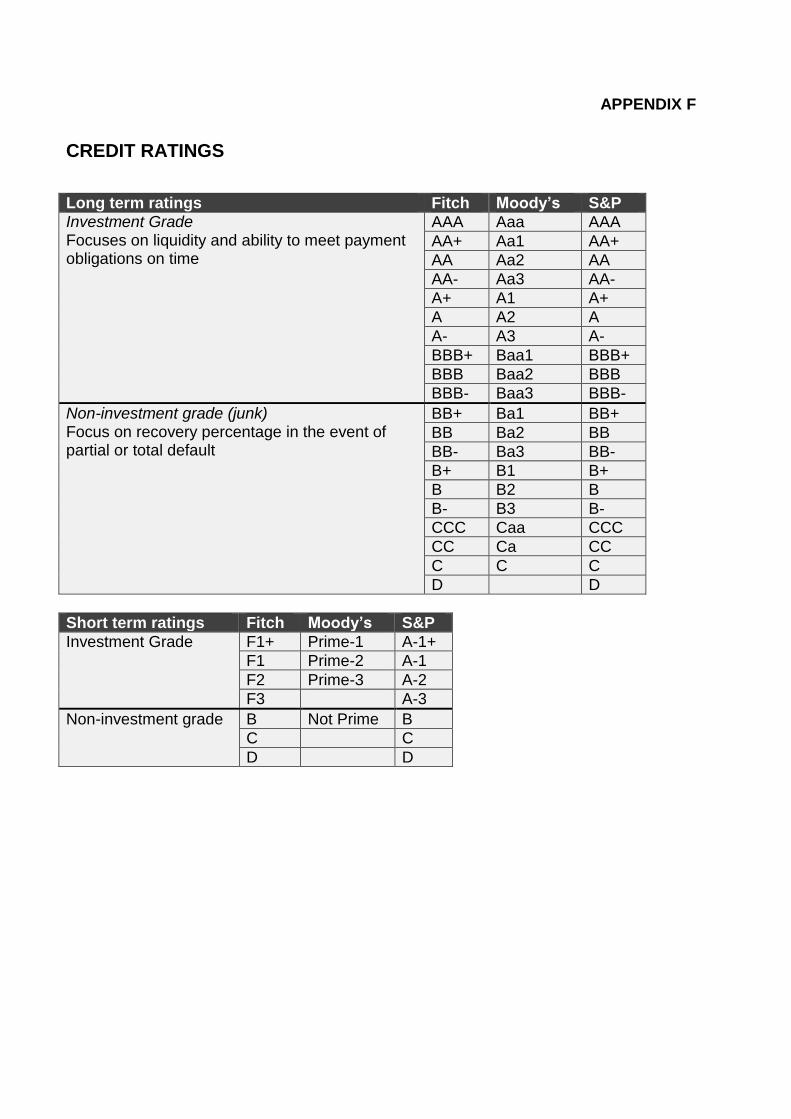
CREDIT RATINGS
Long term ratings Fitch Moody’s S&P
Investment Grade Focuses on liquidity and ability to meet payment obligations on time
AAA Aaa AAA
AA+ Aa1 AA+
AA Aa2 AA
AA- Aa3 AA-
A+ A1 A+
A A2 A
A- A3 A-
BBB+ Baa1 BBB+
BBB Baa2 BBB
BBB- Baa3 BBB-
Non-investment grade (junk) Focus on recovery percentage in the event of partial or total default
BB+ Ba1 BB+
BB Ba2 BB
BB- Ba3 BB-
B+ B1 B+
B B2 B
B- B3 B-
CCC Caa CCC
CC Ca CC
C C C
D D
Short term ratings Fitch Moody’s S&P
Investment Grade F1+ Prime-1 A-1+
F1 Prime-2 A-1
F2 Prime-3 A-2
F3 A-3
Non-investment grade B Not Prime B
C C
D D

APPENDIX G
APPROVED COUNTRIES FOR INVESTMENTS
The list of approved countries set out below is based on the credit ratings as at 1 December 2017. Countries included on the approved list are those whose lowest rating, from Moodys, Fitch and Standard & Poors, meet or exceed the UK’s credit rating of AA.
Country Lowest rating
Australia AAA
Canada AAA
Denmark AAA
Germany AAA
Finland AA+
France AA
Hong Kong AA+
Luxembourg AAA
Netherlands AAA
Norway AAA
Singapore AAA
Sweden AAA
Switzerland AAA
UK AA
USA AA+
The change from the 2017/18 list of approved countries is the inclusion of France.