Embed Size (px)
Citation preview
LombokPrefeasibility studies on RE
solutions
January 2019
Background
2
Indonesia and Denmark are cooperating through a Strategic Sector Cooperation which
facilitates government-to-government collaboration in areas where Denmark has
decades of experience which is valuable to rapidly emerging economies. The Strategic
Sector Cooperation programme is embedded in the Ministry of Foreign Affairs with
technical support from different ministries and agencies in Denmark.
The Danish partner of the Strategic Sector Cooperation programme is the Danish
Energy Agency and the main partners in Indonesia are the Ministry of Energy and
Mineral Resources (MEMR) and the National Energy Council, who are both
represented in the steering committee. At the same time, the Danish Energy Agency
also cooperates with the state-owned electricity company (PLN).
During 2016 and 2017, the Danish Energy Agency has cooperated with the Indonesian
counterparts in order to share Danish lessons learned from the transition into a
renewable energy system and identify where and how these lessons learned could be
useful in an Indonesian context.
Larger outputs from this cooperation are:
Capacity building through various seminars and workshops where Danish lessons
are learned.
Integration of Balmorel Power sector model in the modelling team at NEC, and
inputs to the ”Indonesian Energy Outlook”- 2016 and 2017.
Development of an Indonesian Technology Catalogue on power production
anchored at NEC.
RE-Integration study report. Transfer of Danish lessons learned on RE-integration
into an Indonesian context.
Cooperation with EBTKE and IEA, in order to define an energy efficiency baseline on
current policies – to be used in the Indonesian EE Masterplan.
Three study tours to Denmark on modelling, RE-Integration and EE. A total of 57
delegates and stakeholders visited Denmark in 2017.
As part of the Strategic Sector Cooperation programme, KPMG P/S (“KPMG” or “we”) has
been requested by the Embassy of Denmark to Indonesia to assist them with an analysis
of:
Prefeasibility study of four Generation Technologies in the island of Lombok – i.e. (i) a
Biomass power plant, (ii) a Solar PV power plant, (iii) a Wind power plant, and (iv) a
waste incineration power plant.
In addition, the prefeasibility study included:
An analysis of three technologies that can support integration of fluctuating energy
sources, such as wind and solar. These are (i) an interconnector to Bali from Lombok, (ii)
a hydro-pumped storage, and (iii) a large-scale battery.
An analysis of an off-grid PV/battery hybrid solution on the island of Medang.
The scope and execution of the work have been done in close cooperation with the
Embassy of Denmark to Indonesia and the Danish Energy Agency.
Input and feedback from local stakeholders at PLN NTB, DESDM NTB, and DLHK NTB have
been key for the quality of this study. The local departments have been cited throughout the
report.
The work was initiated on 10 September 2018 and it was finalised on 30 November 2018.
KPMG visited and arranged meetings in Lombok and Jakarta in the period from 16 to 25
September (Kick-off meetings) and between 28 October and 5 November 2018 (Stakeholder
consultation meetings). KPMG presented the findings listed in the Final draft on 13
December 2018 (Final presentation).
KPMG has together with the local partners been on site visits to Kebon Kongok landfill,
Pengga hydro power plant, PV plant at Gili Air and two rice hellers for the gathering of
information for the study.
KPMG has provided working drafts on 23 October, 19 November, 22 November, 25
November and 3 December 2018, and Final draft on 15 December. This report is the Final
version.
3
This report is prepared solely for the use of Embassy of Denmark to Indonesia, and
should not be used, quoted, referred to or relied upon, in whole or in part, without
KPMG’s prior written permission, by any third party or for any other purposes.
The primary sources of information used in preparing this report have been
information disclosed by the management at DESDM NTB, DLHK NTB and PLN
NTB. KPMG does not accept responsibility for such information which remains the
responsibility of the management of DESDM NTB, DLHK NTB and PLN NTB.
Details of our principal information sources are set out in the report, and we are
pleased that the information presented in our report is consistent with other
information which was made available to us in the course of our work. We have
not, however, widely sought to establish the reliability of the sources by reference
to other evidence.
The purpose of our study was to assess high level feasibility, not detailed
assessment of regulation, tax or capex. It is suggested that interested developers
will need to carry out detailed review in conjunction with professional advisors (e.g.
financial, legal and tax).
This engagement is not an assurance engagement conducted in accordance with
any generally accepted assurance standards, and consequently no assurance
opinion is expressed.
In the report, we assume that the sites located for commissioning the power plants
can be used for just that. The sites have been located using satellite photos and
comparing these with maps of land cover. It has not been examined if the land
actually can be acquired, or if there exist unknown restrictions on the use of the
land.
Important noticeOur report makes reference to ‘KPMG analysis’; this indicates only that we have (where
specified) undertaken certain analytical activities on the underlying data to arrive at the
information presented; we do not accept responsibility for the underlying data.
We have not considered events becoming known to us or occurring after the date of
publication of this report (11 December 2018). Therefore, events which may significantly
impact the findings after the date of the publication of this report are not considered.
We accept no responsibility or liability for the findings or reports of legal and other
professional advisers even though we have referred to their findings and/or reports in our
report.
Any findings or recommendations contained within the report are based upon our reasonable
professional judgment based on the information that is available from the sources indicated
in this report. Should the project elements, external factors and assumptions change, then
the findings and recommendations contained in this report may no longer be appropriate.
Accordingly, we do not confirm, underwrite or guarantee that the outcomes referred to in the
report will be achieved.
We do not assume responsibility for loss and expressly disclaim any liability to any party
whatsoever. We do not make any statement as to whether any forecasts or projections will
be achieved, or whether the assumptions and data underlying any such prospective financial
information are accurate, complete or reasonable.
We do not warrant or guarantee the achievement of any such forecasts or projections. There
will usually be differences between forecast or projected and actual results, because events
and circumstances frequently do not occur as expected or predicted, and those differences
may be material.
Approach
4
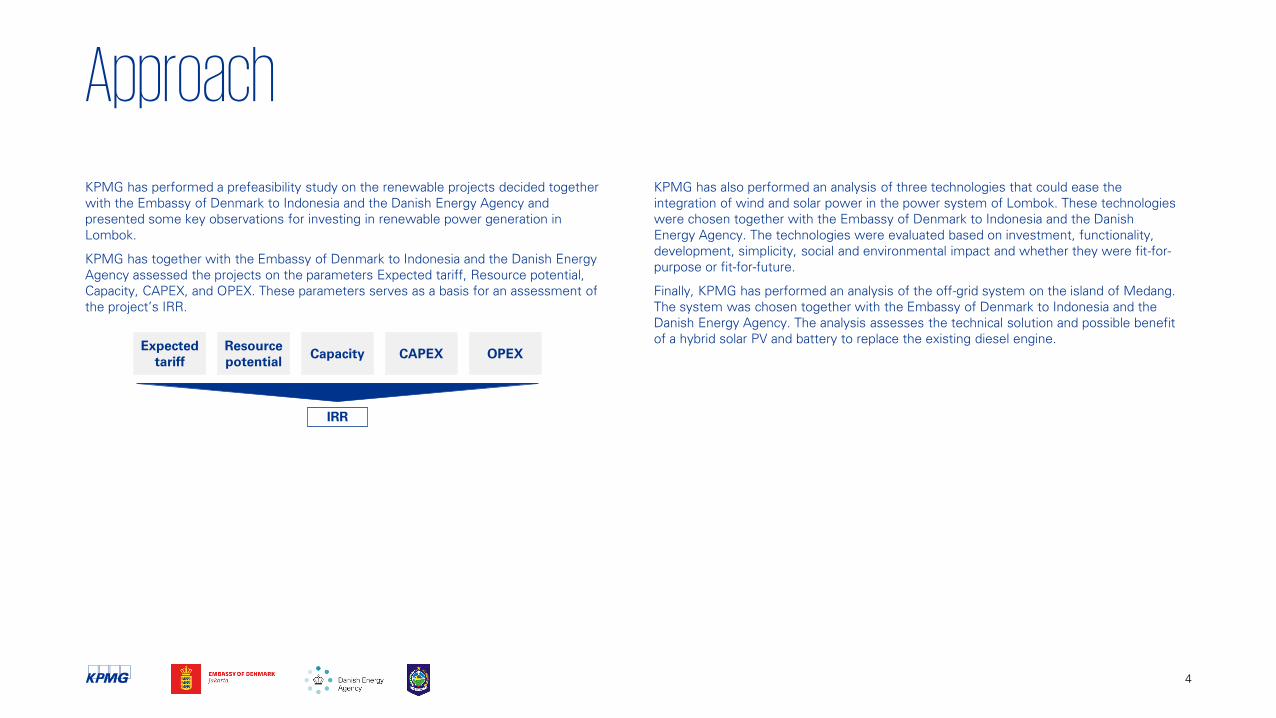
KPMG has performed a prefeasibility study on the renewable projects decided together
with the Embassy of Denmark to Indonesia and the Danish Energy Agency and
presented some key observations for investing in renewable power generation in
Lombok.
KPMG has together with the Embassy of Denmark to Indonesia and the Danish Energy
Agency assessed the projects on the parameters Expected tariff, Resource potential,
Capacity, CAPEX, and OPEX. These parameters serves as a basis for an assessment of
the project’s IRR.
Resource
potentialCAPEXCapacity OPEX
Expected
tariff
KPMG has also performed an analysis of three technologies that could ease the
integration of wind and solar power in the power system of Lombok. These technologies
were chosen together with the Embassy of Denmark to Indonesia and the Danish
Energy Agency. The technologies were evaluated based on investment, functionality,
development, simplicity, social and environmental impact and whether they were fit-for-
purpose or fit-for-future.
Finally, KPMG has performed an analysis of the off-grid system on the island of Medang.
The system was chosen together with the Embassy of Denmark to Indonesia and the
Danish Energy Agency. The analysis assesses the technical solution and possible benefit
of a hybrid solar PV and battery to replace the existing diesel engine.
IRR
Glossary
5
AC Alternating Current
ADB Asian Development Bank
BPPT Agency for the Assessment and Application of Technology
(Badan Pengkajian dan Penerapan Teknologi)
BPS Statistics Indonesia
(Badan Pusat Statistik)
BOOT Build-Own-Operate-Transfer
CAPEX Capital Expenses
CNG Compressed Natural Gas
COD Commercial Operations Date
DC Direct Current
DESDM NTB Local office on Energy & Mineral Resources at NTB
(Dinas Energi Sumber Daya dan Mineral)
DLHK NTB Local office on Environment and Forestry at NTB
(Dinas Lingkungan Hidup dan Kehutanan)
EPC Engineering, Procurement and Construction
FiT Feed-in-tariff
GJ Gigajoule
HVAC High-Voltage Alternating Current
HVDC High-Voltage Direct Current
IDR Indonesian Rupiah
IEA International Energy Agency
IPP Independent Power Producer
IRR Internal Rate of Return
JISDOR Jakarta Interbank Spot Dollar Rate
KBLI Indonesia Standard Industrial Classification
(Klasifikasi Baku Lapangan Usaha Indonesia)
kW Kilowatt
kWh Kilowatt-hour
MEMR Ministry of Energy & Mineral Resources
MW Megawatt
MWh Megawatt-hour
NEC National Energy Council of Indonesia
NPV World Wildlife Fund
NTB Nusa Tenggara Barat
NTT Nusa Tenggara Timur
OPEX Operational Expenses
PLN The state-owned electricity company
(PT Perusahaan Listrik Negara)
PLN NTB PLN at Nusa Tenggara Barat
PPA Power Purchase Agreement
PUPR Office of Public Work
(Kementerian Pekerjaan Umum dan Perumahan Rakyat)
PV Photovoltaics
RUPTL PLN's Electricity Supply Business Plan
(Rencana Usaha Penyediaan Tenaga Listrik)
SNI Indonesian National Standard
(Standar Nasional Indonesia)
US¢ US Cent
USD US Dollar
WACC Weighted Average Cost of Capital
WWF World Wildlife Fund
Each Generation Technology is assessed by an estimate of the project IRR based on five parameters and evaluated by a project risk assessment
6
Resource
potential
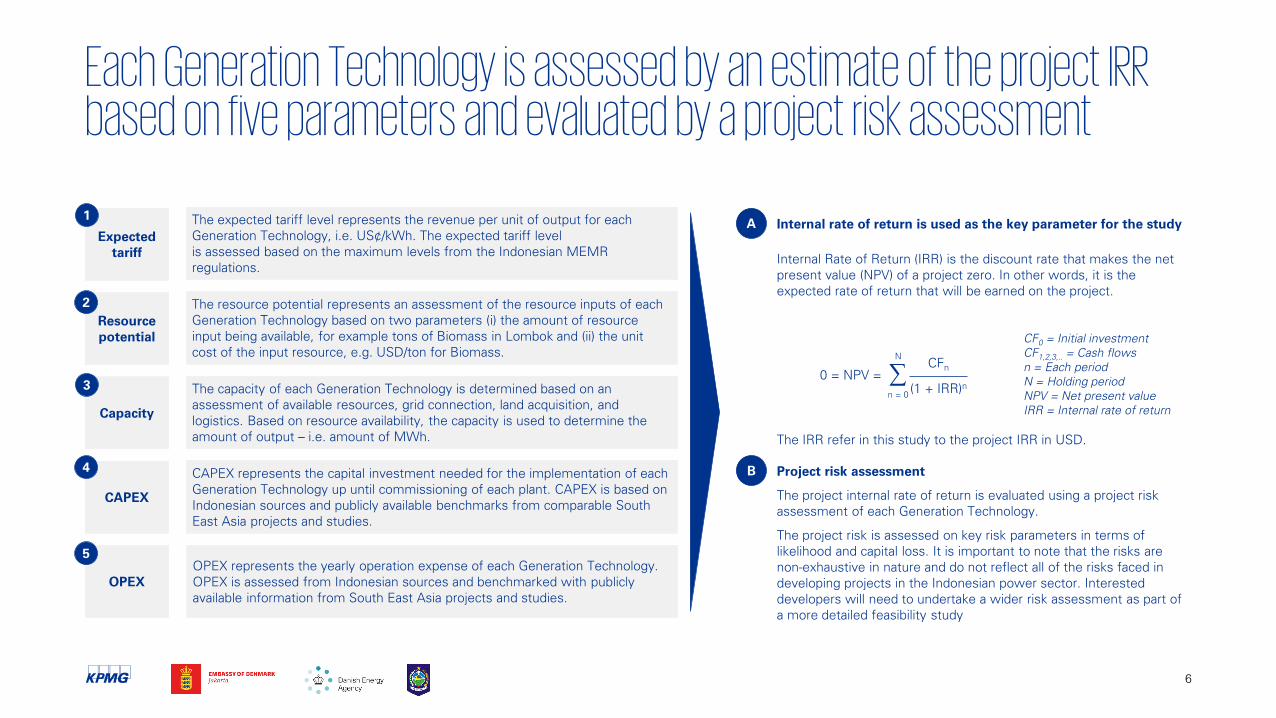
Internal rate of return is used as the key parameter for the study
CAPEX
Capacity
OPEX
The resource potential represents an assessment of the resource inputs of each
Generation Technology based on two parameters (i) the amount of resource
input being available, for example tons of Biomass in Lombok and (ii) the unit
cost of the input resource, e.g. USD/ton for Biomass.
Expected
tariff
The expected tariff level represents the revenue per unit of output for each
Generation Technology, i.e. US¢/kWh. The expected tariff level
is assessed based on the maximum levels from the Indonesian MEMR
regulations.
The capacity of each Generation Technology is determined based on an
assessment of available resources, grid connection, land acquisition, and
logistics. Based on resource availability, the capacity is used to determine the
amount of output – i.e. amount of MWh.
CAPEX represents the capital investment needed for the implementation of each
Generation Technology up until commissioning of each plant. CAPEX is based on
Indonesian sources and publicly available benchmarks from comparable South
East Asia projects and studies.
CFn∑
(1 + IRR)n
0 = NPV =
n = 0
N
CF0
= Initial investment
CF1,2,3,..
= Cash flows
n = Each period
N = Holding period
NPV = Net present value
IRR = Internal rate of return
Internal Rate of Return (IRR) is the discount rate that makes the net
present value (NPV) of a project zero. In other words, it is the
expected rate of return that will be earned on the project.
OPEX represents the yearly operation expense of each Generation Technology.
OPEX is assessed from Indonesian sources and benchmarked with publicly
available information from South East Asia projects and studies.
Project risk assessment
The project internal rate of return is evaluated using a project risk
assessment of each Generation Technology.
The project risk is assessed on key risk parameters in terms of
likelihood and capital loss. It is important to note that the risks are
non-exhaustive in nature and do not reflect all of the risks faced in
developing projects in the Indonesian power sector. Interested
developers will need to undertake a wider risk assessment as part of
a more detailed feasibility study
1
2
3
4
5
A
B
The IRR refer in this study to the project IRR in USD.
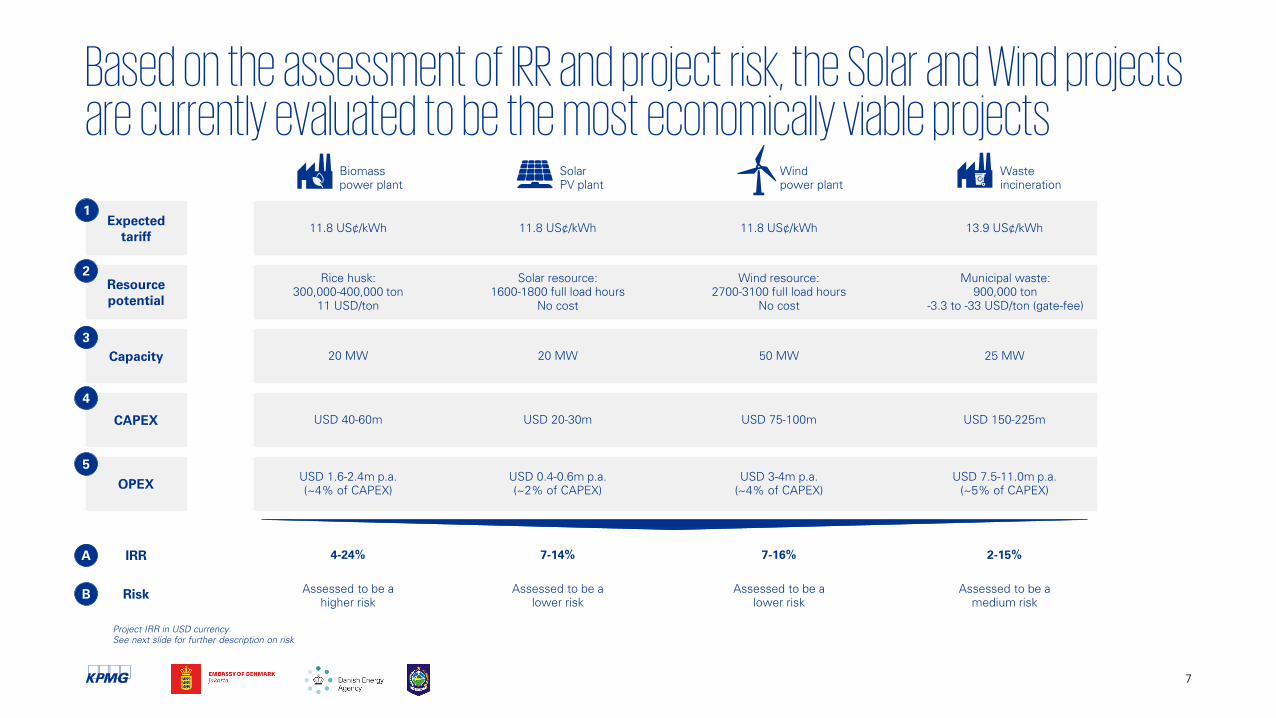
Based on the assessment of IRR and project risk, the Solar and Wind projects are currently evaluated to be the most economically viable projects
7
Biomass
power plant
Solar
PV plant
Wind
power plant
Waste
incineration
4-24% 7-14% 7-16% 2-15%
Risk
IRR
Resource
potential
CAPEX
Capacity
OPEX
Expected
tariff
11.8 US¢/kWh 11.8 US¢/kWh 11.8 US¢/kWh 13.9 US¢/kWh
Rice husk:
300,000-400,000 ton
11 USD/ton
Solar resource:
1600-1800 full load hours
No cost
Wind resource:
2700-3100 full load hours
No cost
Municipal waste:
900,000 ton
-3.3 to -33 USD/ton (gate-fee)
20 MW 20 MW 50 MW 25 MW
USD 40-60m USD 20-30m USD 75-100m USD 150-225m
USD 1.6-2.4m p.a.
(~4% of CAPEX)
USD 0.4-0.6m p.a.
(~2% of CAPEX)
USD 3-4m p.a.
(~4% of CAPEX)
1
2
3
4
5
A
BAssessed to be a
higher risk
Assessed to be a
lower risk
Assessed to be a
lower risk
Assessed to be a
medium risk
Project IRR in USD currency.
See next slide for further description on risk
USD 7.5-11.0m p.a.
(~5% of CAPEX)
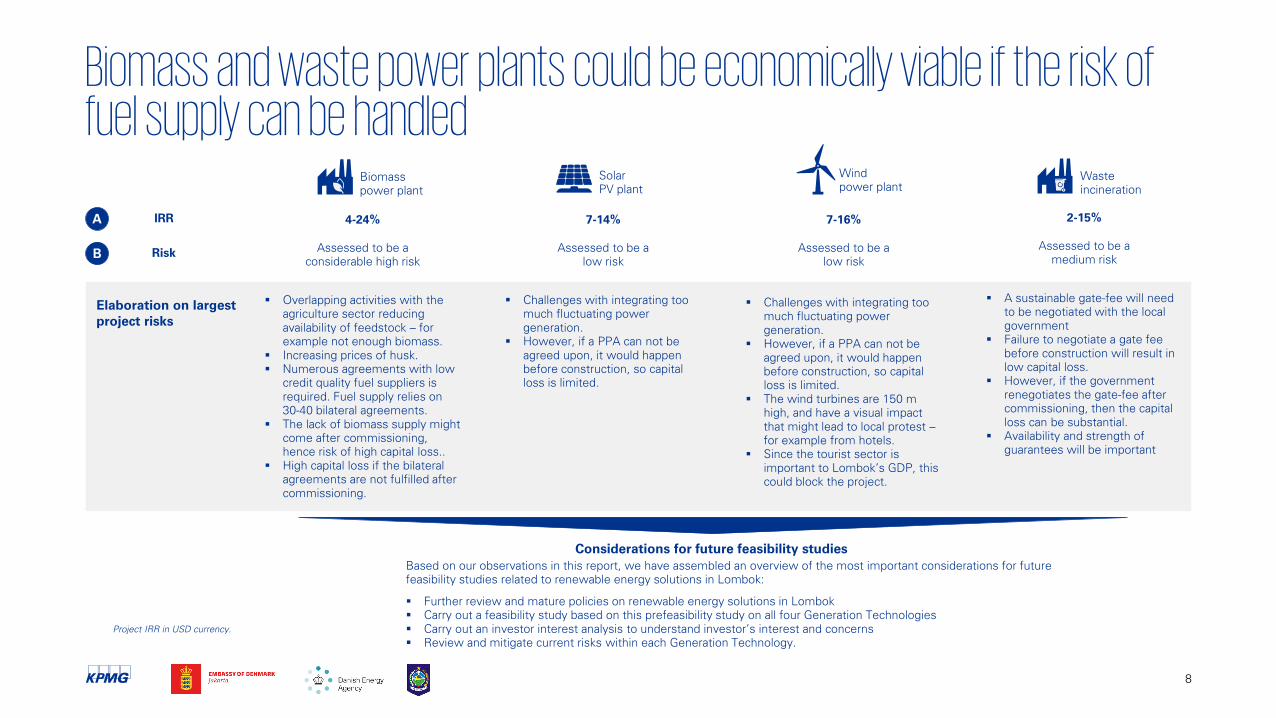
Biomass and waste power plants could be economically viable if the risk of fuel supply can be handled
8
Biomass
power plant
Solar
PV plant
Wind
power plant
Waste
incineration
Overlapping activities with the
agriculture sector reducing
availability of feedstock – for
example not enough biomass.
Increasing prices of husk.
Numerous agreements with low
credit quality fuel suppliers is
required. Fuel supply relies on
30-40 bilateral agreements.
The lack of biomass supply might
come after commissioning,
hence risk of high capital loss..
High capital loss if the bilateral
agreements are not fulfilled after
commissioning.
A
B
Elaboration on largest
project risks
IRR
Risk
Based on our observations in this report, we have assembled an overview of the most important considerations for future
feasibility studies related to renewable energy solutions in Lombok:
Further review and mature policies on renewable energy solutions in Lombok
Carry out a feasibility study based on this prefeasibility study on all four Generation Technologies
Carry out an investor interest analysis to understand investor’s interest and concerns
Review and mitigate current risks within each Generation Technology.
Considerations for future feasibility studies
A sustainable gate-fee will need
to be negotiated with the local
government
Failure to negotiate a gate fee
before construction will result in
low capital loss.
However, if the government
renegotiates the gate-fee after
commissioning, then the capital
loss can be substantial.
Availability and strength of
guarantees will be important
Assessed to be a
considerable high risk
Assessed to be a
low risk
Assessed to be a
low risk
Assessed to be a
medium risk
4-24% 7-14% 7-16% 2-15%
Challenges with integrating too
much fluctuating power
generation.
However, if a PPA can not be
agreed upon, it would happen
before construction, so capital
loss is limited.
Challenges with integrating too
much fluctuating power
generation.
However, if a PPA can not be
agreed upon, it would happen
before construction, so capital
loss is limited.
The wind turbines are 150 m
high, and have a visual impact
that might lead to local protest –
for example from hotels.
Since the tourist sector is
important to Lombok’s GDP, this
could block the project.
Project IRR in USD currency.
1 INTRODUCTION TO THE POWER
SYSTEM OF LOMBOK
2 PREFEASIBILITY STUDIES ON
GENERATION TECHNOLOGIES
BIOMASS, SOLAR, WIND AND WASTE
3INTEGRATING RENEWABLES –
INTERCONNECTORS AND
STORAGE SOLUTIONS
4 OFF-GRID SYSTEM
IN MEDANG
Contents
Introduction to the power system of Lombok
10
Google maps
Lombok is an isolated island using diesel for power generation, which results in a power price above the Indonesian average
Introduction to the power system of Lombok
11
Lombok
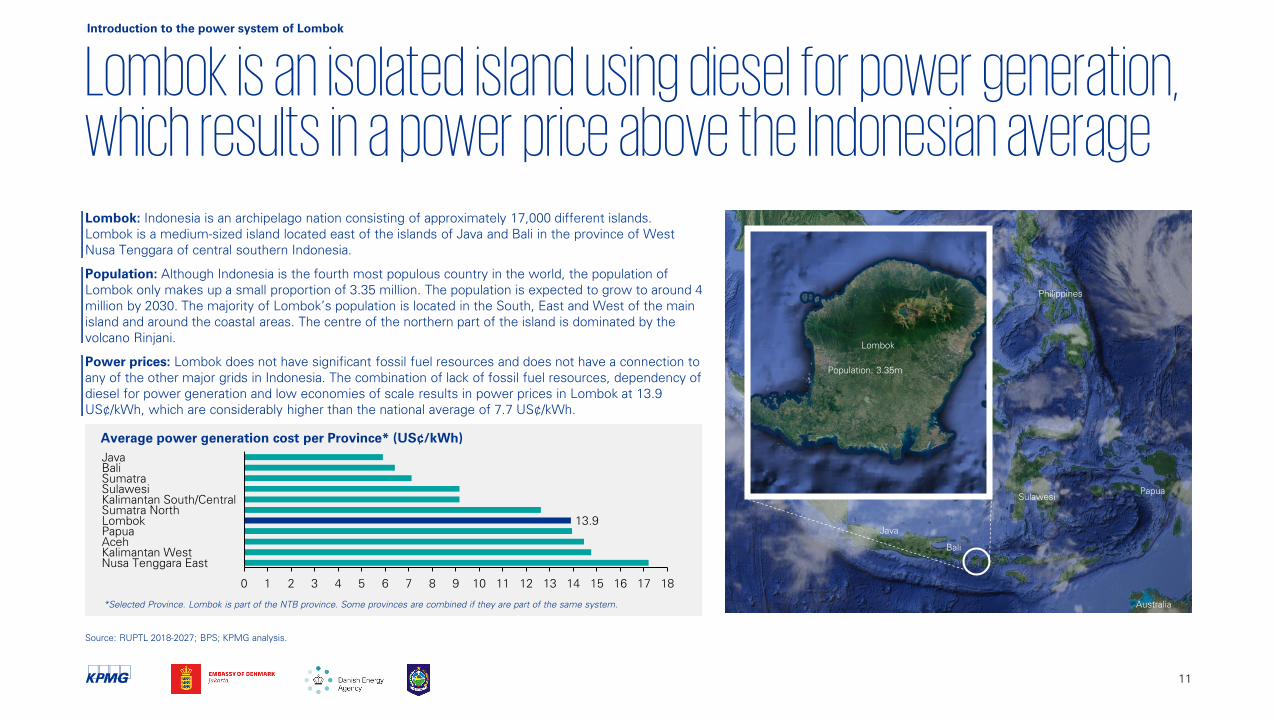
Lombok: Indonesia is an archipelago nation consisting of approximately 17,000 different islands.
Lombok is a medium-sized island located east of the islands of Java and Bali in the province of West
Nusa Tenggara of central southern Indonesia.
Population: Although Indonesia is the fourth most populous country in the world, the population of
Lombok only makes up a small proportion of 3.35 million. The population is expected to grow to around 4
million by 2030. The majority of Lombok’s population is located in the South, East and West of the main
island and around the coastal areas. The centre of the northern part of the island is dominated by the
volcano Rinjani.
Power prices: Lombok does not have significant fossil fuel resources and does not have a connection to
any of the other major grids in Indonesia. The combination of lack of fossil fuel resources, dependency of
diesel for power generation and low economies of scale results in power prices in Lombok at 13.9
US¢/kWh, which are considerably higher than the national average of 7.7 US¢/kWh.
Java
Philippines
Australia
Bali
Sulawesi
Papua
Average power generation cost per Province* (US¢/kWh)
30 21 54 6 107 98 11 12 13 14 15 16 17 18
Sumatra North
13.9
Aceh
Sulawesi
Lombok
Java
Bali
Sumatra
Kalimantan South/Central
Papua
Kalimantan West
Nusa Tenggara East
Source: RUPTL 2018-2027; BPS; KPMG analysis.
Population: 3.35m
*Selected Province. Lombok is part of the NTB province. Some provinces are combined if they are part of the same system.
Google maps
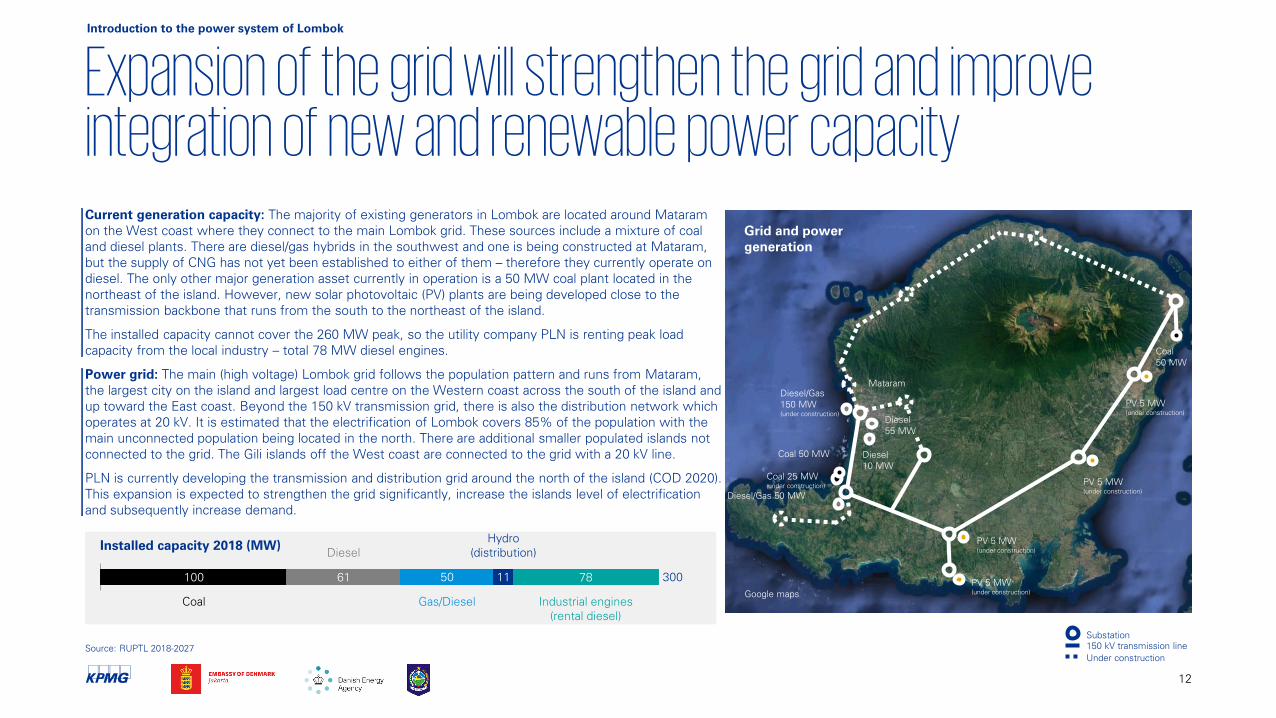
Expansion of the grid will strengthen the grid and improve integration of new and renewable power capacity Current generation capacity: The majority of existing generators in Lombok are located around Mataram
on the West coast where they connect to the main Lombok grid. These sources include a mixture of coal
and diesel plants. There are diesel/gas hybrids in the southwest and one is being constructed at Mataram,
but the supply of CNG has not yet been established to either of them – therefore they currently operate on
diesel. The only other major generation asset currently in operation is a 50 MW coal plant located in the
northeast of the island. However, new solar photovoltaic (PV) plants are being developed close to the
transmission backbone that runs from the south to the northeast of the island.
The installed capacity cannot cover the 260 MW peak, so the utility company PLN is renting peak load
capacity from the local industry – total 78 MW diesel engines.
Power grid: The main (high voltage) Lombok grid follows the population pattern and runs from Mataram,
the largest city on the island and largest load centre on the Western coast across the south of the island and
up toward the East coast. Beyond the 150 kV transmission grid, there is also the distribution network which
operates at 20 kV. It is estimated that the electrification of Lombok covers 85% of the population with the
main unconnected population being located in the north. There are additional smaller populated islands not
connected to the grid. The Gili islands off the West coast are connected to the grid with a 20 kV line.
PLN is currently developing the transmission and distribution grid around the north of the island (COD 2020).
This expansion is expected to strengthen the grid significantly, increase the islands level of electrification
and subsequently increase demand.
Source: RUPTL 2018-2027
100 61 78
Diesel
Hydro
(distribution)
11 30050
Coal Gas/Diesel Industrial engines
(rental diesel)
Coal 50 MW
Diesel/Gas 50 MW
Diesel
55 MW
Diesel
10 MW
Coal 25 MW
(under construction)
Diesel/Gas
150 MW
(under construction)
Substation
150 kV transmission line
Under construction
Installed capacity 2018 (MW)
Mataram
12
PV 5 MW
(under construction)
PV 5 MW
(under construction)
PV 5 MW
(under construction)
PV 5 MW
(under construction)
Grid and power
generation
Introduction to the power system of Lombok
Coal
50 MW
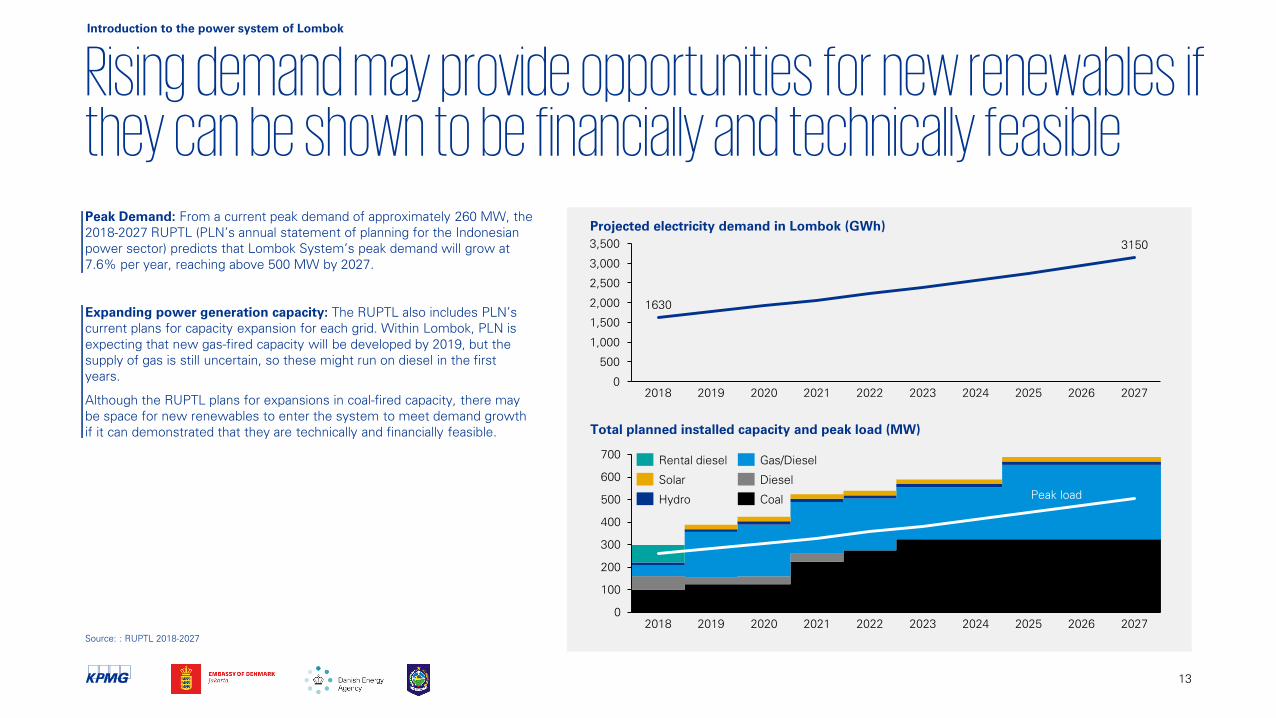
Rising demand may provide opportunities for new renewables if they can be shown to be financially and technically feasiblePeak Demand: From a current peak demand of approximately 260 MW, the
2018-2027 RUPTL (PLN’s annual statement of planning for the Indonesian
power sector) predicts that Lombok System’s peak demand will grow at
7.6% per year, reaching above 500 MW by 2027.
Expanding power generation capacity: The RUPTL also includes PLN’s
current plans for capacity expansion for each grid. Within Lombok, PLN is
expecting that new gas-fired capacity will be developed by 2019, but the
supply of gas is still uncertain, so these might run on diesel in the first
years.
Although the RUPTL plans for expansions in coal-fired capacity, there may
be space for new renewables to enter the system to meet demand growth
if it can demonstrated that they are technically and financially feasible.
13
Source: : RUPTL 2018-2027
Projected electricity demand in Lombok (GWh)
Total planned installed capacity and peak load (MW)
2,000
1,000
500
3,000
0
1,500
2,500
3,500
20242020
1630
20222018 2019 2021 2023 2025 2026
3150
2027
0
100
200
300
400
500
600
700
202520192018 20222020 2021 20262023 2024 2027
Rental diesel
Diesel
Gas/Diesel
Solar
Hydro CoalPeak load
Introduction to the power system of Lombok
Google maps
Available renewables in Lombok include Biomass, Solar and Wind, and in addition, Lombok has a challenge with waste treatment
14
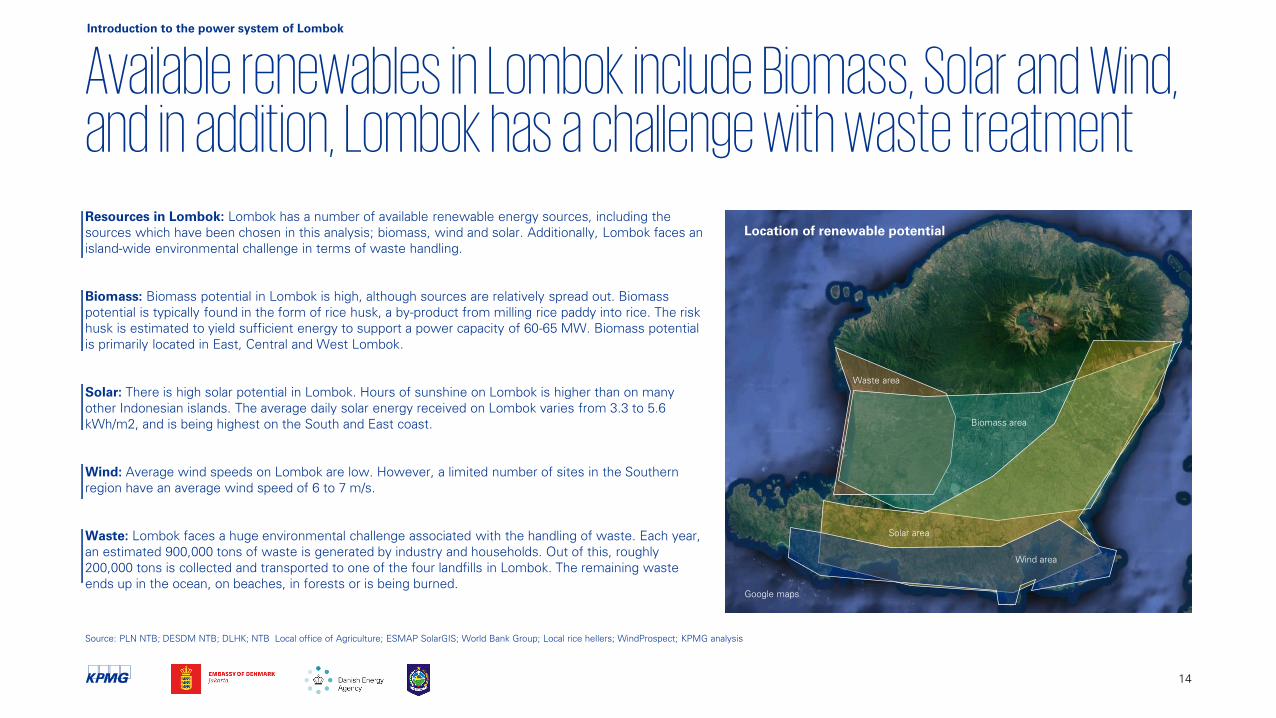
Resources in Lombok: Lombok has a number of available renewable energy sources, including the
sources which have been chosen in this analysis; biomass, wind and solar. Additionally, Lombok faces an
island-wide environmental challenge in terms of waste handling.
Biomass: Biomass potential in Lombok is high, although sources are relatively spread out. Biomass
potential is typically found in the form of rice husk, a by-product from milling rice paddy into rice. The risk
husk is estimated to yield sufficient energy to support a power capacity of 60-65 MW. Biomass potential
is primarily located in East, Central and West Lombok.
Solar: There is high solar potential in Lombok. Hours of sunshine on Lombok is higher than on many
other Indonesian islands. The average daily solar energy received on Lombok varies from 3.3 to 5.6
kWh/m2, and is being highest on the South and East coast.
Wind: Average wind speeds on Lombok are low. However, a limited number of sites in the Southern
region have an average wind speed of 6 to 7 m/s.
Waste: Lombok faces a huge environmental challenge associated with the handling of waste. Each year,
an estimated 900,000 tons of waste is generated by industry and households. Out of this, roughly
200,000 tons is collected and transported to one of the four landfills in Lombok. The remaining waste
ends up in the ocean, on beaches, in forests or is being burned.
Waste area
Biomass area
Wind area
Solar area
Location of renewable potential
Introduction to the power system of Lombok
Source: PLN NTB; DESDM NTB; DLHK; NTB Local office of Agriculture; ESMAP SolarGIS; World Bank Group; Local rice hellers; WindProspect; KPMG analysis
Google maps
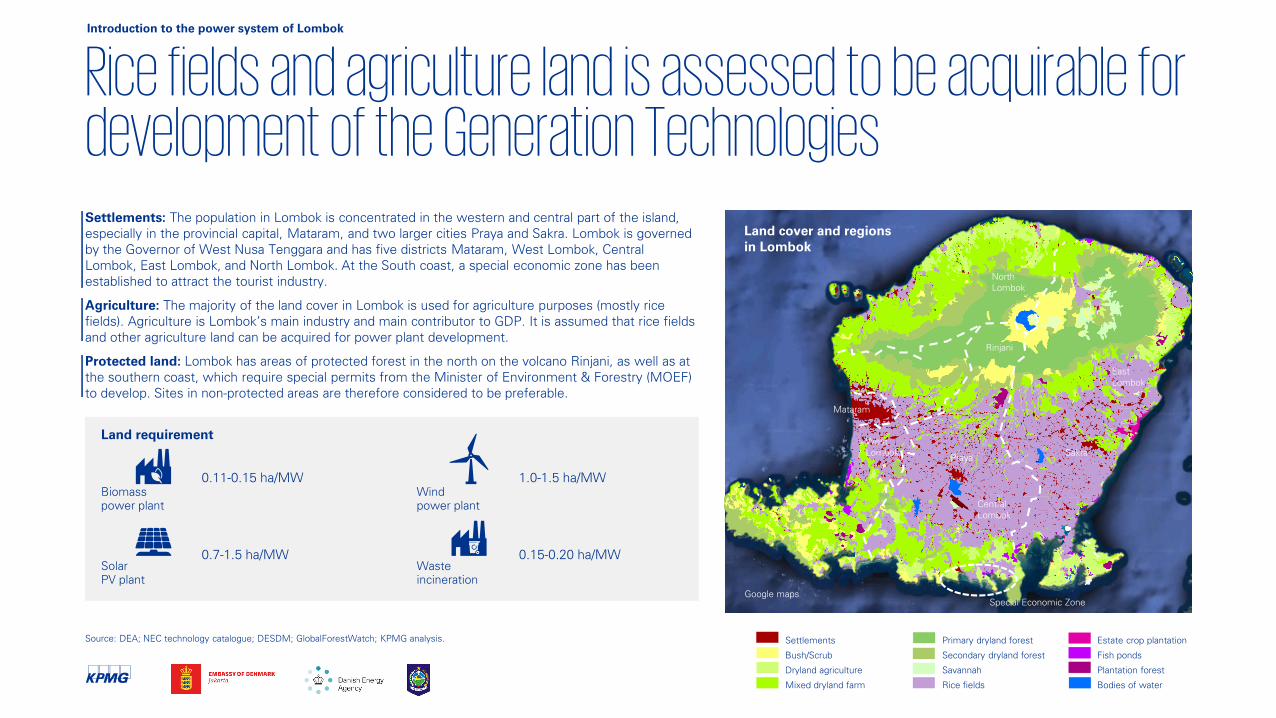
Rice fields and agriculture land is assessed to be acquirable for development of the Generation Technologies
Source: DEA; NEC technology catalogue; DESDM; GlobalForestWatch; KPMG analysis.
Settlements: The population in Lombok is concentrated in the western and central part of the island,
especially in the provincial capital, Mataram, and two larger cities Praya and Sakra. Lombok is governed
by the Governor of West Nusa Tenggara and has five districts Mataram, West Lombok, Central
Lombok, East Lombok, and North Lombok. At the South coast, a special economic zone has been
established to attract the tourist industry.
Agriculture: The majority of the land cover in Lombok is used for agriculture purposes (mostly rice
fields). Agriculture is Lombok’s main industry and main contributor to GDP. It is assumed that rice fields
and other agriculture land can be acquired for power plant development.
Protected land: Lombok has areas of protected forest in the north on the volcano Rinjani, as well as at
the southern coast, which require special permits from the Minister of Environment & Forestry (MOEF)
to develop. Sites in non-protected areas are therefore considered to be preferable.
Land cover and regions
in Lombok
Settlements
Bush/Scrub
Dryland agriculture
Mixed dryland farm
Primary dryland forest
Secondary dryland forest
Savannah
Rice fields
Estate crop plantation
Fish ponds
Plantation forest
Bodies of water
Mataram
PrayaSakra
Rinjani
Biomass
power plant
Solar
PV plant
Wind
power plant
Waste
incineration
Land requirement
0.11-0.15 ha/MW
0.7-1.5 ha/MW
1.0-1.5 ha/MW
0.15-0.20 ha/MW
Special Economic Zone
West
Lombok
Central
Lombok
East
Lombok
North
Lombok
Introduction to the power system of Lombok
Google maps
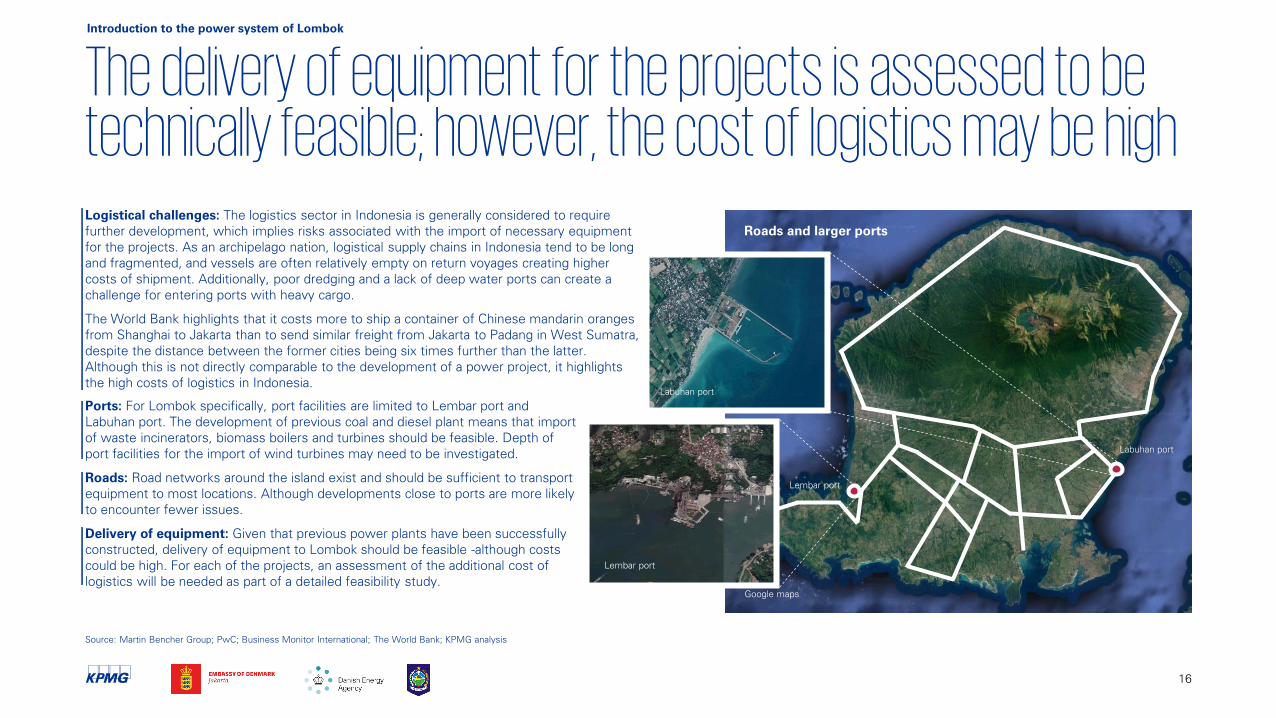
The delivery of equipment for the projects is assessed to be technically feasible; however, the cost of logistics may be high
16
Lembar port
Labuhan port
Labuhan port
Lembar port
Ports: For Lombok specifically, port facilities are limited to Lembar port and
Labuhan port. The development of previous coal and diesel plant means that import
of waste incinerators, biomass boilers and turbines should be feasible. Depth of
port facilities for the import of wind turbines may need to be investigated.
Roads: Road networks around the island exist and should be sufficient to transport
equipment to most locations. Although developments close to ports are more likely
to encounter fewer issues.
Delivery of equipment: Given that previous power plants have been successfully
constructed, delivery of equipment to Lombok should be feasible -although costs
could be high. For each of the projects, an assessment of the additional cost of
logistics will be needed as part of a detailed feasibility study.
Source: Martin Bencher Group; PwC; Business Monitor International; The World Bank; KPMG analysis
Roads and larger ports
Introduction to the power system of Lombok
Logistical challenges: The logistics sector in Indonesia is generally considered to require
further development, which implies risks associated with the import of necessary equipment
for the projects. As an archipelago nation, logistical supply chains in Indonesia tend to be long
and fragmented, and vessels are often relatively empty on return voyages creating higher
costs of shipment. Additionally, poor dredging and a lack of deep water ports can create a
challenge for entering ports with heavy cargo.
The World Bank highlights that it costs more to ship a container of Chinese mandarin oranges
from Shanghai to Jakarta than to send similar freight from Jakarta to Padang in West Sumatra,
despite the distance between the former cities being six times further than the latter.
Although this is not directly comparable to the development of a power project, it highlights
the high costs of logistics in Indonesia.
Prefeasibility studies on Generation Technologies
17
Risk
IRR
Resource
potential
CAPEX
Capacity
OPEX
Expected
tariff
1
2
3
4
5
A
B
18
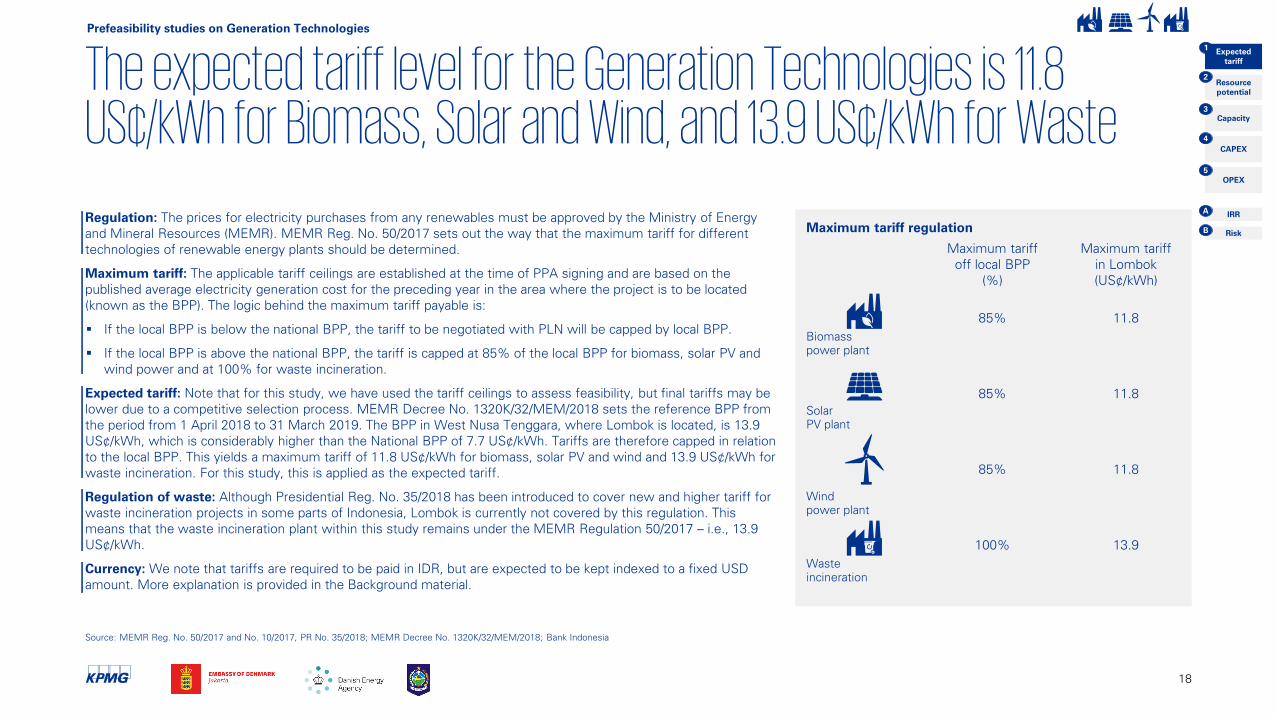
The expected tariff level for the Generation Technologies is 11.8 US¢/kWh for Biomass, Solar and Wind, and 13.9 US¢/kWh for WasteRegulation: The prices for electricity purchases from any renewables must be approved by the Ministry of Energy
and Mineral Resources (MEMR). MEMR Reg. No. 50/2017 sets out the way that the maximum tariff for different
technologies of renewable energy plants should be determined.
Maximum tariff: The applicable tariff ceilings are established at the time of PPA signing and are based on the
published average electricity generation cost for the preceding year in the area where the project is to be located
(known as the BPP). The logic behind the maximum tariff payable is:
If the local BPP is below the national BPP, the tariff to be negotiated with PLN will be capped by local BPP.
If the local BPP is above the national BPP, the tariff is capped at 85% of the local BPP for biomass, solar PV and
wind power and at 100% for waste incineration.
Expected tariff: Note that for this study, we have used the tariff ceilings to assess feasibility, but final tariffs may be
lower due to a competitive selection process. MEMR Decree No. 1320K/32/MEM/2018 sets the reference BPP from
the period from 1 April 2018 to 31 March 2019. The BPP in West Nusa Tenggara, where Lombok is located, is 13.9
US¢/kWh, which is considerably higher than the National BPP of 7.7 US¢/kWh. Tariffs are therefore capped in relation
to the local BPP. This yields a maximum tariff of 11.8 US¢/kWh for biomass, solar PV and wind and 13.9 US¢/kWh for
waste incineration. For this study, this is applied as the expected tariff.
Regulation of waste: Although Presidential Reg. No. 35/2018 has been introduced to cover new and higher tariff for
waste incineration projects in some parts of Indonesia, Lombok is currently not covered by this regulation. This
means that the waste incineration plant within this study remains under the MEMR Regulation 50/2017 – i.e., 13.9
US¢/kWh.
Currency: We note that tariffs are required to be paid in IDR, but are expected to be kept indexed to a fixed USD
amount. More explanation is provided in the Background material.
Source: MEMR Reg. No. 50/2017 and No. 10/2017, PR No. 35/2018; MEMR Decree No. 1320K/32/MEM/2018; Bank Indonesia
Biomass
power plant
Solar
PV plant
Wind
power plant
Waste
incineration
Maximum tariff
in Lombok
(US¢/kWh)
11.8
Maximum tariff
off local BPP
(%)
85%
85%
85%
100%
11.8
11.8
13.9
Maximum tariff regulation
Prefeasibility studies on Generation Technologies
Risk
IRR
Resource
potential
CAPEX
Capacity
OPEX
Expected
tariff
1
2
3
4
5
A
B
Biomass power plantPrefeasibility studies on green power generation
KPMG picture
Google maps
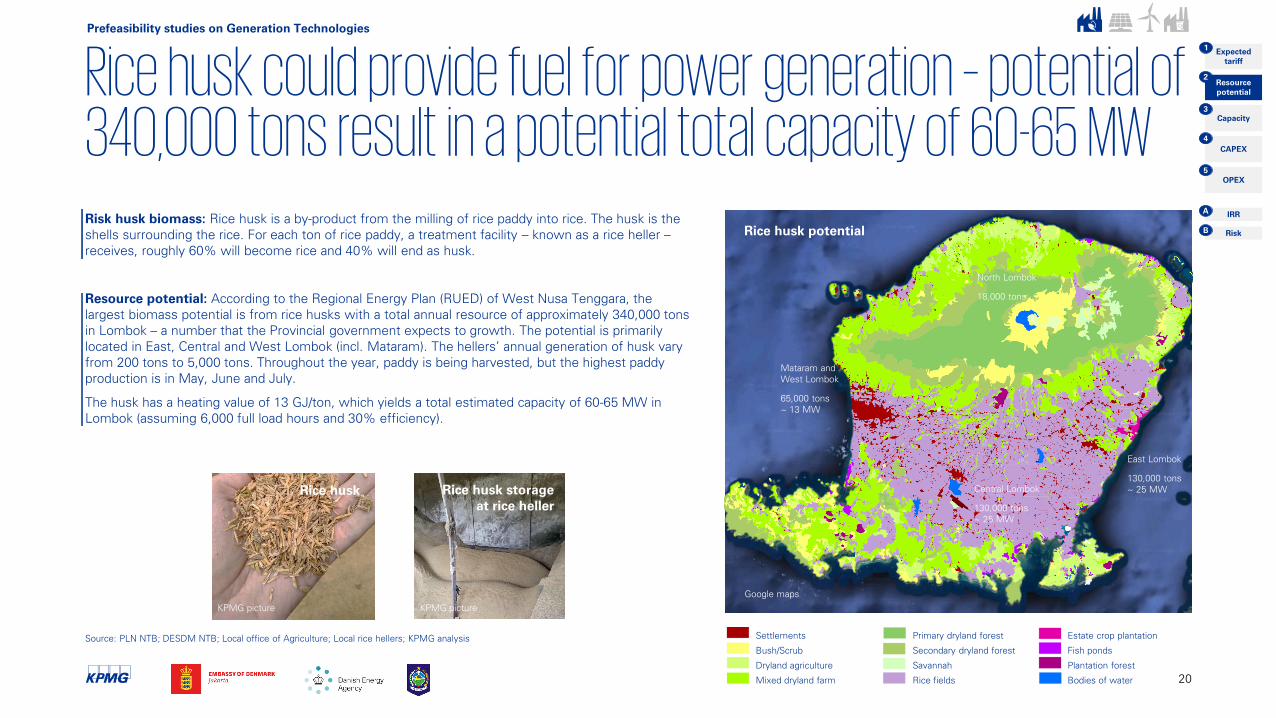
Rice husk could provide fuel for power generation – potential of 340,000 tons result in a potential total capacity of 60-65 MWRisk husk biomass: Rice husk is a by-product from the milling of rice paddy into rice. The husk is the
shells surrounding the rice. For each ton of rice paddy, a treatment facility – known as a rice heller –
receives, roughly 60% will become rice and 40% will end as husk.
Resource potential: According to the Regional Energy Plan (RUED) of West Nusa Tenggara, the
largest biomass potential is from rice husks with a total annual resource of approximately 340,000 tons
in Lombok – a number that the Provincial government expects to growth. The potential is primarily
located in East, Central and West Lombok (incl. Mataram). The hellers’ annual generation of husk vary
from 200 tons to 5,000 tons. Throughout the year, paddy is being harvested, but the highest paddy
production is in May, June and July.
The husk has a heating value of 13 GJ/ton, which yields a total estimated capacity of 60-65 MW in
Lombok (assuming 6,000 full load hours and 30% efficiency).
Central Lombok
130,000 tons
~ 25 MW
North Lombok
18,000 tons
East Lombok
130,000 tons
~ 25 MW
Mataram and
West Lombok
65,000 tons
~ 13 MW
Source: PLN NTB; DESDM NTB; Local office of Agriculture; Local rice hellers; KPMG analysis
KPMG picture
Rice husk storage
at rice heller
Rice husk
Rice husk potential
Settlements
Bush/Scrub
Dryland agriculture
Mixed dryland farm
Primary dryland forest
Secondary dryland forest
Savannah
Rice fields
Estate crop plantation
Fish ponds
Plantation forest
Bodies of water 20
KPMG picture
Prefeasibility studies on Generation Technologies
Risk
IRR
Resource
potential
CAPEX
Capacity
OPEX
Expected
tariff
1
2
3
4
5
A
B
Google maps
The suitable biomass plant capacity is assessed to be 20 MWThe cost of the husk is estimated to be 11 USD/ton
Power plant site and husk resources
Source: NuGen Engineering Ltd.; Ea Energy Analyses & IDEAS Consulting Services; NEC technology catalogue; DESDM NTB; Local office of Agriculture; Local rice hellers; KPMG analysis
Biomass
power plant
20 MW
Known resources:
~ 15,000 ton
~ 3 hellers
~ 40,000 ton
~ 17 hellers
30 km
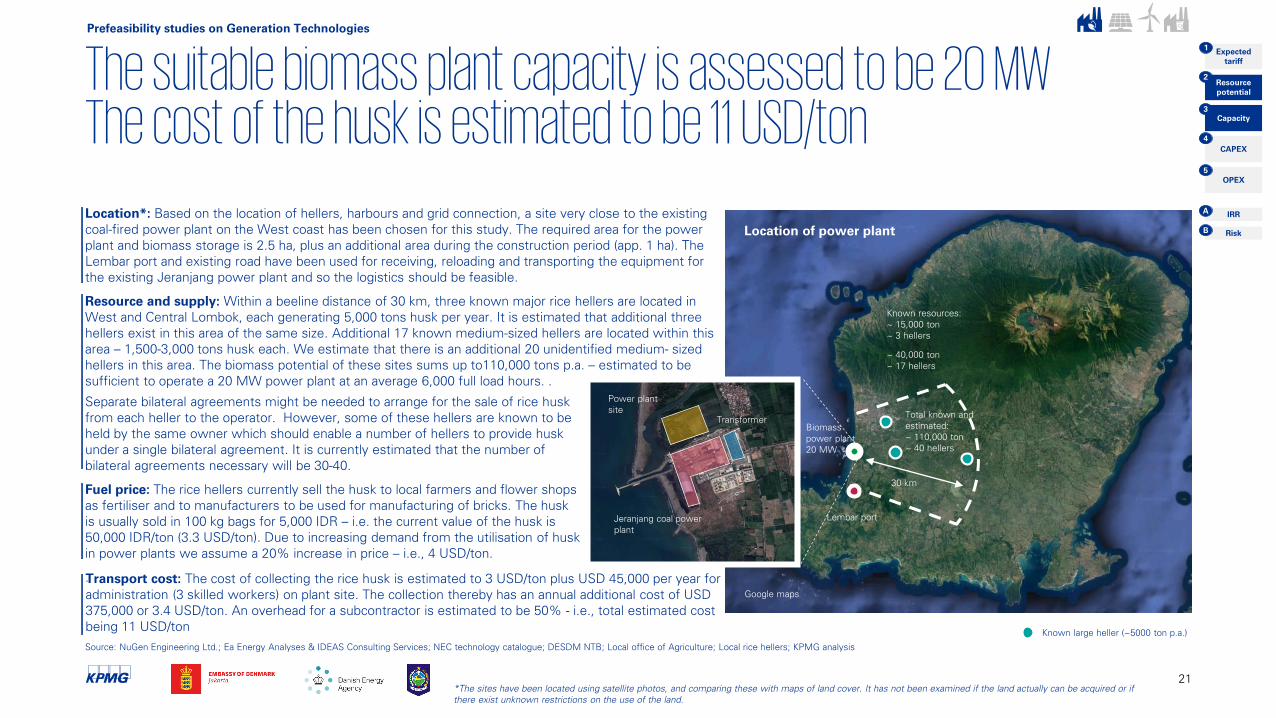
Location*: Based on the location of hellers, harbours and grid connection, a site very close to the existing
coal-fired power plant on the West coast has been chosen for this study. The required area for the power
plant and biomass storage is 2.5 ha, plus an additional area during the construction period (app. 1 ha). The
Lembar port and existing road have been used for receiving, reloading and transporting the equipment for
the existing Jeranjang power plant and so the logistics should be feasible.
Resource and supply: Within a beeline distance of 30 km, three known major rice hellers are located in
West and Central Lombok, each generating 5,000 tons husk per year. It is estimated that additional three
hellers exist in this area of the same size. Additional 17 known medium-sized hellers are located within this
area – 1,500-3,000 tons husk each. We estimate that there is an additional 20 unidentified medium- sized
hellers in this area. The biomass potential of these sites sums up to110,000 tons p.a. – estimated to be
sufficient to operate a 20 MW power plant at an average 6,000 full load hours. .
Total known and
estimated:
~ 110,000 ton
~ 40 hellers
Separate bilateral agreements might be needed to arrange for the sale of rice husk
from each heller to the operator. However, some of these hellers are known to be
held by the same owner which should enable a number of hellers to provide husk
under a single bilateral agreement. It is currently estimated that the number of
bilateral agreements necessary will be 30-40.
Fuel price: The rice hellers currently sell the husk to local farmers and flower shops
as fertiliser and to manufacturers to be used for manufacturing of bricks. The husk
is usually sold in 100 kg bags for 5,000 IDR – i.e. the current value of the husk is
50,000 IDR/ton (3.3 USD/ton). Due to increasing demand from the utilisation of husk
in power plants we assume a 20% increase in price – i.e., 4 USD/ton.
.
Known large heller (~5000 ton p.a.)
Jeranjang coal power
plant
Power plant
site
Transformer
Lembar port
21
Prefeasibility studies on Generation Technologies
Risk
IRR
Resource
potential
CAPEX
Capacity
OPEX
Expected
tariff
1
2
3
4
5
A
B
*The sites have been located using satellite photos, and comparing these with maps of land cover. It has not been examined if the land actually can be acquired or if
there exist unknown restrictions on the use of the land.
Transport cost: The cost of collecting the rice husk is estimated to 3 USD/ton plus USD 45,000 per year for
administration (3 skilled workers) on plant site. The collection thereby has an annual additional cost of USD
375,000 or 3.4 USD/ton. An overhead for a subcontractor is estimated to be 50% - i.e., total estimated cost
being 11 USD/ton
Location of power plant
Construction Equipment InfrastructureDevelopment
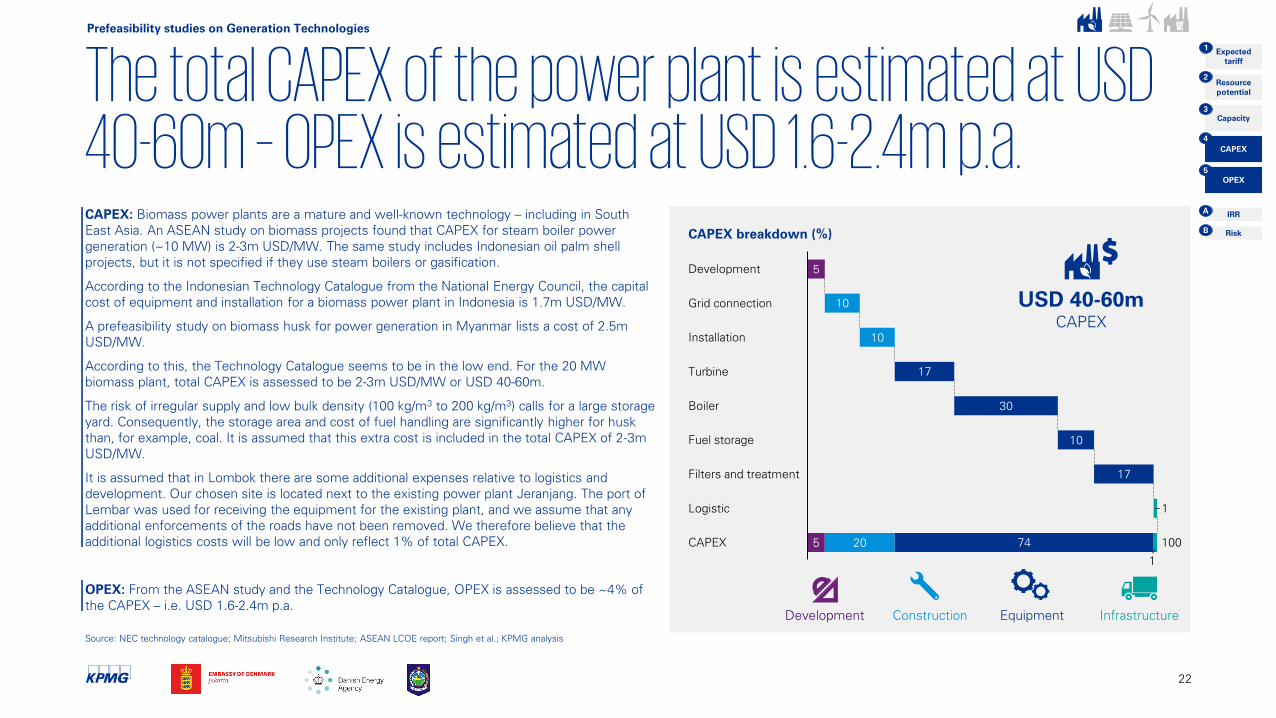
The total CAPEX of the power plant is estimated at USD 40-60m – OPEX is estimated at USD 1.6-2.4m p.a.
22
Source: NEC technology catalogue; Mitsubishi Research Institute; ASEAN LCOE report; Singh et al.; KPMG analysis
CAPEX: Biomass power plants are a mature and well-known technology – including in South
East Asia. An ASEAN study on biomass projects found that CAPEX for steam boiler power
generation (~10 MW) is 2-3m USD/MW. The same study includes Indonesian oil palm shell
projects, but it is not specified if they use steam boilers or gasification.
According to the Indonesian Technology Catalogue from the National Energy Council, the capital
cost of equipment and installation for a biomass power plant in Indonesia is 1.7m USD/MW.
A prefeasibility study on biomass husk for power generation in Myanmar lists a cost of 2.5m
USD/MW.
According to this, the Technology Catalogue seems to be in the low end. For the 20 MW
biomass plant, total CAPEX is assessed to be 2-3m USD/MW or USD 40-60m.
The risk of irregular supply and low bulk density (100 kg/m3
to 200 kg/m3) calls for a large storage
yard. Consequently, the storage area and cost of fuel handling are significantly higher for husk
than, for example, coal. It is assumed that this extra cost is included in the total CAPEX of 2-3m
USD/MW.
It is assumed that in Lombok there are some additional expenses relative to logistics and
development. Our chosen site is located next to the existing power plant Jeranjang. The port of
Lembar was used for receiving the equipment for the existing plant, and we assume that any
additional enforcements of the roads have not been removed. We therefore believe that the
additional logistics costs will be low and only reflect 1% of total CAPEX.
OPEX: From the ASEAN study and the Technology Catalogue, OPEX is assessed to be ~4% of
the CAPEX – i.e. USD 1.6-2.4m p.a.
5
5
10
30
10
20
17
Fuel storage
Turbine
Grid connection
Installation
Development
10
Boiler
17Filters and treatment
1Logistic
1
74CAPEX 100
CAPEX breakdown (%)
USD 40-60m
CAPEX
Prefeasibility studies on Generation Technologies
Risk
IRR
Resource
potential
CAPEX
Capacity
OPEX
Expected
tariff
1
2
3
4
5
A
B
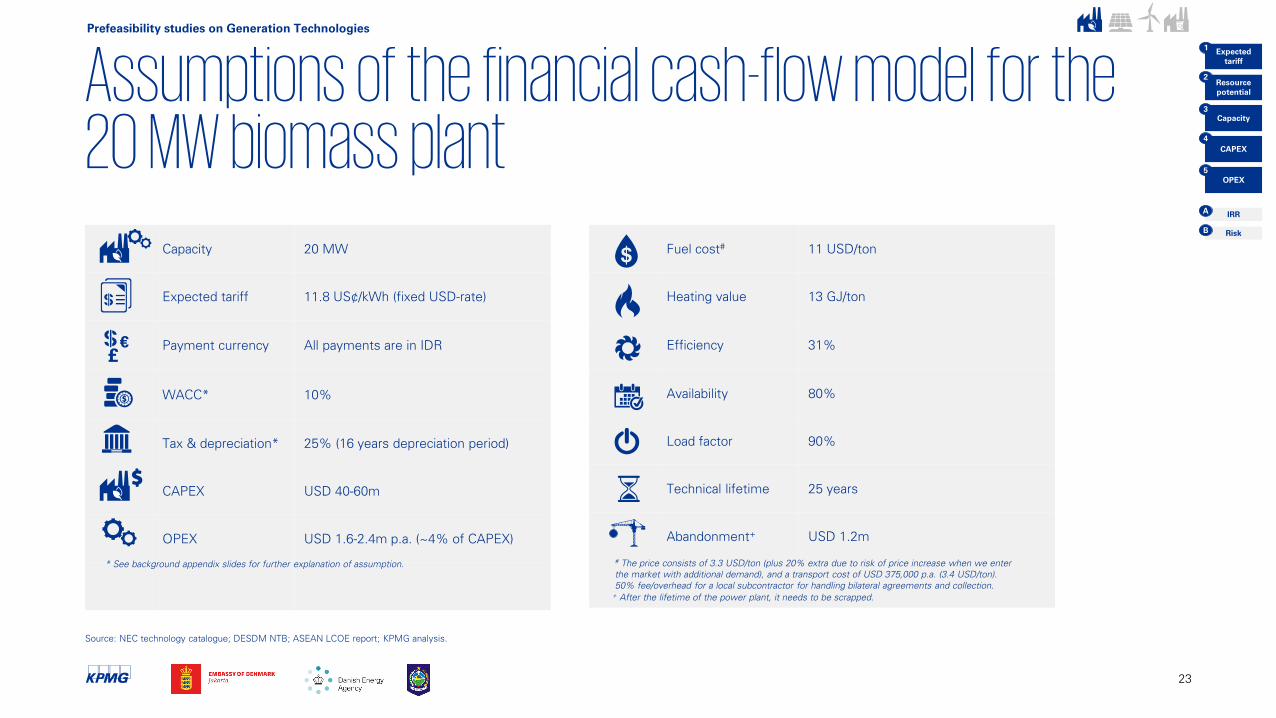
Assumptions of the financial cash-flow model for the 20 MW biomass plant
23
Capacity 20 MW
Expected tariff 11.8 US¢/kWh (fixed USD-rate)
Payment currency All payments are in IDR
WACC* 10%
Tax & depreciation* 25% (16 years depreciation period)
CAPEX USD 40-60m
OPEX USD 1.6-2.4m p.a. (~4% of CAPEX)
£
€
Fuel cost#
11 USD/ton
Heating value 13 GJ/ton
Efficiency 31%
Availability 80%
Load factor 90%
Technical lifetime 25 years
Abandonment+
USD 1.2m
#The price consists of 3.3 USD/ton (plus 20% extra due to risk of price increase when we enter
the market with additional demand), and a transport cost of USD 375,000 p.a. (3.4 USD/ton).
50% fee/overhead for a local subcontractor for handling bilateral agreements and collection.
+After the lifetime of the power plant, it needs to be scrapped.
* See background appendix slides for further explanation of assumption.
Source: NEC technology catalogue; DESDM NTB; ASEAN LCOE report; KPMG analysis.
Prefeasibility studies on Generation Technologies
Risk
IRR
Resource
potential
CAPEX
Capacity
OPEX
Expected
tariff
1
2
3
4
5
A
B
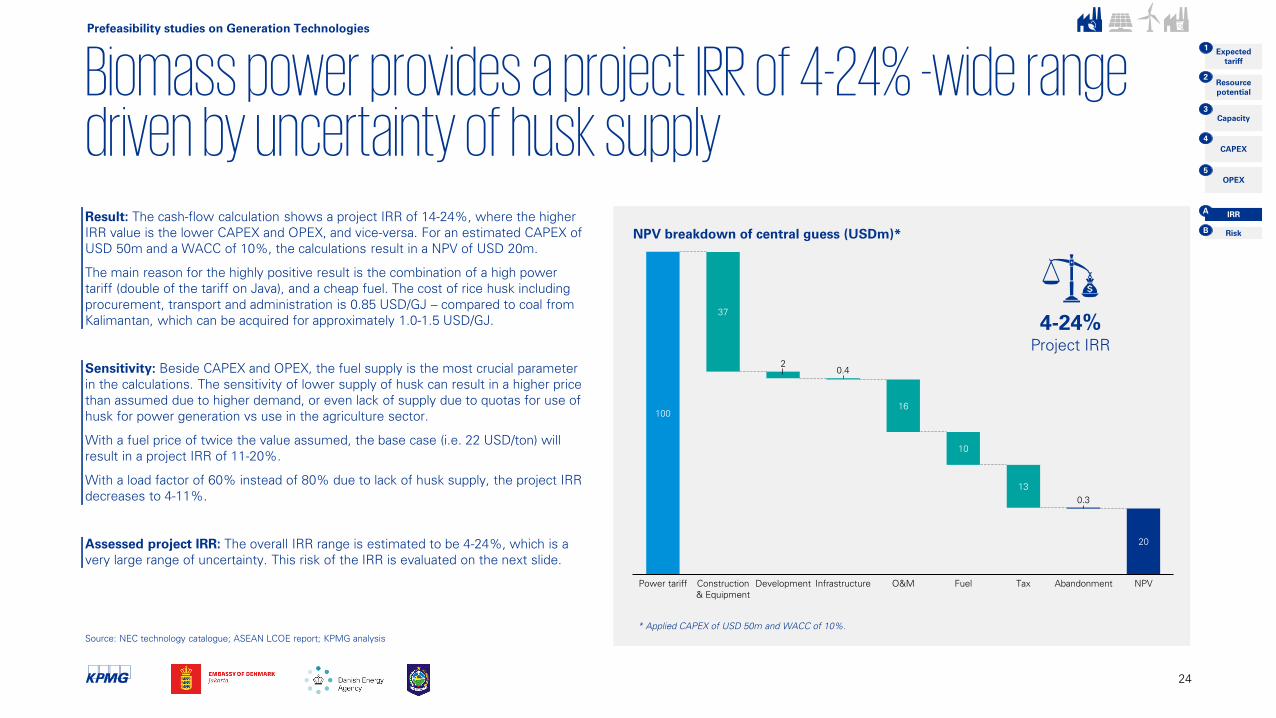
Biomass power provides a project IRR of 4-24% -wide range driven by uncertainty of husk supplyResult: The cash-flow calculation shows a project IRR of 14-24%, where the higher
IRR value is the lower CAPEX and OPEX, and vice-versa. For an estimated CAPEX of
USD 50m and a WACC of 10%, the calculations result in a NPV of USD 20m.
The main reason for the highly positive result is the combination of a high power
tariff (double of the tariff on Java), and a cheap fuel. The cost of rice husk including
procurement, transport and administration is 0.85 USD/GJ – compared to coal from
Kalimantan, which can be acquired for approximately 1.0-1.5 USD/GJ.
Sensitivity: Beside CAPEX and OPEX, the fuel supply is the most crucial parameter
in the calculations. The sensitivity of lower supply of husk can result in a higher price
than assumed due to higher demand, or even lack of supply due to quotas for use of
husk for power generation vs use in the agriculture sector.
With a fuel price of twice the value assumed, the base case (i.e. 22 USD/ton) will
result in a project IRR of 11-20%.
With a load factor of 60% instead of 80% due to lack of husk supply, the project IRR
decreases to 4-11%.
Assessed project IRR: The overall IRR range is estimated to be 4-24%, which is a
very large range of uncertainty. This risk of the IRR is evaluated on the next slide.
24
20
2
100
DevelopmentPower tariff
37
0.4
Construction
& Equipment
Abandonment
10
Infrastructure Fuel
16
O&M
13
Tax
0.3
NPV
4-24%
Project IRR
Source: NEC technology catalogue; ASEAN LCOE report; KPMG analysis
NPV breakdown of central guess (USDm)*
* Applied CAPEX of USD 50m and WACC of 10%.
Prefeasibility studies on Generation Technologies
Risk
IRR
Resource
potential
CAPEX
Capacity
OPEX
Expected
tariff
1
2
3
4
5
A
B
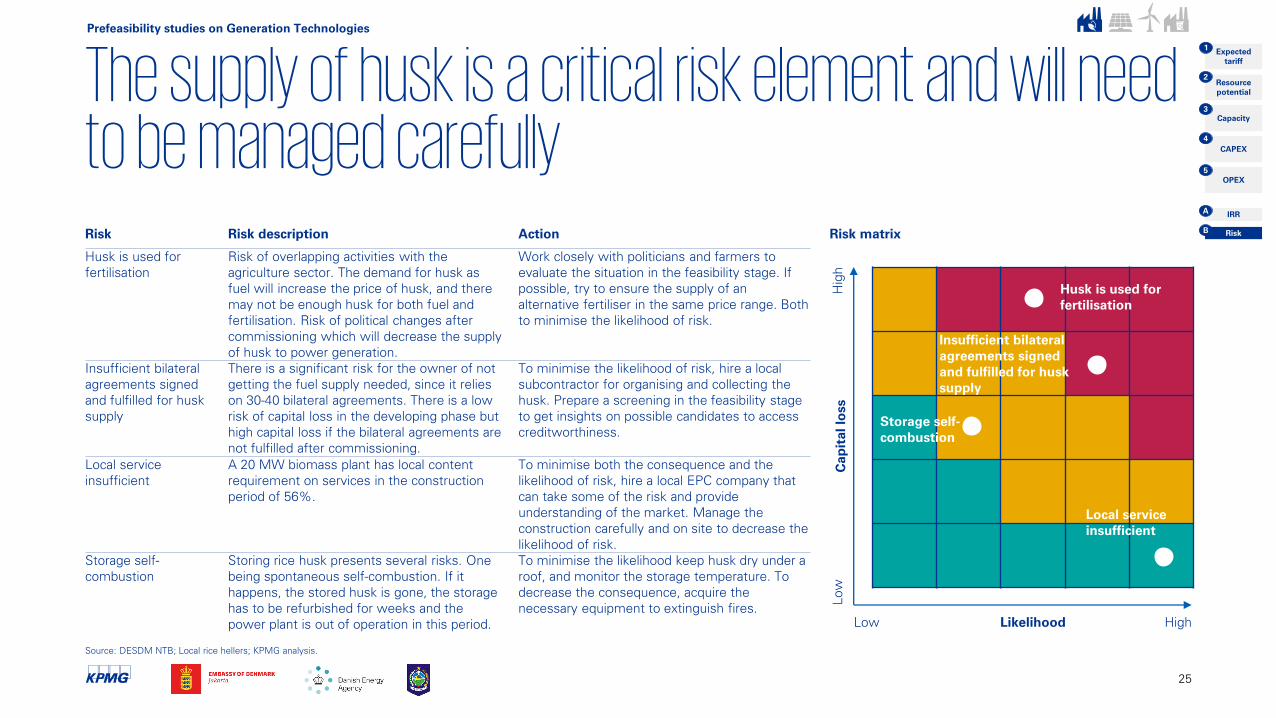
The supply of husk is a critical risk element and will need to be managed carefully
25
Source: DESDM NTB; Local rice hellers; KPMG analysis.
Risk matrix
Insufficient bilateral
agreements signed
and fulfilled for husk
supply
Husk is used for
fertilisation
Storage self-
combustion
Risk Risk description Action
Husk is used for
fertilisation
Risk of overlapping activities with the
agriculture sector. The demand for husk as
fuel will increase the price of husk, and there
may not be enough husk for both fuel and
fertilisation. Risk of political changes after
commissioning which will decrease the supply
of husk to power generation.
Work closely with politicians and farmers to
evaluate the situation in the feasibility stage. If
possible, try to ensure the supply of an
alternative fertiliser in the same price range. Both
to minimise the likelihood of risk.
Insufficient bilateral
agreements signed
and fulfilled for husk
supply
There is a significant risk for the owner of not
getting the fuel supply needed, since it relies
on 30-40 bilateral agreements. There is a low
risk of capital loss in the developing phase but
high capital loss if the bilateral agreements are
not fulfilled after commissioning.
To minimise the likelihood of risk, hire a local
subcontractor for organising and collecting the
husk. Prepare a screening in the feasibility stage
to get insights on possible candidates to access
creditworthiness.
Local service
insufficient
A 20 MW biomass plant has local content
requirement on services in the construction
period of 56%.
To minimise both the consequence and the
likelihood of risk, hire a local EPC company that
can take some of the risk and provide
understanding of the market. Manage the
construction carefully and on site to decrease the
likelihood of risk.
Storage self-
combustion
Storing rice husk presents several risks. One
being spontaneous self-combustion. If it
happens, the stored husk is gone, the storage
has to be refurbished for weeks and the
power plant is out of operation in this period.
To minimise the likelihood keep husk dry under a
roof, and monitor the storage temperature. To
decrease the consequence, acquire the
necessary equipment to extinguish fires.
Likelihood
Cap
ital lo
ss
Hig
hLow
HighLow
Local service
insufficient
Prefeasibility studies on Generation Technologies
Risk
IRR
Resource
potential
CAPEX
Capacity
OPEX
Expected
tariff
1
2
3
4
5
A
B
Solar PV plant
26
Prefeasibility studies on green power generation
Google maps
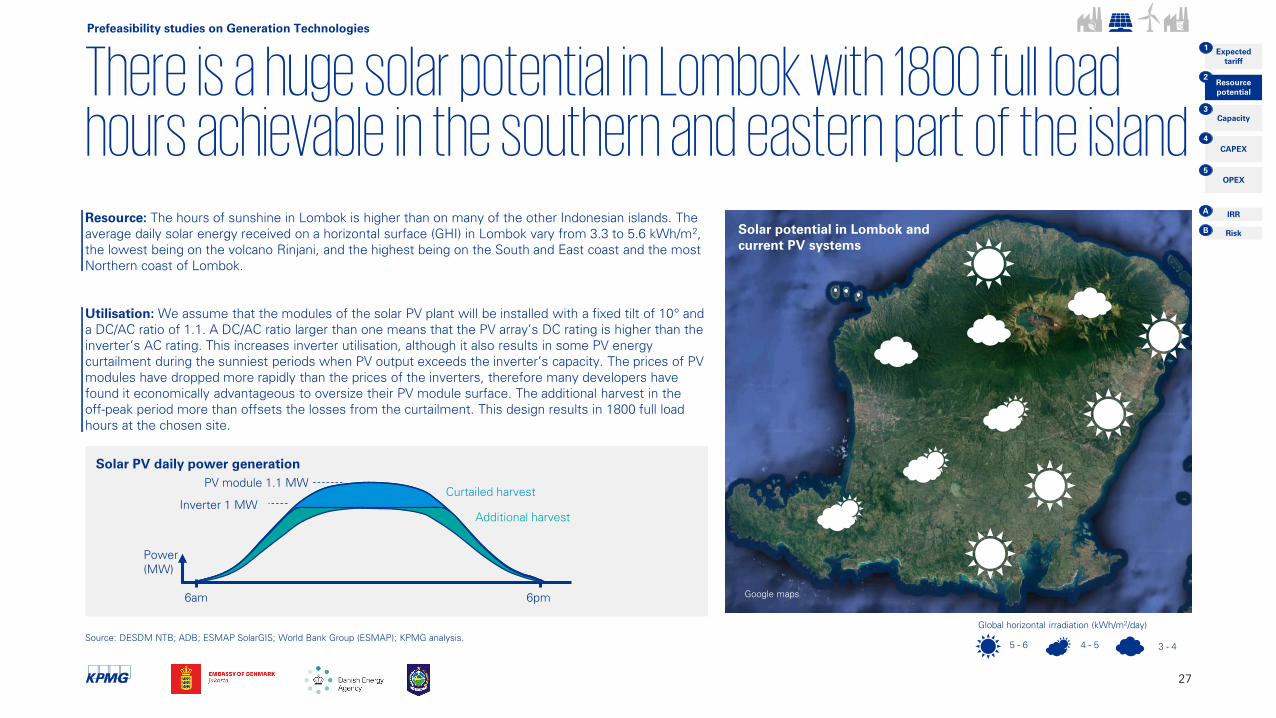
There is a huge solar potential in Lombok with 1800 full load hours achievable in the southern and eastern part of the islandResource: The hours of sunshine in Lombok is higher than on many of the other Indonesian islands. The
average daily solar energy received on a horizontal surface (GHI) in Lombok vary from 3.3 to 5.6 kWh/m2,
the lowest being on the volcano Rinjani, and the highest being on the South and East coast and the most
Northern coast of Lombok.
Utilisation: We assume that the modules of the solar PV plant will be installed with a fixed tilt of 10° and
a DC/AC ratio of 1.1. A DC/AC ratio larger than one means that the PV array’s DC rating is higher than the
inverter’s AC rating. This increases inverter utilisation, although it also results in some PV energy
curtailment during the sunniest periods when PV output exceeds the inverter’s capacity. The prices of PV
modules have dropped more rapidly than the prices of the inverters, therefore many developers have
found it economically advantageous to oversize their PV module surface. The additional harvest in the
off-peak period more than offsets the losses from the curtailment. This design results in 1800 full load
hours at the chosen site.
Source: DESDM NTB; ADB; ESMAP SolarGIS; World Bank Group (ESMAP); KPMG analysis.
3 - 4
Global horizontal irradiation (kWh/m2/day)
5 - 6 4 - 5
Solar potential in Lombok and
current PV systems
27
Prefeasibility studies on Generation Technologies
Risk
IRR
Resource
potential
CAPEX
Capacity
OPEX
Expected
tariff
1
2
3
4
5
A
B
Inverter 1 MW
PV module 1.1 MW
Curtailed harvest
Additional harvest
Power
(MW)
6am 6pm
Solar PV daily power generation
Google maps
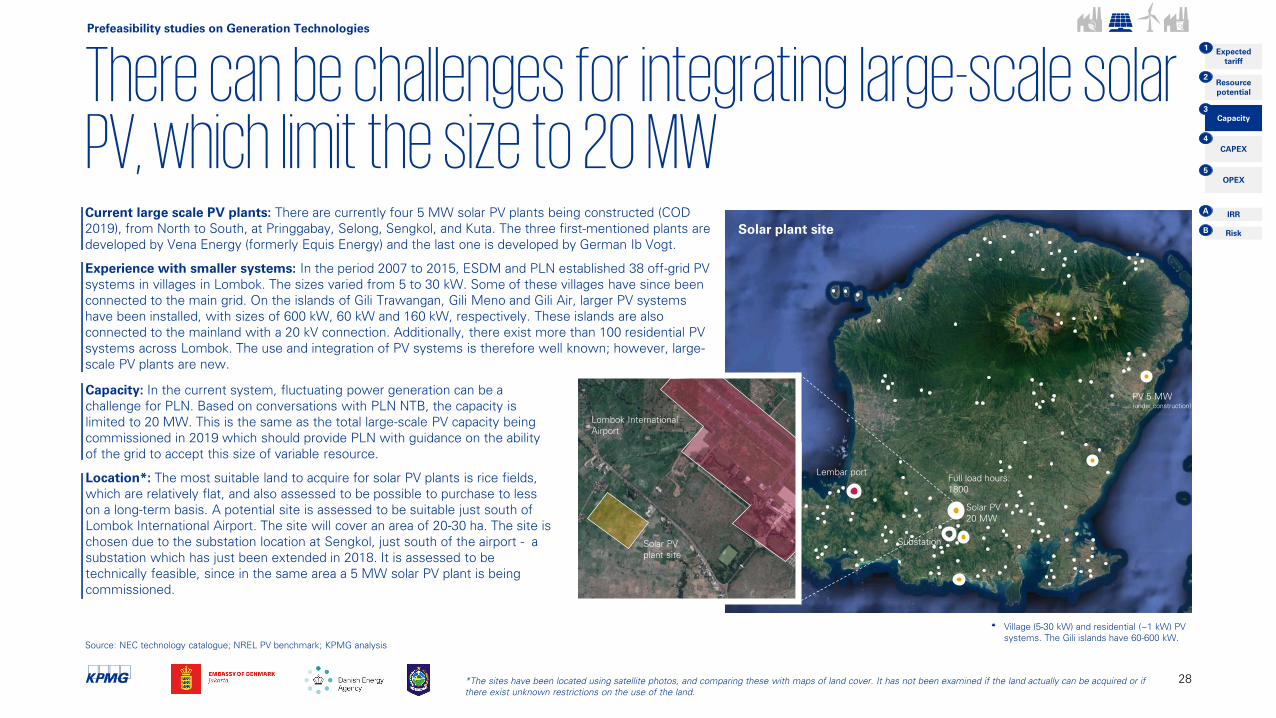
There can be challenges for integrating large-scale solar PV, which limit the size to 20 MWCurrent large scale PV plants: There are currently four 5 MW solar PV plants being constructed (COD
2019), from North to South, at Pringgabay, Selong, Sengkol, and Kuta. The three first-mentioned plants are
developed by Vena Energy (formerly Equis Energy) and the last one is developed by German Ib Vogt.
Experience with smaller systems: In the period 2007 to 2015, ESDM and PLN established 38 off-grid PV
systems in villages in Lombok. The sizes varied from 5 to 30 kW. Some of these villages have since been
connected to the main grid. On the islands of Gili Trawangan, Gili Meno and Gili Air, larger PV systems
have been installed, with sizes of 600 kW, 60 kW and 160 kW, respectively. These islands are also
connected to the mainland with a 20 kV connection. Additionally, there exist more than 100 residential PV
systems across Lombok. The use and integration of PV systems is therefore well known; however, large-
scale PV plants are new.
Source: NEC technology catalogue; NREL PV benchmark; KPMG analysis
Plant site
Substation
Full load hours:
1800
Lombok International
Airport
Solar PV
plant site
Solar PV
20 MW
Solar plant site
Lembar port
28
Prefeasibility studies on Generation Technologies
Risk
IRR
Resource
potential
CAPEX
Capacity
OPEX
Expected
tariff
1
2
3
4
5
A
B
PV 5 MW
(under construction)
Village (5-30 kW) and residential (~1 kW) PV
systems. The Gili islands have 60-600 kW.
Capacity: In the current system, fluctuating power generation can be a
challenge for PLN. Based on conversations with PLN NTB, the capacity is
limited to 20 MW. This is the same as the total large-scale PV capacity being
commissioned in 2019 which should provide PLN with guidance on the ability
of the grid to accept this size of variable resource.
Location*: The most suitable land to acquire for solar PV plants is rice fields,
which are relatively flat, and also assessed to be possible to purchase to less
on a long-term basis. A potential site is assessed to be suitable just south of
Lombok International Airport. The site will cover an area of 20-30 ha. The site is
chosen due to the substation location at Sengkol, just south of the airport - a
substation which has just been extended in 2018. It is assessed to be
technically feasible, since in the same area a 5 MW solar PV plant is being
commissioned.
*The sites have been located using satellite photos, and comparing these with maps of land cover. It has not been examined if the land actually can be acquired or if
there exist unknown restrictions on the use of the land.
Development of total cost of PV and market spread (USDm/MW)
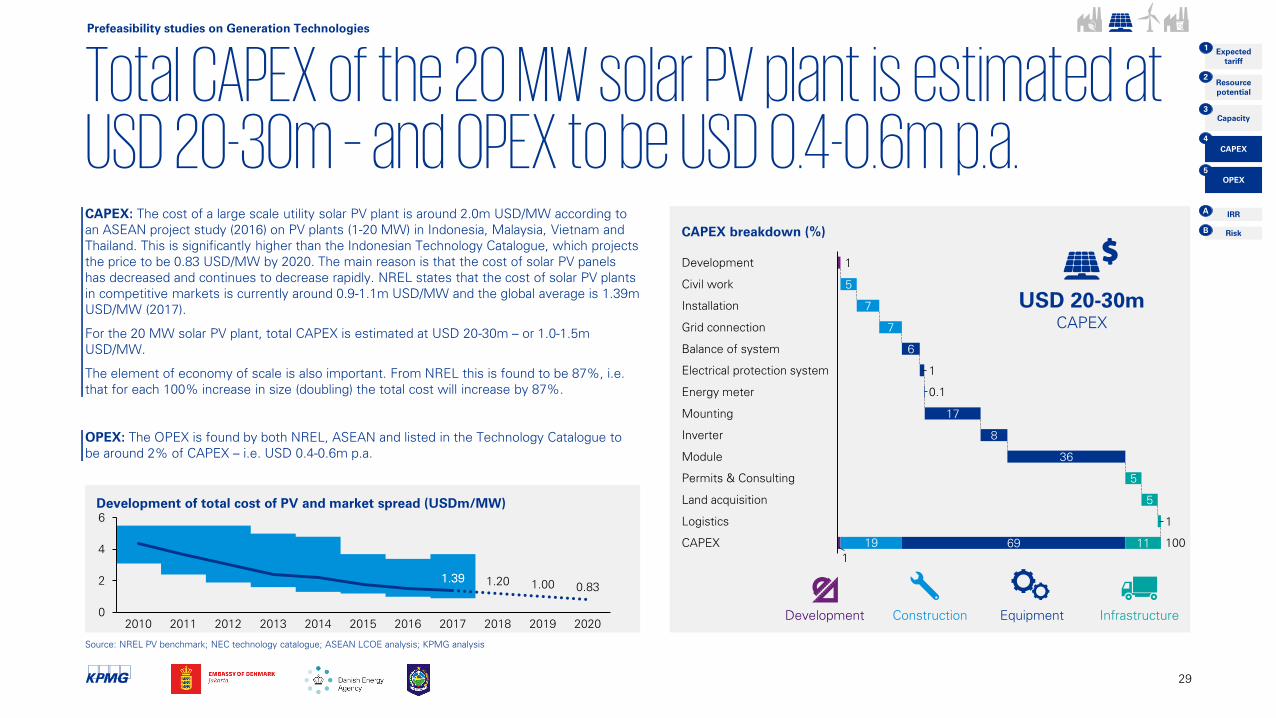
Total CAPEX of the 20 MW solar PV plant is estimated at USD 20-30m – and OPEX to be USD 0.4-0.6m p.a.
29
Source: NREL PV benchmark; NEC technology catalogue; ASEAN LCOE analysis; KPMG analysis
CAPEX: The cost of a large scale utility solar PV plant is around 2.0m USD/MW according to
an ASEAN project study (2016) on PV plants (1-20 MW) in Indonesia, Malaysia, Vietnam and
Thailand. This is significantly higher than the Indonesian Technology Catalogue, which projects
the price to be 0.83 USD/MW by 2020. The main reason is that the cost of solar PV panels
has decreased and continues to decrease rapidly. NREL states that the cost of solar PV plants
in competitive markets is currently around 0.9-1.1m USD/MW and the global average is 1.39m
USD/MW (2017).
For the 20 MW solar PV plant, total CAPEX is estimated at USD 20-30m – or 1.0-1.5m
USD/MW.
The element of economy of scale is also important. From NREL this is found to be 87%, i.e.
that for each 100% increase in size (doubling) the total cost will increase by 87%.
OPEX: The OPEX is found by both NREL, ASEAN and listed in the Technology Catalogue to
be around 2% of CAPEX – i.e. USD 0.4-0.6m p.a.
CAPEX breakdown (%)
1
1
5
7
7
6
1
17
8
36
5
5
1
69 11
Module
Permits & Consulting
Logistics
19
Civil work
CAPEX
Installation
Land acquisition
Balance of system
Grid connection
Electrical protection system
0.1Energy meter
Mounting
Development
100
Inverter
USD 20-30m
CAPEX
0
2
4
6
2014
0.83
20152010 2011 201620132012
1.391.39
2017
1.20
2018
1.00
2019 2020
Construction Equipment InfrastructureDevelopment
Prefeasibility studies on Generation Technologies
Risk
IRR
Resource
potential
CAPEX
Capacity
OPEX
Expected
tariff
1
2
3
4
5
A
B
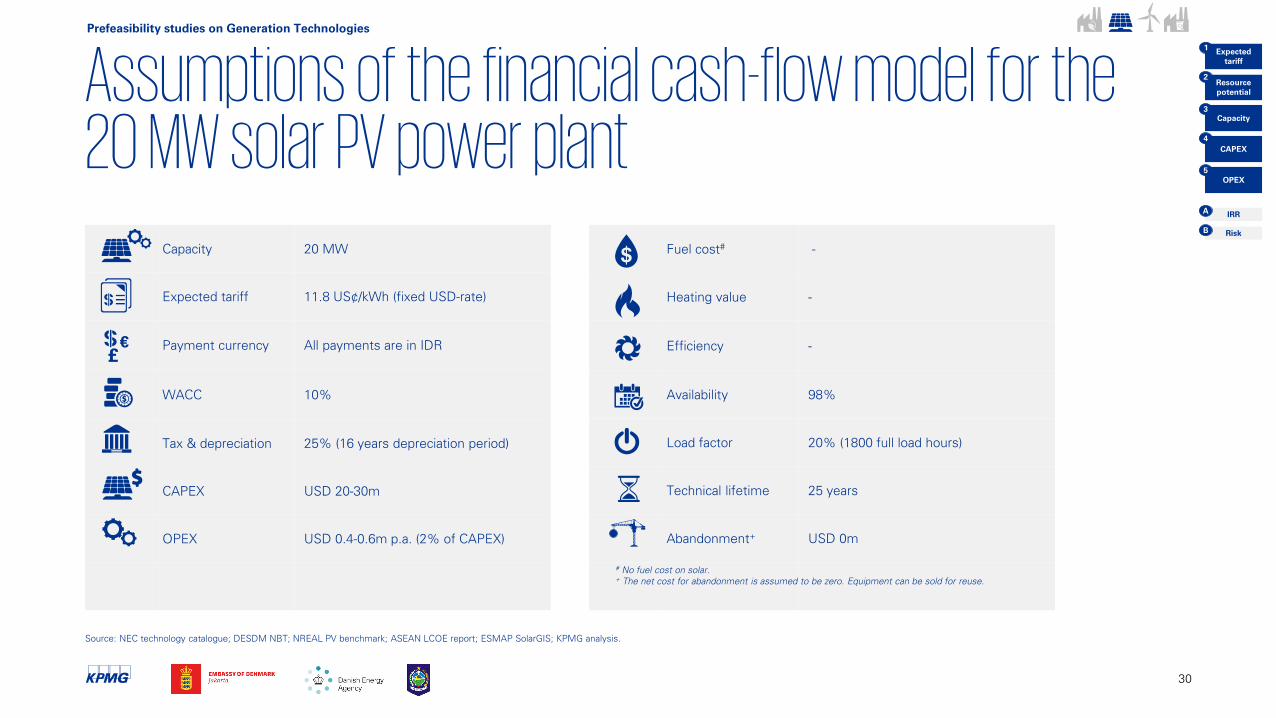
Assumptions of the financial cash-flow model for the 20 MW solar PV power plant
30
Source: NEC technology catalogue; DESDM NBT; NREAL PV benchmark; ASEAN LCOE report; ESMAP SolarGIS; KPMG analysis.
Capacity 20 MW
Expected tariff 11.8 US¢/kWh (fixed USD-rate)
Payment currency All payments are in IDR
WACC 10%
Tax & depreciation 25% (16 years depreciation period)
CAPEX USD 20-30m
OPEX USD 0.4-0.6m p.a. (2% of CAPEX)
£
€
Fuel cost#
-
Heating value -
Efficiency -
Availability 98%
Load factor 20% (1800 full load hours)
Technical lifetime 25 years
Abandonment+
USD 0m
#No fuel cost on solar.
+The net cost for abandonment is assumed to be zero. Equipment can be sold for reuse.
Prefeasibility studies on Generation Technologies
Risk
IRR
Resource
potential
CAPEX
Capacity
OPEX
Expected
tariff
1
2
3
4
5
A
B
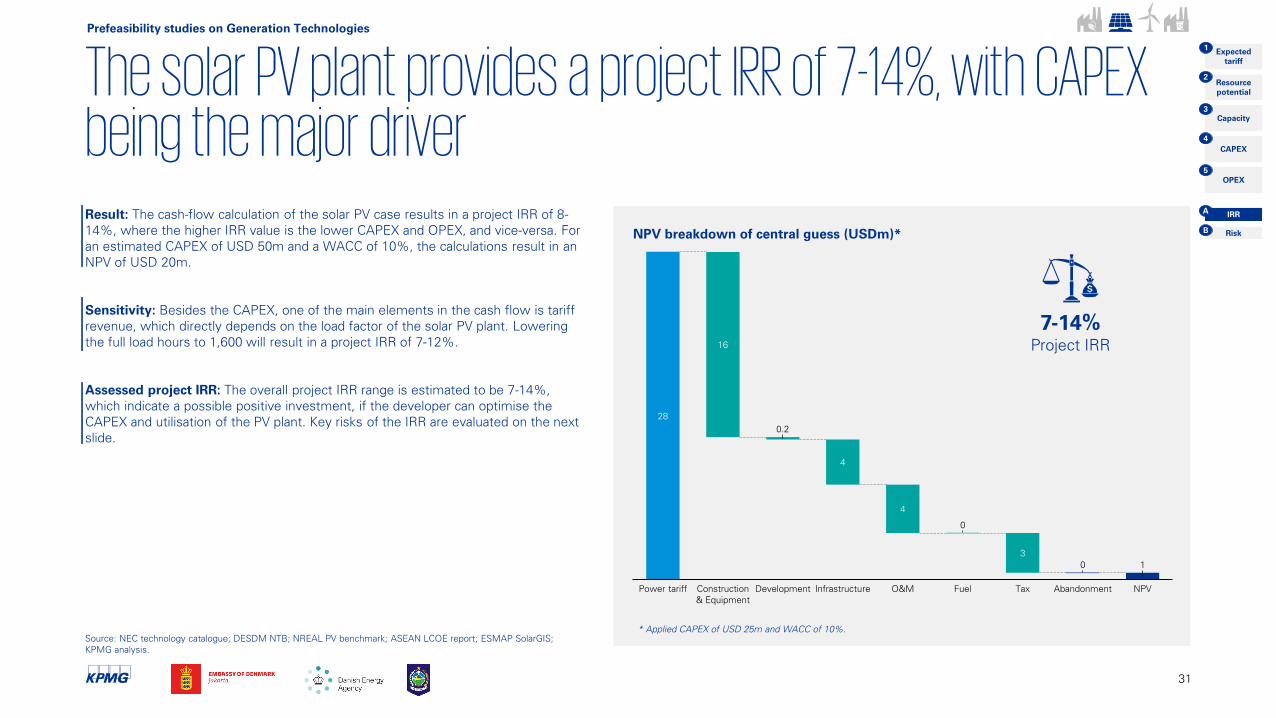
The solar PV plant provides a project IRR of 7-14%, with CAPEX being the major driver
31
DevelopmentConstruction
& Equipment
16
Power tariff
28
0.2
Infrastructure
4
O&M
3
Tax
0
Abandonment
1
NPV
0
Fuel
4
Result: The cash-flow calculation of the solar PV case results in a project IRR of 8-
14%, where the higher IRR value is the lower CAPEX and OPEX, and vice-versa. For
an estimated CAPEX of USD 50m and a WACC of 10%, the calculations result in an
NPV of USD 20m.
Sensitivity: Besides the CAPEX, one of the main elements in the cash flow is tariff
revenue, which directly depends on the load factor of the solar PV plant. Lowering
the full load hours to 1,600 will result in a project IRR of 7-12%.
Assessed project IRR: The overall project IRR range is estimated to be 7-14%,
which indicate a possible positive investment, if the developer can optimise the
CAPEX and utilisation of the PV plant. Key risks of the IRR are evaluated on the next
slide.
Source: NEC technology catalogue; DESDM NTB; NREAL PV benchmark; ASEAN LCOE report; ESMAP SolarGIS;
KPMG analysis.
Prefeasibility studies on Generation Technologies
Risk
IRR
Resource
potential
CAPEX
Capacity
OPEX
Expected
tariff
1
2
3
4
5
A
B
* Applied CAPEX of USD 25m and WACC of 10%.
7-14%
Project IRR
NPV breakdown of central guess (USDm)*
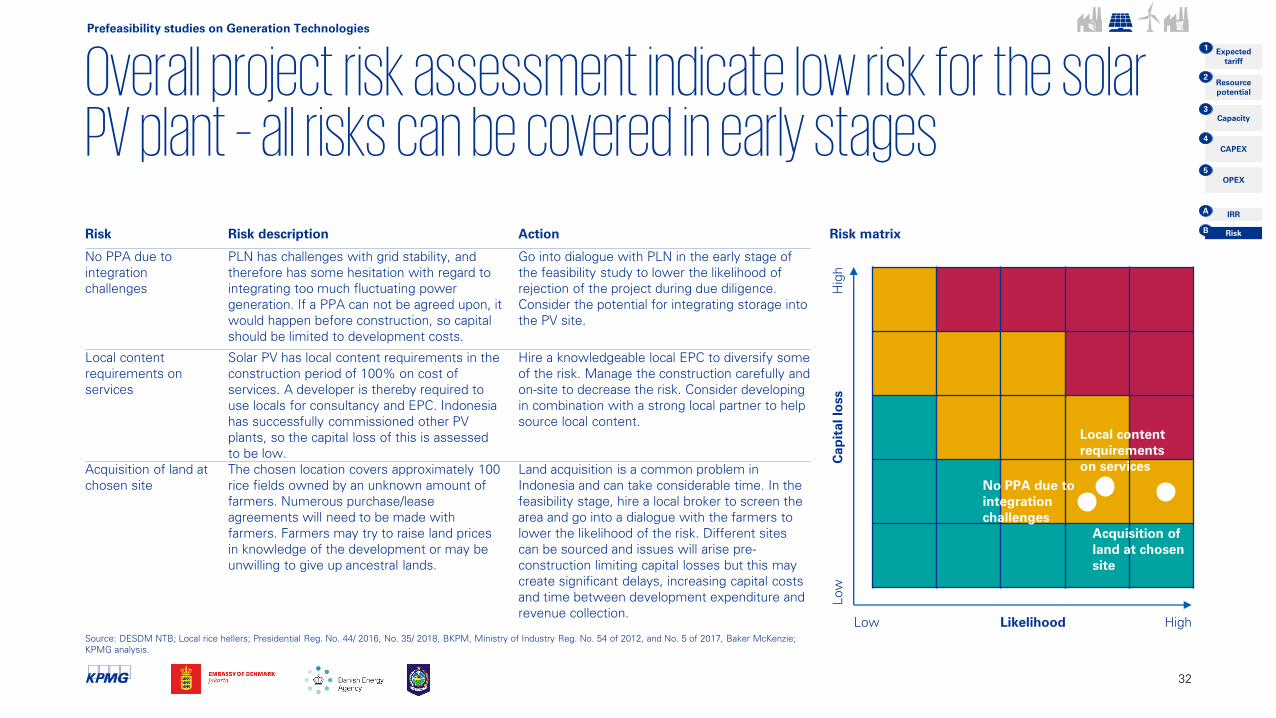
Overall project risk assessment indicate low risk for the solar PV plant – all risks can be covered in early stages
32
Source: DESDM NTB; Local rice hellers; Presidential Reg. No. 44/ 2016, No. 35/ 2018, BKPM, Ministry of Industry Reg. No. 54 of 2012, and No. 5 of 2017, Baker McKenzie;
KPMG analysis.
Risk matrix
Likelihood
Cap
ital lo
ss
Hig
hLow
HighLow
Local content
requirements
on services
Risk Risk description Action
No PPA due to
integration
challenges
PLN has challenges with grid stability, and
therefore has some hesitation with regard to
integrating too much fluctuating power
generation. If a PPA can not be agreed upon, it
would happen before construction, so capital
should be limited to development costs.
Go into dialogue with PLN in the early stage of
the feasibility study to lower the likelihood of
rejection of the project during due diligence.
Consider the potential for integrating storage into
the PV site.
Local content
requirements on
services
Solar PV has local content requirements in the
construction period of 100% on cost of
services. A developer is thereby required to
use locals for consultancy and EPC. Indonesia
has successfully commissioned other PV
plants, so the capital loss of this is assessed
to be low.
Hire a knowledgeable local EPC to diversify some
of the risk. Manage the construction carefully and
on-site to decrease the risk. Consider developing
in combination with a strong local partner to help
source local content.
Acquisition of land at
chosen site
The chosen location covers approximately 100
rice fields owned by an unknown amount of
farmers. Numerous purchase/lease
agreements will need to be made with
farmers. Farmers may try to raise land prices
in knowledge of the development or may be
unwilling to give up ancestral lands.
Land acquisition is a common problem in
Indonesia and can take considerable time. In the
feasibility stage, hire a local broker to screen the
area and go into a dialogue with the farmers to
lower the likelihood of the risk. Different sites
can be sourced and issues will arise pre-
construction limiting capital losses but this may
create significant delays, increasing capital costs
and time between development expenditure and
revenue collection.
Acquisition of
land at chosen
site
Prefeasibility studies on Generation Technologies
Risk
IRR
Resource
potential
CAPEX
Capacity
OPEX
Expected
tariff
1
2
3
4
5
A
B
No PPA due to
integration
challenges
Wind power plant
33
Prefeasibility studies on green power generation
Google maps
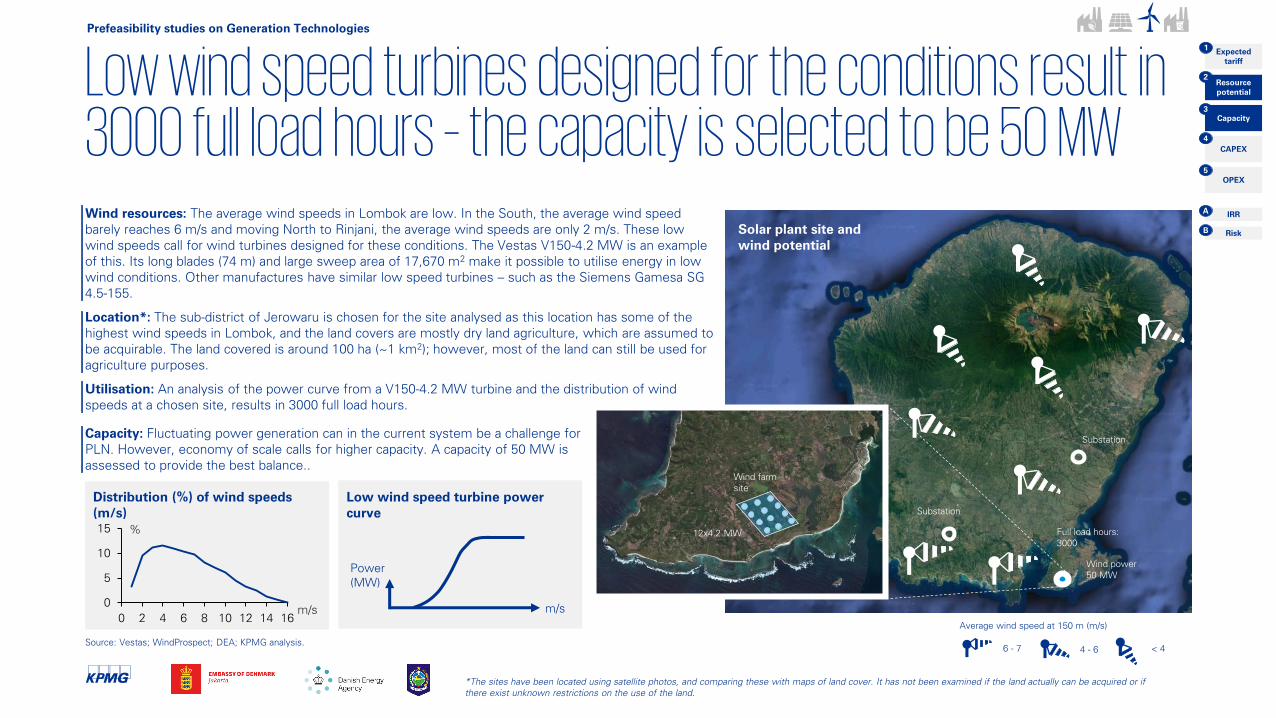
Low wind speed turbines designed for the conditions result in 3000 full load hours – the capacity is selected to be 50 MWWind resources: The average wind speeds in Lombok are low. In the South, the average wind speed
barely reaches 6 m/s and moving North to Rinjani, the average wind speeds are only 2 m/s. These low
wind speeds call for wind turbines designed for these conditions. The Vestas V150-4.2 MW is an example
of this. Its long blades (74 m) and large sweep area of 17,670 m2
make it possible to utilise energy in low
wind conditions. Other manufactures have similar low speed turbines – such as the Siemens Gamesa SG
4.5-155.
Location*: The sub-district of Jerowaru is chosen for the site analysed as this location has some of the
highest wind speeds in Lombok, and the land covers are mostly dry land agriculture, which are assumed to
be acquirable. The land covered is around 100 ha (~1 km2); however, most of the land can still be used for
agriculture purposes.
Utilisation: An analysis of the power curve from a V150-4.2 MW turbine and the distribution of wind
speeds at a chosen site, results in 3000 full load hours.
Source: Vestas; WindProspect; DEA; KPMG analysis.
Substation
Wind power
50 MW
Substation
Wind farm
site
Full load hours:
3000
Average wind speed at 150 m (m/s)
6 - 7 4 - 6 < 4
0
5
10
15
0 2 4 6 8 10 12 14 16
Distribution (%) of wind speeds
(m/s)
m/s
%12x4.2 MW
Capacity: Fluctuating power generation can in the current system be a challenge for
PLN. However, economy of scale calls for higher capacity. A capacity of 50 MW is
assessed to provide the best balance..
Solar plant site and
wind potential
Prefeasibility studies on Generation Technologies
Risk
IRR
Resource
potential
CAPEX
Capacity
OPEX
Expected
tariff
1
2
3
4
5
A
B
*The sites have been located using satellite photos, and comparing these with maps of land cover. It has not been examined if the land actually can be acquired or if
there exist unknown restrictions on the use of the land.
Power
(MW)
m/s
Low wind speed turbine power
curve
CAPEX breakdown (%)
Construction Equipment InfrastructureDevelopment
Total CAPEX of the 50 MW wind power plant is estimated at USD 75-100m – and OPEX to be USD 3-4m p.a.
35
Source: Vestas; WindProspect; DEA; FCN & E.ON Research Center; IRENA power cost; NREL; NEC technology catalogue; Jakarta Post;
KPMG analysis
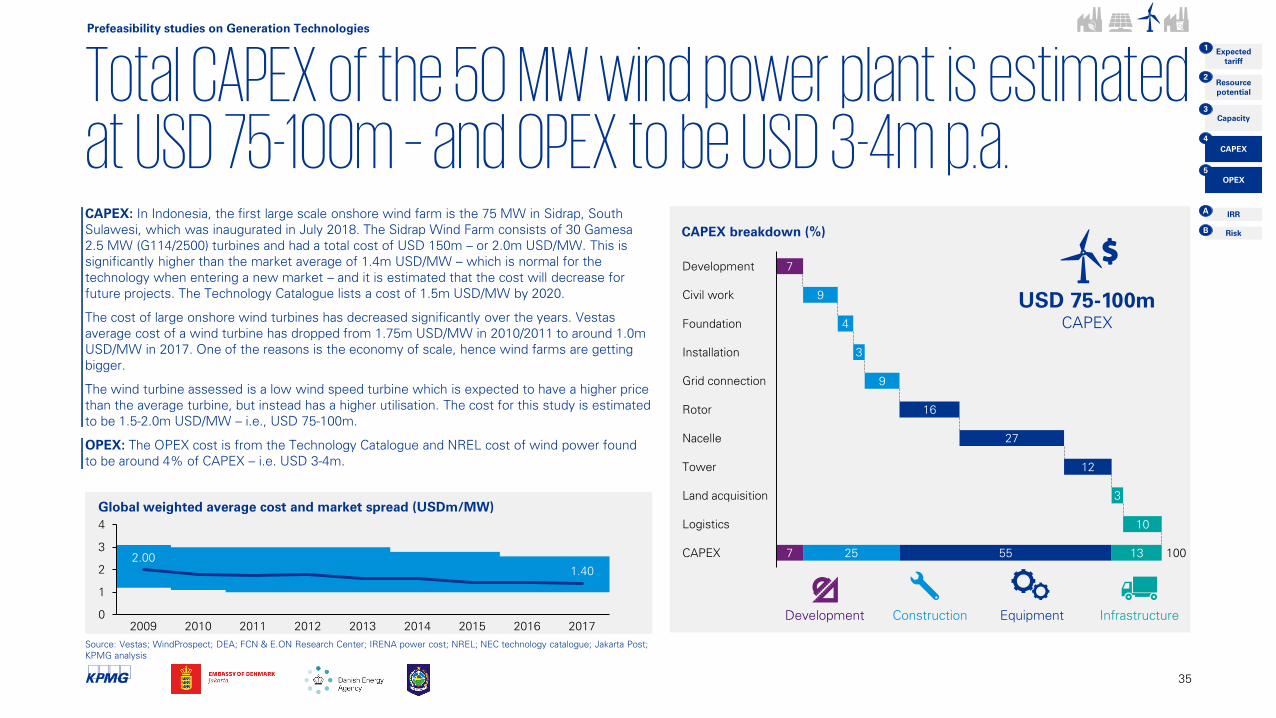
CAPEX: In Indonesia, the first large scale onshore wind farm is the 75 MW in Sidrap, South
Sulawesi, which was inaugurated in July 2018. The Sidrap Wind Farm consists of 30 Gamesa
2.5 MW (G114/2500) turbines and had a total cost of USD 150m – or 2.0m USD/MW. This is
significantly higher than the market average of 1.4m USD/MW – which is normal for the
technology when entering a new market – and it is estimated that the cost will decrease for
future projects. The Technology Catalogue lists a cost of 1.5m USD/MW by 2020.
The cost of large onshore wind turbines has decreased significantly over the years. Vestas
average cost of a wind turbine has dropped from 1.75m USD/MW in 2010/2011 to around 1.0m
USD/MW in 2017. One of the reasons is the economy of scale, hence wind farms are getting
bigger.
The wind turbine assessed is a low wind speed turbine which is expected to have a higher price
than the average turbine, but instead has a higher utilisation. The cost for this study is estimated
to be 1.5-2.0m USD/MW – i.e., USD 75-100m.
OPEX: The OPEX cost is from the Technology Catalogue and NREL cost of wind power found
to be around 4% of CAPEX – i.e. USD 3-4m.
7
9
9
16
12
10
25 55 13
Civil work
Development
4Foundation
Grid connection
3Installation
Rotor
27Nacelle
Tower
3Land acquisition
Logistics
7CAPEX 100
USD 75-100m
CAPEX
Global weighted average cost and market spread (USDm/MW)
0
1
2
3
4
20132012
2.00
2009 2010 2011 2014 2015 2016
1.40
2017
Prefeasibility studies on Generation Technologies
Risk
IRR
Resource
potential
CAPEX
Capacity
OPEX
Expected
tariff
1
2
3
4
5
A
B
Assumptions of the financial cash-flow model for the 50 MW wind power plant
36
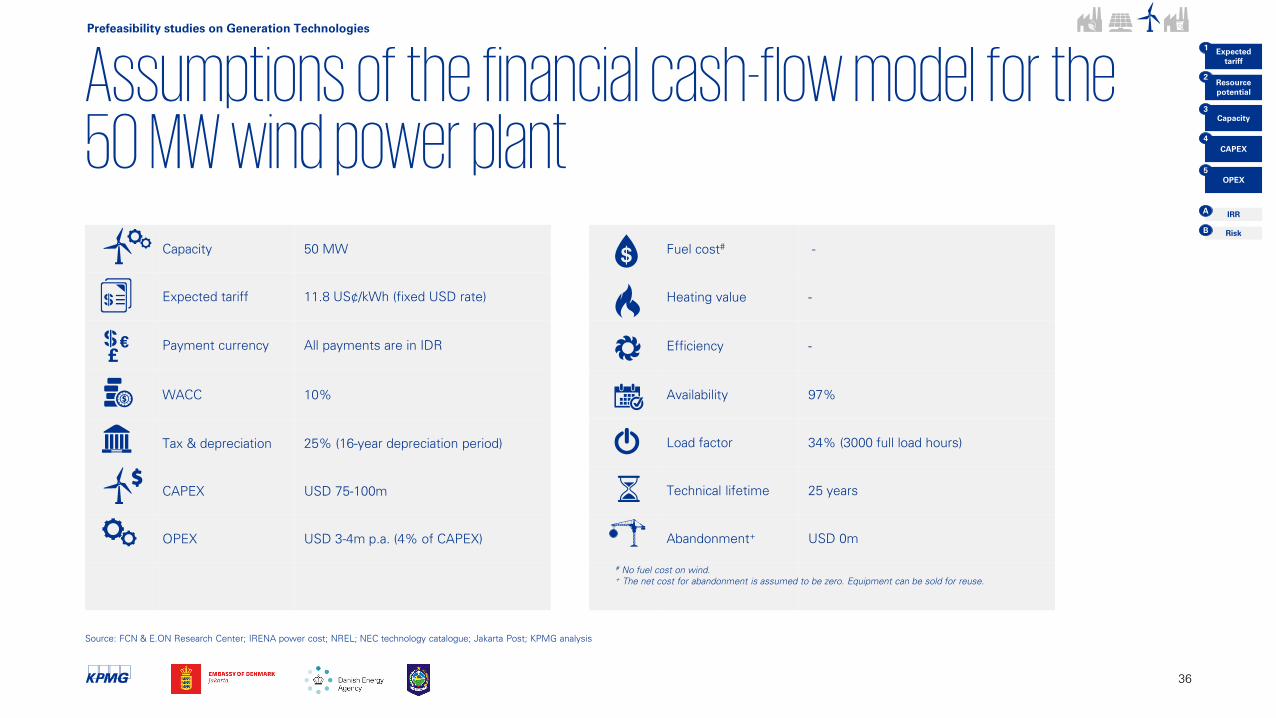
Capacity 50 MW
Expected tariff 11.8 US¢/kWh (fixed USD rate)
Payment currency All payments are in IDR
WACC 10%
Tax & depreciation 25% (16-year depreciation period)
CAPEX USD 75-100m
OPEX USD 3-4m p.a. (4% of CAPEX)
£
€
Fuel cost#
-
Heating value -
Efficiency -
Availability 97%
Load factor 34% (3000 full load hours)
Technical lifetime 25 years
Abandonment+
USD 0m
#No fuel cost on wind.
+The net cost for abandonment is assumed to be zero. Equipment can be sold for reuse.
Prefeasibility studies on Generation Technologies
Risk
IRR
Resource
potential
CAPEX
Capacity
OPEX
Expected
tariff
1
2
3
4
5
A
B
Source: FCN & E.ON Research Center; IRENA power cost; NREL; NEC technology catalogue; Jakarta Post; KPMG analysis
The wind power plant provides a project IRR of 7-16% - financial feasibility is most dependent on CAPEX
37
5
Development
115
Power tariff
55
Infrastructure
9
0
Construction
& Equipment
0
5
29
O&M Fuel
13
Tax Abandonment NPV
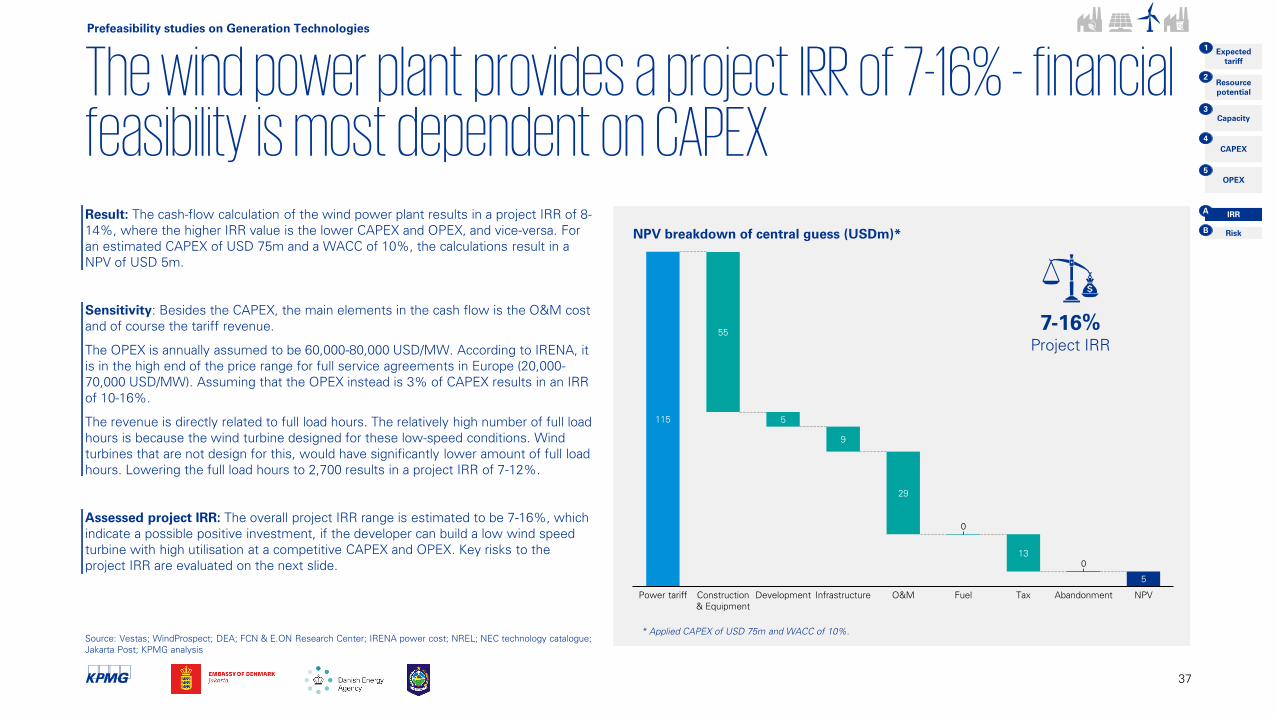
Result: The cash-flow calculation of the wind power plant results in a project IRR of 8-
14%, where the higher IRR value is the lower CAPEX and OPEX, and vice-versa. For
an estimated CAPEX of USD 75m and a WACC of 10%, the calculations result in a
NPV of USD 5m.
Sensitivity: Besides the CAPEX, the main elements in the cash flow is the O&M cost
and of course the tariff revenue.
The OPEX is annually assumed to be 60,000-80,000 USD/MW. According to IRENA, it
is in the high end of the price range for full service agreements in Europe (20,000-
70,000 USD/MW). Assuming that the OPEX instead is 3% of CAPEX results in an IRR
of 10-16%.
The revenue is directly related to full load hours. The relatively high number of full load
hours is because the wind turbine designed for these low-speed conditions. Wind
turbines that are not design for this, would have significantly lower amount of full load
hours. Lowering the full load hours to 2,700 results in a project IRR of 7-12%.
Assessed project IRR: The overall project IRR range is estimated to be 7-16%, which
indicate a possible positive investment, if the developer can build a low wind speed
turbine with high utilisation at a competitive CAPEX and OPEX. Key risks to the
project IRR are evaluated on the next slide.
Prefeasibility studies on Generation Technologies
Risk
IRR
Resource
potential
CAPEX
Capacity
OPEX
Expected
tariff
1
2
3
4
5
A
B
* Applied CAPEX of USD 75m and WACC of 10%.
7-16%
Project IRR
NPV breakdown of central guess (USDm)*
Source: Vestas; WindProspect; DEA; FCN & E.ON Research Center; IRENA power cost; NREL; NEC technology catalogue;
Jakarta Post; KPMG analysis
Managing the construction period to keep CAPEX low is essential for the project feasibility
38
Source: DESDM NTB; Presidential Reg. No. 44/ 2016, No. 35/ 2018, BKPM, Ministry of Industry Reg. No. 54 of 2012, and No. 5 of 2017, Baker McKenzie
Risk matrix
Likelihood
Cap
ital lo
ss
Hig
hLow
HighLow
Risk Risk description Action
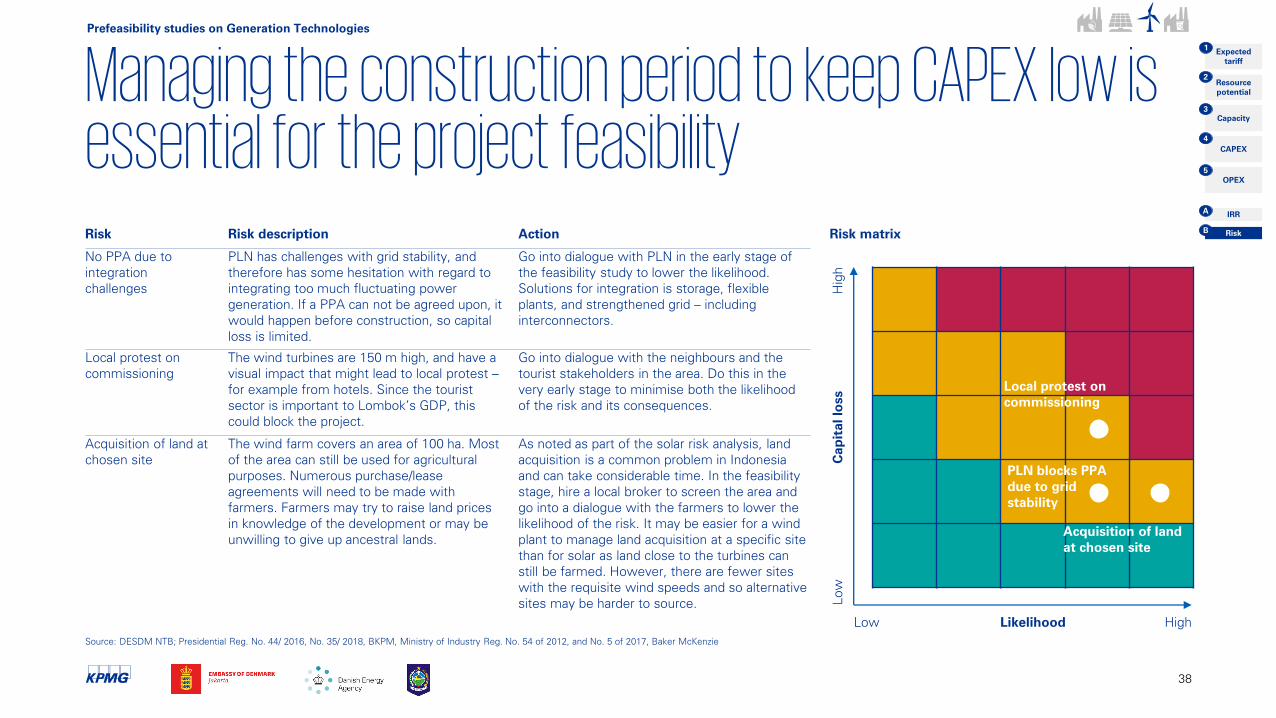
No PPA due to
integration
challenges
PLN has challenges with grid stability, and
therefore has some hesitation with regard to
integrating too much fluctuating power
generation. If a PPA can not be agreed upon, it
would happen before construction, so capital
loss is limited.
Go into dialogue with PLN in the early stage of
the feasibility study to lower the likelihood.
Solutions for integration is storage, flexible
plants, and strengthened grid – including
interconnectors.
Local protest on
commissioning
The wind turbines are 150 m high, and have a
visual impact that might lead to local protest –
for example from hotels. Since the tourist
sector is important to Lombok’s GDP, this
could block the project.
Go into dialogue with the neighbours and the
tourist stakeholders in the area. Do this in the
very early stage to minimise both the likelihood
of the risk and its consequences.
Acquisition of land at
chosen site
The wind farm covers an area of 100 ha. Most
of the area can still be used for agricultural
purposes. Numerous purchase/lease
agreements will need to be made with
farmers. Farmers may try to raise land prices
in knowledge of the development or may be
unwilling to give up ancestral lands.
As noted as part of the solar risk analysis, land
acquisition is a common problem in Indonesia
and can take considerable time. In the feasibility
stage, hire a local broker to screen the area and
go into a dialogue with the farmers to lower the
likelihood of the risk. It may be easier for a wind
plant to manage land acquisition at a specific site
than for solar as land close to the turbines can
still be farmed. However, there are fewer sites
with the requisite wind speeds and so alternative
sites may be harder to source.
PLN blocks PPA
due to grid
stability
Acquisition of land
at chosen site
Prefeasibility studies on Generation Technologies
Risk
IRR
Resource
potential
CAPEX
Capacity
OPEX
Expected
tariff
1
2
3
4
5
A
B
Local protest on
commissioning
Waste incineration Prefeasibility studies on green power generation
KPMG picture
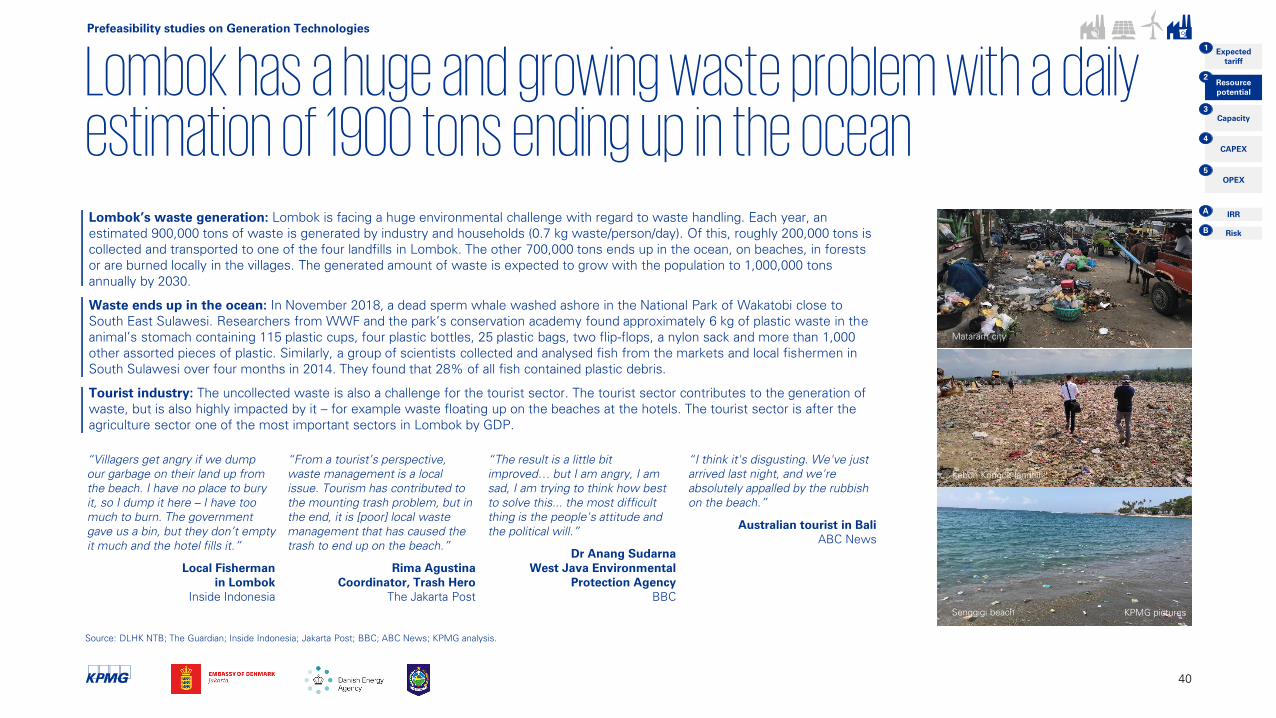
Lombok has a huge and growing waste problem with a daily estimation of 1900 tons ending up in the oceanLombok’s waste generation: Lombok is facing a huge environmental challenge with regard to waste handling. Each year, an
estimated 900,000 tons of waste is generated by industry and households (0.7 kg waste/person/day). Of this, roughly 200,000 tons is
collected and transported to one of the four landfills in Lombok. The other 700,000 tons ends up in the ocean, on beaches, in forests
or are burned locally in the villages. The generated amount of waste is expected to grow with the population to 1,000,000 tons
annually by 2030.
Waste ends up in the ocean: In November 2018, a dead sperm whale washed ashore in the National Park of Wakatobi close to
South East Sulawesi. Researchers from WWF and the park’s conservation academy found approximately 6 kg of plastic waste in the
animal’s stomach containing 115 plastic cups, four plastic bottles, 25 plastic bags, two flip-flops, a nylon sack and more than 1,000
other assorted pieces of plastic. Similarly, a group of scientists collected and analysed fish from the markets and local fishermen in
South Sulawesi over four months in 2014. They found that 28% of all fish contained plastic debris.
Tourist industry: The uncollected waste is also a challenge for the tourist sector. The tourist sector contributes to the generation of
waste, but is also highly impacted by it – for example waste floating up on the beaches at the hotels. The tourist sector is after the
agriculture sector one of the most important sectors in Lombok by GDP.
Mataram city
Senggigi beach
Source: DLHK NTB; The Guardian; Inside Indonesia; Jakarta Post; BBC; ABC News; KPMG analysis.
Kebon Kongok landfill
“From a tourist’s perspective,
waste management is a local
issue. Tourism has contributed to
the mounting trash problem, but in
the end, it is [poor] local waste
management that has caused the
trash to end up on the beach.”
Rima Agustina
Coordinator, Trash Hero
The Jakarta Post
“Villagers get angry if we dump
our garbage on their land up from
the beach. I have no place to bury
it, so I dump it here – I have too
much to burn. The government
gave us a bin, but they don’t empty
it much and the hotel fills it.”
Local Fisherman
in Lombok
Inside Indonesia
“The result is a little bit
improved… but I am angry, I am
sad, I am trying to think how best
to solve this... the most difficult
thing is the people's attitude and
the political will.”
Dr Anang Sudarna
West Java Environmental
Protection Agency
BBC
“I think it's disgusting. We've just
arrived last night, and we're
absolutely appalled by the rubbish
on the beach.”
Australian tourist in Bali
ABC News
40
KPMG pictures
Prefeasibility studies on Generation Technologies
Risk
IRR
Resource
potential
CAPEX
Capacity
OPEX
Expected
tariff
1
2
3
4
5
A
B
The urgent need for waste handling in Lombok is assessed to result in a willingness-to-pay for waste treatment
41
Google maps
Mataram
Kebon Kongok landfill
KPMG picture
West
Lombok
Central
Lombok
East
Lombok
North
Lombok
Kebon Kongok
landfill
120,000 tons
Pengangat landfill
20,000 tons
Jugil landfill
8,000 tons
Ijo Balit landfill
8,000 tons
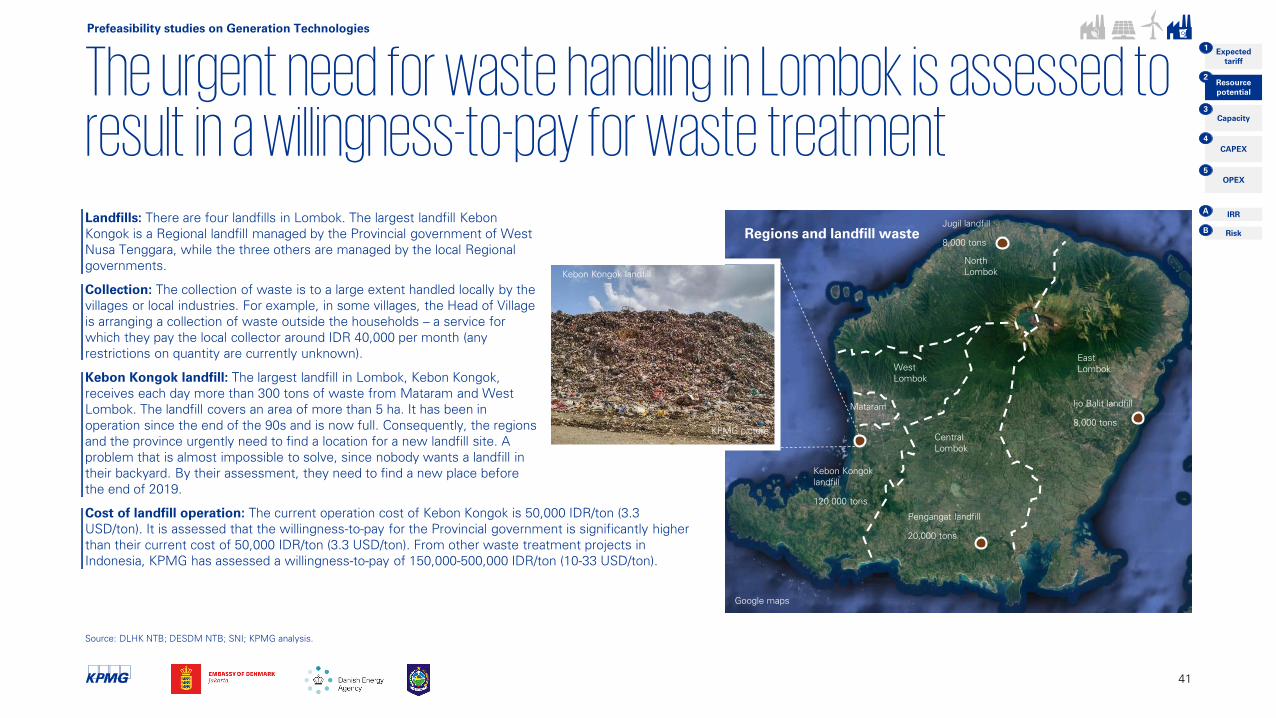
Landfills: There are four landfills in Lombok. The largest landfill Kebon
Kongok is a Regional landfill managed by the Provincial government of West
Nusa Tenggara, while the three others are managed by the local Regional
governments.
Collection: The collection of waste is to a large extent handled locally by the
villages or local industries. For example, in some villages, the Head of Village
is arranging a collection of waste outside the households – a service for
which they pay the local collector around IDR 40,000 per month (any
restrictions on quantity are currently unknown).
Kebon Kongok landfill: The largest landfill in Lombok, Kebon Kongok,
receives each day more than 300 tons of waste from Mataram and West
Lombok. The landfill covers an area of more than 5 ha. It has been in
operation since the end of the 90s and is now full. Consequently, the regions
and the province urgently need to find a location for a new landfill site. A
problem that is almost impossible to solve, since nobody wants a landfill in
their backyard. By their assessment, they need to find a new place before
the end of 2019.
Cost of landfill operation: The current operation cost of Kebon Kongok is 50,000 IDR/ton (3.3
USD/ton). It is assessed that the willingness-to-pay for the Provincial government is significantly higher
than their current cost of 50,000 IDR/ton (3.3 USD/ton). From other waste treatment projects in
Indonesia, KPMG has assessed a willingness-to-pay of 150,000-500,000 IDR/ton (10-33 USD/ton).
Regions and landfill waste
Prefeasibility studies on Generation Technologies
Risk
IRR
Resource
potential
CAPEX
Capacity
OPEX
Expected
tariff
1
2
3
4
5
A
B
Source: DLHK NTB; DESDM NTB; SNI; KPMG analysis.
Google maps
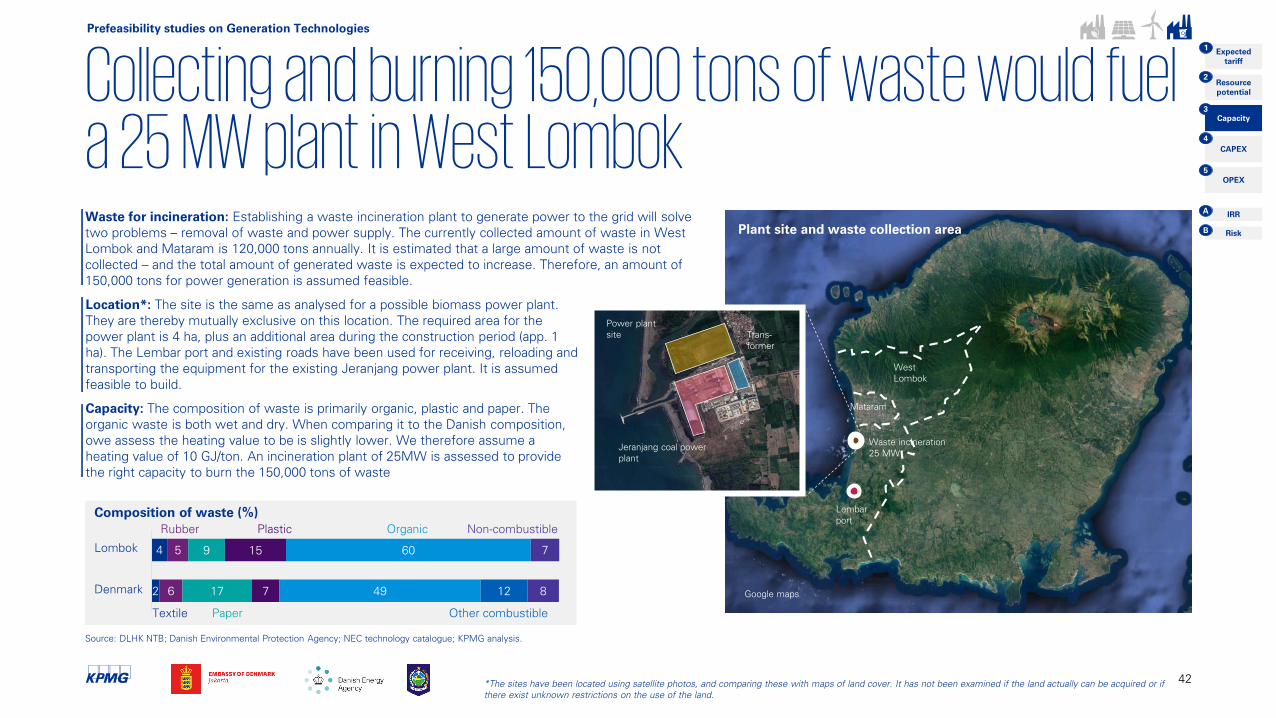
Collecting and burning 150,000 tons of waste would fuel a 25 MW plant in West LombokWaste for incineration: Establishing a waste incineration plant to generate power to the grid will solve
two problems – removal of waste and power supply. The currently collected amount of waste in West
Lombok and Mataram is 120,000 tons annually. It is estimated that a large amount of waste is not
collected – and the total amount of generated waste is expected to increase. Therefore, an amount of
150,000 tons for power generation is assumed feasible.
Waste incineration
25 MW
Jeranjang coal power
plant
Power plant
site Trans-
former
2 6
9
17
15
7
60
49 12 8
754
Composition of waste (%)
Organic Non-combustiblePlastic
Paper
Rubber
Textile Other combustible
Lombok
Denmark
Location*: The site is the same as analysed for a possible biomass power plant.
They are thereby mutually exclusive on this location. The required area for the
power plant is 4 ha, plus an additional area during the construction period (app. 1
ha). The Lembar port and existing roads have been used for receiving, reloading and
transporting the equipment for the existing Jeranjang power plant. It is assumed
feasible to build.
Capacity: The composition of waste is primarily organic, plastic and paper. The
organic waste is both wet and dry. When comparing it to the Danish composition,
owe assess the heating value to be is slightly lower. We therefore assume a
heating value of 10 GJ/ton. An incineration plant of 25MW is assessed to provide
the right capacity to burn the 150,000 tons of waste
42
Mataram
West
Lombok
Lembar
port
Plant site and waste collection area
Prefeasibility studies on Generation Technologies
Risk
IRR
Resource
potential
CAPEX
Capacity
OPEX
Expected
tariff
1
2
3
4
5
A
B
Source: DLHK NTB; Danish Environmental Protection Agency; NEC technology catalogue; KPMG analysis.
*The sites have been located using satellite photos, and comparing these with maps of land cover. It has not been examined if the land actually can be acquired or if
there exist unknown restrictions on the use of the land.
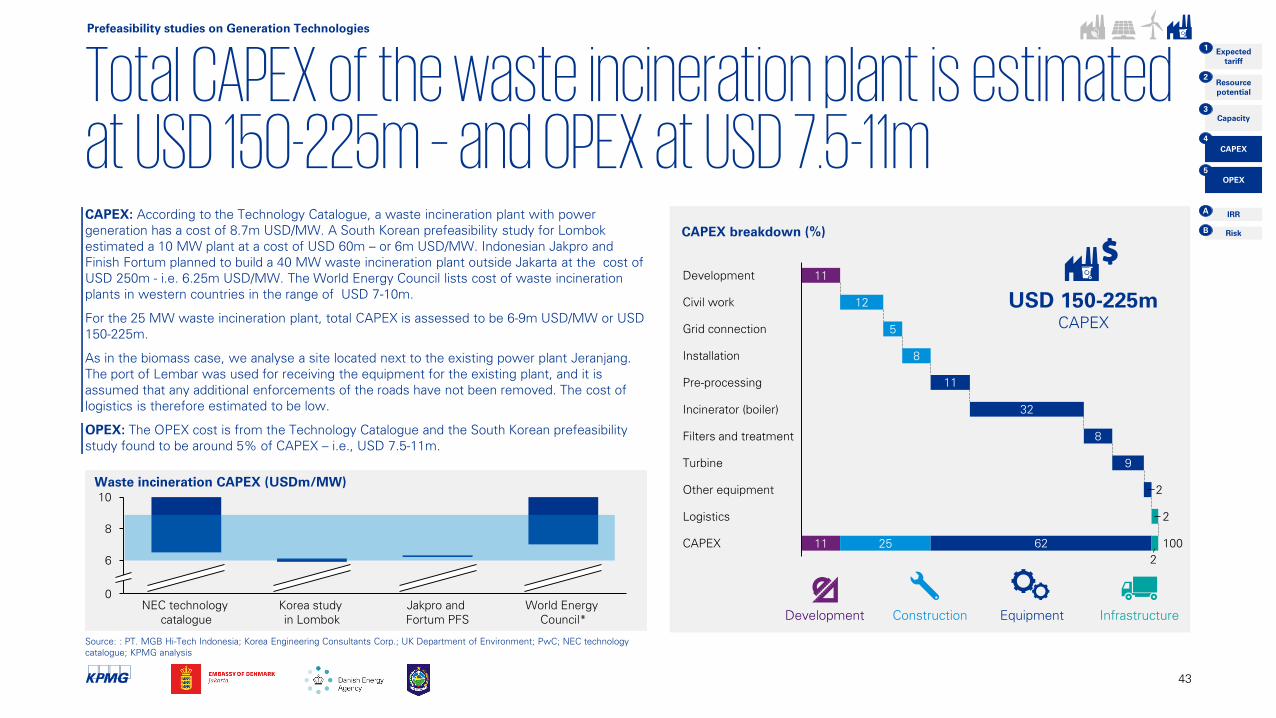
CAPEX breakdown (%)
Construction Equipment InfrastructureDevelopment
Total CAPEX of the waste incineration plant is estimated at USD 150-225m – and OPEX at USD 7.5-11m
43
Source: : PT. MGB Hi-Tech Indonesia; Korea Engineering Consultants Corp.; UK Department of Environment; PwC; NEC technology
catalogue; KPMG analysis
CAPEX: According to the Technology Catalogue, a waste incineration plant with power
generation has a cost of 8.7m USD/MW. A South Korean prefeasibility study for Lombok
estimated a 10 MW plant at a cost of USD 60m – or 6m USD/MW. Indonesian Jakpro and
Finish Fortum planned to build a 40 MW waste incineration plant outside Jakarta at the cost of
USD 250m - i.e. 6.25m USD/MW. The World Energy Council lists cost of waste incineration
plants in western countries in the range of USD 7-10m.
For the 25 MW waste incineration plant, total CAPEX is assessed to be 6-9m USD/MW or USD
150-225m.
As in the biomass case, we analyse a site located next to the existing power plant Jeranjang.
The port of Lembar was used for receiving the equipment for the existing plant, and it is
assumed that any additional enforcements of the roads have not been removed. The cost of
logistics is therefore estimated to be low.
OPEX: The OPEX cost is from the Technology Catalogue and the South Korean prefeasibility
study found to be around 5% of CAPEX – i.e., USD 7.5-11m.
11
11
12
5
8
9
25
Turbine
2Other equipment
Development
2Logistics
Incinerator (boiler)
2
62CAPEX
Civil work
Grid connection
Pre-processing 11
Installation
32
8Filters and treatment
100
USD 150-225m
CAPEX
Prefeasibility studies on Generation Technologies
Risk
IRR
Resource
potential
CAPEX
Capacity
OPEX
Expected
tariff
1
2
3
4
5
A
B
0
6
8
10
NEC technology
catalogue
Jakpro and
Fortum PFS
Korea study
in Lombok
World Energy
Council*
Waste incineration CAPEX (USDm/MW)
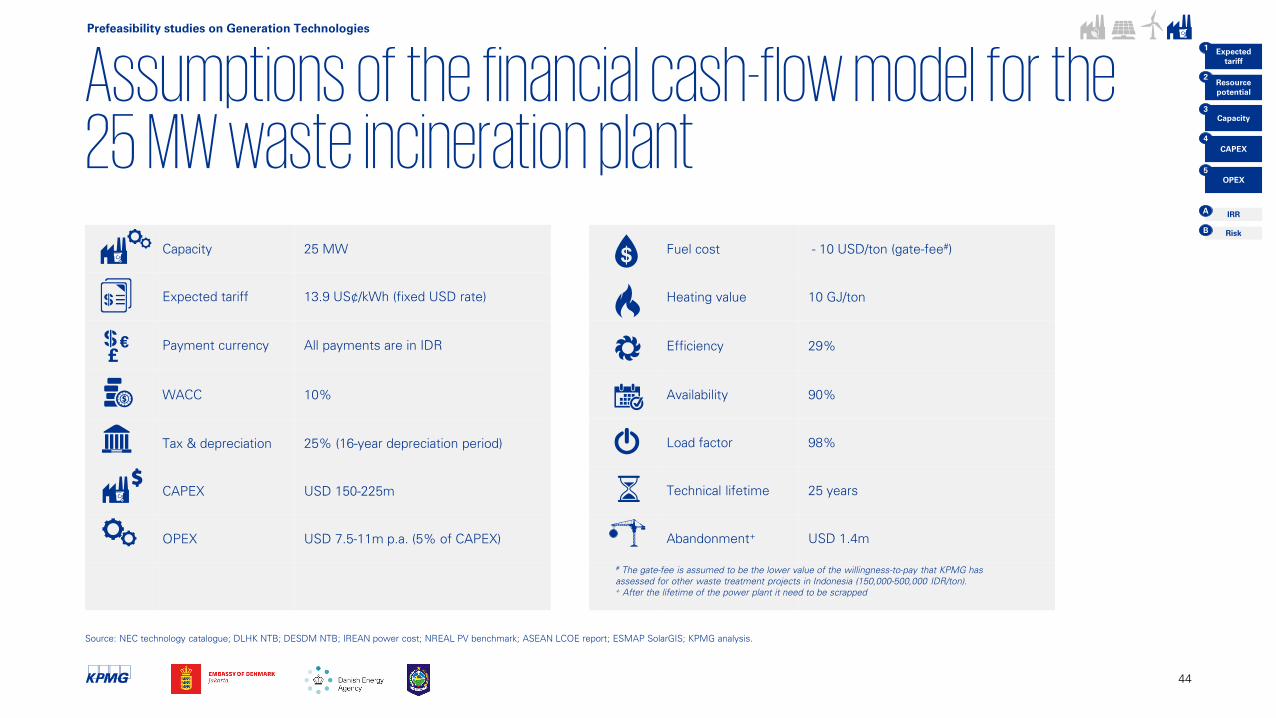
Assumptions of the financial cash-flow model for the 25 MW waste incineration plant
44
Capacity 25 MW
Expected tariff 13.9 US¢/kWh (fixed USD rate)
Payment currency All payments are in IDR
WACC 10%
Tax & depreciation 25% (16-year depreciation period)
CAPEX USD 150-225m
OPEX USD 7.5-11m p.a. (5% of CAPEX)
£
€
Fuel cost - 10 USD/ton (gate-fee#)
Heating value 10 GJ/ton
Efficiency 29%
Availability 90%
Load factor 98%
Technical lifetime 25 years
Abandonment+
USD 1.4m
#The gate-fee is assumed to be the lower value of the willingness-to-pay that KPMG has
assessed for other waste treatment projects in Indonesia (150,000-500,000 IDR/ton).
+After the lifetime of the power plant it need to be scrapped
Prefeasibility studies on Generation Technologies
Risk
IRR
Resource
potential
CAPEX
Capacity
OPEX
Expected
tariff
1
2
3
4
5
A
B
Source: NEC technology catalogue; DLHK NTB; DESDM NTB; IREAN power cost; NREAL PV benchmark; ASEAN LCOE report; ESMAP SolarGIS; KPMG analysis.
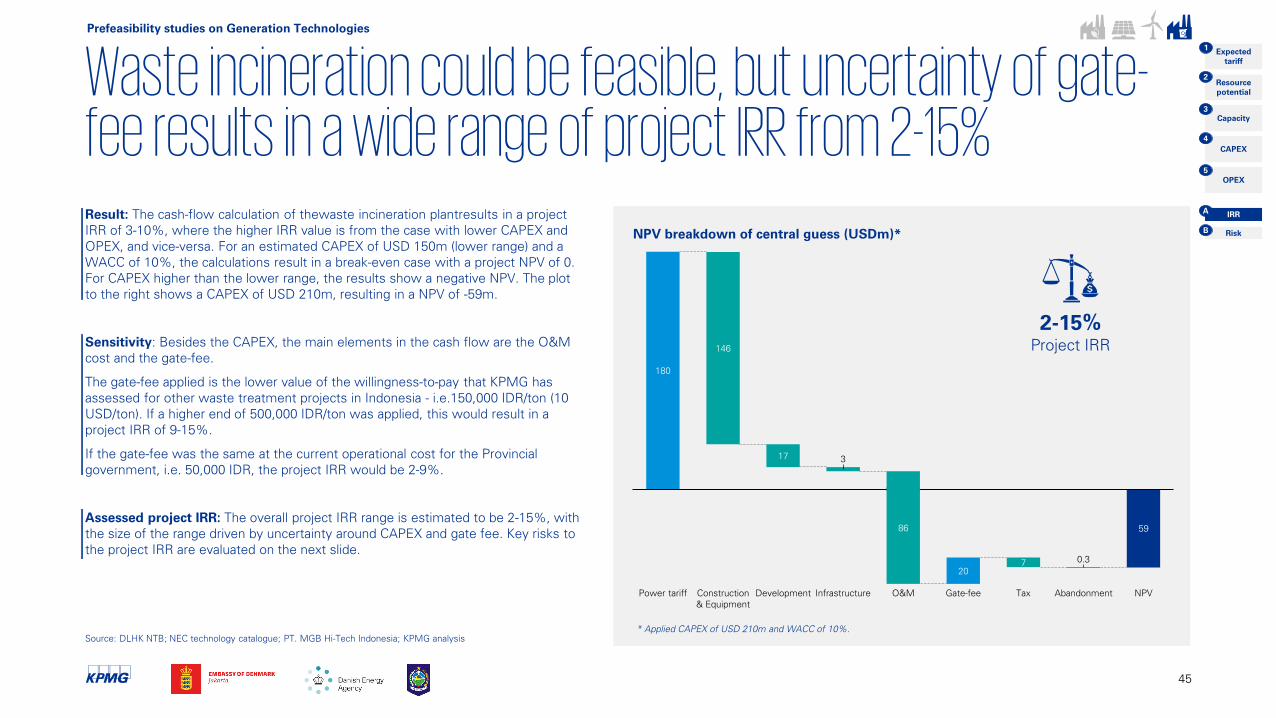
Waste incineration could be feasible, but uncertainty of gate-fee results in a wide range of project IRR from 2-15%Result: The cash-flow calculation of thewaste incineration plantresults in a project
IRR of 3-10%, where the higher IRR value is from the case with lower CAPEX and
OPEX, and vice-versa. For an estimated CAPEX of USD 150m (lower range) and a
WACC of 10%, the calculations result in a break-even case with a project NPV of 0.
For CAPEX higher than the lower range, the results show a negative NPV. The plot
to the right shows a CAPEX of USD 210m, resulting in a NPV of -59m.
Sensitivity: Besides the CAPEX, the main elements in the cash flow are the O&M
cost and the gate-fee.
The gate-fee applied is the lower value of the willingness-to-pay that KPMG has
assessed for other waste treatment projects in Indonesia - i.e.150,000 IDR/ton (10
USD/ton). If a higher end of 500,000 IDR/ton was applied, this would result in a
project IRR of 9-15%.
If the gate-fee was the same at the current operational cost for the Provincial
government, i.e. 50,000 IDR, the project IRR would be 2-9%.
Assessed project IRR: The overall project IRR range is estimated to be 2-15%, with
the size of the range driven by uncertainty around CAPEX and gate fee. Key risks to
the project IRR are evaluated on the next slide.
45
Prefeasibility studies on Generation Technologies
Risk
IRR
Resource
potential
CAPEX
Capacity
OPEX
Expected
tariff
1
2
3
4
5
A
B
17
InfrastructureDevelopment
180
Power tariff
146
Construction
& Equipment
3
Tax
86
Gate-feeO&M
0.3
20
7
Abandonment
59
NPV
* Applied CAPEX of USD 210m and WACC of 10%.
2-15%
Project IRR
Source: DLHK NTB; NEC technology catalogue; PT. MGB Hi-Tech Indonesia; KPMG analysis
NPV breakdown of central guess (USDm)*
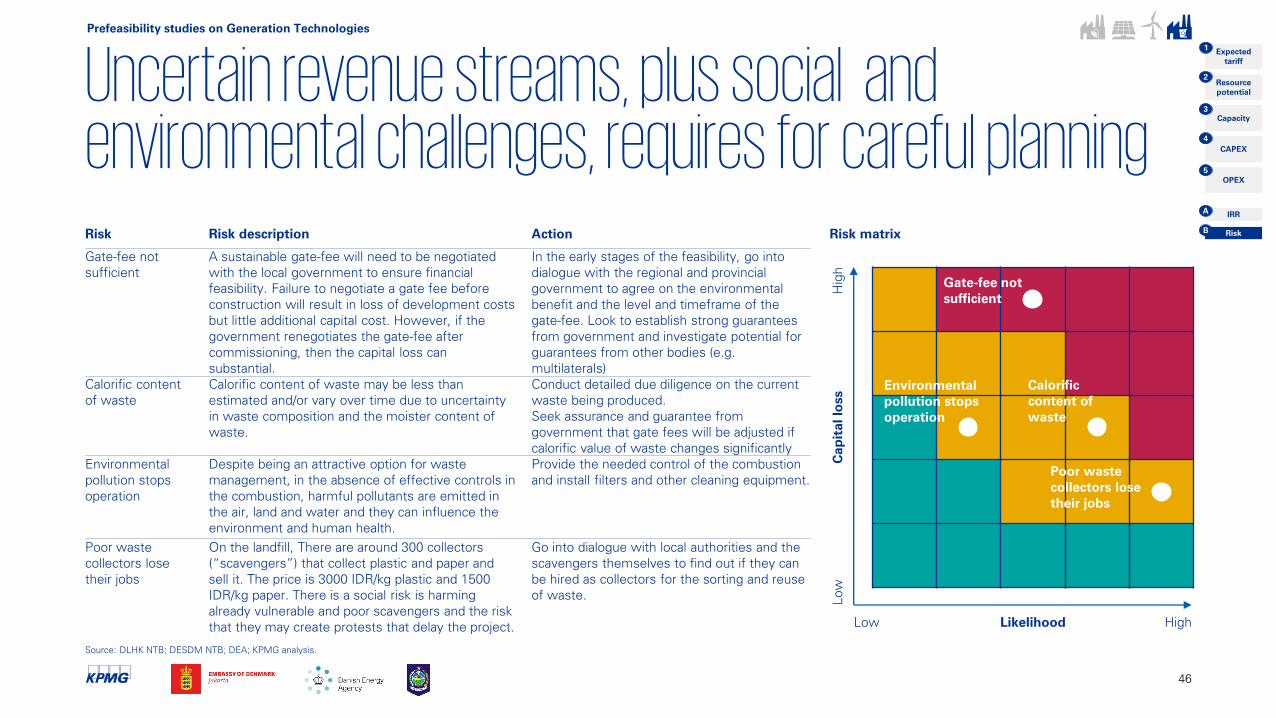
Uncertain revenue streams, plus social and environmental challenges, requires for careful planning
46
Risk matrix
Environmental
pollution stops
operation
Risk Risk description Action
Gate-fee not
sufficient
A sustainable gate-fee will need to be negotiated
with the local government to ensure financial
feasibility. Failure to negotiate a gate fee before
construction will result in loss of development costs
but little additional capital cost. However, if the
government renegotiates the gate-fee after
commissioning, then the capital loss can
substantial.
In the early stages of the feasibility, go into
dialogue with the regional and provincial
government to agree on the environmental
benefit and the level and timeframe of the
gate-fee. Look to establish strong guarantees
from government and investigate potential for
guarantees from other bodies (e.g.
multilaterals)
Calorific content
of waste
Calorific content of waste may be less than
estimated and/or vary over time due to uncertainty
in waste composition and the moister content of
waste.
Conduct detailed due diligence on the current
waste being produced.
Seek assurance and guarantee from
government that gate fees will be adjusted if
calorific value of waste changes significantly
Environmental
pollution stops
operation
Despite being an attractive option for waste
management, in the absence of effective controls in
the combustion, harmful pollutants are emitted in
the air, land and water and they can influence the
environment and human health.
Provide the needed control of the combustion
and install filters and other cleaning equipment.
Poor waste
collectors lose
their jobs
On the landfill, There are around 300 collectors
(“scavengers”) that collect plastic and paper and
sell it. The price is 3000 IDR/kg plastic and 1500
IDR/kg paper. There is a social risk is harming
already vulnerable and poor scavengers and the risk
that they may create protests that delay the project.
Go into dialogue with local authorities and the
scavengers themselves to find out if they can
be hired as collectors for the sorting and reuse
of waste.
Likelihood
Cap
ital lo
ss
Hig
hLow
HighLow
Poor waste
collectors lose
their jobs
Gate-fee not
sufficient
Prefeasibility studies on Generation Technologies
Risk
IRR
Resource
potential
CAPEX
Capacity
OPEX
Expected
tariff
1
2
3
4
5
A
B
Source: DLHK NTB; DESDM NTB; DEA; KPMG analysis.
Calorific
content of
waste
Integrating renewables –Interconnectors and storage solutions
47
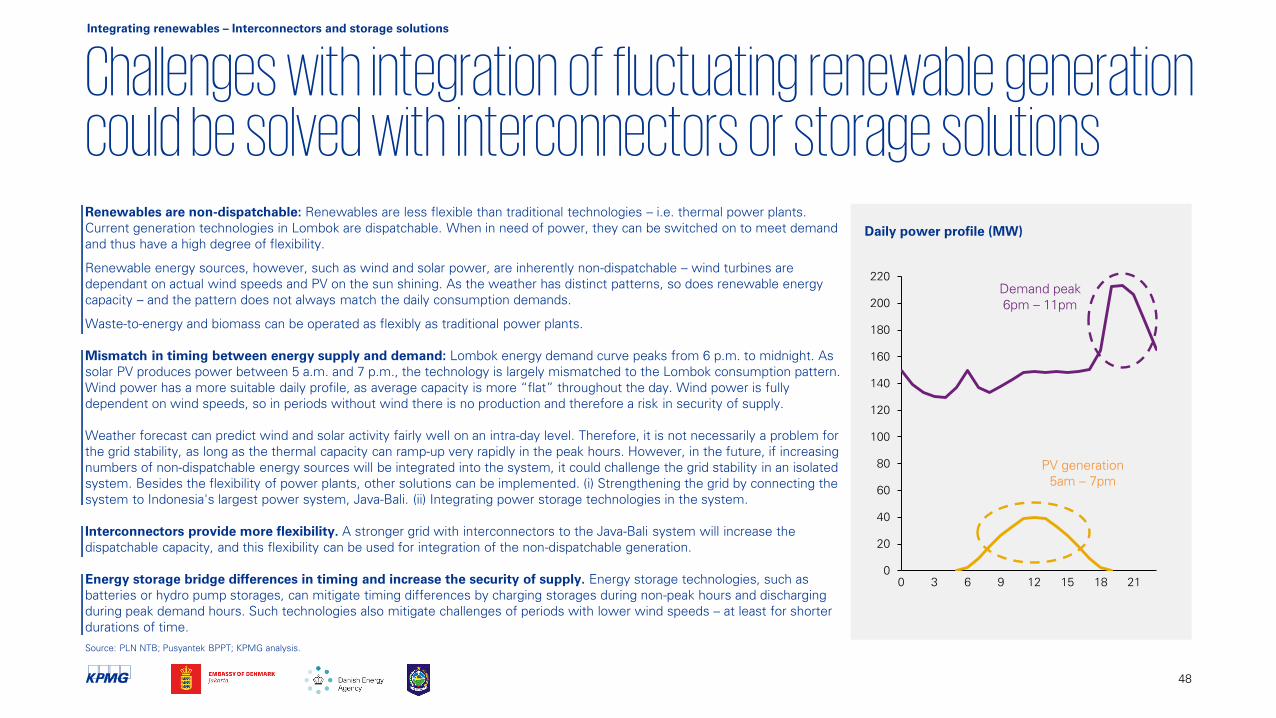
Challenges with integration of fluctuating renewable generation could be solved with interconnectors or storage solutions
48
Renewables are non-dispatchable: Renewables are less flexible than traditional technologies – i.e. thermal power plants.
Current generation technologies in Lombok are dispatchable. When in need of power, they can be switched on to meet demand
and thus have a high degree of flexibility.
Renewable energy sources, however, such as wind and solar power, are inherently non-dispatchable – wind turbines are
dependant on actual wind speeds and PV on the sun shining. As the weather has distinct patterns, so does renewable energy
capacity – and the pattern does not always match the daily consumption demands.
Waste-to-energy and biomass can be operated as flexibly as traditional power plants.
Mismatch in timing between energy supply and demand: Lombok energy demand curve peaks from 6 p.m. to midnight. As
solar PV produces power between 5 a.m. and 7 p.m., the technology is largely mismatched to the Lombok consumption pattern.
Wind power has a more suitable daily profile, as average capacity is more “flat” throughout the day. Wind power is fully
dependent on wind speeds, so in periods without wind there is no production and therefore a risk in security of supply.
Weather forecast can predict wind and solar activity fairly well on an intra-day level. Therefore, it is not necessarily a problem for
the grid stability, as long as the thermal capacity can ramp-up very rapidly in the peak hours. However, in the future, if increasing
numbers of non-dispatchable energy sources will be integrated into the system, it could challenge the grid stability in an isolated
system. Besides the flexibility of power plants, other solutions can be implemented. (i) Strengthening the grid by connecting the
system to Indonesia's largest power system, Java-Bali. (ii) Integrating power storage technologies in the system.
Interconnectors provide more flexibility. A stronger grid with interconnectors to the Java-Bali system will increase the
dispatchable capacity, and this flexibility can be used for integration of the non-dispatchable generation.
Energy storage bridge differences in timing and increase the security of supply. Energy storage technologies, such as
batteries or hydro pump storages, can mitigate timing differences by charging storages during non-peak hours and discharging
during peak demand hours. Such technologies also mitigate challenges of periods with lower wind speeds – at least for shorter
durations of time.
Daily power profile (MW)
0
20
40
60
80
100
120
140
160
180
200
220
6 150 3 9 1812 21
Integrating renewables – Interconnectors and storage solutions
Demand peak
6pm – 11pm
PV generation
5am – 7pm
Source: PLN NTB; Pusyantek BPPT; KPMG analysis.
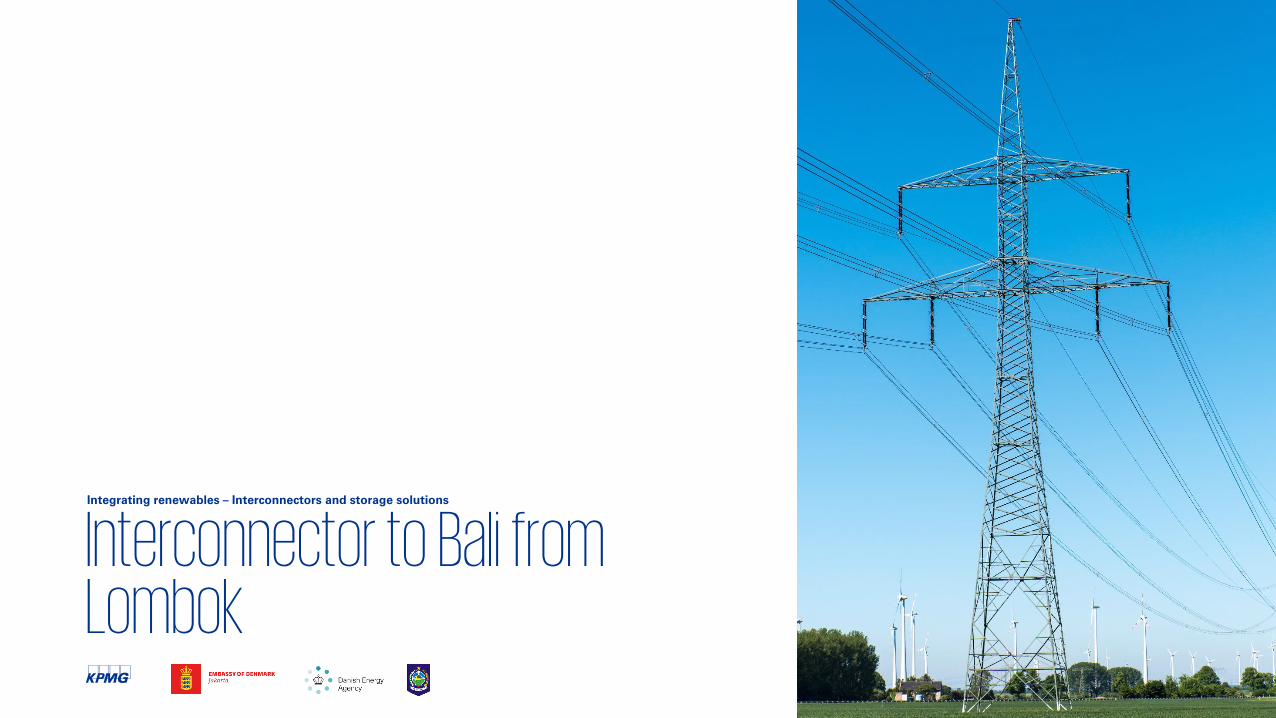
Interconnector to Bali from Lombok
49
Integrating renewables – Interconnectors and storage solutions
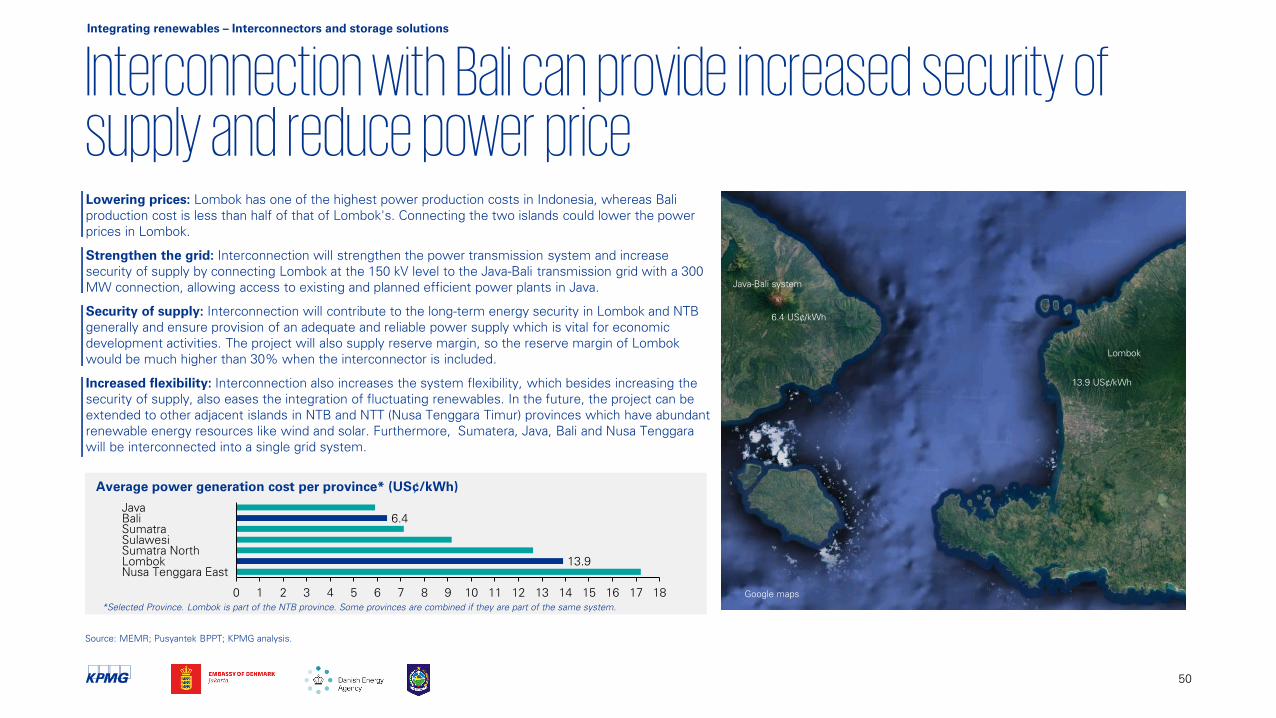
Google maps
Interconnection with Bali can provide increased security of supply and reduce power priceLowering prices: Lombok has one of the highest power production costs in Indonesia, whereas Bali
production cost is less than half of that of Lombok's. Connecting the two islands could lower the power
prices in Lombok.
Strengthen the grid: Interconnection will strengthen the power transmission system and increase
security of supply by connecting Lombok at the 150 kV level to the Java-Bali transmission grid with a 300
MW connection, allowing access to existing and planned efficient power plants in Java.
Security of supply: Interconnection will contribute to the long-term energy security in Lombok and NTB
generally and ensure provision of an adequate and reliable power supply which is vital for economic
development activities. The project will also supply reserve margin, so the reserve margin of Lombok
would be much higher than 30% when the interconnector is included.
Increased flexibility: Interconnection also increases the system flexibility, which besides increasing the
security of supply, also eases the integration of fluctuating renewables. In the future, the project can be
extended to other adjacent islands in NTB and NTT (Nusa Tenggara Timur) provinces which have abundant
renewable energy resources like wind and solar. Furthermore, Sumatera, Java, Bali and Nusa Tenggara
will be interconnected into a single grid system.
The power price on Bali and Lombok
Lombok
Java-Bali system
6.4 US¢/kWh
13.9 US¢/kWh
Source: MEMR; Pusyantek BPPT; KPMG analysis.
Average power generation cost per province* (US¢/kWh)
1 90 652 3 84 7 10 11 12 13 14 15 16 17 18
Bali
Lombok
Java
Sumatra North
Sumatra
Sulawesi
Nusa Tenggara East
6.4
13.9
Integrating renewables – Interconnectors and storage solutions
*Selected Province. Lombok is part of the NTB province. Some provinces are combined if they are part of the same system.
50
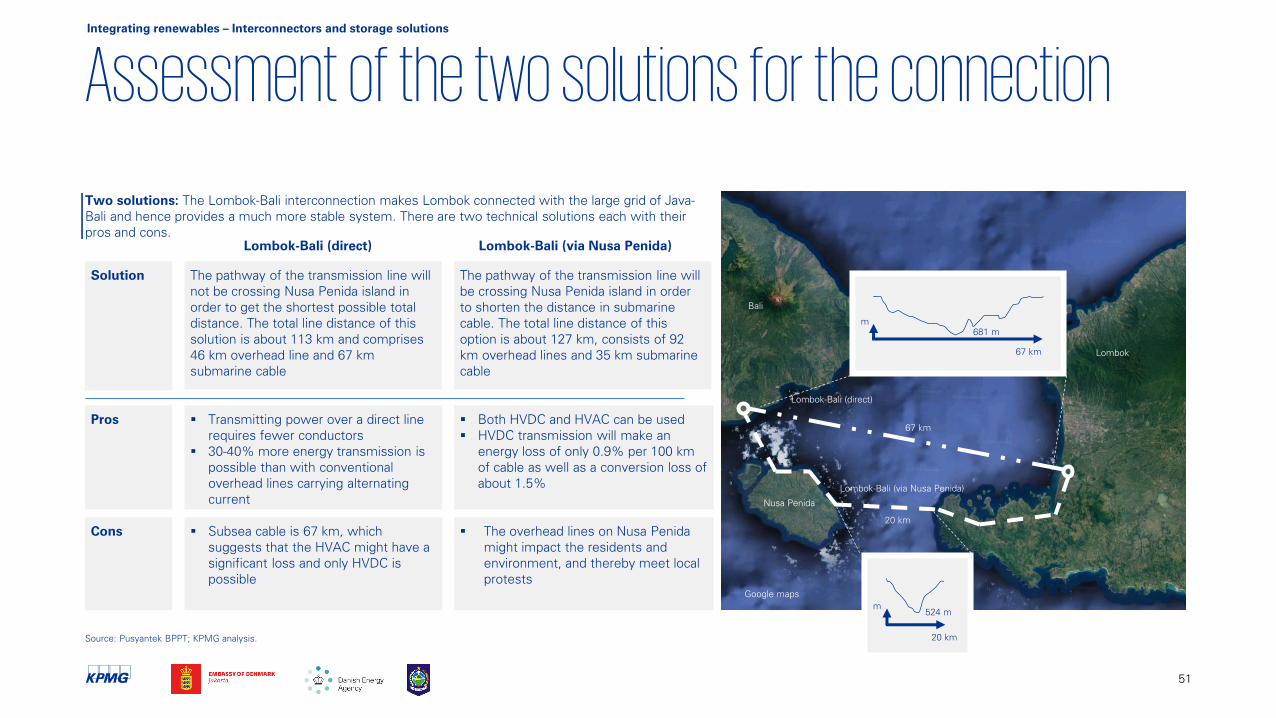
Google maps
Assessment of the two solutions for the connectionThe two alternative connections
Source: Pusyantek BPPT; KPMG analysis.
Lombok
Bali
Lombok-Bali (direct)
Lombok-Bali (via Nusa Penida)
Nusa Penida
Two solutions: The Lombok-Bali interconnection makes Lombok connected with the large grid of Java-
Bali and hence provides a much more stable system. There are two technical solutions each with their
pros and cons.
Lombok-Bali (via Nusa Penida) Lombok-Bali (direct)
The pathway of the transmission line will
not be crossing Nusa Penida island in
order to get the shortest possible total
distance. The total line distance of this
solution is about 113 km and comprises
46 km overhead line and 67 km
submarine cable
The pathway of the transmission line will
be crossing Nusa Penida island in order
to shorten the distance in submarine
cable. The total line distance of this
option is about 127 km, consists of 92
km overhead lines and 35 km submarine
cable
Solution
Pros Transmitting power over a direct line
requires fewer conductors
30-40% more energy transmission is
possible than with conventional
overhead lines carrying alternating
current
Both HVDC and HVAC can be used
HVDC transmission will make an
energy loss of only 0.9% per 100 km
of cable as well as a conversion loss of
about 1.5%
Cons Subsea cable is 67 km, which
suggests that the HVAC might have a
significant loss and only HVDC is
possible
The overhead lines on Nusa Penida
might impact the residents and
environment, and thereby meet local
protests
Integrating renewables – Interconnectors and storage solutions
681 m
67 km
m
524 m
20 km
m
67 km
20 km
51
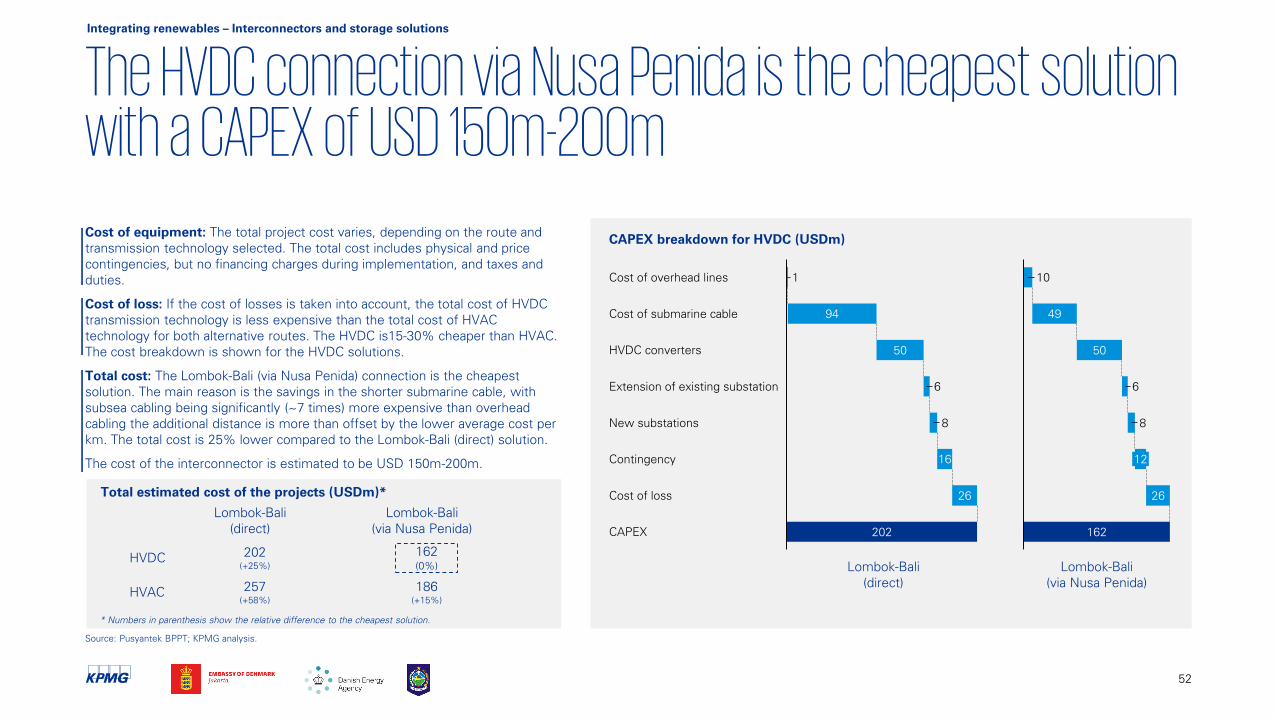
The HVDC connection via Nusa Penida is the cheapest solution with a CAPEX of USD 150m-200mCost of equipment: The total project cost varies, depending on the route and
transmission technology selected. The total cost includes physical and price
contingencies, but no financing charges during implementation, and taxes and
duties.
Cost of loss: If the cost of losses is taken into account, the total cost of HVDC
transmission technology is less expensive than the total cost of HVAC
technology for both alternative routes. The HVDC is15-30% cheaper than HVAC.
The cost breakdown is shown for the HVDC solutions.
Total cost: The Lombok-Bali (via Nusa Penida) connection is the cheapest
solution. The main reason is the savings in the shorter submarine cable, with
subsea cabling being significantly (~7 times) more expensive than overhead
cabling the additional distance is more than offset by the lower average cost per
km. The total cost is 25% lower compared to the Lombok-Bali (direct) solution.
The cost of the interconnector is estimated to be USD 150m-200m.
52
Source: Pusyantek BPPT; KPMG analysis.
Lombok-Bali
(direct)
202
50
8
26
Cost of overhead lines
Cost of submarine cable
1
94
HVDC converters
6Extension of existing substation
Contingency
New substations
16
CAPEX
Cost of loss
162
50
8
26
49
10
6
12
CAPEX breakdown for HVDC (USDm)
Lombok-Bali
(via Nusa Penida)
Integrating renewables – Interconnectors and storage solutions
Lombok-Bali
(via Nusa Penida)
Lombok-Bali
(direct)
HVDC
HVAC
Total estimated cost of the projects (USDm)*
257
(+58%)
202
(+25%)
162
(0%)
186
(+15%)
* Numbers in parenthesis show the relative difference to the cheapest solution.
Storage solutions – Pumped storage and batteries
53
Integrating renewables – Interconnectors and storage solutions
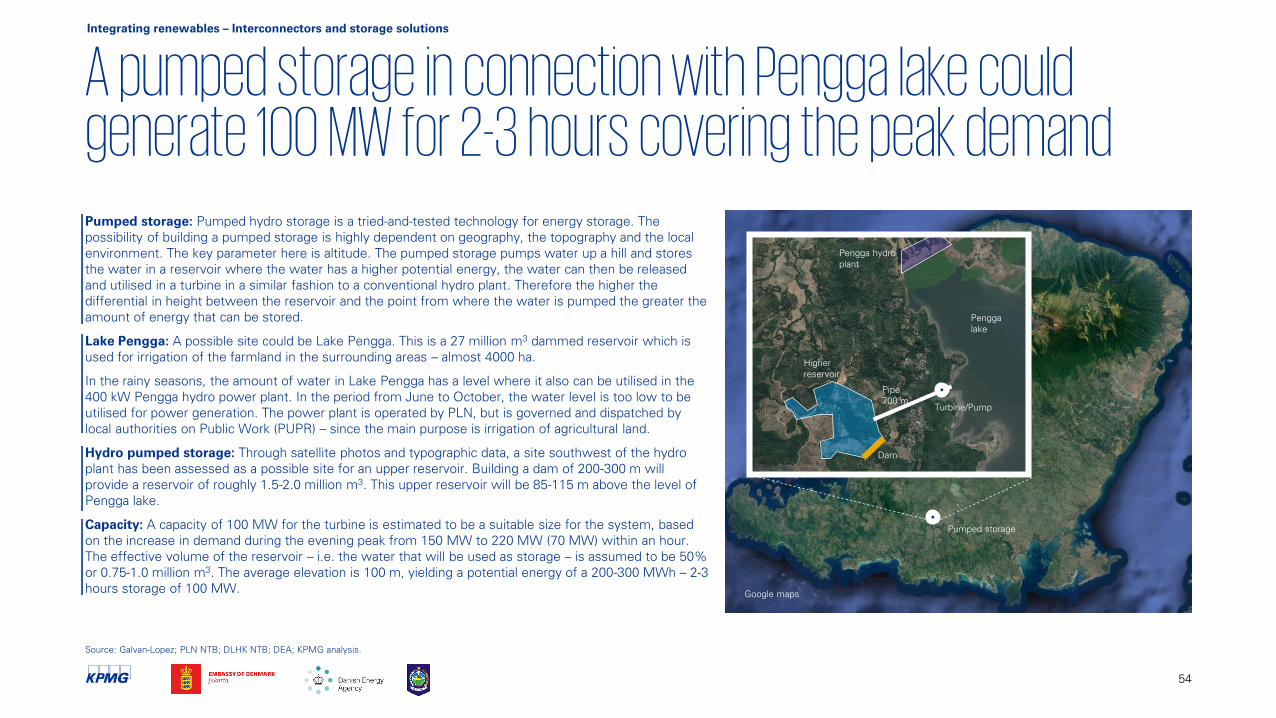
Google maps
A pumped storage in connection with Pengga lake could generate 100 MW for 2-3 hours covering the peak demand
Pumped storage
Pengga hydro
plant
Higher
reservoir
Dam
Pipe
700 m
Turbine/Pump
Pengga
lake
Source: Galvan-Lopez; PLN NTB; DLHK NTB; DEA; KPMG analysis.
Integrating renewables – Interconnectors and storage solutions
Pumped storage: Pumped hydro storage is a tried-and-tested technology for energy storage. The
possibility of building a pumped storage is highly dependent on geography, the topography and the local
environment. The key parameter here is altitude. The pumped storage pumps water up a hill and stores
the water in a reservoir where the water has a higher potential energy, the water can then be released
and utilised in a turbine in a similar fashion to a conventional hydro plant. Therefore the higher the
differential in height between the reservoir and the point from where the water is pumped the greater the
amount of energy that can be stored.
Lake Pengga: A possible site could be Lake Pengga. This is a 27 million m3
dammed reservoir which is
used for irrigation of the farmland in the surrounding areas – almost 4000 ha.
In the rainy seasons, the amount of water in Lake Pengga has a level where it also can be utilised in the
400 kW Pengga hydro power plant. In the period from June to October, the water level is too low to be
utilised for power generation. The power plant is operated by PLN, but is governed and dispatched by
local authorities on Public Work (PUPR) – since the main purpose is irrigation of agricultural land.
Hydro pumped storage: Through satellite photos and typographic data, a site southwest of the hydro
plant has been assessed as a possible site for an upper reservoir. Building a dam of 200-300 m will
provide a reservoir of roughly 1.5-2.0 million m3. This upper reservoir will be 85-115 m above the level of
Pengga lake.
Capacity: A capacity of 100 MW for the turbine is estimated to be a suitable size for the system, based
on the increase in demand during the evening peak from 150 MW to 220 MW (70 MW) within an hour.
The effective volume of the reservoir – i.e. the water that will be used as storage – is assumed to be 50%
or 0.75-1.0 million m3. The average elevation is 100 m, yielding a potential energy of a 200-300 MWh – 2-3
hours storage of 100 MW.
54
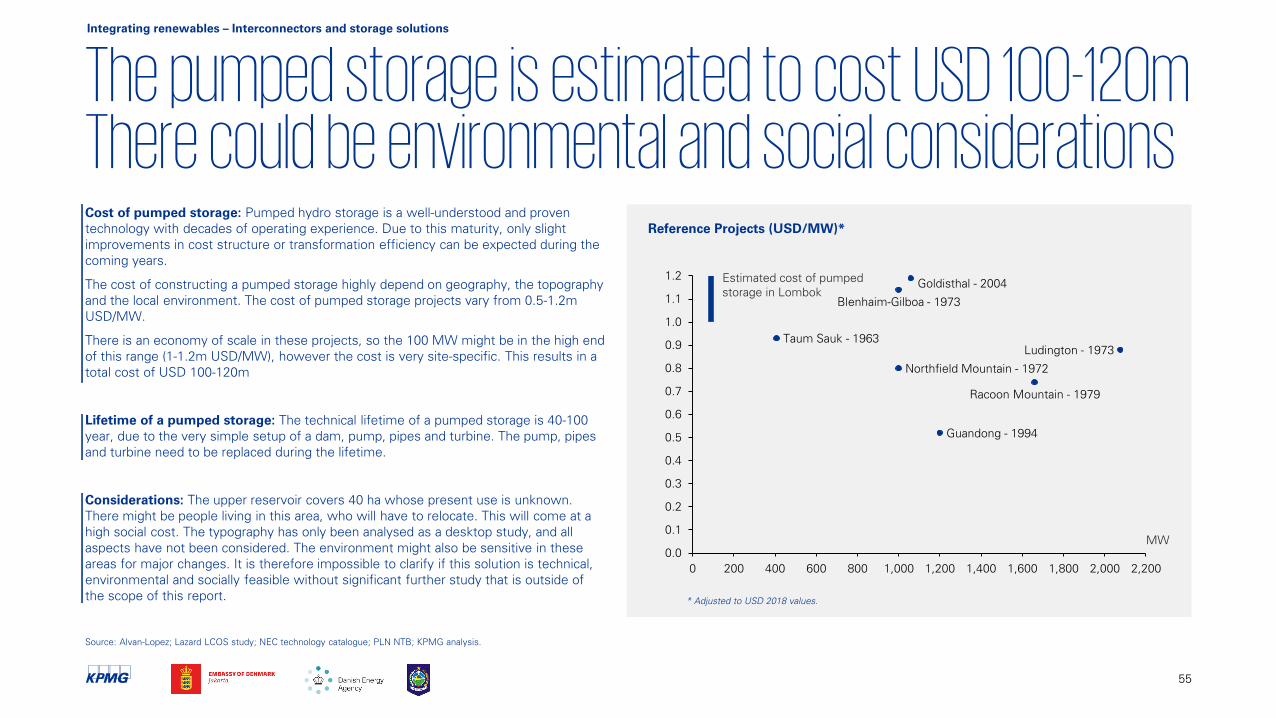
The pumped storage is estimated to cost USD 100-120mThere could be environmental and social considerations
55
Integrating renewables – Interconnectors and storage solutions
* Adjusted to USD 2018 values.
0.0
0.1
0.2
0.3
0.4
0.5
0.6
0.7
0.8
0.9
1.0
1.1
1.2
1,4008000 1,200200 400 600 1,000 1,600 1,800 2,000 2,200
Guandong - 1994
Goldisthal - 2004
Racoon Mountain - 1979
Taum Sauk - 1963
Ludington - 1973
Northfield Mountain - 1972
Blenhaim-Gilboa - 1973
MW
Cost of pumped storage: Pumped hydro storage is a well-understood and proven
technology with decades of operating experience. Due to this maturity, only slight
improvements in cost structure or transformation efficiency can be expected during the
coming years.
The cost of constructing a pumped storage highly depend on geography, the topography
and the local environment. The cost of pumped storage projects vary from 0.5-1.2m
USD/MW.
There is an economy of scale in these projects, so the 100 MW might be in the high end
of this range (1-1.2m USD/MW), however the cost is very site-specific. This results in a
total cost of USD 100-120m
Lifetime of a pumped storage: The technical lifetime of a pumped storage is 40-100
year, due to the very simple setup of a dam, pump, pipes and turbine. The pump, pipes
and turbine need to be replaced during the lifetime.
Considerations: The upper reservoir covers 40 ha whose present use is unknown.
There might be people living in this area, who will have to relocate. This will come at a
high social cost. The typography has only been analysed as a desktop study, and all
aspects have not been considered. The environment might also be sensitive in these
areas for major changes. It is therefore impossible to clarify if this solution is technical,
environmental and socially feasible without significant further study that is outside of
the scope of this report.
Reference Projects (USD/MW)*
Source: Alvan-Lopez; Lazard LCOS study; NEC technology catalogue; PLN NTB; KPMG analysis.
Estimated cost of pumped
storage in Lombok
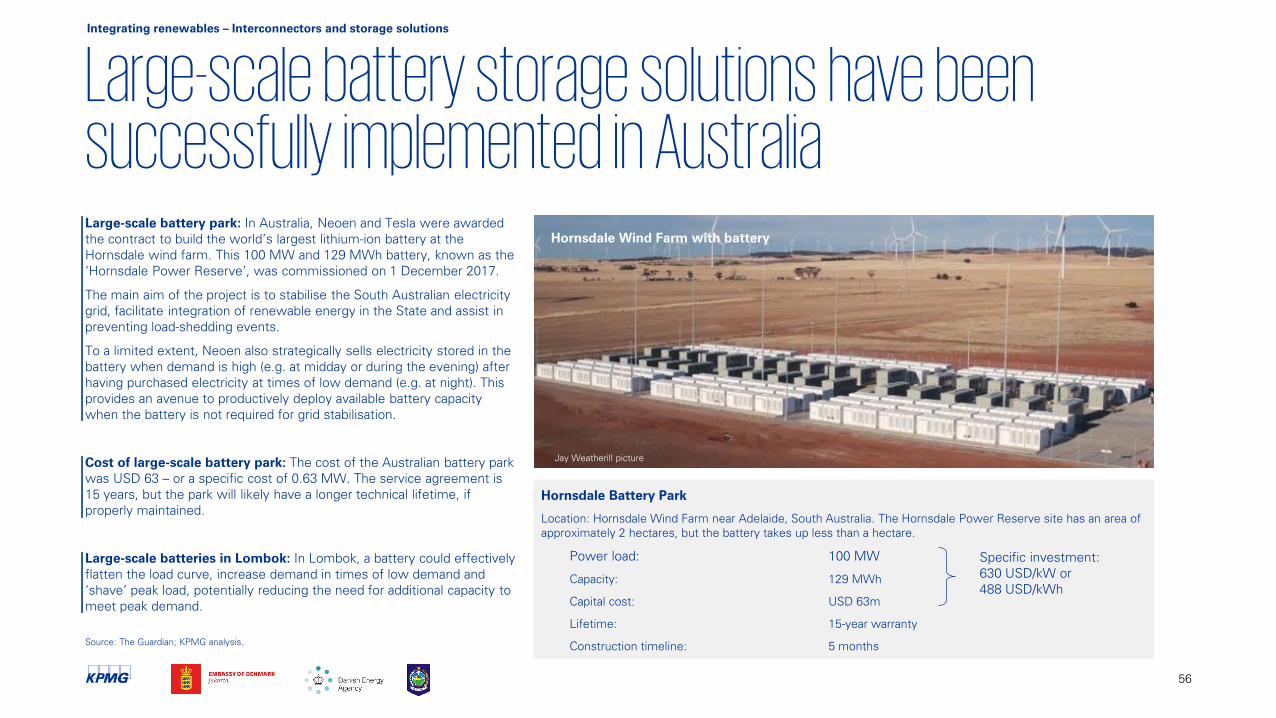
Large-scale battery storage solutions have been successfully implemented in Australia
56
Hornsdale Battery Park
Location: Hornsdale Wind Farm near Adelaide, South Australia. The Hornsdale Power Reserve site has an area of
approximately 2 hectares, but the battery takes up less than a hectare.
Power load: 100 MW
Capacity: 129 MWh
Capital cost: USD 63m
Lifetime: 15-year warranty
Construction timeline: 5 months
Large-scale battery park: In Australia, Neoen and Tesla were awarded
the contract to build the world’s largest lithium-ion battery at the
Hornsdale wind farm. This 100 MW and 129 MWh battery, known as the
‘Hornsdale Power Reserve’, was commissioned on 1 December 2017.
The main aim of the project is to stabilise the South Australian electricity
grid, facilitate integration of renewable energy in the State and assist in
preventing load-shedding events.
To a limited extent, Neoen also strategically sells electricity stored in the
battery when demand is high (e.g. at midday or during the evening) after
having purchased electricity at times of low demand (e.g. at night). This
provides an avenue to productively deploy available battery capacity
when the battery is not required for grid stabilisation.
Cost of large-scale battery park: The cost of the Australian battery park
was USD 63 – or a specific cost of 0.63 MW. The service agreement is
15 years, but the park will likely have a longer technical lifetime, if
properly maintained.
Large-scale batteries in Lombok: In Lombok, a battery could effectively
flatten the load curve, increase demand in times of low demand and
‘shave’ peak load, potentially reducing the need for additional capacity to
meet peak demand.
Specific investment:
630 USD/kW or
488 USD/kWh
Integrating renewables – Interconnectors and storage solutions
Source: The Guardian; KPMG analysis.
Hornsdale Wind Farm with battery
Jay Weatherill picture
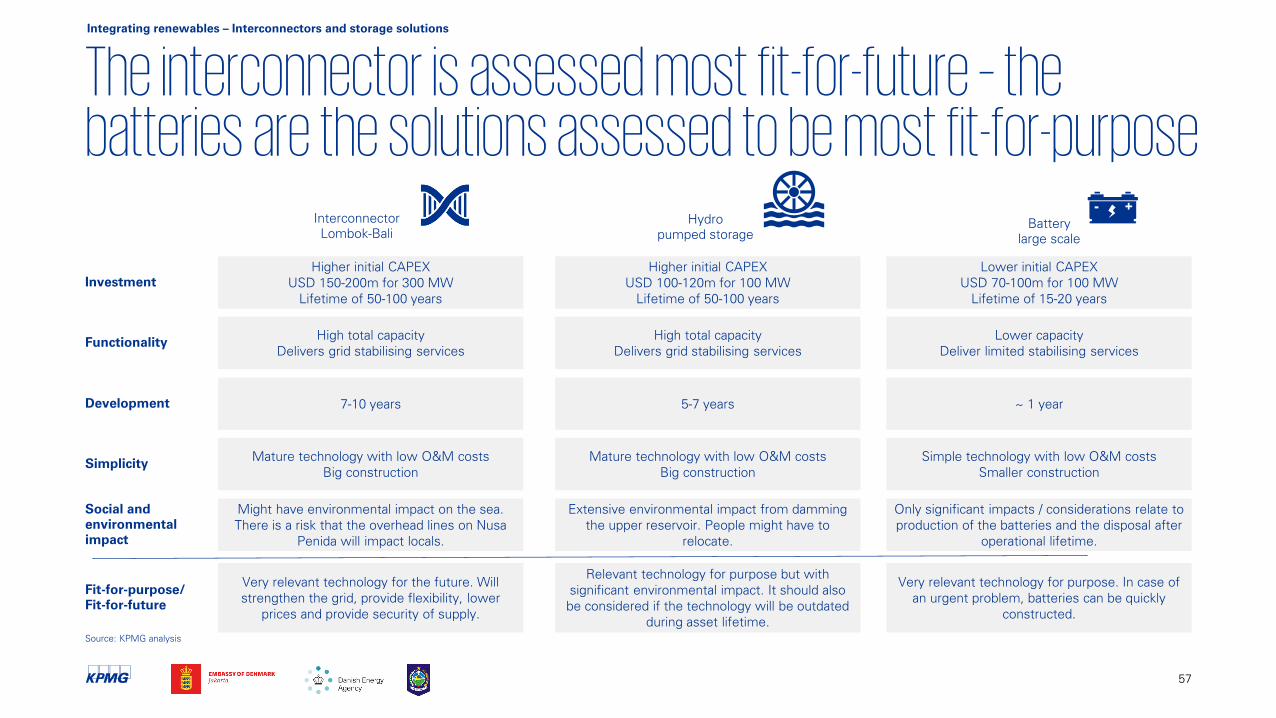
The interconnector is assessed most fit-for-future – the batteries are the solutions assessed to be most fit-for-purpose
57
Source: KPMG analysis
Functionality
Development
Simplicity
Social and
environmental
impact
Fit-for-purpose/
Fit-for-future
Hydro
pumped storage
High total capacity
Delivers grid stabilising services
5-7 years
Mature technology with low O&M costs
Big construction
Extensive environmental impact from damming
the upper reservoir. People might have to
relocate.
Relevant technology for purpose but with
significant environmental impact. It should also
be considered if the technology will be outdated
during asset lifetime.
Interconnector
Lombok-Bali
Investment
Higher initial CAPEX
USD 100-120m for 100 MW
Lifetime of 50-100 years
Higher initial CAPEX
USD 150-200m for 300 MW
Lifetime of 50-100 years
High total capacity
Delivers grid stabilising services
7-10 years
Mature technology with low O&M costs
Big construction
Might have environmental impact on the sea.
There is a risk that the overhead lines on Nusa
Penida will impact locals.
Very relevant technology for the future. Will
strengthen the grid, provide flexibility, lower
prices and provide security of supply.
Integrating renewables – Interconnectors and storage solutions
Battery
large scale
Lower capacity
Deliver limited stabilising services
~ 1 year
Simple technology with low O&M costs
Smaller construction
Only significant impacts / considerations relate to
production of the batteries and the disposal after
operational lifetime.
Very relevant technology for purpose. In case of
an urgent problem, batteries can be quickly
constructed.
Lower initial CAPEX
USD 70-100m for 100 MW
Lifetime of 15-20 years
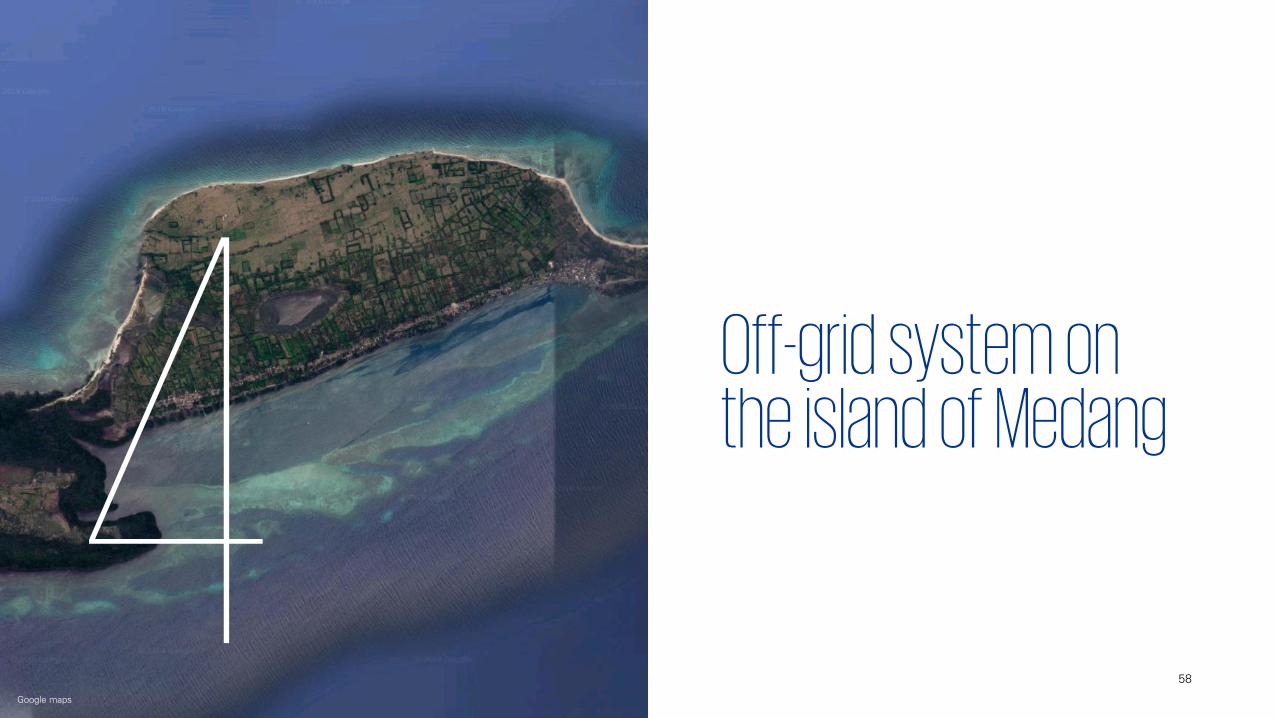
Off-grid system on the island of Medang
58
Google maps
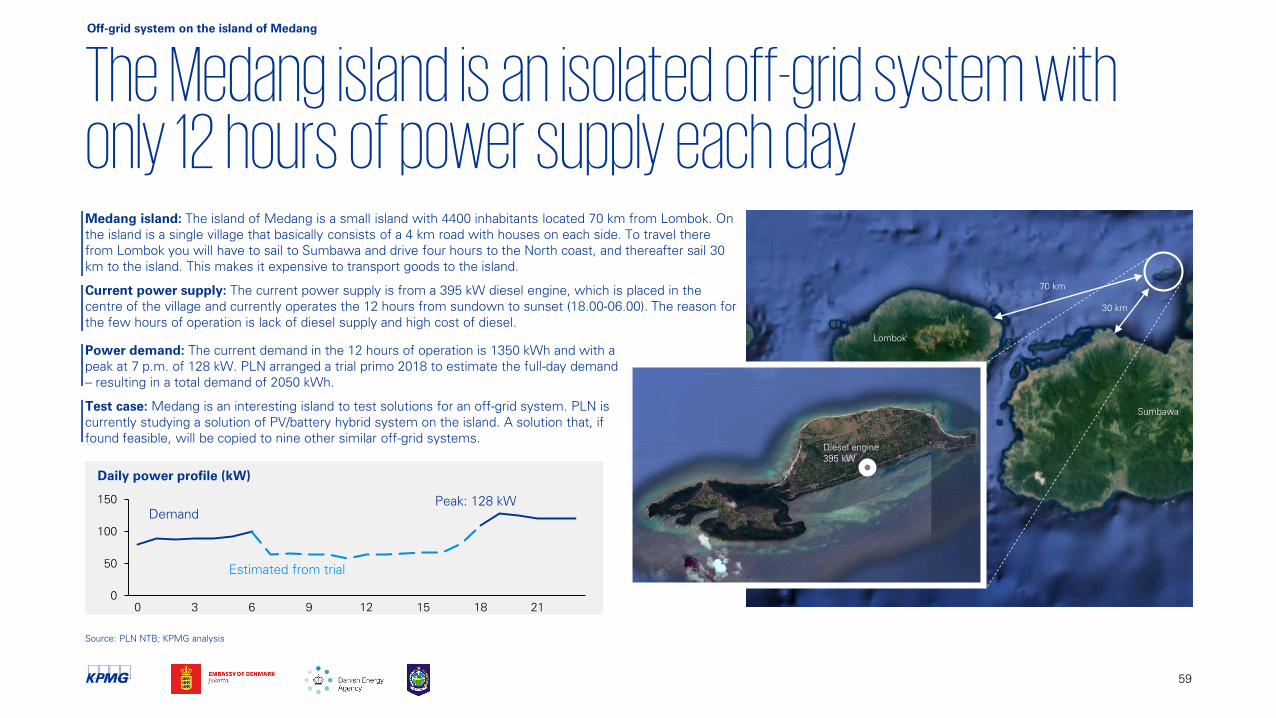
The Medang island is an isolated off-grid system with only 12 hours of power supply each dayMedang island: The island of Medang is a small island with 4400 inhabitants located 70 km from Lombok. On
the island is a single village that basically consists of a 4 km road with houses on each side. To travel there
from Lombok you will have to sail to Sumbawa and drive four hours to the North coast, and thereafter sail 30
km to the island. This makes it expensive to transport goods to the island.
Current power supply: The current power supply is from a 395 kW diesel engine, which is placed in the
centre of the village and currently operates the 12 hours from sundown to sunset (18.00-06.00). The reason for
the few hours of operation is lack of diesel supply and high cost of diesel.
59
Google maps
Off-grid system on the island of Medang
Lombok
Sumbawa
Source: PLN NTB; KPMG analysis
Diesel engine
395 kW
70 km
30 km
Daily power profile (kW)
0
50
100
150
15 210 93 6 12 18
Demand
Estimated from trial
Peak: 128 kW
Power demand: The current demand in the 12 hours of operation is 1350 kWh and with a
peak at 7 p.m. of 128 kW. PLN arranged a trial primo 2018 to estimate the full-day demand
– resulting in a total demand of 2050 kWh.
Test case: Medang is an interesting island to test solutions for an off-grid system. PLN is
currently studying a solution of PV/battery hybrid system on the island. A solution that, if
found feasible, will be copied to nine other similar off-grid systems.
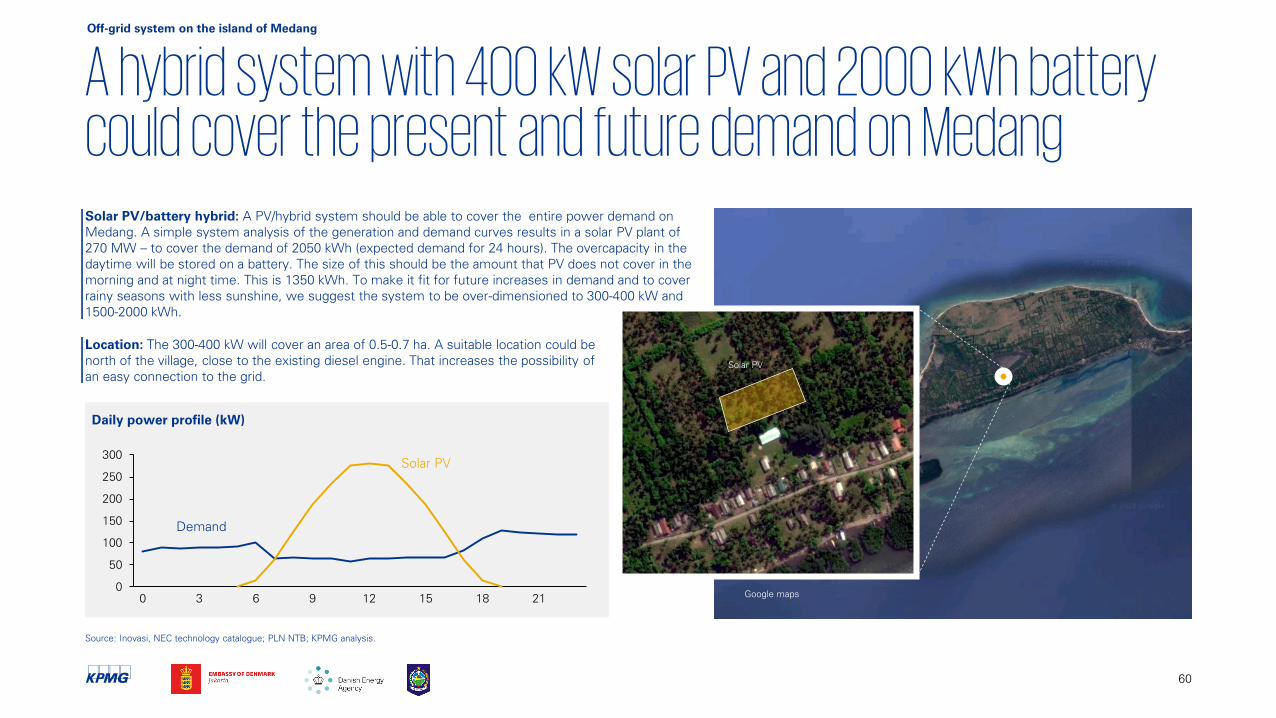
Google maps
A hybrid system with 400 kW solar PV and 2000 kWh battery could cover the present and future demand on MedangSolar PV/battery hybrid: A PV/hybrid system should be able to cover the entire power demand on
Medang. A simple system analysis of the generation and demand curves results in a solar PV plant of
270 MW – to cover the demand of 2050 kWh (expected demand for 24 hours). The overcapacity in the
daytime will be stored on a battery. The size of this should be the amount that PV does not cover in the
morning and at night time. This is 1350 kWh. To make it fit for future increases in demand and to cover
rainy seasons with less sunshine, we suggest the system to be over-dimensioned to 300-400 kW and
1500-2000 kWh.
Source: Inovasi, NEC technology catalogue; PLN NTB; KPMG analysis.
60
Solar PV
Daily power profile (kW)
0
50
100
150
200
250
300
2130 6 18129 15
Demand
Solar PV
Off-grid system on the island of Medang
Location: The 300-400 kW will cover an area of 0.5-0.7 ha. A suitable location could be
north of the village, close to the existing diesel engine. That increases the possibility of
an easy connection to the grid.
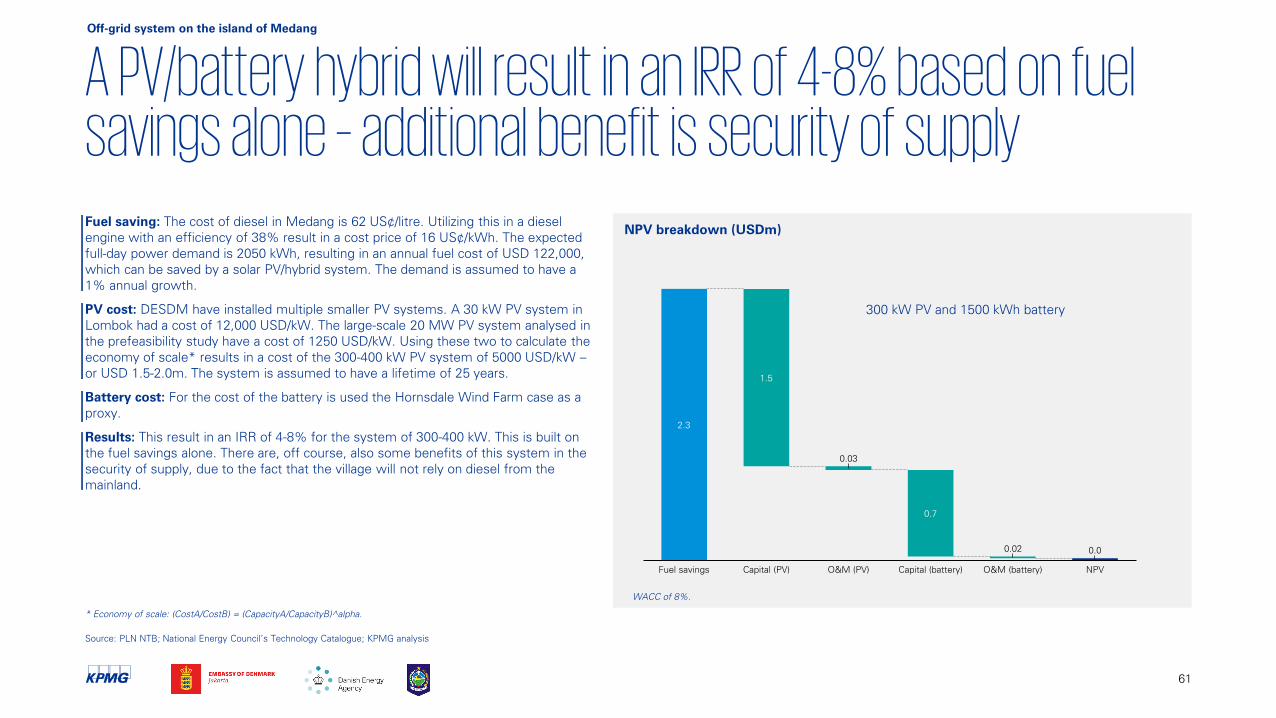
A PV/battery hybrid will result in an IRR of 4-8% based on fuel savings alone – additional benefit is security of supply
61
Source: PLN NTB; National Energy Council’s Technology Catalogue; KPMG analysis
NPV breakdown (USDm)
Off-grid system on the island of Medang
Fuel saving: The cost of diesel in Medang is 62 US¢/litre. Utilizing this in a diesel
engine with an efficiency of 38% result in a cost price of 16 US¢/kWh. The expected
full-day power demand is 2050 kWh, resulting in an annual fuel cost of USD 122,000,
which can be saved by a solar PV/hybrid system. The demand is assumed to have a
1% annual growth.
PV cost: DESDM have installed multiple smaller PV systems. A 30 kW PV system in
Lombok had a cost of 12,000 USD/kW. The large-scale 20 MW PV system analysed in
the prefeasibility study have a cost of 1250 USD/kW. Using these two to calculate the
economy of scale* results in a cost of the 300-400 kW PV system of 5000 USD/kW –
or USD 1.5-2.0m. The system is assumed to have a lifetime of 25 years.
Battery cost: For the cost of the battery is used the Hornsdale Wind Farm case as a
proxy.
Results: This result in an IRR of 4-8% for the system of 300-400 kW. This is built on
the fuel savings alone. There are, off course, also some benefits of this system in the
security of supply, due to the fact that the village will not rely on diesel from the
mainland.
* Economy of scale: (CostA/CostB) = (CapacityA/CapacityB)^alpha.
2.3
1.5
Capital (battery)Fuel savings Capital (PV)
0.7
0.03
O&M (PV) NPV
0.02
O&M (battery)
0.0
300 kW PV and 1500 kWh battery
WACC of 8%.
References and sources
62
We have collected primary data from a large number of sources during the course of this study:Interviews have been conducted with and data have been received by:
PLN NTB – Pak Susilo Disjaya, Manager of System Planning
DLHK – Pak Ida Bagus Gede Sutawijaya
DESDM – Ibu Niken Arumdati, Head of New and Renewable Energy Development
Inovasi – Pak Andre Susanto, Director
PBBT – Pak Joko Santosa, Engineer
Vestas Wind Systems – Arka Wiriadidjaja, Regional Sales Manager in South East Asia
Martin Bencher Group – Jesper Josephsen Meldgaard, General Manager
63
References and sources
This study has used the following publications, data and other studies as references
64
References and sources
ABC News ABC News, Bali beaches swamped by garbage as tourists, hotel workers sweep up each morning (2018)
ADB Proposed Loan and Administration of Loans Special Purpose Vehicles owned by Equis Energy Eastern Indonesia Renewable Energy Project (2018)
Alvan-Lopez Alvan-Lopez, The Cost of Pumped Hydroelectric Storage, Stanford University (2014)
ASEAN ASEAN Centre of Energy – LCOE of Selected Renewable Technologies in ASEAN Member States (2016)
Baker McKenzie Baker Mckenzie, Indonesian Government Improves PPA Risk Allocation Regulation (2018)
BBC BBC, Giant plastic berg blocks Indonesian river (2018)
Damdaran Damodaran CRP data
DEA Danish Energy Agency GIS analysis
DLHK NTB Local office on Environment & Forestry (DLHK NTB) - Interview and data
DESDM NTB Local office of Ministry of Energy & Mineral Resources (DESDM NTB) - Interview and data
Ea Energy Analyses & IDEAS Consulting Services Biomass for energy prefeasibility study (2018)
FCN & E.ON Research Center Bridging the Gap between Onshore and Offshore Innovations by the European Wind Power Supply Industry: A Survey-based Analysis (2012)
Google Earth Google Earth altitude function
Galvan-Lopez Galvan-Lopez, The Cost of Pumped Hydroelectric Storage, Stanford University (2014)
The Guardian South Australia's Tesla battery on track to make back a third of cost in a year (2018)
Ibbotson Ibbotson SBBI Market Report
Inovasi Inovasi, Solar PV – Diesel Hybrid – Win-win business models and PPA arrangement
Inside Indonesia Inside Indonesia - Saving Lombok’s beaches (2018)
IRENA IRENA – Renewable Power Generation Costs in 2017 (2018)
Jakarta Post [1] Jakarta Post - Jokowi inaugurates first Indonesian wind farm in Sulawesi (2018)
Jakarta Post [2] Jakarta Post - Gili Trawangan spoiled by garbage (2018)
Jay Weatherill Former Premier of South Australia via Twitter
Publications:
This study has used the following publications, data and other studies as references
65
References and sources
Korea Engineering Consultants Corp Waste incineration power plant of 10 MW in Lombok, Indonesia – Feasibility study
Martin Becher Group Martin Bencher Group, Martin Bencher Group interview
MMR No. 10/2017 MEMR Decree No. 10/2017, PR No. 35/2018
MEMR Decree No. 1772K MEMR Decree No. 1772K/20/MEM/2018
MEMR No. 3/2015 MEMR Regulation Number 03/2015
MEMR No. 44/2015 MEMR Regulation Number 44/2015
MEMR No. 5/2017 MEMR Regulation Number 05/2017
MEMR No. 10/2017 MEMR Regulation Number 10/2017
MEMR No. 49/2017 MEMR Regulation Number 49/2017
MEMR No. 50/2017 MEMR Regulation Number 50/2017
MEMR No. 10/2018 MEMR Regulation Number 10/2018
Mitsubishi Research Institute Feasibility Study on Rice Husk Power Generation System for Low-carbon Communities in Ayeyarwady Region, Myanmar (2015)
NEC Technology Catalogue National Energy Council – Technology Data for the Indonesian Power Sector (2017)
Neoen Neoen, Translation of Document De Base dated 18 September 2018 (2018)
NREL PV benchmark National Renewable Energy Laboratory - U.S. Solar Photovoltaic System Cost Benchmark: Q1 2017 (2017)
NuGen Engineering Ltd. Feasibility Study for a 10 MW Biomass Fired Power Plant (2010)
Oceanography Oceanography – Ocean Internal Waves Observed in the Lombok Strait (2005)
PT. MGB Hi-Tech Indonesia Waste incineration power plant of 10 MW in Lombok, Indonesia – Feasibility study
Pusyantek BPPT Study on Cost Estimation of Bali-Lombok Interconnection Transmission Line Project (prepared for purpose for KPMG)
RUPTL 2018-2027 10-year business plan 2018-2027 (RUPTL)
PR No 35/2018 Presidential Regulation No. 35/ 2018
Presidential No 44/2016 Presidential Regulation No. 44/ 2016
Presidential No 5/2017 Presidential Regulation No. 5/2017
This study has used the following publications, data and other studies as references
66
References and sources
Presidential No. 54/2012 Presidential Regulation No. 54/2012
Siemens Siemens – HVDC Transmission Factsheet (2011)
Singh et al. Fluidised bed combustion and gasification of rice husk and rice straw – a state of art review (2011)
UK Department of Environment, UK Department of Environment, Food and Rural Affairs – Economies of Scale - Waste Management Optimisation Study (2007)
UMBRA UMBRA - MEMR Regulation 10/2018: A Game Changer for PPAs Bankability? (2018)
US Tresury US Treasury
Vestas Vestas Wind Systems interview
WindProspect Online windmap of Indonesia developed by EMD for the Embassy of Denmark to Indonesia and MEMR
The World Bank Group [ESMAP] The World Bank (ESMAP) – Solar Resource and Photovoltaic Power Potential of Indonesia
The World Bank The World Bank (Report No. 109237 – ID, For a First Indonesia logistics reform development policy loan)
World Energy Council World Energy Resource - Waste to Energy (2016)

Background material
67
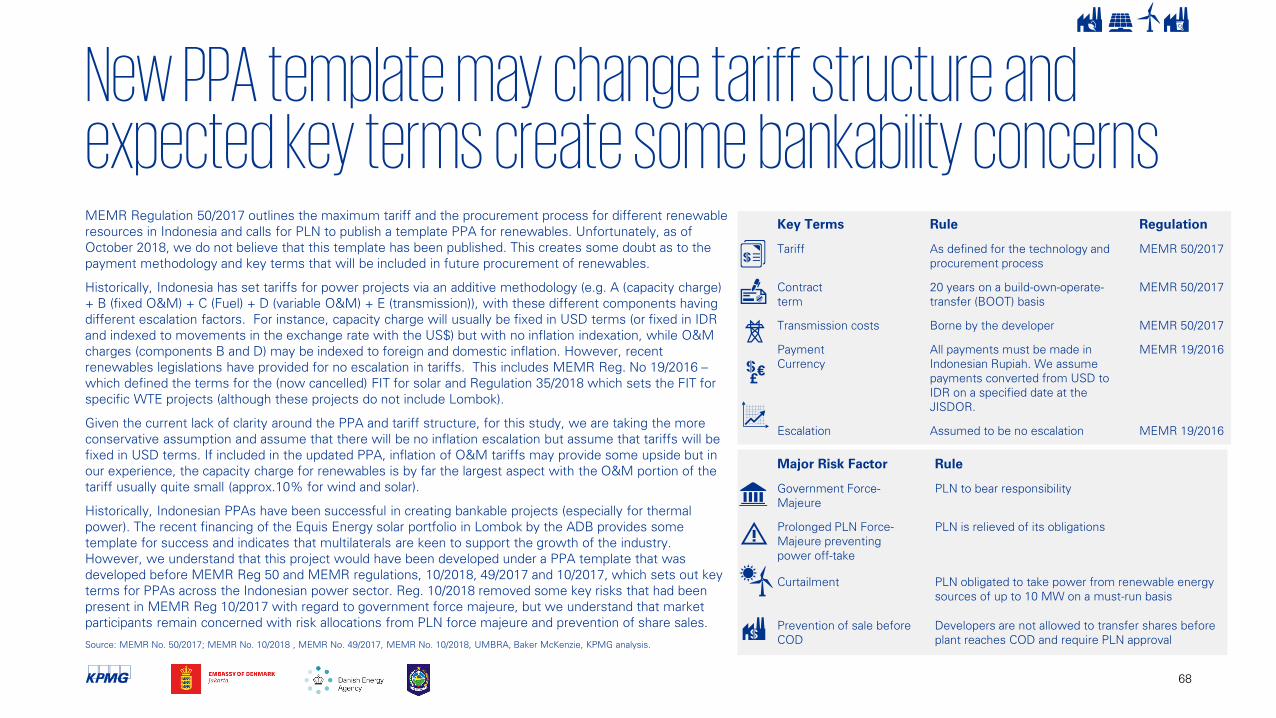
68
New PPA template may change tariff structure and expected key terms create some bankability concerns
Key Terms Rule Regulation
Tariff As defined for the technology and
procurement process
MEMR 50/2017
Contract
term
20 years on a build-own-operate-
transfer (BOOT) basis
MEMR 50/2017
Transmission costs Borne by the developer MEMR 50/2017
Payment
Currency
All payments must be made in
Indonesian Rupiah. We assume
payments converted from USD to
IDR on a specified date at the
JISDOR.
MEMR 19/2016
Escalation Assumed to be no escalation MEMR 19/2016
MEMR Regulation 50/2017 outlines the maximum tariff and the procurement process for different renewable
resources in Indonesia and calls for PLN to publish a template PPA for renewables. Unfortunately, as of
October 2018, we do not believe that this template has been published. This creates some doubt as to the
payment methodology and key terms that will be included in future procurement of renewables.
Historically, Indonesia has set tariffs for power projects via an additive methodology (e.g. A (capacity charge)
+ B (fixed O&M) + C (Fuel) + D (variable O&M) + E (transmission)), with these different components having
different escalation factors. For instance, capacity charge will usually be fixed in USD terms (or fixed in IDR
and indexed to movements in the exchange rate with the US$) but with no inflation indexation, while O&M
charges (components B and D) may be indexed to foreign and domestic inflation. However, recent
renewables legislations have provided for no escalation in tariffs. This includes MEMR Reg. No 19/2016 –
which defined the terms for the (now cancelled) FIT for solar and Regulation 35/2018 which sets the FIT for
specific WTE projects (although these projects do not include Lombok).
Given the current lack of clarity around the PPA and tariff structure, for this study, we are taking the more
conservative assumption and assume that there will be no inflation escalation but assume that tariffs will be
fixed in USD terms. If included in the updated PPA, inflation of O&M tariffs may provide some upside but in
our experience, the capacity charge for renewables is by far the largest aspect with the O&M portion of the
tariff usually quite small (approx.10% for wind and solar).
Historically, Indonesian PPAs have been successful in creating bankable projects (especially for thermal
power). The recent financing of the Equis Energy solar portfolio in Lombok by the ADB provides some
template for success and indicates that multilaterals are keen to support the growth of the industry.
However, we understand that this project would have been developed under a PPA template that was
developed before MEMR Reg 50 and MEMR regulations, 10/2018, 49/2017 and 10/2017, which sets out key
terms for PPAs across the Indonesian power sector. Reg. 10/2018 removed some key risks that had been
present in MEMR Reg 10/2017 with regard to government force majeure, but we understand that market
participants remain concerned with risk allocations from PLN force majeure and prevention of share sales.
Major Risk Factor Rule
Government Force-
Majeure
PLN to bear responsibility
Prolonged PLN Force-
Majeure preventing
power off-take
PLN is relieved of its obligations
Curtailment PLN obligated to take power from renewable energy
sources of up to 10 MW on a must-run basis
Prevention of sale before
COD
Developers are not allowed to transfer shares before
plant reaches COD and require PLN approvalSource: MEMR No. 50/2017; MEMR No. 10/2018 , MEMR No. 49/2017, MEMR No. 10/2018, UMBRA, Baker McKenzie, KPMG analysis.
£€
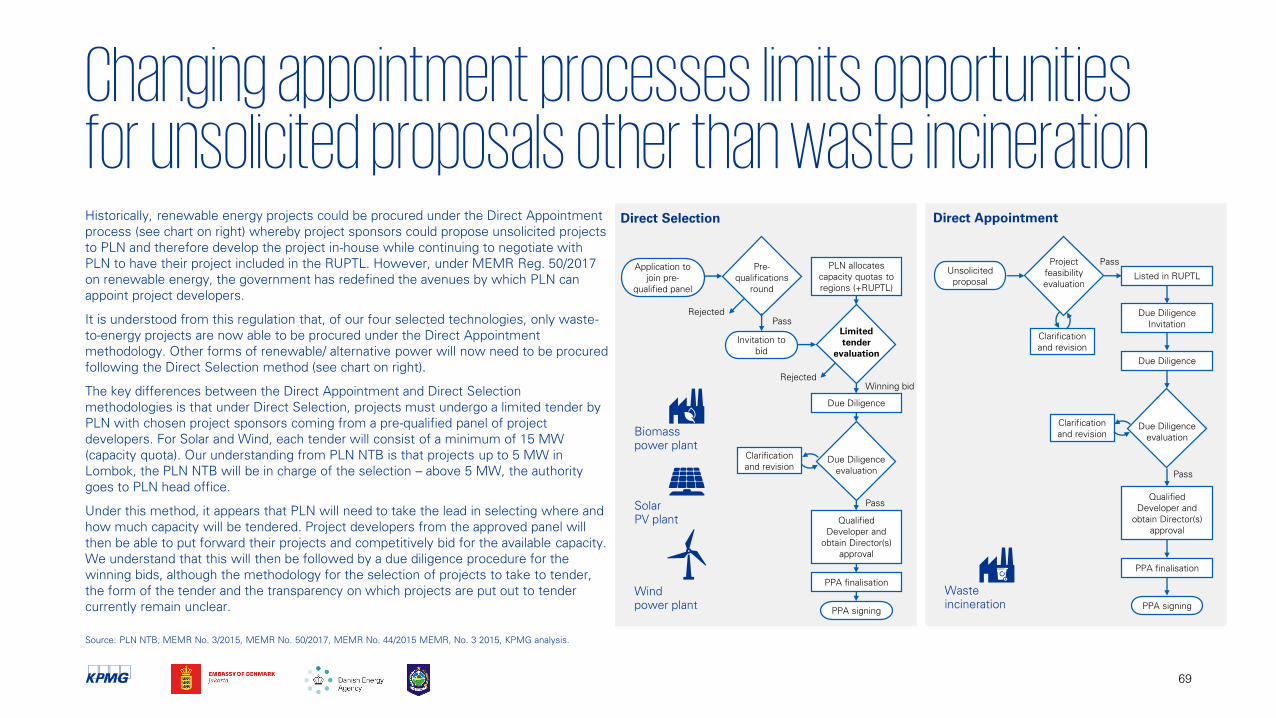
Changing appointment processes limits opportunities for unsolicited proposals other than waste incinerationHistorically, renewable energy projects could be procured under the Direct Appointment
process (see chart on right) whereby project sponsors could propose unsolicited projects
to PLN and therefore develop the project in-house while continuing to negotiate with
PLN to have their project included in the RUPTL. However, under MEMR Reg. 50/2017
on renewable energy, the government has redefined the avenues by which PLN can
appoint project developers.
It is understood from this regulation that, of our four selected technologies, only waste-
to-energy projects are now able to be procured under the Direct Appointment
methodology. Other forms of renewable/ alternative power will now need to be procured
following the Direct Selection method (see chart on right).
The key differences between the Direct Appointment and Direct Selection
methodologies is that under Direct Selection, projects must undergo a limited tender by
PLN with chosen project sponsors coming from a pre-qualified panel of project
developers. For Solar and Wind, each tender will consist of a minimum of 15 MW
(capacity quota). Our understanding from PLN NTB is that projects up to 5 MW in
Lombok, the PLN NTB will be in charge of the selection – above 5 MW, the authority
goes to PLN head office.
Under this method, it appears that PLN will need to take the lead in selecting where and
how much capacity will be tendered. Project developers from the approved panel will
then be able to put forward their projects and competitively bid for the available capacity.
We understand that this will then be followed by a due diligence procedure for the
winning bids, although the methodology for the selection of projects to take to tender,
the form of the tender and the transparency on which projects are put out to tender
currently remain unclear.
69
Source: PLN NTB; MEMR No. 3/2015, MEMR No. 50/2017, MEMR No. 44/2015 MEMR, No. 3 2015, KPMG analysis.
PLN allocates
capacity quotas to
regions (+RUPTL)
Winning bid
Pass
Application to
join pre-
qualified panel
Invitation to
bid
Due Diligence
evaluation
Due Diligence
Limited
tender
evaluation
Pre-
qualifications
round
Clarification
and revision
Qualified
Developer and
obtain Director(s)
approval
PPA finalisation
PPA signing
Pass
Rejected
Rejected
Direct Selection
Biomass
power plant
Solar
PV plant
Wind
power plant
Direct Appointment
Listed in RUPTL
Due Diligence
Invitation
Due Diligence
Qualified
Developer and
obtain Director(s)
approval
PPA finalisation
PPA signing
Clarification
and revision
Pass
Pass
Unsolicited
proposal
Due Diligence
evaluation
Project
feasibility
evaluation
Clarification
and revision
Waste
incineration
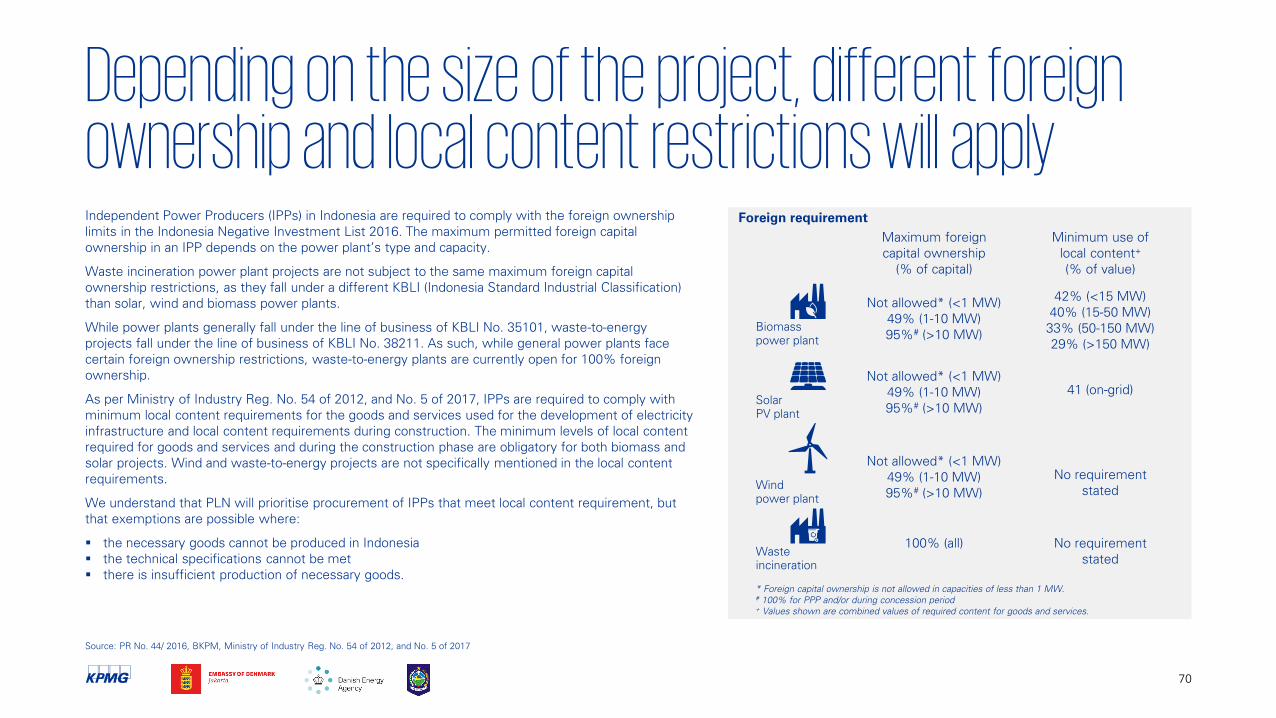
Depending on the size of the project, different foreign ownership and local content restrictions will apply
70
Source: PR No. 44/ 2016, BKPM, Ministry of Industry Reg. No. 54 of 2012, and No. 5 of 2017
Independent Power Producers (IPPs) in Indonesia are required to comply with the foreign ownership
limits in the Indonesia Negative Investment List 2016. The maximum permitted foreign capital
ownership in an IPP depends on the power plant’s type and capacity.
Waste incineration power plant projects are not subject to the same maximum foreign capital
ownership restrictions, as they fall under a different KBLI (Indonesia Standard Industrial Classification)
than solar, wind and biomass power plants.
While power plants generally fall under the line of business of KBLI No. 35101, waste-to-energy
projects fall under the line of business of KBLI No. 38211. As such, while general power plants face
certain foreign ownership restrictions, waste-to-energy plants are currently open for 100% foreign
ownership.
As per Ministry of Industry Reg. No. 54 of 2012, and No. 5 of 2017, IPPs are required to comply with
minimum local content requirements for the goods and services used for the development of electricity
infrastructure and local content requirements during construction. The minimum levels of local content
required for goods and services and during the construction phase are obligatory for both biomass and
solar projects. Wind and waste-to-energy projects are not specifically mentioned in the local content
requirements.
We understand that PLN will prioritise procurement of IPPs that meet local content requirement, but
that exemptions are possible where:
the necessary goods cannot be produced in Indonesia
the technical specifications cannot be met
there is insufficient production of necessary goods.
Biomass
power plant
Solar
PV plant
Wind
power plant
Waste
incineration
Maximum foreign
capital ownership
(% of capital)
Not allowed* (<1 MW)
49% (1-10 MW)
95%#
(>10 MW)
* Foreign capital ownership is not allowed in capacities of less than 1 MW.
#100% for PPP and/or during concession period
+Values shown are combined values of required content for goods and services.
Not allowed* (<1 MW)
49% (1-10 MW)
95%#
(>10 MW)
Not allowed* (<1 MW)
49% (1-10 MW)
95%#
(>10 MW)
100% (all)
Minimum use of
local content+
(% of value)
42% (<15 MW)
40% (15-50 MW)
33% (50-150 MW)
29% (>150 MW)
41 (on-grid)
No requirement
stated
No requirement
stated
Foreign requirement
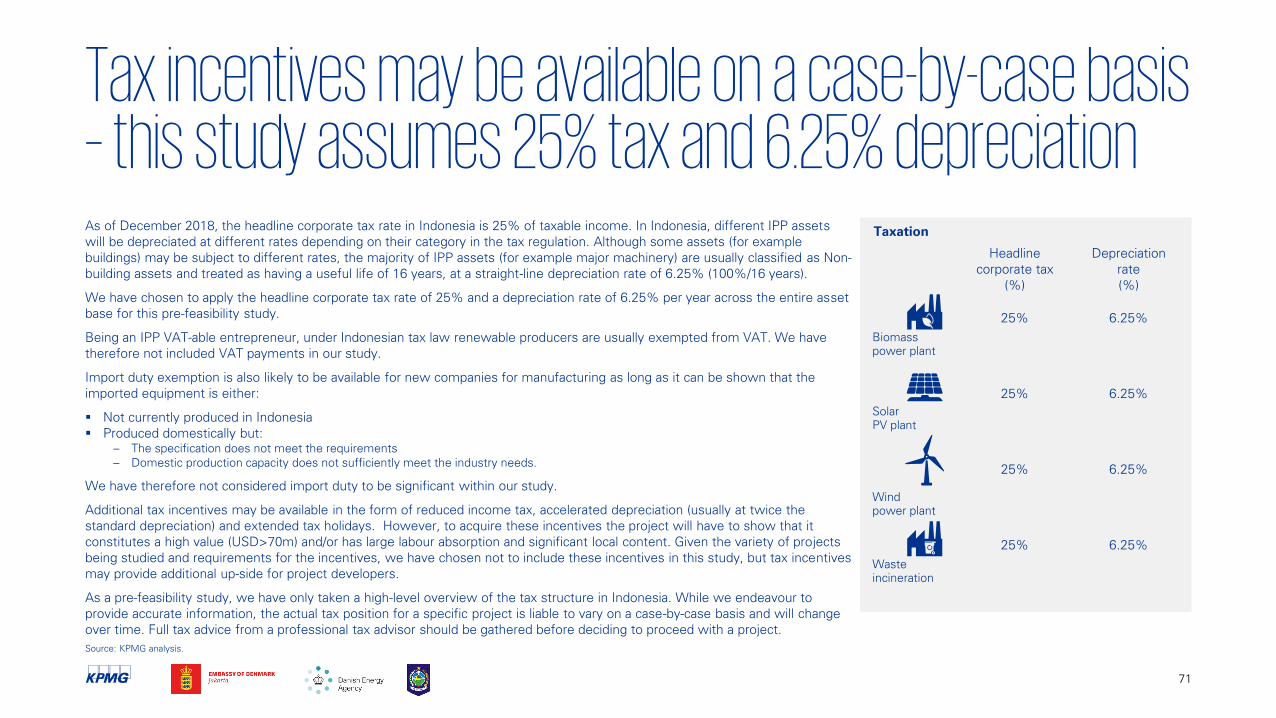
Tax incentives may be available on a case-by-case basis – this study assumes 25% tax and 6.25% depreciation
71
Source: KPMG analysis.
As of December 2018, the headline corporate tax rate in Indonesia is 25% of taxable income. In Indonesia, different IPP assets
will be depreciated at different rates depending on their category in the tax regulation. Although some assets (for example
buildings) may be subject to different rates, the majority of IPP assets (for example major machinery) are usually classified as Non-
building assets and treated as having a useful life of 16 years, at a straight-line depreciation rate of 6.25% (100%/16 years).
We have chosen to apply the headline corporate tax rate of 25% and a depreciation rate of 6.25% per year across the entire asset
base for this pre-feasibility study.
Being an IPP VAT-able entrepreneur, under Indonesian tax law renewable producers are usually exempted from VAT. We have
therefore not included VAT payments in our study.
Import duty exemption is also likely to be available for new companies for manufacturing as long as it can be shown that the
imported equipment is either:
Not currently produced in Indonesia
Produced domestically but:
– The specification does not meet the requirements
– Domestic production capacity does not sufficiently meet the industry needs.
We have therefore not considered import duty to be significant within our study.
Additional tax incentives may be available in the form of reduced income tax, accelerated depreciation (usually at twice the
standard depreciation) and extended tax holidays. However, to acquire these incentives the project will have to show that it
constitutes a high value (USD>70m) and/or has large labour absorption and significant local content. Given the variety of projects
being studied and requirements for the incentives, we have chosen not to include these incentives in this study, but tax incentives
may provide additional up-side for project developers.
As a pre-feasibility study, we have only taken a high-level overview of the tax structure in Indonesia. While we endeavour to
provide accurate information, the actual tax position for a specific project is liable to vary on a case-by-case basis and will change
over time. Full tax advice from a professional tax advisor should be gathered before deciding to proceed with a project.
Headline
corporate tax
(%)
Biomass
power plant
Solar
PV plant
Wind
power plant
Waste
incineration
Taxation
Depreciation
rate
(%)
25%
25%
25%
25%
6.25%
6.25%
6.25%
6.25%
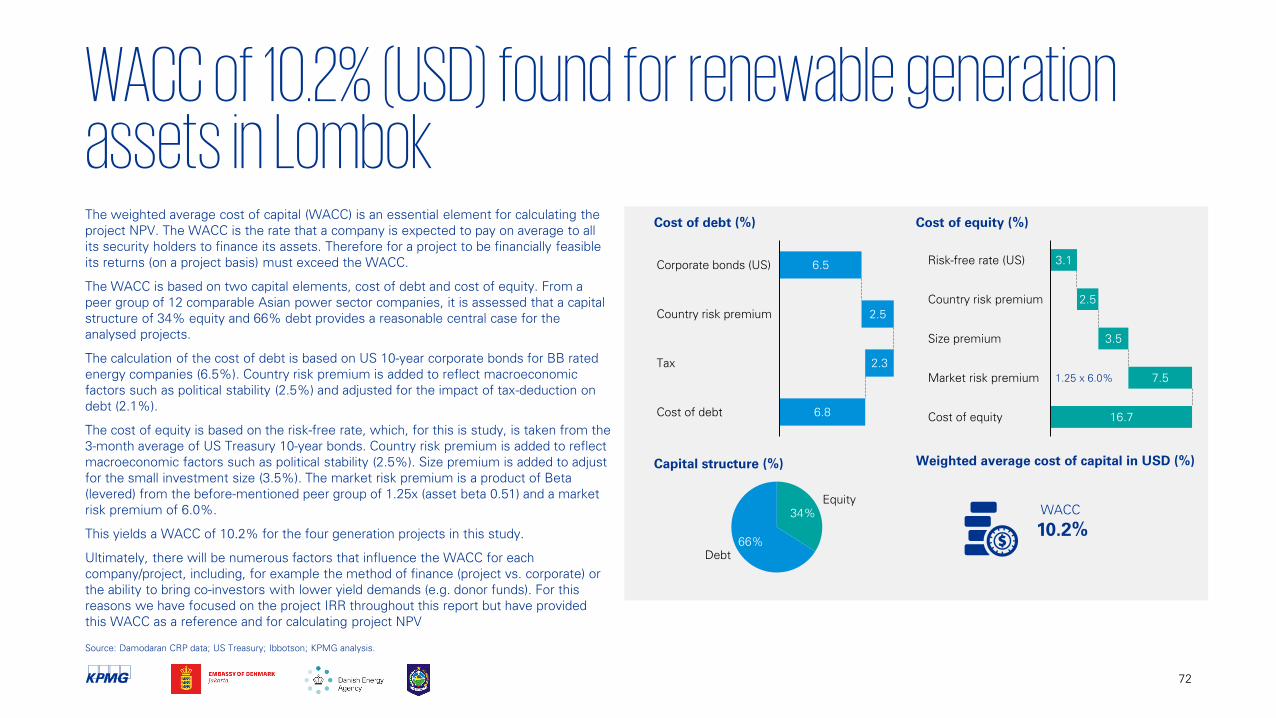
WACC of 10.2% (USD) found for renewable generation assets in Lombok
72
Source: Damodaran CRP data; US Treasury; Ibbotson; KPMG analysis.
The weighted average cost of capital (WACC) is an essential element for calculating the
project NPV. The WACC is the rate that a company is expected to pay on average to all
its security holders to finance its assets. Therefore for a project to be financially feasible
its returns (on a project basis) must exceed the WACC.
The WACC is based on two capital elements, cost of debt and cost of equity. From a
peer group of 12 comparable Asian power sector companies, it is assessed that a capital
structure of 34% equity and 66% debt provides a reasonable central case for the
analysed projects.
The calculation of the cost of debt is based on US 10-year corporate bonds for BB rated
energy companies (6.5%). Country risk premium is added to reflect macroeconomic
factors such as political stability (2.5%) and adjusted for the impact of tax-deduction on
debt (2.1%).
The cost of equity is based on the risk-free rate, which, for this is study, is taken from the
3-month average of US Treasury 10-year bonds. Country risk premium is added to reflect
macroeconomic factors such as political stability (2.5%). Size premium is added to adjust
for the small investment size (3.5%). The market risk premium is a product of Beta
(levered) from the before-mentioned peer group of 1.25x (asset beta 0.51) and a market
risk premium of 6.0%.
This yields a WACC of 10.2% for the four generation projects in this study.
Ultimately, there will be numerous factors that influence the WACC for each
company/project, including, for example the method of finance (project vs. corporate) or
the ability to bring co-investors with lower yield demands (e.g. donor funds). For this
reasons we have focused on the project IRR throughout this report but have provided
this WACC as a reference and for calculating project NPV
Cost of debt (%)
2.5
6.5
6.8
Corporate bonds (US)
Country risk premium
2.3Tax
Cost of debt
Market risk premium
3.5
7.5
Size premium
Country risk premium
3.1
2.5
Risk-free rate (US)
16.7Cost of equity
1.25 x 6.0%
Cost of equity (%)
Capital structure (%) Weighted average cost of capital in USD (%)
10.2%
WACC34%
66%
Equity
Debt

Document Classification: KPMG Confidential
kpmg.com/socialmedia
The information contained herein is of a general nature and is not intended to address the circumstances of any particular individual or entity. Although we endeavor to provide
accurate and timely information, there can be no guarantee that such information is accurate as of the date it is received or that it will continue to be accurate in the future. No one
should act on such information without appropriate professional advice after a thorough examination of the particular situation.
© 2018 KPMG P/S, a Danish limited liability partnership and a member firm of the KPMG network of independent member firms affiliated with KPMG International Cooperative
(“KPMG International”), a Swiss entity. All rights reserved. Printed in Denmark.


![INDEX [ens.dk]...municipal bio-waste from the municipality is digested together with waste-water sludge. The plant was upgraded in 2016 into Billund Biorefinery with ... Administration](https://img.pdfslide.us/doc/110x75/5e26dac77a9bc25ead240f5c/index-ensdk-municipal-bio-waste-from-the-municipality-is-digested-together.jpg)