Embed Size (px)
Citation preview

Effects of vertical confinement on gelation and sedimentation of col-loids
Azaima Razali,a,b,c Christopher J. Fullerton,d,e Francesco Turci,a,b James E. Hallett,a,b Robert L.Jack,d and C. Patrick Royalla,b, f ,g
Received Xth XXXXXXXXXX 20XX, Accepted Xth XXXXXXXXX 20XXThis draft: April 11, 2018First published on the web Xth XXXXXXXXXX 200XDOI: 10.1039/b000000x
We consider the sedimentation of a colloidal gel under confinement in the direction of gravity. The confinement allows us tocompare directly experiments and computer simulations, for the same system size in the vertical direction. The confinementalso leads to qualitatively different behaviour compared to bulk systems: in large systems gelation suppresses sedimentation, butfor small systems sedimentation is enhanced relative to non-gelling suspensions , although the rate of sedimentation is reducedwhen the strength of the attraction between the colloids is strong. We map interaction parameters between a model experimentalsystem (observed in real space) and computer simulations. Remarkably, we find that when simulating the system using Browniandynamics in which hydrodynamic interactions between the particles are neglected, we find that sedimentation occurs on the sametimescale as the experiments, however the thickness of the “arms” of the gel is rather larger in the experiments, compared withthe simulations. An analysis of local structure in the simulations showed similar behaviour to gelation in the absence of gravity.
1 Introduction
Non-equilibrium colloidal systems in gravitational fields dis-play rich and challenging behaviour1. Even the simplest col-loidal system, hard spheres, exhibits a range of phenomenawhen the force of gravity is unleashed2, due to the couplingbetween gravity, chemical potential3–6, and solvent-mediatedhydrodynamic interactions between the particles7–12. Evenwithout gravity, adding attractions between the colloids leadsto very rich behaviour in quiescent systems1,13. In particu-lar, spinodal demixing can lead to a network of particles14–18
which undergoes dynamical arrest — a gel19,20. The effec-tive attractions in these colloidal systems are induced by theaddition of non-absorbing polymer. The result is a mixtureof three important components — colloids, polymers and sol-vent — whose equilibrium properties can be derived from aneffective one-component system of colloids with attractive in-teractions, where the interaction strength is determined by the
a H.H. Wills Physics Laboratory, University of Bristol, Bristol, BS8 1TL, UKb Centre for Nanoscience and Quantum Information, Tyndall Avenue, Bristol,BS8 1FD, UKc Kulliyyah of Science, International Islamic University Malaysia, Jalan Is-tana, Bandar Indera Mahkota, 25200 Kuantan, Pahang, Malaysiad Department of Physics, University of Bath, Bath, BA2 7AY, UKe Laboratoire Charles Coulomb, UMR 5221, Universite Montpellier, Mont-pellier, Francef School of Chemistry, University of Bristol, Bristol, BS8 1TS, UKg Department of Chemical Engineering, Kyoto University, Kyoto 615-8510,Japan
polymer concentration21,22.The interplay of phase separation (which may be arrested)
and sedimentation can result in novel structure-dynamical cor-relations1,5,6,13,23. Among the most intriguing behaviour isthat of gelation under gravity. In bulk systems, gelation typi-cally suppresses sedimentation. This is because gelation (inthe colloidal systems we consider) corresponds to the for-mation of a network of arrested material with finite yieldstress13,24–26. This network can then support its own weight,suppressing sedimentation. Gels are therefore used exten-sively to extend the shelf-life of many products which wouldotherwise sediment27,28. Under some conditions the gel canpersist for years29, if the self-generated or gravitational stressis weaker than the yield stress30, but gels very often undergosedimentation31–33. This is a poorly understood phenomenonand can sometimes be sudden in its onset — so-called de-layed collapse34. In such delayed collapse, very little changein the macroscopic properties of the system is seen for sometime, which is comparable to the timescales we consider here.Then a change occurs and the system begins to sediment on atimescale of 105 particle diffusion times or more34.
Here we take a radical departure from previous work in thefield. Hitherto, large experimental systems have been consid-ered, where the particles are at least 105 times smaller thanany linear dimension of the system, so there may be 1016 ormore particles in the system13,34. The associated experimen-tal timescales for sedimentation are at least of the order of
1–11 | 1
arX
iv:1
610.
0112
3v3
[co
nd-m
at.s
oft]
15
Mar
201
7

105 diffusion times. Treating such large systems in a theo-retical fashion is, at present, only possible with approximateapproaches which impose a one-dimensional solution to theheight profile such as “batch settling”2 and dynamic densityfunctional theory35,36. To the best of our knowledge such the-oretical approaches have not been extended to consider sys-tems which undergo gelation and in any case, the applicabilityto an inhmogenous materials such a gel is at least question-able. This leaves computer simulation as a means to treat theproblem of sedimenting gels, but the timescales (up to years)and the macroscopic system sizes are not accessible to directsimulation.
However, it is possible to conduct experiments in muchsmaller systems, glass capillaries. Figure 1 shows the dif-ference between bulk systems (as reported previously13,34)and the system size used in this work. Here the relevant lin-ear dimension (the height) is of order 100 particle diameterswhich is amenable to computer simulation. Such small sys-tems thus offer a testbed by which simulation may be com-pared with experiment. We employ Brownian dynamics simu-lations in which solvent-mediated hydrodynamic effects areincluded only at the one-body level (that is, Stokes drag),and hydrodynamic interactions between the particles are ne-glected. Such interactions can have significant effects in sed-imentation2,10–12,37 and in gelation38,39. However, capturingthem in simulations limits the accessible time scales and sys-tem sizes. Furthermore Peclet numbers in these experimentsare small, which we expect to reduce effects of hydrodynamicinteractions. Hence, we compare the experiments with Brow-nian dynamics simulations, which are simple and computa-tionally relatively inexpensive.
Remarkably, we find semi-quantitative agreement betweenexperiment and Brownian dynamics simulation. Moreover,both reveal that sedimentation in such small systems is pro-foundly different from that in large systems. There, gelationinhibits sedimentation, and is used in prolonging the shelf-lifeof many products. Here in small systems quite the oppositebehaviour is found: gelation enhances sedimentation.
Our physical picture is the following: in the absence ofphase separation, a bulk system of (repulsive) colloids un-der the action of gravity would attain a sedimentation profilecharacterised by the gravitational length λg; the same system,vertically confined in a capillary of length comparable to λgwould show an almost constant profile. However, when weintroduce polymers into the mixture and form a gel, the col-lapse is slowed down for the bulk systems while we observethat it is promoted in the small system.
The sedimentation behaviour of bulk gels has been previ-ously extensively studied34,40 and it is known to be charac-terised by an initial delayed collapse followed by a slow set-tling that can take 60 hours34. Here we focus on the obser-vation of sedimentation in vertically confined gels, measur-
Fig. 1 A sketch showing the difference between typicalexperimental systems in previous work13,34, and the systemdescribed here.
ing the way in which the interaction strength influences thetime evolution in experiments which is reproduced in simu-lations. From the simulations, we also obtain local structuralinformation which helps to explain the different sedimentationbehaviour for different interaction strengths.
This article is organised as follows. In section 2, we de-scribe our methodology by first defining the model systemand interaction potential (in section 2.1) used in our experi-ments (in section 2.2), while details of the simulation modelare given in section 2.3. We then describe how our simula-tions are mapped to the experimental model system in section2.4. Next, in section 3 we report how the phase behaviourfor our colloid-polymer system, sedimentation dynamics andinterface of collapsing gels evolve in time for different interac-tion strengths. Then analysis of structures formed during thesedimentation process is documented in section 3.3. Finally,we conclude our discussions in section 4.
2 Methods
2.1 Model and interaction potential
For polymers that are much smaller than the colloids, the re-sulting mixture can be described by an Asakura-Oosawa (AO)model, which treats the polymer molecules as an ideal gaswith hard interactions with the colloids21,41–43. The AO effec-tive interaction potential between two colloids can be writtenas:
uAO(r) =
∞ for r < σ
− kBT π(2Rg)3zp
6(1+q)3
q3
×[1− 3r
2(1+q)σ + r3
2(1+q)3σ3
]for σ≤ r < σ+σp
0 for r ≥ σ+σp(1)
where the fugacity zp is equal to the number density ρp ofideal polymers in a reservoir at the same chemical potentialas the colloid-polymer mixture. The result is an effectiveinteraction between the colloids of range qσ and well-depthumin
AO . For our parameters, Eq. 1 is expected to be highly
2 | 1–11

accurate. For q ≤ 0.1547 it is formally correct21,42. How-ever, for larger size ratios up to 0.25, the higher-order fluidstructure is very well represented indeed, compared to the fullAsakura-Oosawa model with explicit polymer43. We expressthe strength of the effective colloid-colloid interaction by thewell depth:
uAO(σ) = uminAO = q2kBT ρpσ
3 π(3+2q)12
. (2)
2.2 Experiment
The experimental system is sterically stabilised polymethyl-methacrylate (PMMA) with a diameter σ= 460 nm suspendedin cis-decalin. The colloidal polydispersity is approximately4% as determined with static light scattering. Although hardspheres with a polydispersity of 4% crystallise, the higher vol-ume fraction of crystals formed in attractive systems44 meansthat there is more sensitivity to polydispersity. Indeed 4% canbe sufficient to greatly reduce crystallisation45. A colloidal gelwas obtained by adding non-adsorbing polystyrene polymerwith molecular weight Mw = 3.46×10⁶, leading to a polymer-colloid size ratio of q = 2Rg/σ = 0.3, where Rg = 67 nm is theestimated polymer radius of gyration, see section 2.4.
For our parameters the gravitational length is λg =6kBT/(gδρσ3) = 27.1µm: here δρ is the density differencebetween the PMMA and the solvent, so λg is the height asso-ciated with a change of kBT in gravitational potential energyof a colloidal particle. The Peclet number for sedimentation isthen Pe = σ/(2λg) = 8.51×10⁻³.
As our unit of time, we use the Brownian time which we de-fine as the typical time for a free colloidal particle to diffuse adistance comparable with its radius: τB = σ2/24D = 0.0317s,where D = kBT/(3πησ) is the Stokes-Einsten diffusion con-stant, in which η is the solvent viscosity.
Each sample was transferred into a 100 µm capillary andsealed with epoxy resin. The manufacturing tolerance of thesecapillaries is around 10%. We allowed the resin to set prior toimaging and data was taken after 5 minutes. The imaging ofa z-stack of the entire capillary height was done using time-resolved confocal microscopy (Leica SP5). For each data set,the z-stack images were taken at intervals of approximately 8minutes, for a duration of 20 hours. The height of the cap-illaries were determined from the sample images in xy andyz planes. The top of the capillary is determined from theparticles visibly stuck to the glass capillary walls, which areevident in our work as shown in Fig.3a. Then, this observa-tion is continued in z-axis before the appearance of completedark space to be the bottom of the capillary. When report-ing experimental data, we use the so-called polymer reservoirrepresentation where the polymer concentration in the reser-voir is related to that in the experiment by Widom particleinsertion44. The colloid volume fraction for each sample is
extracted from the intensity measurements of the images ob-tained using the confocal microscope following6. These mea-surements were calibrated against homogeneous samples ofknown volume fraction, where there is a linear dependence ofthe measured intensity against colloid volume fraction.
We collect data at colloid volume fractions φc in the inter-val [0.1, 0.35] in order to determine the phase diagram of themodel. When describing the sedimentation behaviour of thesystem as a function of the different interaction strengths in-duced by the different polymer concentrations, we focus on asingle volume fraction φc = 0.2.
2.3 Simulation
Parameters and interactions. — As a simple way to mimicthe experimental polydispersity (whose primary effect is tosuppress crystallisation), we simulate a binary mixture of par-ticles, with equal numbers of each species. The diameters ofthe two species are σAA = 1.04σ and σBB = 0.96σ. We con-sider a total of N = 60,000 particles in a simulation box ofsize L×L×Lz with L = 28.025σ and Lz = 200σ, so that thevolume fraction is φc = 0.2, as in the experiment. All particleshave mass m. The boundary conditions are periodic in the xand y directions: there are walls at z = 0 and z = Lz that aredescribed in detail below. The sample height Lz is compara-ble with the dimension of the capillary used in the experiment,and the lateral dimension L is comparable with the range overwhich experimental data was taken.
As a proxy for the AO potential between the colloids, weuse a Morse potential
umor(r) = εmor
[e−2α(r−σi j)−2e−α(r−σi j)
], (3)
where εmor is the depth of the attractive well, α sets the at-traction range, and σi j is the position of the minimum of theinteraction between particles of species i and j (which dependson the particle type). This potential accurately reproduces thebehaviour of the AO system, including its higher-order localstructure43. In contrast to the AO potential [Eq. 1], the Morsepotential is continuous, which is convenient for simulation.We take α= 25.0σ−1 following43 and we use an additive mix-ing rule σAB = (σAA +σBB)/2 = σ. The reduced well-depthεmor/(kBT ) is varied between 1.0 and 30.0.
The particles move in an external potential that includesthe effects of gravity and of the confinement by the capillary.The gravitational potential energy of a particle at height z isEg(z) = zkBT/λg with λg = 60σ, similar to the experiment.The system is confined vertically by walls that are represented(for simplicity) by truncated and shifted Lennard-Jones poten-tials, as uwp(∆z) = 4εwp[(σwp/∆z)12− (σwp/∆z)6] where ∆zis the distance of the particle from the wall. The range of thepotential is σwp = 0.125σ, comparable with the range of the
1–11 | 3

Fig. 2 Summary of the states observed in the experimental colloid-polymer mixture with q = 0.3, as a function of colloid volume fraction φcand attractive interaction strength umin
AO , and polymer concentration (see section 2.4). Green squares indicate gels and blue circles indicatehomogeneous fluids. The � is the critical point determined based on the reduced second virial coefficient B∗2 and critical isochore estimatedfrom the literature46–48. The approximate position of the spinodal is indicated by the dashed line. Two dimensional snapshots of the systemillustrate the phase behaviour observed at different points in the phase diagram: (a) low density gel at low φc and high polymer density; (b)low polymer concentration leading to a non-percolating cluster phase; (c) high φc and polymer concentration resulting in a coarse gel network;(d) phase coexistence between fluid and gel close to the spinodal line. Scale bars represent 10 µm.
Morse potential and the well-depth is εwp = 2εmor. The topwall (at z = Lz) is purely repulsive, so the potential is trun-cated and shifted at its minimum. The bottom wall (at z = 0)accounts for depletion interactions between colloids and thewall, and is truncated and shifted at r = 2.4σwp. The wall in-teraction behaviour was chosen to match the experiments.
Dynamics and timescales. — Langevin (or Brownian) dy-namics are implemented using the LAMMPS package49. Par-ticles have positions rrri and velocities vvvi and the velocitiesevolve in time as
mddt
vvvi =−∇iV − γvvvi +√
2γkBT ξξξi (4)
where V is the total potential energy (including contributionsfrom particle interactions, gravity, and the confining walls),while γ is a friction constant and ξξξi a random noise force. Thefriction constant sets the time scale for the decay of velocitycorrelations as τd = m/γ.
There are a number of different time scales relevant forLangevin dynamics. As well as τd, there is a time scale τ0 =√
mσ2/kBT that is independent of the damping and sets thescale for particle velocities. Hence τ0 is the natural time unitwithin the LAMMPS implementation. For colloids, the phys-ical situation corresponds to an overdamped limit τd � τ0.Here we take τd/τ0 = 0.1, which is small enough to give theright qualitative behaviour — stronger damping would give amore accurate description but requires a more expensive nu-merical integration. The integration time step is 0.001τ0. Thesingle-particle diffusion constant is D0 = kBT/γ so the Brow-nian time is τB = σ2/(24D) = γσ2/(24kBT ) = τ2
0/(24τd),which for the parameters specified above corresponds to ap-
proximately 420 integration time steps.Preparation of initial conditions. — The system is ini-
tialised in a well-mixed state, to mimic the experimental con-ditions. To achieve this, both the interparticle interactions andthe interactions with the wall are truncated and shifted at theirminima to achieve purely repulsive interactions. Particles areinitialised in random positions, and a conjugate gradient min-imisation (without gravitational forces) is used to remove par-ticles that are overlapping. Then, the system is thermalised(still with purely repulsive interactions and without any gravi-tational forces) by evolving it for a time 50τ0, leading to a ho-mogeneous fluid configuration. These configurations are thenused as initial conditions for the main simulations (includinggravity and attractive interactions) for which results are shownbelow. All simulation results are averaged over 3 independenttrajectories. Since the systems are fairly large, the fluctuationsbetween trajectories are small.
2.4 Mapping between experiment and simulation
To match the state points between the Morse potential usedin simulation and the (approximate) Asakura-Oosawa interac-tions within the experiment, we used the extended law of cor-responding states introduced by Noro and Frenkel50. Identicalwell-depths and reduced second virial coefficients B∗2 (Eq. 5)are required in order to map the state points between simula-tions and experiments, where
B∗2 =B2
23 πσ3
eff. (5)
4 | 1–11

Fig. 3 Time-sequence of sedimenting gels captured from (a)experiment with umin
AO = 7.0 kBT and (b) simulation correspondingto umin
AO = 7.1 kBT . The scale bar in (a) corresponds to 7.5 µm. Thesnapshots of the experimental and simulation systems show regionsof comparable size (measured in units of the colloid particlediameter σ).
Here B2 = 2π∫
∞
0 [1−exp(−βu)]r2 dr is the second virial coef-ficient and σeff is the effective diameter of a particle51. For theAO potential, σeff = σ. For the Morse potential [Eq. 3], theeffective diameter is fractionally smaller than σ, but this effectis very small for our parameters (around 1% of the diameter)and is neglected. For the simulation results reported here, wecalculated the value of B∗2 associated with the relevant Morsepotential, and then calculated the well-depth that would givethe same value of B∗2 for an AO potential with q = 0.3. Inthe following, simulation results are labelled by these effec-tive AO well-depths, which are indicated by umin
AO . These ef-fective well-depths are comparable with (but do differ from)the well-depths εmor of the associated Morse potential.
Accurate determination of the polymer radius of gyrationis notoriously hard, with typical measurement errors around10 %. Alas, given that effective colloid-colloid interaction de-pends on the cube of the radius of gyration, we have found thatmapping to simulation and predictions (specifically that the re-duced second virial coefficient B∗2 ≈−1.5 at criticality) provesa more accurate means to estimate the radius of gyration35,48.By equating the second virial coefficient such that B∗2 =−1.5via Eq. 1, we arrive at Rg = 67 nm, which is compatible (i.e.within an error of 10%) with literature data52. This corre-sponds to a polymer overlap concentration of 4.56gL−1.
3 Results
3.1 Experimental phase behaviour
The phase diagram of the experimental system, as a functionof well depth and polymer concentration cp and colloid vol-ume fraction, φc is summarised in Figure 2. This diagramis representative of colloid-polymer mixtures with size ratioq = 0.3. One expects a liquid-vapor critical point in this sys-tem whose position is determined from the extended law ofcorresponding states50, shown here at B∗2 = −1.5. In our ex-periments, we find that criticality occurs at a polymer volumefraction (in the so-called experimental representation) 0.56gL−1.
The critical isochore is estimated from the literature46–48.The dashed line is an indicative spinodal line. As illustratedin the snapshots in Fig. 2the system explores cluster phases(point b) or gel phases (points a,c,d) of different nature de-pending on the concentration of polymers and the colloid vol-ume fraction: thin networks at low φc (a) or close to the spin-odal (d); much coarser networks at high φc and high polymerconcentration (c).
Fig. 4 Sedimentation profile φc(z) for an experimental system withumin
AO = 3.2 kBT at time t = 2.2×10⁵ τB. The orange area representsthe average lateral packing fraction as estimated from the intensityin the xz-direction of the sample. The white line is a fit according toEq. 6.
In our experimental samples, we see dynamically arrestedgels for polymer concentrations higher than that required forcriticality. There is no sign of colloidal liquid-gas phase sep-aration (either stable or metastable), presumably because theshort range of the interaction results in dynamical arrest be-fore phase separation can be completed. The polydispersity ofthe system prevents crystallisation on these time scales53.
3.2 Global sedimentation dynamics
In order to analyse the time-evolution of the colloid-polymermixture, we first consider the sedimentation of the system asa whole for both simulation and experiment (see Fig. 3). At
1–11 | 5

Fig. 5 Figure shows the interface height normalised to the height of the system. Gel/vapour “interface” height plotted as a function of time.This height is estimated by fitting the function in (6) to a histogram of colloid density against height. Results from experiments are shown in(a); simulation results are shown in (b).
early times, one observes gelation as the formation of a perco-lating network of particles. At later times, particles can detachfrom the arms of the gel and diffuse through the solvent ormove along the “surface” region between the “arms” of the geland the solvent54,55 : this effect induces restructuring of thegel network, and eventual collapse33,34,55–57. Here the dynam-ics of the collapsing gel is recorded by taking 3-dimensional(3d) images in the confocal microscope which span the en-tire capillary at different times. Figure 3(a) shows a sequenceof such confocal images as time progresses for a system withumin
AO = 7.0 kBT . From the confocal images, it is evident thatthe gel network is initially distributed throughout the wholecapillary before falling under gravity at later times. The samequalitative behaviour is shown in the simulation data in Fig.3(b).
We determine the time evolution of the height of the col-lapsing gel by plotting the local colloid volume fraction φc(z)as a function of height z, for each configuration in the tra-jectory as shown in Fig. 4. From the histogram, the gel-gas“interface” is obtained by fitting a hyperbolic tangent to φc(z),as
φc(z) = φ0 +δφ tanh(
h− zξ
). (6)
Here φ0 is the mean volume fraction in the regime we are fit-ting and δφ controls the change in volume fraction across theinterface. There are two fitting parameters, the height of thegel h, and the interfacial width ξ.
The fitting parameter h is the height of the gel-vapour inter-face, which we plot in Fig. 5. We normalise by the total heightof the system, H, as the tolerance of the capillaries used in theexperiments leads to small changes (less than 5% in the valueof H), thus we plot h(t)/H. Remarkably, the experiments andBrownian dynamics simulations exhibit sedimentation on acomparable timescale, and the degree of collapse is similar,
although the experiments exhibit a more gradual collapse on asomewhat longer timescale than the simulations.
In the case where there are no attractive forces and the sys-tem does not form a gel, we show in Fig. 6 that, for our param-eters, the sedimentation is negligible. To obtain this result, weconsider batch sedimentation2 of hard spheres for the samecapillary height and a Peclet number Pe = 0.01, comparableto that of the experimental system. The rather small change inheight shows that there is little or no significant sedimentationin a colloidal system without any polymer: we also verifiedthis fact using simulations in the regime where attractions be-tween particles are too weak to observe gelation.
In order to estimate a timescale for the sedimentation τsed,we heuristically fit the time-evolution of the interface heightwith an exponential decay,
h(t) = ht→∞ +hdrope−t/τsed (7)
where ht→∞ is the interface height at long times and hdrop =h(t = 0)−ht→∞ is the amount by which the gel-vapour inter-face is estimated to fall at long times.
Fits according to Eq. 7 are shown in Fig. 5. We emphasisethat this choice of fit is heuristic, and that the time-dependenceof h(t) is more complex than this simple exponential form,particularly for long times. Indeed we expect that ht→∞ mayoverestimate the interface height at long times, in the case offurther sedimentation on scales beyond those we access here1.We note that Eq. 7 fits the simulations better than the experi-ments, suggesting some difference in the mechanism of sedi-mentation between experiment and simulation. Note also thatthe exponential fits are more accurate when the attractive in-teractions are stronger and the amount of sedimentation is less.The initial sedimentation in the gels with stronger interactionsis rapid compared to weaker gels because the condensationis faster while the coarsening is slower. The crossing point
6 | 1–11

shown in the figure is believed to be purely coincidental.In Fig. 7 we show the sedimentation timescale τsed extracted
from the fits. The dashed line through the simulation data is astraight line fit (in the linear-log representation of Fig. 7). Thesolid line through the experimental data has the same slope asthe fit to the simulation data, but its intercept is fitted to theexperimental data. We find that the characteristic time of theexperiments τsed is approximately three times longer in the ex-periments compared to the simulations. Both experiments andsimulations show that as we increase the interaction strengththe sedimentation timescales undergo a small increase (a fac-tor two or three). Comparison with observations of bulk sys-tems, where the interaction strength has a profound impact onthe sedimentation timescale, especially in the case of delayedcollapse34, suggests that there may be a fundamental differ-ence in mechanism between these confined systems and bulkmeasurements. Certainly the behaviour shown in Fig. 6 wouldbe very different in bulk systems, where the system height ismuch greater than the gravitational length, so batch settlingunder gravity would lead to significant sedimentation even inthe absence of attractive forces between colloids.
The discrepancy in time scales between simulation and ex-periments in Fig. 7 has several possible origins. We excludefrom these our choice of interaction potential, because theMorse potential used in the simulation has previously beenshown to capture quite accurately the behaviour of this class ofexperimental system39,54,58, and the AO model also matchessuch experiments35. Moreoever, the Morse and AO systemsare also very similar to each other43, so we expect this aspectof the simulations to be reliable. Also, we exclude our choiceto mimic in the simulation the effects of continuous polydis-persity in the experimental system by the use of a binary mix-ture: this approximation (in the absence of significant crys-tallisation) seems unlikely to affect sedimentation time scalesin the way that we observe. One possible origin of the discrep-ancy is that hydrodynamic interactions are important: thesehave been shown to have considerable influence in the time-
Fig. 6 Sedimentation of the colloidal system in the absence ofpolymer. Here the Peclet number Pe = 0.01. Data determined frombatch sedimentation2.
Fig. 7 Sedimentation timescale τsed as a function of interactionstrength. Here we show both experimental and simulation data.Lines are fitted as described in the text.
evolution of gels in the absence of sedimentation38,39. A sec-ond possibility is that the well-mixed initial conditions usedin the simulations do not match the state of the colloidal sus-pensions at the beginning of the experiments. Finally we notethat the simulations consider a finite periodic system while theexperiments consider a small part of a much larger system. Ofcourse it would be desirable to consider larger systems but thisis not feasible due to the associated computational cost.
3.3 Structural behaviour upon coarsening
Having analysed the height of the gel as a function of time, wenow analyse the structure within the gel itself. This analysistakes two forms. First we consider the thickness of the net-work, which coarsens over time, as also happens in systemswhere sedimentation does not play an important role23,55,59.To do this we determine the chord length19. We then performa local structural analysis at the particle level on the simulationdata using the topological cluster classification60 and commonneighbour analysis61.
Chord length. — It is useful to estimate the typical sizeof the arms of the gel (Fig. 2). We achieve this by measuringa chord length, following19. In order to identify the arms ofthe gel, it is useful to measure the local density in the system.For a given point RRRα, we define a (non-normalised) measureof local density as nα = ∑i f (|rrri−RRRα|). Here f (r) = e−r2/`2
is a (non-normalised) Gaussian smoothing function, with ` =0.25σ. The quantity nα is large if point α is inside an arm ofthe gel, and small if the point is in the colloid-poor phase. Wetake a threshold n = 0.3, so Rα is in the gel if nα > 0.3 and inthe sol if nα < 0.3 (The distribution of n is bimodal so resultsdepend weakly on this threshold). We carry out this analysisfor a 3d cubic grid of points with spacing 0.5σ. A chord is astraight line that cuts through an arm of the gel. Chords mayhave any direction. As a representative sample, we identify
1–11 | 7

Fig. 8 Average chord length (mass weighted) measured (a) in the horizontal direction in the experimental system at state points correspondingto Fig. 5. (b) in the horizontal direction (perpendicular to the direction of gravity) (simulation), (c) in the vertical direction (the direction inwhich gravity acts) (simulation). Legend on right pertains to (b) and (c).
chords that run along the x, y, and z directions. We achievethis by running through the cubic grid (along the lattice axes)and identifying all sets of contiguous cells for which n > 0.3.We record the length of each chord.
Chords measured in the x and y directions are equivalent (asgravity acts in the z direction only), but we separate horizon-tal chords (aligned along the x and y directions) and verticalchords (aligned long z). To estimate the typical size of a hori-zontal chord, imagine choosing a particle at random and mea-suring the chord containing that particle. If the length of thejth horizontal chord is H j then the average length of a hori-zontal chord chosen in this way is
LmH =
∑ j H2j
∑ j H j(8)
where the superscript ‘m’ indicates that the average is mass-weighted. (That is, this average could equivalently be esti-mated by choosing particles at random and measuring the as-sociated chords. On the other hand, averaging the length ofa randomly chosen chord would give a different result. Themass-weighted average focusses attention on the chords whichcontain the majority of the particles and avoids numerical arte-facts associated with large numbers of small chords.)
This typical chord length is shown in Fig. 8 for both ex-perimental and simulation data. We see that at long times thechord lengths for the experimental systems are significantlylarger than those in the simulations. However, except for thisdifference in overall scale, the time-evolution in both experi-ment and simulation appears similar.
There are several possibilities for this observation. The firstis that the time-evolution is somehow different between theexperiments and simulations, perhaps due to hydrodynamicinteractions38,39. Alternatively, the lateral size of the simula-tion box could influence the size of the networks formed. Pre-vious simulation studies have emphasised the need for largesystems in order to avoid finite size effects on the gel struc-ture19,59. (Note however that the lateral system size L ≈ 28σ
is comparable with the range over which experimental datawas taken.)
Concerning the response of the system to increasing attrac-tion strength, we see that in the gel regime, increasing at-traction strength appears to lead to a suppression of domaingrowth in both experiments and simulations. This is in keep-ing with the literature55,59,62.
3.4 Local structural analysis
Gelation is accompanied by significant changes in local struc-ture54. We therefore probe the local structure in our simula-tions of sedimenting gels, for which we consider two methodsof analysis. The first is the Topological Cluster Classifica-tion (TCC)60 and the second is a common neighbour analysis(CNA)61. These measurements were performed as a functionof the height within the gel but we found little vertical varia-tion in the relative population of local structures (despite thedensity difference in the sedimentation profiles). In the fol-lowing, we therefore plot the population of local structuresaveraged across the whole system.
Topological cluster classification. — In this structural anal-ysis, isolated clusters of particles were identified that repre-sent energy minima of the Morse potential (with α = 25.0/σ).Then, bond networks of the simulated gel structures were cal-culated using a modified Voronoi construction, and all 3, 4 and5 membered shortest-path rings were identified within thesebond networks. We then set a tolerance for asymmetry in the4 membered rings, denoted fc. We set this to 0.85, consis-tent with previous work60. Then, local structures within thebond network that are topologically equivalent to the origi-nal energy minima were identified and enumerated. The clus-ters identified using the TCC are illustrated in Fig. 9, as arethe proportions of particles that participate in clusters of eachtype. Since particles may be identified in more than one typeof structure, the total across different types may exceed one.
Common neighbour analysis. — The common neighbour
8 | 1–11
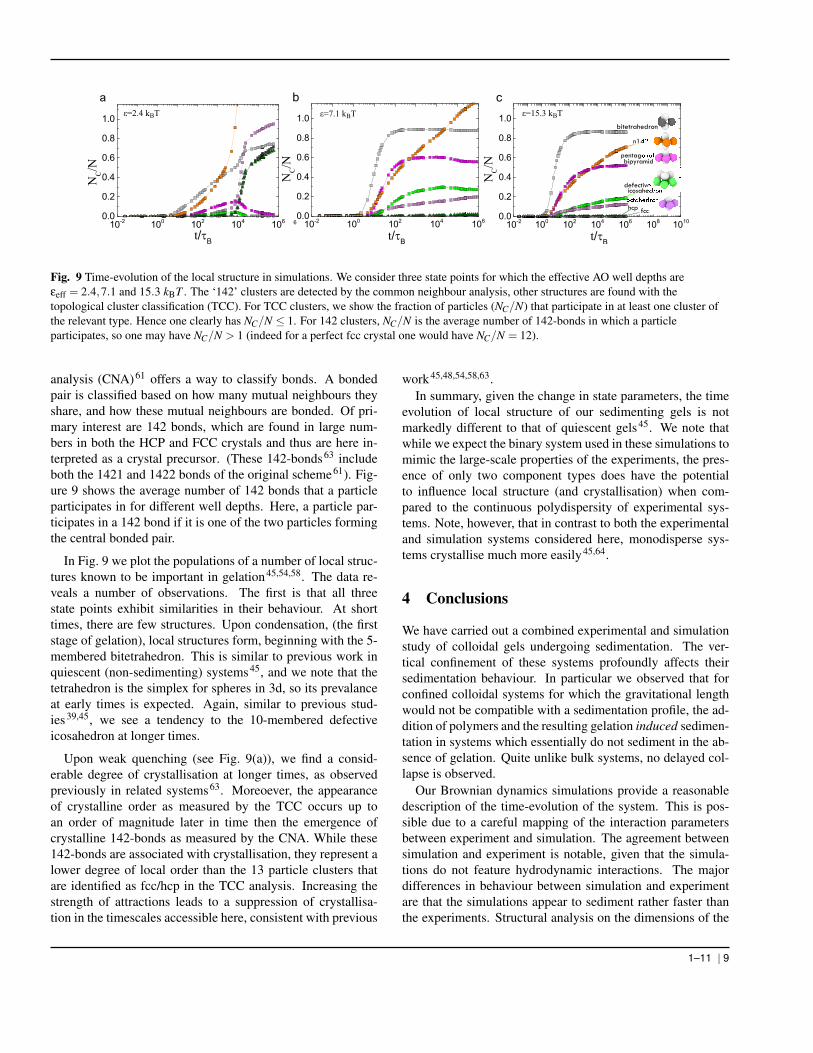
Fig. 9 Time-evolution of the local structure in simulations. We consider three state points for which the effective AO well depths areεeff = 2.4,7.1 and 15.3 kBT . The ‘142’ clusters are detected by the common neighbour analysis, other structures are found with thetopological cluster classification (TCC). For TCC clusters, we show the fraction of particles (NC/N) that participate in at least one cluster ofthe relevant type. Hence one clearly has NC/N ≤ 1. For 142 clusters, NC/N is the average number of 142-bonds in which a particleparticipates, so one may have NC/N > 1 (indeed for a perfect fcc crystal one would have NC/N = 12).
analysis (CNA)61 offers a way to classify bonds. A bondedpair is classified based on how many mutual neighbours theyshare, and how these mutual neighbours are bonded. Of pri-mary interest are 142 bonds, which are found in large num-bers in both the HCP and FCC crystals and thus are here in-terpreted as a crystal precursor. (These 142-bonds63 includeboth the 1421 and 1422 bonds of the original scheme61). Fig-ure 9 shows the average number of 142 bonds that a particleparticipates in for different well depths. Here, a particle par-ticipates in a 142 bond if it is one of the two particles formingthe central bonded pair.
In Fig. 9 we plot the populations of a number of local struc-tures known to be important in gelation45,54,58. The data re-veals a number of observations. The first is that all threestate points exhibit similarities in their behaviour. At shorttimes, there are few structures. Upon condensation, (the firststage of gelation), local structures form, beginning with the 5-membered bitetrahedron. This is similar to previous work inquiescent (non-sedimenting) systems45, and we note that thetetrahedron is the simplex for spheres in 3d, so its prevalanceat early times is expected. Again, similar to previous stud-ies39,45, we see a tendency to the 10-membered defectiveicosahedron at longer times.
Upon weak quenching (see Fig. 9(a)), we find a consid-erable degree of crystallisation at longer times, as observedpreviously in related systems63. Moreoever, the appearanceof crystalline order as measured by the TCC occurs up toan order of magnitude later in time then the emergence ofcrystalline 142-bonds as measured by the CNA. While these142-bonds are associated with crystallisation, they represent alower degree of local order than the 13 particle clusters thatare identified as fcc/hcp in the TCC analysis. Increasing thestrength of attractions leads to a suppression of crystallisa-tion in the timescales accessible here, consistent with previous
work45,48,54,58,63.In summary, given the change in state parameters, the time
evolution of local structure of our sedimenting gels is notmarkedly different to that of quiescent gels45. We note thatwhile we expect the binary system used in these simulations tomimic the large-scale properties of the experiments, the pres-ence of only two component types does have the potentialto influence local structure (and crystallisation) when com-pared to the continuous polydispersity of experimental sys-tems. Note, however, that in contrast to both the experimentaland simulation systems considered here, monodisperse sys-tems crystallise much more easily45,64.
4 Conclusions
We have carried out a combined experimental and simulationstudy of colloidal gels undergoing sedimentation. The ver-tical confinement of these systems profoundly affects theirsedimentation behaviour. In particular we observed that forconfined colloidal systems for which the gravitational lengthwould not be compatible with a sedimentation profile, the ad-dition of polymers and the resulting gelation induced sedimen-tation in systems which essentially do not sediment in the ab-sence of gelation. Quite unlike bulk systems, no delayed col-lapse is observed.
Our Brownian dynamics simulations provide a reasonabledescription of the time-evolution of the system. This is pos-sible due to a careful mapping of the interaction parametersbetween experiment and simulation. The agreement betweensimulation and experiment is notable, given that the simula-tions do not feature hydrodynamic interactions. The majordifferences in behaviour between simulation and experimentare that the simulations appear to sediment rather faster thanthe experiments. Structural analysis on the dimensions of the
1–11 | 9

gel network suggests that the experiments are rather coarser atlong times. This may be related to some intrinsic difference inthe dynamics, or to a finite size effect in the simulations, or toincomplete homogenisation of the experimental system priorto gelation.
We have also considered the local structure of the simu-lated gels. We find that this is rather similar to the structuralevolution found in quiescent (non-sedimenting) systems. Re-calling from Fig. 3(b) that the system clearly condenses into apercolating network before any significant sedimentation hasoccurred, it seems that the main changes in the local structureof the system occur on short time scales that are decoupledfrom sedimentation. Figure 9 is also consistent with this inter-pretation.
Finally, we note that simulation studies such as these mightprovide a basis by which coarse-grained theoretical mod-els might be developed, which could potentially tackle trulymacroscopic systems. This would be valuable since macro-scopic phenomena such as delayed gel collapse34 are not ac-cessible in these small (confined) systems, and are thereforebeyond the reach of direct simulation. For this reason, de-velopment of such coarse-grained models would form a ma-jor step forward in the understanding and modelling of theseimportant materials. A most interesting outcome of such anapproach would be the successful prediction of sedimentationrates several orders of magnitude faster than those observedhere, as observed in delayed collapse34. It is possible that suchstudies would be helped by larger scale simulations than thosewe have been able to perform here. Those we have carried outlie at the limit of our resources. We carried out smaller scalesimulations with a reduced height and saw identical behaviour,save that the height was scaled according to the system size.
Acknowledgments
Peter Crowther is gratefully acknowledged for kind assistancewith the image data analysis. CPR acknowledges the RoyalSociety, the Japan Society of the Promotion of Science (JSPS)and Kyoto University SPIRITS fund for financial support andEPSRC grant code EP/H022333/1 for the provision of a con-focal microscope. AR is grateful to the Malaysia’s Ministry ofEducation (MOE) for the financial support and thanks R. Pin-chaipat for the assistance in data analysis. CPR, JEH and FTgratefully acknowldge the European Research Council (ERCconsolidator grant NANOPRS, project number 617266) CJFand RLJ acknowledge support from the UK Engineering andPhysical Science Research Council (EPSRC) through grantsEP/I003797/1 and EP/L001438/1.
References
1 R. Piazza, S. Buzzaccaro and E. Secchi, J Phys.: Condens Matter, 2012,24, 284109.
2 W. B. Russel, D. Saville and W. Schowalter, Colloidal Dispersions, Cam-bridge Univ. Press, Cambridge,, 1989.
3 R. Piazza, T. Bellini and V. Degiorgio, Phys. Rev. Lett., 1993, 25, 4267–4270.
4 C. Royall, D. Aarts and H. Tanaka, J. Phys.: Condens. Matter, 2005, 17,S3401–S3408.
5 S. Buzzaccaro, R. Rusconi and R. Piazza, Phys. Rev. Lett., 2007, 99,098301.
6 M. Leocmach, R. C. P. and H. Tanaka, EuroPhys. Lett., 2010, 89, 38006.7 P. Segre, H. E. and P. Chaikin, Phys. Rev. Lett., 1997, 79, 2574–2577.8 P. N. Segre, F. Liu, P. Umbanhowar and D. A. Weitz, Nature, 2001, 409,
594–597.9 J. T. Padding and A. A. Louis, Phys. Rev. Lett., 2004, 93, 220601.
10 A. Wysocki, C. P. Royall, R. Winkler, G. Gompper, H. Tanaka, A. vanBlaaderen and H. Lowen, Soft Matter, 2009, 5, 1340–1344.
11 A. Moncho Jorda, A. A. Louis and J. T. Padding, Phys Rev Lett, 2010,104, 068301.
12 C. Wysocki, A. Rath, A. V. Ivlev, K. R. Sutterlin, H. M. Thomas, S. Khra-pak, S. Zhdanov, V. E. Fortov, A. M. Lipaev, V. I. Molotkov, O. F. Petrov,H. Lowen and G. E. Morfill, Phy. Rev. Lett., 2010, 105, 045001.
13 W. C. K. Poon, J. Phys.: Condens. Matter, 2002, 14, R859–R880.14 N. A. M. Verhaegh, D. Asnaghi, H. N. W. Lekkerkerker, M. Giglio and
L. Cipelletti, Physica A, 1997, 242, 104–118.15 H. Tanaka, Phys. Rev. E, 1999, 59, 6842.16 S. Manley, H. Wyss, K. Miyazaki, J. Conrad, V. Trappe, L. Kaufman,
D. Reichman and D. Weitz, Phys. Rev. Lett., 2005, 95, 238302.17 P. J. Lu, E. Zaccarelli, F. Ciulla, A. B. Schofield, F. Sciortino and D. A.
Weitz, Nature, 2008, 435, 499–504.18 E. Zaccarelli, P. J. Lu, F. Ciulla, D. A. Weitz and F. Sciortino, J Phys.:
Condens Matter, 2008, 20, 494242.19 V. Testard, L. Berthier and W. Kob, Phys. Rev. Lett., 2011, 106, 125702.20 P. Chaudhuri and L. Berthier, ArXiV, 2016, 1605.09770.21 M. Dijkstra, R. van Roij and R. Evans, J. Chem. Phys, 2000, 113, 4799–
4807.22 C. Likos, M. Schmidt, H. Lowen, M. Ballauff, D. Potschke and P. Lindner,
Macromolecules, 2001, 34, 2914–2920.23 R. Zia, B. Landrum and W. B. Russel, J. Rhe, 2014, 58, 1121–1157.24 E. Zaccarelli, J. Phys.: Condens. Matter, 2007, 19, 323101.25 A. A Coniglio, L. De Arcangelis, E. Del Gado, A. Fierro and N. Sator, J.
Phys.: Condens. Matter, 2004, 16, S4831.26 L. Ramos and L. Cipelletti, Journal of Physics: Condensed Matter, 2005,
17, R253–R285.27 S. Manley, J. M. Skotheim, L. Mahadevan and D. A. Weitz, Phys Rev Lett,
2005, 94, 218302.28 R. MacBean, in Packaging and the Shelf Life of Yogurt, CRC Press, 2009,
pp. 143–156.29 B. Ruzicka, E. Zaccarelli, L. Zulian, R. Angelini, M. Sztucki, A. Mous-
said, T. Narayanan and F. Sciortino, Nature Materials, 2010, 10, 56–60.30 H. Tanaka, Faraday Discuss, 2013, 167, 9–76.31 R. Piazza, Rep. Prog. Phys., 2014, 77, 056602.32 L. Starrs, W. C. K. Poon, D. J. Hibberd and M. M. Robins, J Phys.: Con-
dens Matter, 2002, 14, 2485.33 S. Buzzaccaro, E. Secchi, G. Brambilla, R. Piazza and C. L., J. Phys.:
Condens. Matter, 2012, 24, 284103.34 P. Bartlett, L. Teece and M. A. Faers, Phys. Rev. E, 2012, 85, 021404.35 C. P. Royall, A. A. Louis and H. Tanaka, J. Chem. Phys., 2007, 127,
044507.36 M. Schmidt, C. P. Royall, J. Dzubiella and A. van Blaaderen, J. Phys.:
10 | 1–11

Condens. Matter, 2008, 20, 494222.37 C. Perez, A. , Moncho-Jorda, R. Hidalgo-Alvarez and H. Casanova,
Molecular Physics, 2015, 113, 2857–3597.38 A. Furukawa and H. Tanaka, Phys. Rev. Lett., 2010, 104, 245702.39 C. P. Royall, J. Eggers, A. Furukawa and H. Tanaka, Phys Rev Lett, 2015,
114, 258302.40 R. Harich, T. Blythe, M. Hermes, E. Zaccarelli, A. Sederman, L. F. Glad-
den and W. Poon, Soft matter, 2016, 12, 4300–4308.41 A. Vrij, Pure Appl. Chem., 1976, 48, 471–483.42 M. Dijkstra, J. M. Brader and R. Evans, J. Phys.: Condens. Matter, 1999,
11, 10079–10106.43 J. Taffs, A. Malins, S. R. Williams and C. P. Royall, J. Phys.: Condens.
Matter, 2010, 22, 104119.44 H. N. W. Lekkerkerker, W. C. K. Poon, P. N. Pusey, A. Stroobants and
P. B. Warren, Europhys. Lett., 1992, 20, 559–564.45 C. P. Royall and A. Malins, Faraday Discuss., 2012, 158, 301–311.46 F. Lo Verso, R. L. C. Vink, D. Pini and L. Reatto, Phys. Rev. E, 2006, 73,
061407.47 C. P. Royall, D. G. A. L. Aarts and H. Tanaka, Nature Physics, 2007, 3,
636–640.48 S. Taylor, R. Evans and C. P. Royall, J. Phys.: Condens. Matter, 2012,
24, 464128.49 http://lammps.sandia.gov.50 M. G. Noro and D. Frenkel, J. Chem. Phys., 2000, 113, 2941–2944.51 J.-P. Hansen and I. Macdonald, Theory of Simple Liquids, Academic, Lon-
don, 1976.52 G. Berry, J. Chem. Phys., 1966, 44, 4550–4564.53 E. Zaccarelli and Poon, Proc. Nat. Acad. Sci., 2009, 106, 15203–15208.54 C. P. Royall, S. R. Williams, T. Ohtsuka and H. Tanaka, Nature Materials,
2008, 7, 556.55 I. Zhang, C. P. Royall, M. A. Faers and P. Bartlett, Soft Matter, 2013, 9,
2076–2084.56 E. Kilfoil, M.and Pashkovski, J. Masters and D. A. Weitz, Phil. Trans.,
2003, 361, 753–766.57 E. Secchi, S. Buzzaccaro and R. Piazza, Soft Matter, 2014, 10, 5296–
5310.58 C. P. Royall, S. R. Williams, T. Ohtsuka and T. H., American Institute of
Physics Conference Proceedings, 2008, 982, 97.59 V. Testard, L. Berthier and W. Kob, J. Chem. Phys, 2014, 140, 164502.60 A. Malins, S. R. Williams, J. Eggers and C. P. Royall, J. Chem. Phys.,
2013, 139, 234506.61 J. D. Honeycutt and H. C. Andersen, J. Phys. Chem., 1987, 91, 4950–
4963.62 L. J. Teece, M. A. Faers and P. Bartlett, Soft Matter, 2011, 7, 1341–1351.63 D. Klotsa and R. L. Jack, Soft Matter, 2011, 7, 6294–6303.64 J. Doye and L. Meyer, Physical Review Letters, 2005, 95, 1–4.
1–11 | 11